 Nelson Tull1
 Andrew J. Moodie
 Paola Passalacqua
- 1Maseeh Department of Civil, Architectural and Environmental Engineering, Center for Water and the Environment, The University of Texas at Austin, Austin, TX, United States
- 2Department of Geography, Texas A&M University, College Station, TX, United States
The morphology of river levees and floodplains is an important control on river-floodplain connectivity within a river system under sub-bankfull conditions, and this morphology changes as a river approaches the coast due to backwater influence. Floodplain width can also vary along a river, and floodplain constrictions in the form of bluffs adjacent to the river can influence inundation extent. However, the relative controls of backwater-influenced floodplain topography and bluff topography on river-floodplain connectivity have not been studied. We measure discharge along the lower Trinity River (Texas, USA) during high flow to determine which floodplain features are associated with major river-floodplain flow exchanges. We develop a numerical model representing the transition to backwater-dominated river hydraulics, and quantify downstream changes in levee channelization, inundation, and fluxes along the river-floodplain boundary. We model passive particle transport through the floodplain, and compute residence times as a function of location where particles enter the floodplain. We find that bluff topography controls flow from the floodplain back to the river, whereas levee topography facilitates flow to the floodplain through floodplain channels. Return flow to the river is limited to locations just upstream of bluffs, even under receding flood conditions, whereas outflow locations are numerous and occur all along the river. Residence times for particles entering the floodplain far upstream of bluffs are as much as two orders of magnitude longer than those for particles entering short distances upstream of bluffs. This study can benefit floodplain ecosystem management and restoration plans by informing on the key locations of lateral exchange and variable residence time distributions in river-floodplain systems.
1 Introduction
River floodplains are often associated with flood hazard zones, but when preserved and healthy, they represent critical ecosystems and landforms as well (Ward et al., 1999; Melack and Forsberg, 2001; Kondolf et al., 2006; Roley et al., 2012; Noe et al., 2013; Kufel and Leśniczuk, 2014). Seasonal and storm-driven inundation from the river brings nutrients to floodplain ecosystems as solutes and particulates attached to suspended sediment, and widespread inundation provides a wetland environment that stores large amounts of carbon (Battin et al., 2009; Aufdenkampe et al., 2011; Mitsch et al., 2013; Sutfin et al., 2016). The deposition of sediment in floodplain ponds and on river levees is another crucial component of nutrient and organic carbon transport into the floodplain, where saturated soils and long-term inundation enable processing and sequestering of these solutes (Walling et al., 1998; Walling and Owens, 2003; Noe and Hupp, 2005, 2009). Furthermore, floodplains provide both flood attenuation and a record of flood history through periodic sediment deposition (Shen et al., 2015).
While these processes are important components of a healthy river environment, they depend on a river bank structure that allows water, solids, and solutes to flow between the river and floodplain, particularly in the absence of overbank inundation. Gaps in the levee, such as lateral floodplain channels, are an example of system “structural connectivity,” which has been defined as the extent to which adjacent landscape units (e.g., a river and its floodplain) are physically linked with one another (Wainwright et al., 2011; Bracken et al., 2013; Passalacqua, 2017; Wohl et al., 2019). To varying degrees, lateral floodplain channels can be conduits for mass and momentum exchange between the river and floodplain even when stage is less than bankfull (Byrne et al., 2019; Czuba et al., 2019; Lindroth et al., 2020; Tull et al., 2022; van der Steeg et al., 2023). We consider fluxes through these landscape pathways as examples of “functional connectivity,” which is defined in the context of the present study as the movement of water, sediment, and solutes between adjacent landscape units that are connected structurally (Wainwright et al., 2011; Bracken et al., 2013; Passalacqua, 2017; Wohl et al., 2019). The extent to which a system is connected can be a major control on flood attenuation and the development of wetland conditions that store nutrients and carbon (Tockner et al., 1999; Hughes et al., 2001; Thoms, 2003; Welti et al., 2012; Harvey and Gooseff, 2015; Gurnell et al., 2016; Covino, 2017).
The relationship between hydrological connectivity and ecosystem health in floodplain systems has been established, and studies have shown how complex floodplain topography can lead to downstream variability in hydrological connectivity in both fluvial environments (Croke et al., 2013; Byrne et al., 2019) and deltaic environments (Hiatt and Passalacqua, 2015; Wright et al., 2022a). However, variability in hydrological river-floodplain connectivity as a coastal river transitions from a fluvial to a deltaic environment has not been evaluated, even though a river's topographic and hydraulic characteristics may change dramatically under the backwater influence. Within the backwater reach of the Trinity River (Texas, USA; Figure 1), for example, the difference in water surface elevations during low and high flows is less than in the upstream reach, and the normal water surface elevation approaches the average bank elevation closer to the delta (Smith et al., 2020; Hassenruck-Gudipati et al., 2022). The river also exhibits changes in channel and bank morphology under the backwater influence, with a dramatic increase in levee size (Smith et al., 2020; Hassenruck-Gudipati et al., 2022) and reduction in channel migration rates and associated morphological features in the downstream direction (Mason and Mohrig, 2019; Smith et al., 2020). So although changes in topography through a backwater transition have been studied, we have a very limited understanding of how those topographic changes translate to functional river-floodplain connectivity.
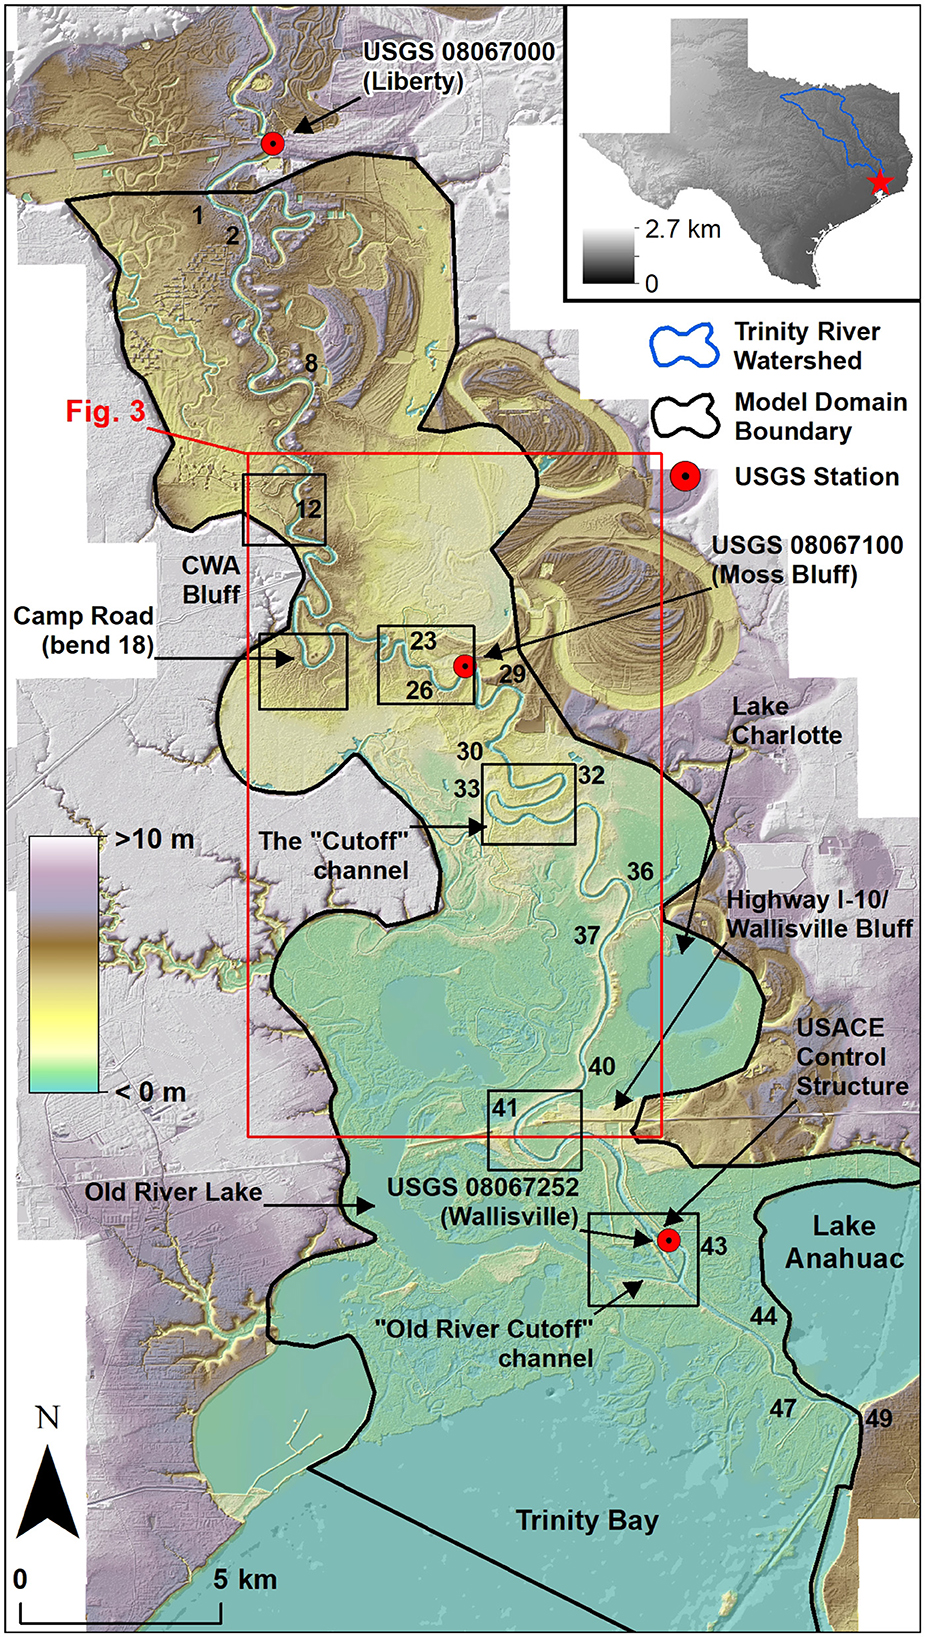
Figure 1. Study region on the lower Trinity River. The labeled locations refer to locations that are referenced in the manuscript. Numbers along the river refer to bend (zone) numbers that are referenced in the manuscript. Small black boxes represent the extents of the panels shown in Figure 2.
Variations in floodplain width can also influence river-floodplain connectivity, particularly inundation extent (Croke et al., 2013). River reaches with wide floodplains generally provide more space for expansive inundation, while reaches that are bounded by bluffs or terraces have greater channel capacity that compensates for the reduced floodplain inundation. Floodplain expansions and contractions along a reach are important controls on the development of floodplain channels (David et al., 2017), organic carbon storage in floodplains (Wohl et al., 2018), sediment connectivity between the river and the floodplain (Croke et al., 2013), sediment connectivity between the floodplain and upland tributary basins (Rathburn et al., 2018), and channel mobility (Mertes et al., 1996). However, the relationship between bluff topography and hydrological river-floodplain connectivity has not been quantified.
Downstream changes in river hydraulics and floodplain topography may have an impact on the time water spends in the floodplain, commonly referred to as the “floodplain residence time.” Significant removal of nutrients is dependent on floodplain residence times (Tockner et al., 1999; Yu et al., 2006; Noe and Hupp, 2009; Noe et al., 2013; Cheng and Basu, 2017; Hiatt et al., 2018), and although there is limited guidance in the literature on optimal residence times for nutrient removal in wetlands, longer surface-water residence times can drastically increase the productivity of these environments (Seitzinger et al., 2006; Sheibley et al., 2006; Kaushal et al., 2008). Residence times, however, can be difficult to quantify due to complex floodplain geometry, topography, and flow patterns. Tracer studies are a possibility, but they are typically performed only in a small area of interest with unique characteristics, such as a constructed wetland (Holland et al., 2004) or delta island (Hiatt and Passalacqua, 2015). Similarly, hydrodynamic models that incorporate particle tracking have been used to estimate floodplain residence times, but those models have used either relatively coarse spatial resolution (Helton et al., 2014; Hiatt et al., 2018) or focused on a localized floodplain domain (Tull et al., 2022). A comprehensive assessment of residence time distributions across river reaches spanning the backwater length has not been performed.
This study combines discharge data collected on the lower Trinity River and a calibrated hydrodynamic model to analyze how lateral water exchange and floodplain inundation patterns change as the river approaches its delta. We run steady flow models at various discharges and quantify how hydrological connectivity changes along the length of the river reach. We utilize a Lagrangian particle routing model to track flow paths through the floodplain, including the origins, termini, and travel times for all particles, and describe how those flow characteristics change with distance downstream. The results of this study characterize topographic controls on hydrological connectivity along a backwater transition and within a valley containing several bluffs along the river. Understanding this transition is critical for understanding ecological and geomorphic processes and water resources in both riverine and deltaic environments.
2 Study area: the lower Trinity River
Our study reach on the lower Trinity River includes 65 river kilometers (rkm) between its mouth at Trinity Bay and the city of Liberty, TX in the upstream reach (Figure 1). We chose this study site because upstream of Wallisville, TX it is mostly free of engineered modifications such as containment levees and revetments and the floodplain is largely undeveloped; thus, the floodplain topography is the result of natural meandering and flooding processes. Furthermore, the geomorphology of the lower Trinity River has been well-studied (Phillips et al., 2004, 2005; Phillips and Slattery, 2007; Phillips, 2010; Mason and Mohrig, 2018; Smith et al., 2020; Hassenruck-Gudipati et al., 2022). The transition to fully backwater-dominated flow occurs just upstream of river bend 12 (as depicted in Figure 1). Upstream of this point, the river bend migration rates and point bar sizes increase as the river transitions to a quasi-normal flow reach. The floodplain within this region consists of geomorphic features associated with active migration, such as oxbow lakes and relict channels. Natural river levees grow in size within the backwater region, as do the floodplain channels that move through them. Farther downstream, the presence of several large floodplain lakes marks the transition to a coastal wetland environment. Floodplain width is highly variable throughout the study region, with some deep floodplain basins up to 7 km wide, while in other locations topographic bluffs or terraces exist adjacent to the river with no floodplain present at all (Figure 1).
Within the study reach are three USGS gaging stations located at Liberty (USGS 08067000), Moss Bluff (USGS 08067100), and Wallisville (USGS 08067252). Discharge data derived from a rating curve are available at the Liberty gage, while the other two stations measure river stage and several other parameters. The Wallisville gage is located adjacent to a run-of-river dam and gate (Figure 2F) that are operated by the U.S. Army Corps of Engineers (USACE) for the purpose of preventing saltwater intrusion into the Trinity River National Wildlife Refuge upstream. The gate is closed only during low flows, and remains open during periods of higher flow, including all flow conditions within the scope of this study. The USACE compound contains embankments on either side of the river that extend upstream about 6 km until the highway I-10 bridge, where there is a bluff on the east side of the river that we refer to as “Wallisville Bluff” (Figures 2E, F). The Moss Bluff gage is adjacent to a set of pumps and an elevated canal that draws water from the river for agricultural use (Figure 2C), where past flow measurements indicate an average withdrawal rate of 3 m3/s (Lucena and Lee, 2022). Between Moss Bluff and Liberty is another pump station operated by the Coastal Water Authority (CWA) situated on a bluff along the river, which we refer to as “CWA Bluff,” that withdraws water at an average rate of 26 m3/s (USGS 08067070). The river hydraulics within the study area are affected by tides with amplitudes in Trinity Bay between 15 and 50 cm. Upstream of the USACE compound at Wallisville, however, tidal influence is limited by river discharge during high-flow conditions and by the control of the USACE gate during low-flow conditions. The tidal signal is only detectable at the Moss Bluff gage under low-flow conditions. Even though the USACE gate remains closed during low flows, the tidal signal reaches the Trinity River via the Old River Lake and the connected network of floodplain channels to the west of the river, including the “Cutoff” floodplain channel (Figures 2D, F).
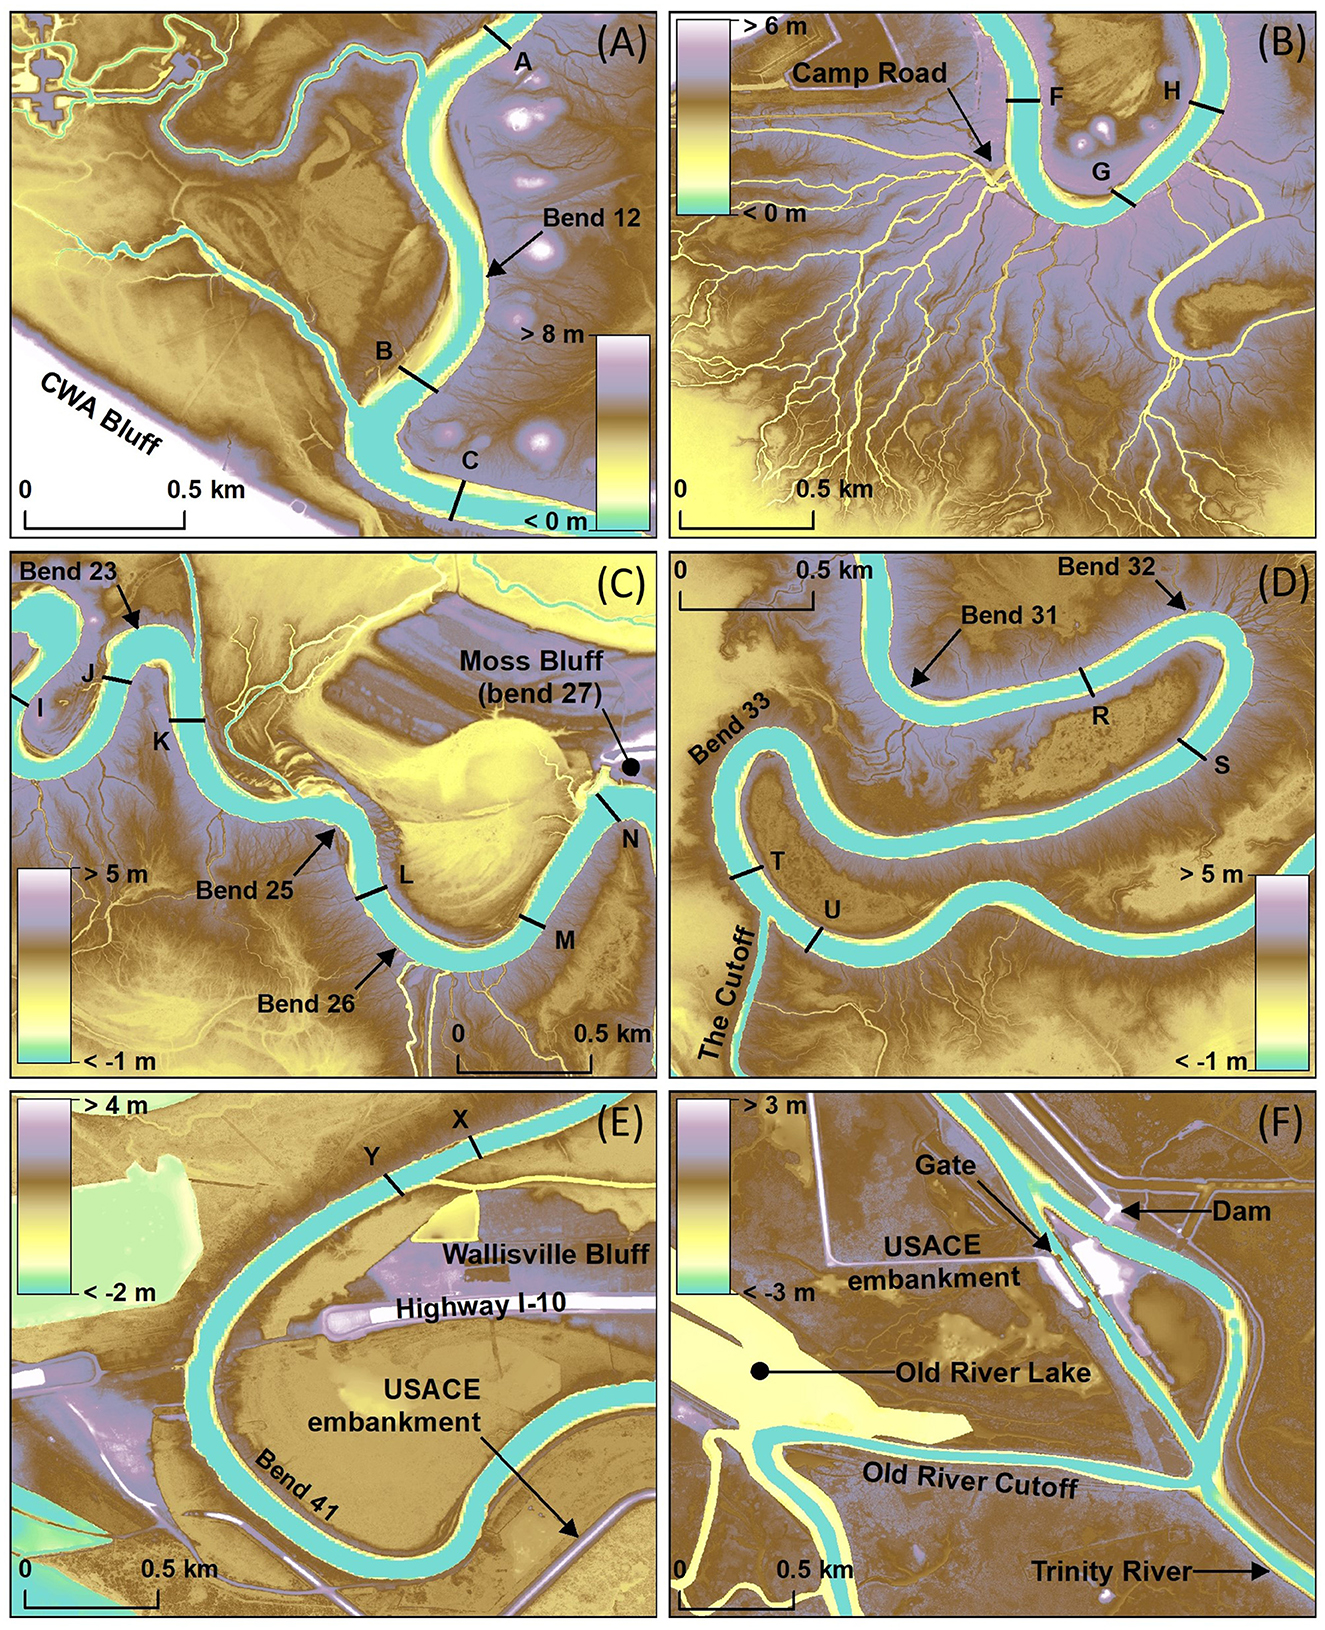
Figure 2. Elevation maps for locations within the study area that are referenced frequently in the manuscript. (A) Area upstream of CWA Bluff, (B) large network of floodplain channels at Camp Road, (C) area upstream of Moss Bluff, (D) highly sinuous bend and location of the “Cutoff” channel, (E) Wallisville Bluff and the upstream end of the USACE embankments, and (F) USACE structures and the “Old River Cutoff” channel. Locations of each panel are shown in Figure 1, from (A) upstream to (F) downstream. Capital letters shown along the river are labels for the ADCP transect locations shown in Figure 3 and data shown in Figure 5.
The river upstream and downstream of the USACE embankment and control structure is fundamentally different. We consider the Trinity River delta to begin downstream of the control structure. There is a particularly large distributary to the main channel called the “Old River Cutoff” that is located just past the end of the USACE embankment (Figure 2F), and this channel connects the Trinity River with the floodplain lakes to the west. The geometry of the delta is somewhat atypical, as the left bank of the main channel is much more confined than the right bank due to the presence of Lake Anahuac (a water storage reservoir); all of the delta distributaries are located along the right bank. The USACE compound between Wallisville Bluff and the Old River Cutoff is a significant discontinuity of the Trinity river, and is relevant to our study that seeks to quantify topographic and hydraulic changes from the normal flow reach to the delta. Thus, our analysis considers this compound to be the delineation between the river and its delta, and our results are discussed with its influence and this delineation in mind.
3 Methods
3.1 Collecting river discharge data
On 13 April 2023 we measured river discharge at 25 transects on the Trinity River with an Acoustic Doppler Current Profiler (ADCP), to understand where and how much lateral flow exchange occurs along the river and how the topography controls those flow exchanges (Figure 3). We collected measurements using RiverRay ADCP from Teledyne Marine mounted to the bow of the R/V Scott Petty, a research vessel operated by the University of Texas Institute for Geosciences. We collected and processed the data using the WinRiver II software. The start and end positions of each transect were located on average about 10 m from the adjacent river bank, to avoid getting stuck in vegetation and shallow waters. We used a Laser Rangefinder to estimate the horizontal distance from the end of the transect to the river bank. We accounted for each missing edge of the cross section using the triangular extrapolation method from WinRiver, and used the power law method from WinRiver to estimate the discharge in the top and bottom layers of the cross section where the ADCP is not able to measure velocities. We took between two and four transect measurements at each location. At transects where three measurements were taken, we averaged together the two measurements taken in the same direction prior to averaging with the third measurement, to remove directional bias.
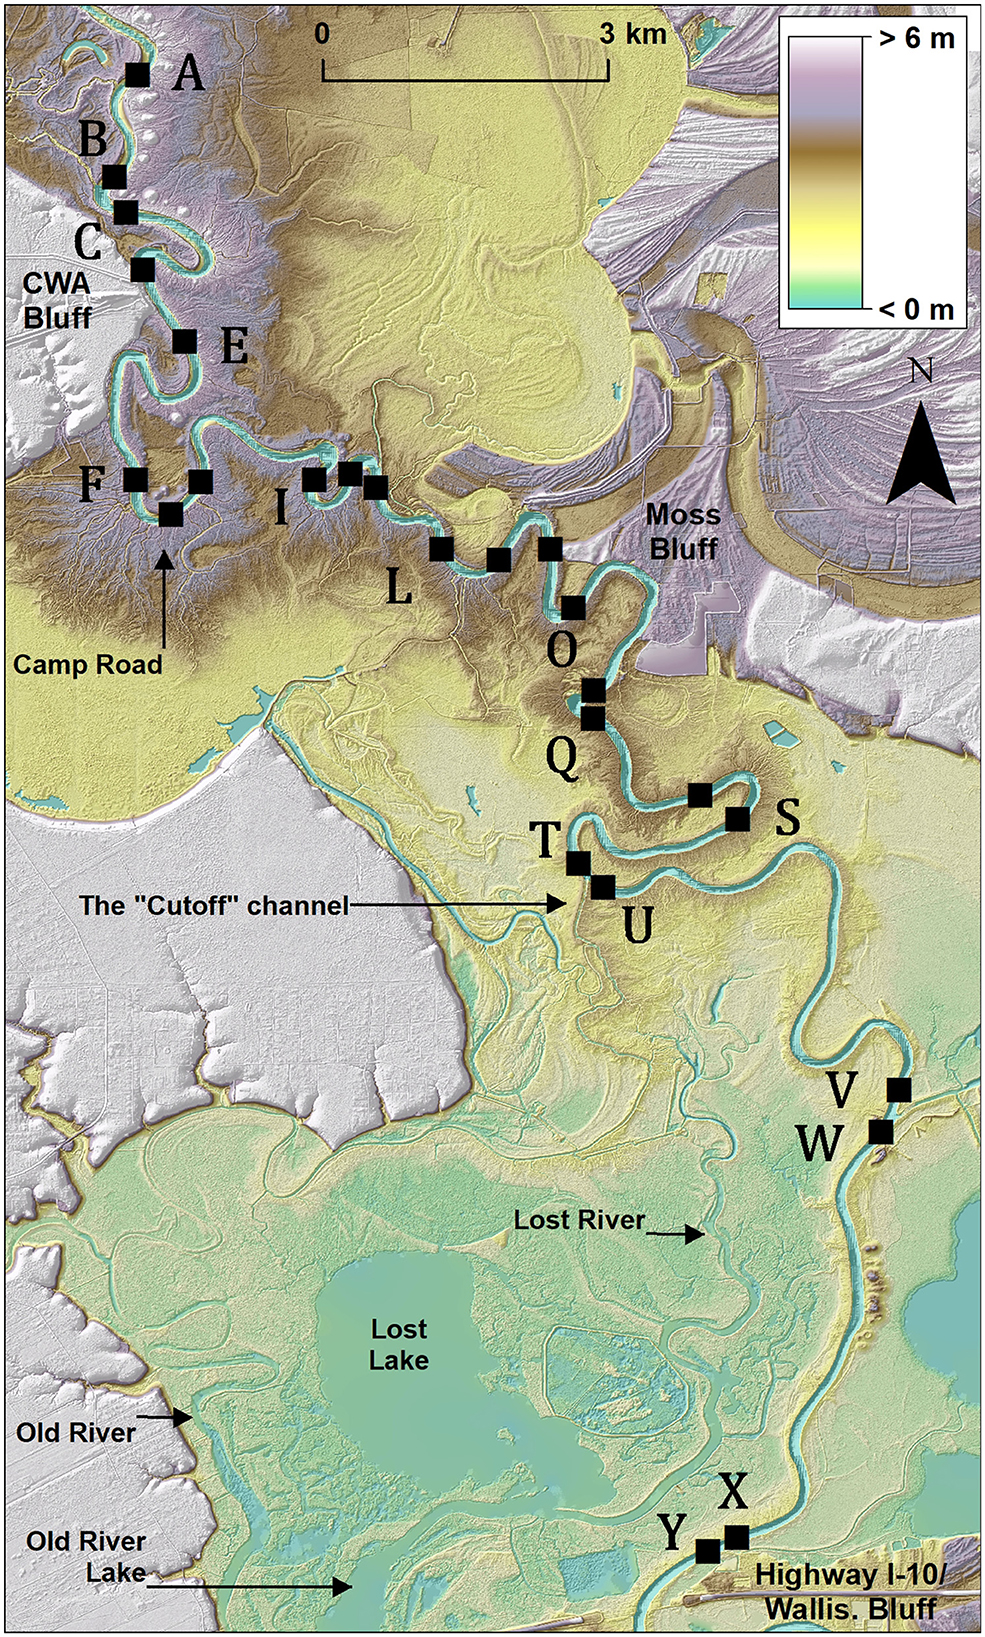
Figure 3. Location of ADCP transects. Labels are in order from A to Y (25 total transects) from upstream to downstream, as shown in Figure 5.
We positioned transects upstream and downstream of each location where flow exchange between the river and the floodplain was evident or where we expected floodplain channel locations based on visual inspection of lidar data (Figure 3). We measured the first transect (transect A, Figure 2A, 11 rkm downstream of Liberty) upstream of CWA Bluff at 10:50 CDT (all times are local, central daylight time), and the final transect (transect Y, Figure 2E, 47 rkm downstream of Liberty) just upstream of Wallisville Bluff at 16:45 CDT. River flows were declining over the course of the day from an earlier peak of 800 m3/s at the Liberty gage on 10 April. During the six hours it took to collect measurements from transect A to transect Y, the discharge measured at the Liberty gage had fallen from 515 to 467 m3/s.
3.2 Numerical model development
We used the Australian National University and Geosciences Australia (ANUGA) hydrodynamic model to quantify functional connectivity along the river (Nielsen et al., 2005; Mungkasi and Roberts, 2011, 2013). ANUGA is an open-source model that uses a finite-volume method to solve the shallow-water equations on unstructured meshes. ANUGA was originally developed for coastal applications such as tsunami modeling and has been validated for such applications (Nielsen et al., 2005; Mungkasi and Roberts, 2013). In recent years, ANUGA has been used for delta and coastal river systems along the U.S. Gulf Coast and other similar applications (Tull et al., 2022; Wright et al., 2022a,b; Hariharan et al., 2023). Additional information on this model and its application to the Trinity River can be found in Tull et al. (2022).
We calibrated the numerical model using the discharge data collected during the April 2023 campaign and local USGS gage data. We validated the model using discharge data collected during a separate campaign on 11–12 May 2022 at various locations between CWA Bluff and Wallisville Bluff (Supplementary Figures S1, S2), under lower flow conditions than those of April 2023. A description of the May 2022 data and the calibration (Supplementary Figure S3) and validation (Supplementary Figure S4) processes and results can be found in the Supporting Information.
The model domain for the present study extends from just south of Liberty, TX at the upstream end to Trinity Bay at the downstream end (Figure 1). The side boundaries of the domain represent the valley walls. The average mesh resolution, or average mesh element edge length, in the main channel is about 18 m, while along the breakline representing the river-floodplain boundary the resolution is 12 m. In general, the average mesh resolution in the floodplain is 50 m. However, along floodplain channels and lake margins, we increased the mesh resolution to capture the geometry of those features. Floodplain channels contain mesh elements whose sizes are commensurate with the width of the channels they represent, such that there are at least two elements across the width of each channel. In Trinity Bay, we relaxed the mesh resolution to 200 m. The final mesh contains 670,826 elements and 336,952 nodes. We provide a full description of the mesh development process, including the detection and extraction of floodplain features using elevation data, in the Supporting Information.
For the model elevation data, we used a Digital Elevation Model (DEM) with 1-m resolution, consisting of a combination of lidar and surveyed bathymetry; more information on the acquisition and processing of the DEM can be found in Tull et al. (2022). We modified the DEM to improve the bathymetry of certain channels in the system, namely those where bathymetry data were unavailable due to the presence of water during lidar collection (we provide a description of the modifications made to the DEM during the model calibration process in the Supporting Information). We interpolated the DEM to mesh element centroids via a least-squares fit. We applied friction forcing to the domain based on our calibration of the model using the high-flow conditions measured in April 2023, with a Manning's n value of 0.02 in the main channel, lakes, and bay, a value of 0.05 in floodplain channels, and a value of 0.1 over the rest of the floodplain. The upstream and side boundaries of the domain are no-flow boundaries. We modeled the downstream boundary as a tidal boundary during the calibration process, but for the steady discharge scenarios modeled in this study, we imposed a constant water level boundary equal to the average water level in the bay over a 30-day period (0.3 m, NAVD88).
We ran three steady flow simulations at discharges of 500, 800, and 1,100 m3/s. A discharge of 500 m3/s is similar to the river discharge measured in the field in April 2023 (Section 3.1), and represents a stage where the largest floodplain channels convey water from the river, but many of the smaller channels remain dry. A discharge of 1,100 m3/s is near the bankfull discharge. We applied the constant discharges in the river at the upstream end, just south of Liberty, TX. We ran the models until they reached steady-state conditions based on an analysis of the rate of change of total water volume in the domain. Although the rising and falling flood wave dynamics associated with an unsteady flow event are important and not fully represented by a steady flow model, the objective of this study is to quantify spatial changes in connectivity and hydrodynamics over a large domain, and adding a temporal dimension would bring unnecessary complexity to the analysis and presentation of results related to our objective. We consider the steady modeling approach to be a representation of the long-lasting flood events (1–2 months) that can occur on the Trinity River, such as, for example, the flooding that occurred during the period between November 2015 and June 2016 (see USGS 08067000).
3.3 Defining analysis zones along the river
This study is centered around quantifying changes in structural and functional connectivity as a river approaches the coast. Within a defined strip of overbank area directly abutting the river, we quantified the degree of floodplain channelization using lidar data, and using model results at various discharges (as described in Section 3.2), we quantified the fractional inundated area, inundation volume, water fluxes, and floodplain residence times associated with those fluxes. Therefore, we delineated analysis boundaries, or “zones,” for each side of the river, which we refer to as “river bank zones.” Each river bank zone consists of a 200-m buffer from the main channel, and successive zones in the along-stream direction are delineated at the inflection point between successive river bends. For particularly sinuous parts of the river where neighboring bends are less than 400 m from each other (e.g., bend 23 in Figure 1), the buffer distance is reduced such that the dividing line between the two river bank zones is equidistant from the edges of each river bend.
These river bank zones represent the boundary between the river and the floodplain. Pathways across this boundary, such as floodplain channels, are an example of structural connectivity, while fluxes across this boundary represent functional connectivity. The 200-m buffer distance encompasses the typical width of the wider levees along the river, and therefore encompasses the floodplain channels that run through them. Even though levee width varies within the study region, we chose the 200-m buffer distance for consistency. A smaller buffer (say, 100 m) would not extend out to the levee crest for many of the larger levees, and would increase noise in our quantification of river-floodplain water exchanges by including fluxes that enter the river bank zone but quickly return to the source. A larger buffer would include more of the deeper floodplain beyond the levee, which would include significantly more inundated area for almost all river bank zones. Since the purpose of these zones is to quantify inundated area, inundation volume, and water fluxes within and through the adjacent river bank areas, we aimed to limit the zones to encompass the levee topography as best as possible. We numbered river bank zones by the river bend at which they are located. The first river bank zone is located just south of Liberty at bend 1, while the final zone at bend 49 is at the end of the Trinity River delta.
3.4 Quantifying structural connectivity
Structural connectivity in the context of this study is quantified by the degree to which the river is connected to the adjacent floodplain via secondary (or floodplain) channels (Passalacqua, 2017). We identified the presence of channels in river bank zones by filtering the DEM described in Section 3.2 and computing the curvature using the GeoNet approach (Passalacqua et al., 2010). The Laplacian curvature has been shown to be effective in highlighting channel features, particularly in flat landscapes and environments where increased selectivity of those features is needed (Passalacqua et al., 2012). We applied a curvature threshold of 0.3 m−1 across the landscape, as this value captures the most channelized pixels while also limiting noise. This method does not capture the centerline of the channels nor the entire channel area; instead, it captures the pixels along the boundary between the channel wall and the channel bottom. So there are two lines of pixels for each captured channel, one on each side of the channel.
We used the “Zonal Statistics as Table” tool in ArcGIS to compute the total number of channelized pixels in each river bank zone, where each pixel is 1 square meter. Then we divided the number of channelized pixels by the total zone area to obtain a percent channelization metric. For this analysis, we did not consider the zones within the USACE compound and in the delta downstream, as there is no channelization within the compound, and in the delta the hydraulics are unconfined and the distributary channels are much different structurally than the floodplain channels upstream.
3.5 Quantifying functional connectivity
We analyzed the functional connectivity of the lower Trinity River using ANUGA, the numerical model described in Section 3.2, and the river bank zones defined in Section 3.3 to quantify changes in hydrodynamic characteristics with distance downstream. Within each river bank zone, we quantified inundated area and inundation volume from the model results, normalized by the area of each zone. We applied dorado, a Lagrangian particle tracking tool that runs on flow fields generated by the model, to quantify fluxes between the river and the floodplain through each zone. We also tracked particle paths through the floodplain, calculated their residence times, and tied those residence times to the river bank zones where the particles entered the floodplain, as a way of quantifying residence time dependence on flux location and proximity to the coast.
3.5.1 “Static” metrics of functional connectivity
We queried the model results to determine both the inundated area and inundation volume within each river bank zone (Figure 4). We expect both metrics to be affected by the changes in topography and hydraulics as the river approaches the coast. Because the zones represent the overbank area within 200 m of the river, these measures of inundation do not represent overall flooding in the floodplain but rather water connectivity along the river bank. At sub-bankfull discharges, inundated area in particular is an indicator of bank line topography, where more inundated area indicates a lower-lying, relatively flatter river bank. In contrast, inundation volume in a river bank zone describes river bends with more bank line variability, as banks containing both high levees and deep floodplain channels would likely have less inundated area but more inundation volume. We expect that inundated area will increase toward the coast as the water surface profile flattens and approaches the average bank elevation. We do not expect inundation volumes to increase downstream, but instead be correlated with river bank structure. Each of these inundation metrics is a form of hydrological connectivity, but neither describes the transfer of mass or energy between the river and the floodplain. These metrics represent static quantities of water present within 200 m of the river, under steady-state conditions. We describe fluxes through river bank zones in the following subsection.
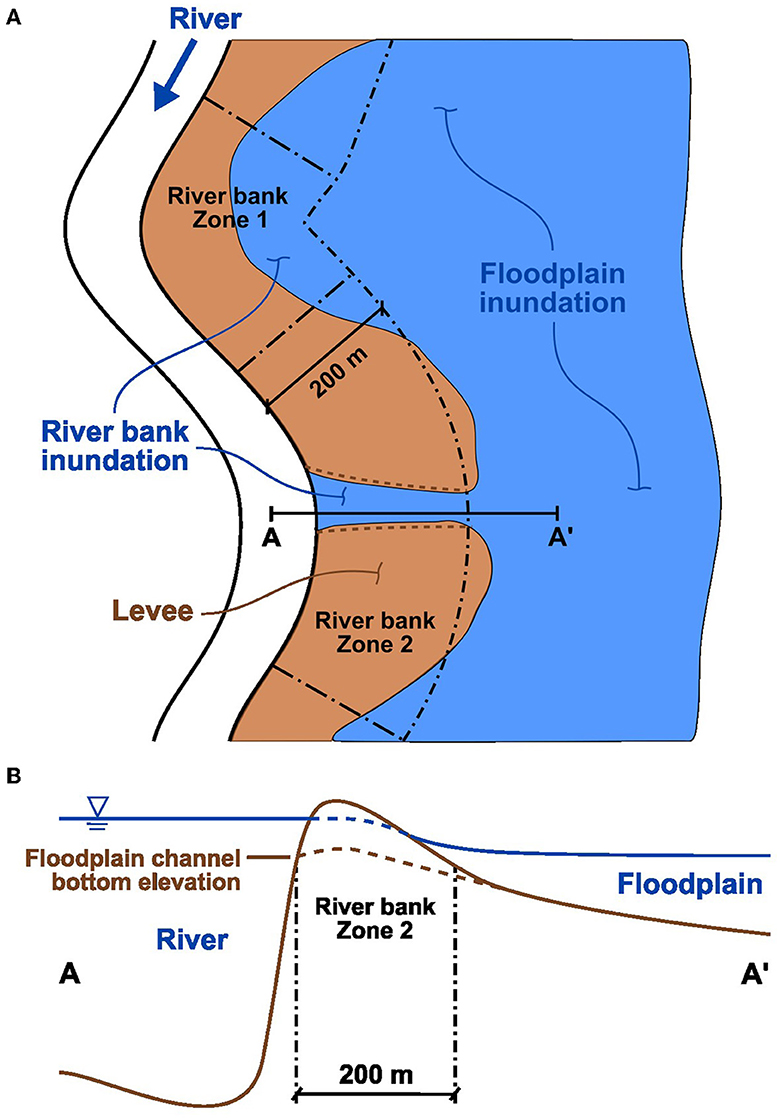
Figure 4. Illustration of inundation within river bank zones. In this manuscript, “inundated area” refers to the fractional area within each river bank zone that contains water, as in the simple example shown in plan view (A). To calculate normalized “inundation volume” within each river bank zone, we multiply the average depth in the zone by the inundated area fraction. For zones with deep levee channels, such as Zone 2 in cross-section view (B), the inundation volume can be greater than those with higher inundated area if the average depth of the latter is shallow.
We interpolated modeled flow depths for each simulation from mesh element centroids to a 2-m grid using an inverse-distance weighting method with the three nearest neighbors. Again using the “Zonal Statistics as Table” tool in ArcGIS, we computed the total number of grid cells in each river bank zone with depths greater than 1 cm, which is an arbitrary threshold selected to eliminate model noise from the analysis, although increasing this threshold above 1 cm did not change the results. We computed the percent inundated area for each zone by dividing the number of inundated cells by the total number of cells in the zone. We computed and normalized the inundation volume by taking the mean depth in each zone (for cells with depths greater than 1 cm) and multiplying it by the ratio of wet cell area to total zone area. Normalizing the inundation volume accounts for the wide range of zone sizes, which vary based on river bend geometry.
3.5.2 Flux and residence time quantification with dorado
We used the dorado Lagrangian particle routing package (Hariharan et al., 2020) for computing fluxes, flow paths, and residence times in the model domain. dorado uses a weighted random walk algorithm adapted from DeltaRCM (Liang et al., 2015a,b) to simulate passive particle transport through model flow fields on a regular grid. It has been used recently in several modeling studies of coastal river and delta systems (Tull et al., 2022; Wright et al., 2022a; Hariharan et al., 2023); more detail on the routing algorithm can be found in the Methods sections of those studies as well as in the software documentation online.
We interpolated model outputs of water stage, depth, and depth-averaged momentum at the end of each simulation (i.e., at steady-state) to a 5-m grid using three-neighbor inverse distance weighting. Particle routing results showed little sensitivity to changes in the interpolated grid size between 2-m and 10-m resolution. We applied a dry-depth limit such that particles were limited to cells with at least 1 cm of depth. dorado routes particles as passive tracers of water movement, where routing is weighted proportional to water depth in the downstream direction (θ = 1; Hariharan et al., 2020; Wright et al., 2022a). Thus, particle transport in this study represents transport of neutrally buoyant materials.
Because particles approximate water and neutrally buoyant material transport through the domain, and total water volume on the floodplain scales with discharge, we routed a large number of particles proportional to the steady discharge in each model simulation. For discharges of 500, 800, and 1,100 m3/s, we initialized 50,000, 80,000, and 110,000 particles, respectively, at the inlet of the domain. Particles traveled through the model flow fields for 50 days, at which point the vast majority of particles had reached the distal domain edge in the bay, which we defined as the stopping criteria for the particle routing.
To quantify fluxes into and out of the river through river bank zones, we converted the zone polygons to a raster of the same shape as those used for the particle simulations. We assigned a unique integer value to raster area covered by each river bank zone, the river itself, the floodplain, and the bay. For each particle that steps into a floodplain cell, we tracked its path to find the river bank zone it entered when it last left the river. If that same particle re-entered the river somewhere downstream, we recorded the river bank zone where the re-entry occurred. The floodplain residence time of that particle is the total travel time between the river exit point and the river re-entry point, where travel time per step is computed based on the step distance, local flow velocities, and a diffusivity modifier (Hariharan et al., 2020). For particles that did not re-enter the river, we considered the residence time calculation complete once they reached the bay.
For the range of modeled discharges we can determine the magnitude of flux to the floodplain occurring at each river bank zone, the magnitude of flux re-entering the river at each zone including the distribution of bends where those fluxes originated, and the residence times associated with fluxes from each river zone. Within the Eulerian framework of the numerical model, it is possible to achieve a first-order estimate of flow into the floodplain from a given river bend. However, it is impossible to get information on the fate of those specific flows once they enter the floodplain and mix with other sources of water. Likewise, it is possible (and common) to measure the residence time of a body of water by considering the total volume of water and flow rate through the system, but computing a distribution of residence times is only possible within a Lagrangian framework. Particle routing with dorado allows us to track the fate of specific river-floodplain fluxes, and study the influence of specific river bends on transport through the floodplain.
4 Results
4.1 Field measurements of lateral exchange
Discharge measurements taken in the backwater reach of the Trinity River show that there can be a systematic decrease in river flow approaching the coast, even in a reach upstream of the delta (Figure 5). We collected the data during the falling limb of a minor flood event that lasted 5–6 days, when water in the floodplain was returning back to the river. Many locations continued to convey flow from the river to the floodplain, though, even as river stage decreased.
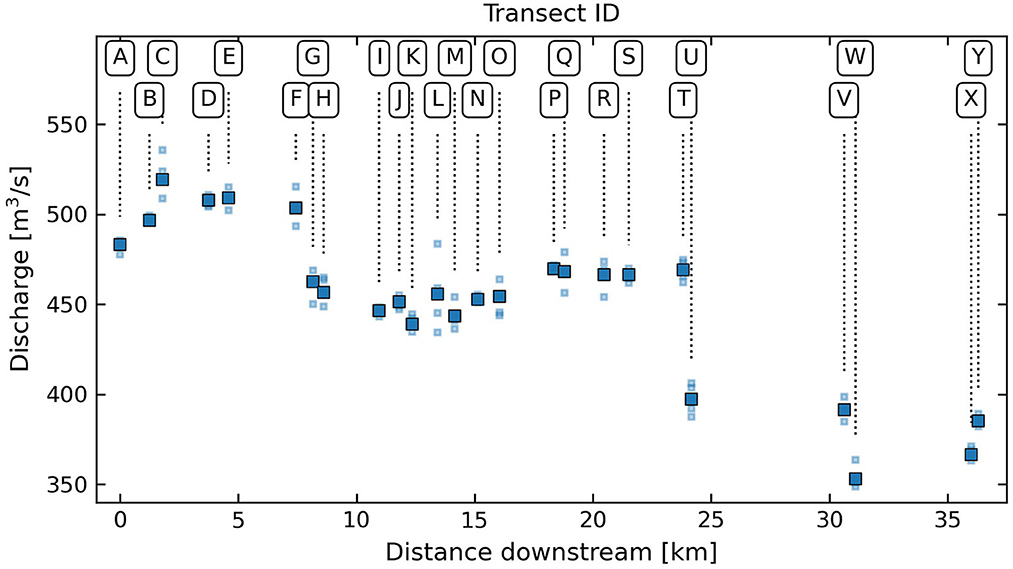
Figure 5. Measured discharge data during the falling limb of a minor flood event on 13 April 2023. Transect labels correspond to those labeled in Figure 3. Smaller, lighter squares indicate individual measurements, while large, solid squares indicate the average value.
The first three measurements (transects A–C, Figure 5) located upstream of CWA Bluff (Figure 2A) show that the flow increased from 480 to 520 m3/s over a short distance (1.8 rkm) in the downstream direction. The measured discharge of 480 m3/s at transect A was lower than the discharge at Liberty at the same time the transect A measurement was taken (515 m3/s at 10:50 CDT), even though the falling river stage would have indicated that Liberty would have a lower discharge than points downstream at a given time. However, the flow increased from transects A to B and from transects B to C corresponding to two large floodplain channels upstream of CWA Bluff that were flowing toward the river (Figure 3). This location is one of the few within the study area where flow was returning to the river during the field campaign.
Downstream of CWA Bluff is a bend (bend 18) with one of the largest levee extents on the river, along with the largest network of floodplain channels within the levee, referred to here as Camp Road, which is a name given to the unmaintained path that runs along the levee crest (Figure 2B). Transects F and G were located upstream and downstream of this bend, respectively, where measurements indicated a flow loss of about 40 m3/s through this levee, or 8% of the total river discharge at Liberty at the time of measurement. This bend has one of the highest and widest levees on the Lower Trinity River, and at the same time functions as one of the major points of flow loss from the river during high flows.
Between transects I and O (Figures 2C, 3), flows in the river did not change significantly but instead alternated between small increases and decreases along the river. There are both large and small floodplain channels connected to the river between these transects. Flow was moving to the floodplain through a deep connecting channel between transects J and K (bend 23), but came back to the river at the next bend downstream between transects K and L. After transect L, more flow was moving out of the river through the set of floodplain channels at the next river bend (bend 26). The left bank between transects M and N was completely inundated, and the small increase in measured discharge at transect N indicates that the net water flux at this location was toward the river. This increase is in spite of the fact that the Moss Bluff pump station was likely removing a small amount of water from the river upstream of transect N (bend 27). At transect P (bend 30), there was a flow increase of 16 m3/s, however there are no natural features between transects O and P that would indicate an inflow. There is a community living along the left river bank here as well as a large engineered pond, which could be the source of the flow increase, but we are unsure of the mode by which water was entering the river at this location.
The largest floodplain channel in the study area, the “Cutoff,” is located at bend 33 between transects T and U (Figure 2D), representing the largest measured flow loss from the river of 72 m3/s, or 15% of the Liberty discharge at the time of measurement. Downstream of the Cutoff the river-right floodplain becomes dominated by large floodplain lakes and eventually tidal estuaries. River water moving through the Cutoff is one of the primary sources of freshwater to these lakes, even at low flows.
Transects V–Y represent measurements upstream and downstream of two separate floodplain channels connected to the river on the left bank (Figure 3). Each of these channels currently functions to bring water to and from the large floodplain lakes near the river on that side. Under most conditions, the first channel (between transects V–W at bend 36) brings flow to the floodplain while the second channel (between transects X–Y at bend 41, Figure 2E) returns flow to the river just upstream of Wallisville Bluff (Figure 5).
4.2 Downstream changes in bank channelization
The degree of river bank channelization varies greatly along the river (Figure 6). Features contributing to high channelization on the east side of the river include the oxbow lake and tie channel at bend 2, a floodplain channel that begins at bend 8 and connects back to the river at bend 23, and another channel that passes through bend 24 but connects to the river at bend 25 (Figure 2C). The channels at bends 36 and 41 on the east side correspond to the location of the downstream-most discharge measurements in Figure 5, transects V–W and X–Y, respectively. On the west side, the largest total channelized area was computed at bend 18, which is the Camp Road bend associated with discharge measurements taken at transects F–G (Figure 5).
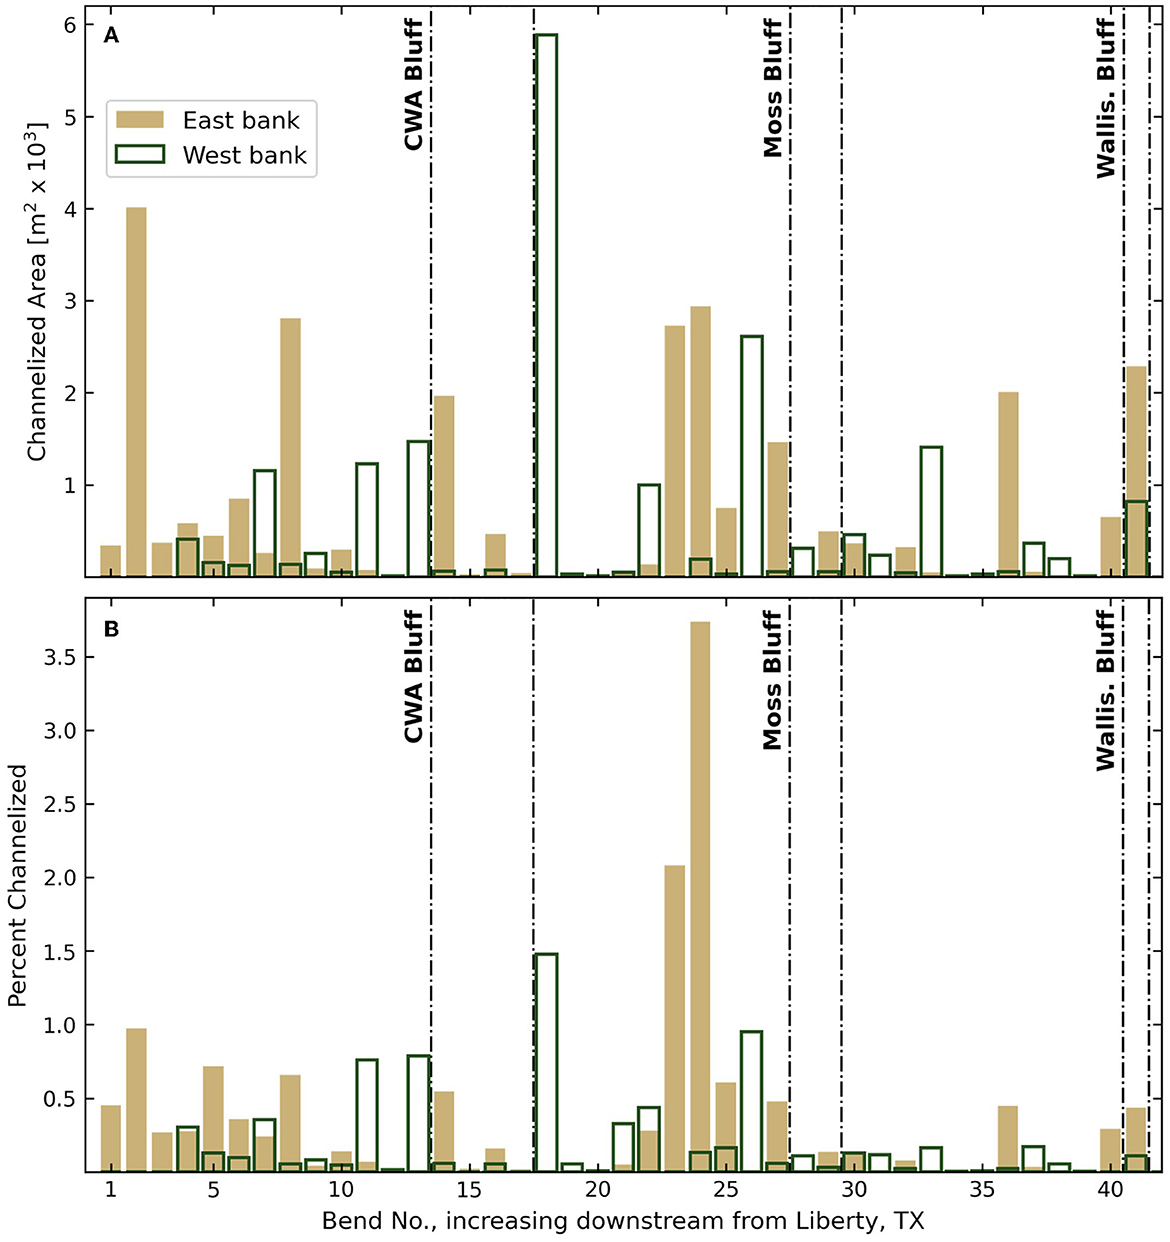
Figure 6. (A) Total channelized pixel area and (B) percent channelization within the river bank zone at each river bend. CWA Bluff is located on the west bank of the river, while Moss Bluff and Wallisville Bluff are on the east bank.
Bend 33 on the west side contains the largest floodplain channel upstream of the delta (the Cutoff, Figure 2D), but this channel does not translate to a high channelized pixel count in Figure 6A. Its signal is even less prominent as a percentage of the zone area (Figure 6B), because this bend is by far the most sinuous in the study region, and its river bank zone is the largest as a result. This channel is a known location of high outflow (transects T–U in Figure 5). Figure 6 gives a sense of the bank line variability of the system and the presence of channels. Many bends have no identifiable channels at all; however, the presence of floodplain channels is not a requirement for lateral fluxes. For example, there is a long distance on the upstream side of bend 33 over which the river is mostly unbounded by a levee. This particular river bank is prone to overtopping at sub-bankfull discharges, and these wider, unchannelized gaps in the levee can be an important control on lateral exchange (Tull et al., 2022).
4.3 Downstream changes in functional connectivity
Model outputs show the differences in extent and depth of flooding in the domain for the lower discharge scenario (500 m3/s, Figure 7A) and the higher discharge scenario (1,100 m3/s, Figure 7B). At 500 m3/s, the overall increase in water in the floodplain with distance downstream is evident. The deeper lakes and floodplain basins are inundated, particularly closer to the bay. However, many parts of the upstream floodplain remain dry, while the higher levees along the length of the river remain much drier than the deeper parts of the floodplain along the valley walls. At 1,100 m3/s, the river stage is just below bankfull and nearly the entire valley is inundated. Exceptions include a few of the high elevation, Pleistocene scroll bars just south of Liberty, TX, the highest levees in the system, and some of the island topography in the delta. The presence of dry land in the delta even at a much higher discharge illustrates how flows are attenuated and spread out as they approach the bay. The diversity in floodplain topography is evident under the high discharge conditions, which is part of the motivation behind studying unique flow paths and residence times through the floodplain.
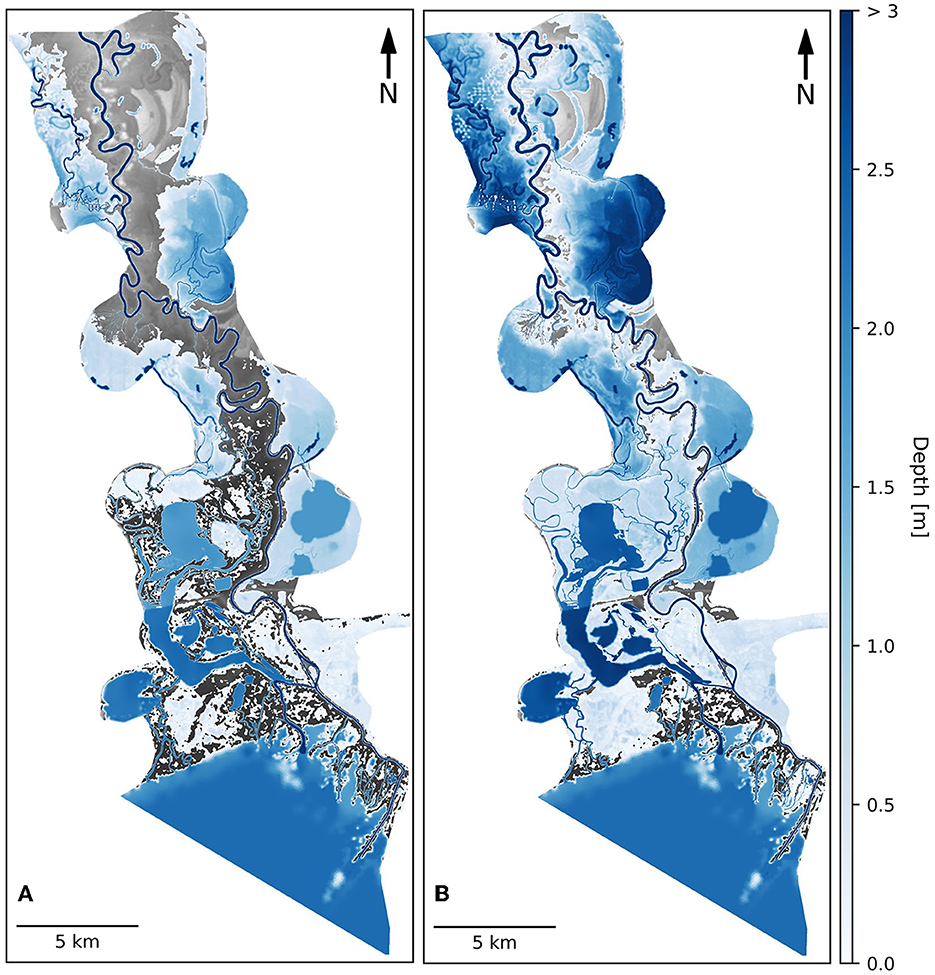
Figure 7. Depth maps for model simulations with discharges of (A) 500 m3/s and (B) 1,100 m3/s.
4.3.1 Inundated area and volumes within river bank zones
For a steady discharge of 500 m3/s, inundated area in river bank zones generally increases with distance downstream (Figure 8A). However, the increase is not monotonic, and instead exhibits several distinct groups of consecutive bends with similar inundated river bank area, with lower inundated area upstream and downstream of the bend group. On the west side of the river in particular (right bank), the bend with the highest percent inundated area is located just upstream of CWA Bluff (bend 12), far upstream from the delta and almost outside of the backwater reach entirely. It was at this location where we had measured significant return flows in the field. Just after this bluff, though, the inundated area is reduced drastically at river bend 18 (Camp Road) where the levee is massive and there are many deep floodplain channels within the levee. We know from measured discharge data that this bend conveyed a significant fraction of river flow to the floodplain through the network of floodplain channels (Figure 5), and so it is notable that this bend is a major location of lateral exchange even when most of the levee above the channelized portion remains dry.
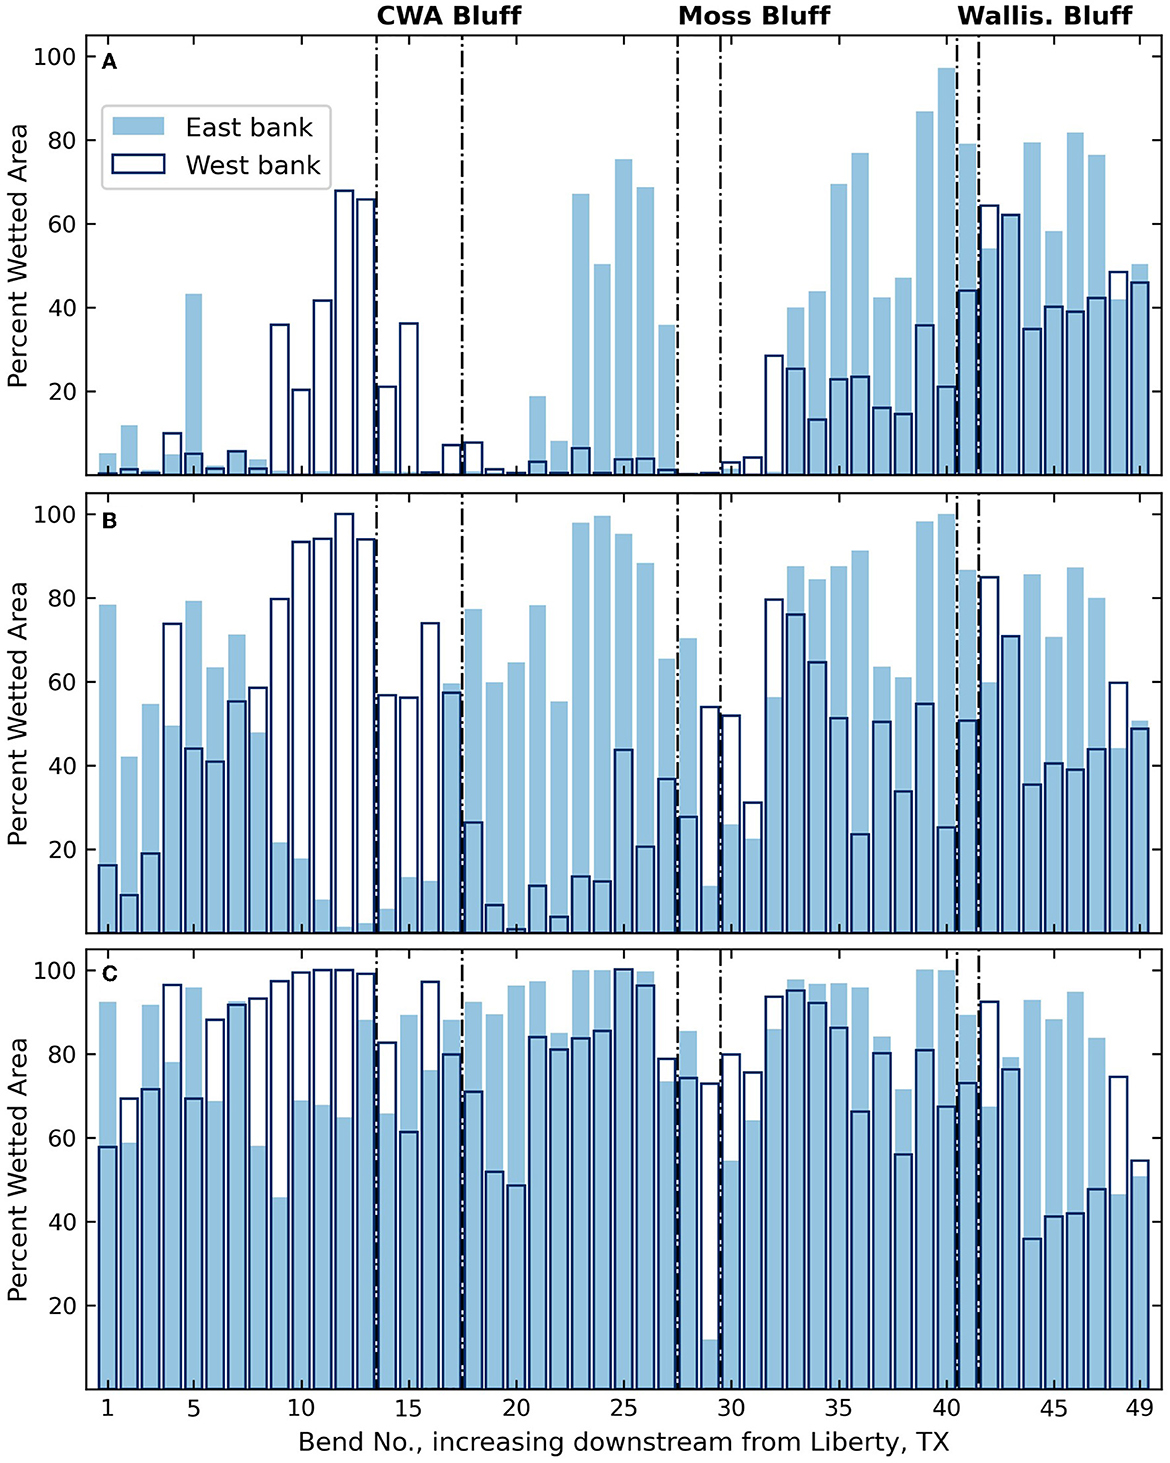
Figure 8. Percent inundated area within the river bank zone of each river bend for discharges of (A) 500 m3/s, (B) 800 m3/s, and (C) 1,100 m3/s. CWA Bluff is located on the west bank on the river, while Moss Bluff and Wallisville Bluff are on the east bank.
At higher discharges, the pattern of increasing inundated area downstream is less apparent (Figures 8B, C). Groups of bends with high inundated area are still present at a discharge of 800 m3/s (Figure 8B), and many of the river bank zones that had relatively less inundated area at 500 m3/s remain with less inundated area. Notably though, many river bank zones that previously had very little to no inundated area show significant inundated area at this higher discharge. The increase in inundated river bank zones in the upstream reach lessens the overall trend of increasing inundated area toward the delta. At 1,100 m3/s (Figure 8C), inundated area in river bank zones approaches a bankfull condition, and almost all zones are mostly inundated, with only slightly less inundated area in the upstream reach. One exception is the east side of bend 29. Low inundation at this bend is attributed to the presence of Moss Bluff, which maintains elevations too high for nearly any flood level to reach. Another exception is within the delta (bends 44–49), where inundated area on the west side (the unconfined side) changes only slightly over the range of discharges studied. At higher discharges, excess river flow lost to the floodplain via the Cutoff and Old River Cutoff channels modulates the flow that reaches the delta. Furthermore, the water surface elevation of the bay controls water levels in the delta, preventing significant variation in river bank inundation in the delta over the range of modeled discharges.
Whereas inundated area provides an understanding of river bank topography, the inundation volume metric incorporates information on flow depths within river bank zones, and represents an additional step toward a description of functional connectivity along the river. While inundated area increases with distance downstream for the 500 m3/s scenario, there is no similar increase in inundation volume in river bank zones (Figure 9A). Instead, inundation volumes along the river bank are substantially higher just upstream of each of the three bluffs in the system: CWA Bluff on the west side, and Moss Bluff and Wallisville Bluff on the east side. This pattern of maximum inundation volume just upstream of bluffs is present across all discharges. These locations upstream of the bluffs are those that were measured in the field as being the major locations of return flow back to the river. Interestingly, inundation volumes immediately across the river from the zones of maximum inundation volume are consistently among the lowest in the system. There are almost no locations along the river where inundation volumes are high on both sides.
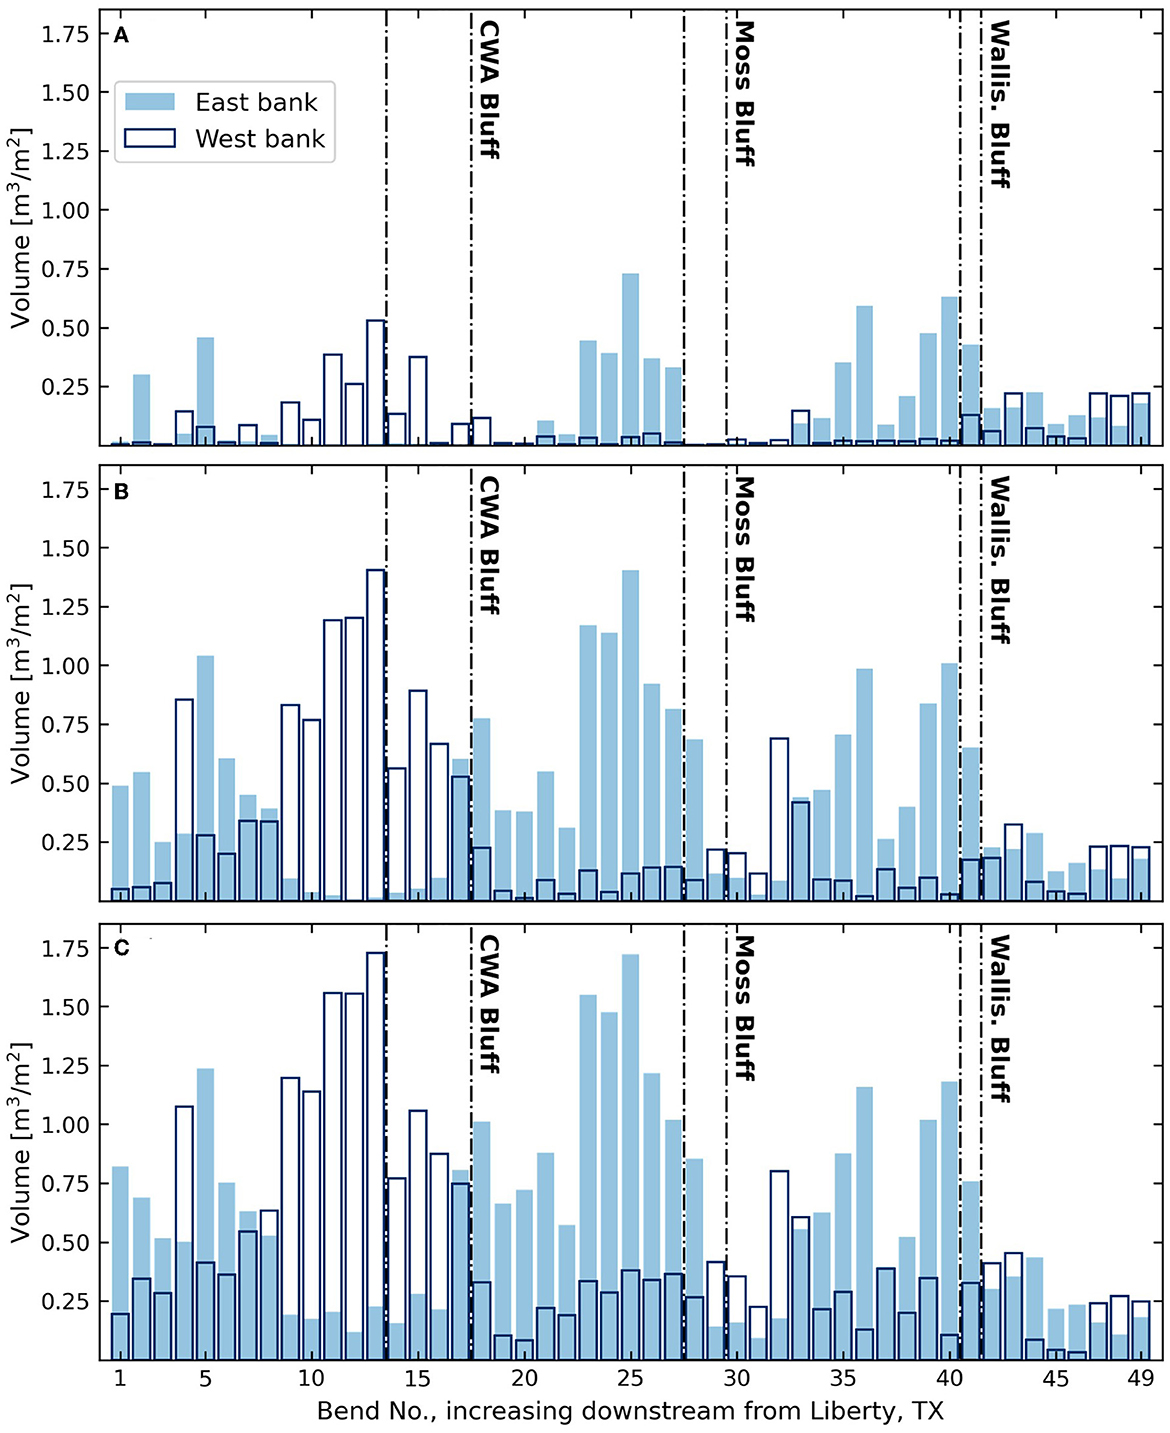
Figure 9. Normalized inundation volume within the river bank zone of each river bend (total water volume divided by zone area) for discharges of (A) 500 m3/s, (B) 800 m3/s, and (C) 1,100 m3/s. CWA Bluff is located on the west bank on the river, while Moss Bluff and Wallisville Bluff are on the east bank.
4.3.2 River-floodplain fluxes through river bank zones
Locations of lateral exchange between the river and the floodplain are also dependent on river bank structure (Figure 10). At a discharge of 500 m3/s (Figure 10A), lateral exchange only occurs at a few river bends. For example, bends 33 and 36 (corresponding to transects T–U and V–W, Figure 5) include large floodplain channels on the west and east side of the river, respectively, which convey about 1,800 particles (18 m3/s) and 3,100 particles (31 m3/s), respectively, to the floodplain under these conditions. Bend 18 on the west side (Camp Road) conveys about 2,700 particles (27 m3/s) through the network of channels south of CWA Bluff. The largest flux from the river occurs downstream of the USACE control structure on the west side of the river (river right), through the Old River Cutoff (bend 43, see Section 2). The flow through this channel (22,600 particles, or 226 m3/s) is nearly half of the flow rate moving through the entire domain. Some flow also leaves the river through the passes in the delta (“bend” 47), but not nearly as much as the flow through the larger Old River Cutoff upstream.
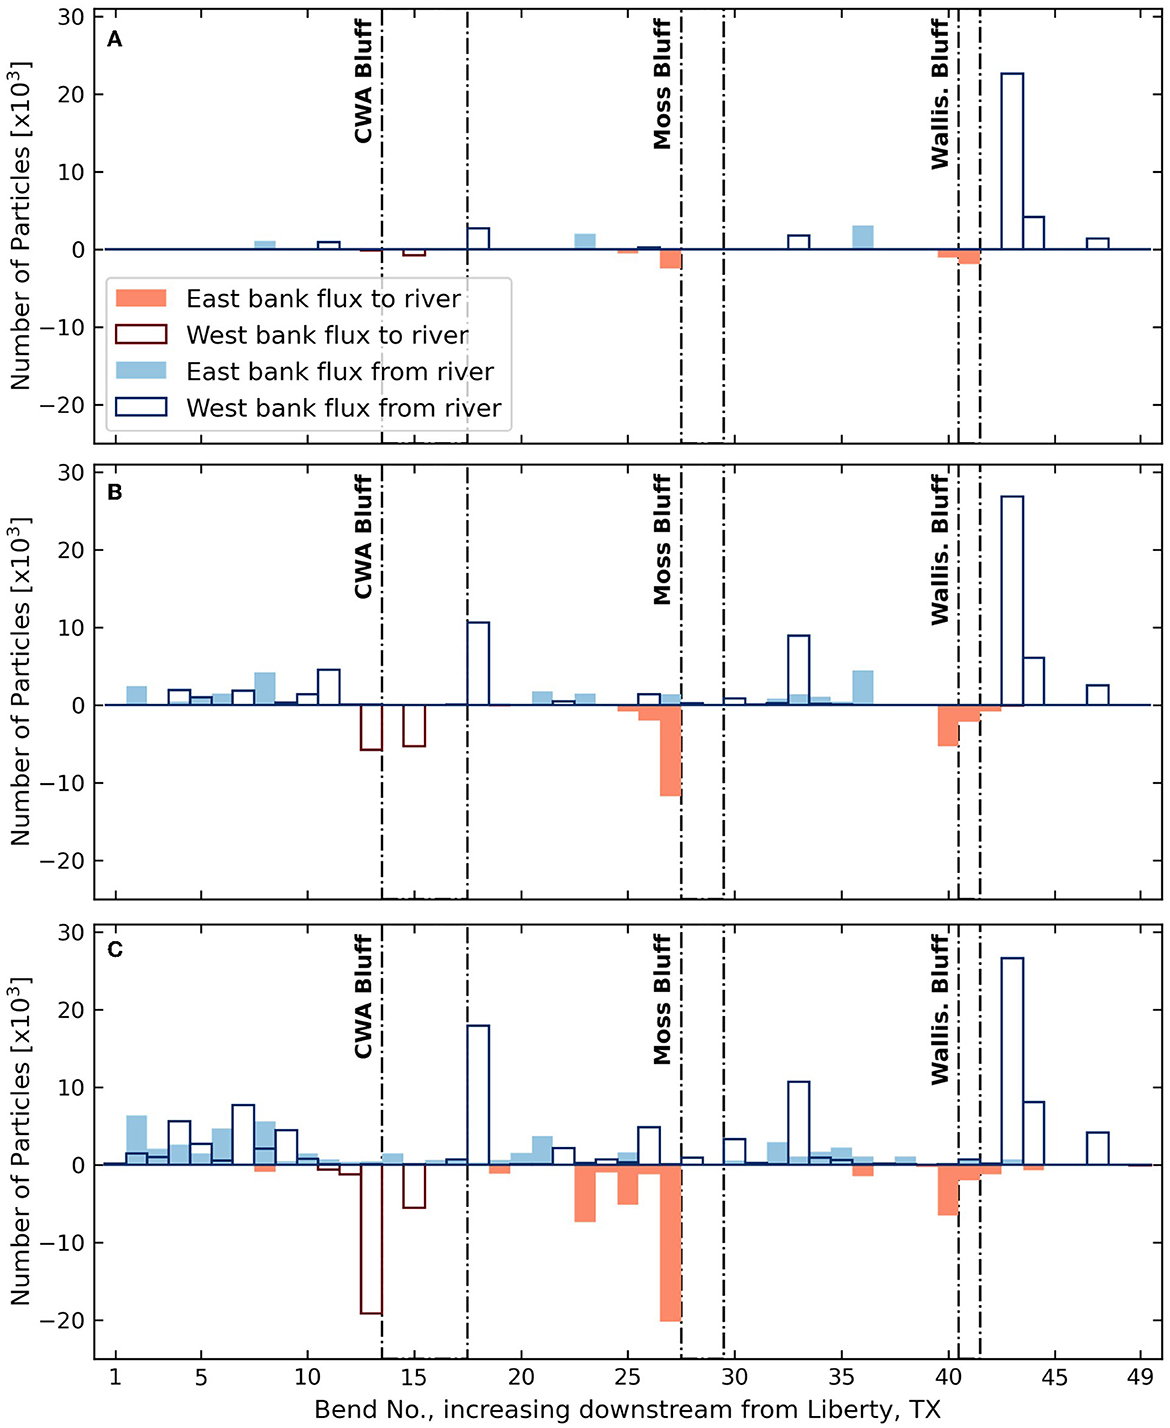
Figure 10. Particle fluxes into (negative) and out of the river (positive) through the river bank zone of each river bend for discharges of (A) 500 m3/s, (B) 800 m3/s, and (C) 1,100 m3/s. Particle fluxes are approximately proportional to discharge; an equivalent water flux in m3/s can be calculated by dividing the number of particles by 100. CWA Bluff is located on the west bank on the river, while Moss Bluff and Wallisville Bluff are on the east bank.
It is evident that the locations of flow to the floodplain do not correspond to locations with high or low degrees of river bank zone inundation (Figures 8, 9). Return flows to the river (negative fluxes, Figure 10), however, have a strong correspondence to river bank zones with high inundation volumes, and thus are highly dependent on changes in valley width and proximity to bluffs. At all discharges, locations of return flow are clustered at or just upstream of one of the three bluffs along the river. These locations correspond to the return flow locations observed in the field. Upstream of each bluff there is at least one floodplain channel connected to the river, and the apparent function of these channels is to return water to the river, both for long-lasting “steady” flood events and during the falling limb of a shorter flood event like the one measured in April 2023. The high inundation volumes upstream of each bluff indicate that floodplain water accumulates at these locations, and the modeled fluxes show that this water is forced by the constriction imposed by the bluffs to return to the river. The combination of these two results highlights the importance of the bluffs as major controls on lateral exchange along the river.
At a discharge of 1,100 m3/s (Figure 10C), lateral exchange occurs at almost every river bend. The flow rates to the floodplain are highly variable, though, and there is a degree of spatial heterogeneity that is not seen in the patterns of inundated area or inundation volume. As discharge approaches bankfull, the inundated area in river bank zones approaches 100 percent (Figure 8C). Even with a nearly full overbank flood event, it is clear that flow into the floodplain is still controlled by the bank line topography. Flow to the floodplain occurs at most river bends, but those with the largest floodplain channels (e.g., west side bends 18 and 33 and east side bend 8) continue to contribute a substantial portion of this flow. In contrast, locations of return flow are fewer, and are controlled less by bank line topography and more by bluffs. These return flow locations are associated with large floodplain channels as well, but we hypothesize that those channels exist in that location because of carving by outflow upstream of the bluffs.
At all discharges, the Old River Cutoff is the location with the largest outward flow (bend 43). The flow through the Old River Cutoff increases with increasing overall discharge, but only slightly. At higher overall discharges, the increased flow to the floodplain at upstream locations reduces the flow in the river at the USACE control structure, and therefore limits the difference in flows moving through the delta among the various discharge scenarios. Therefore, as river discharge at Liberty increases, it is likely that flow would increase more through the Old River Lake to the west of the Trinity River, rather than continuing to increase in the Trinity River delta.
4.3.3 Floodplain residence times as function of flux location
At 500 m3/s, lateral exchange on both the east (Figure 11A) and west (Figure 12A) sides of the river is limited to certain bends. But for water that does reach the floodplain, residence times are longer on average than those under higher discharge conditions. One exception is within the delta (bends 43–49, Figure 12A), where residence times are shorter than for those fluxes entering the floodplain farther upstream. Short “residence times” in the delta are to be expected, though, as the residence time definition for these particles is the travel time from when they leave the river to when they reach the bay, which is a relatively short distance. The high positive skew for these delta particle distributions may be a result of the faster travel times directly to the bay through the distributaries compared to the longer and less frequently traveled paths through the delta islands and estuaries.
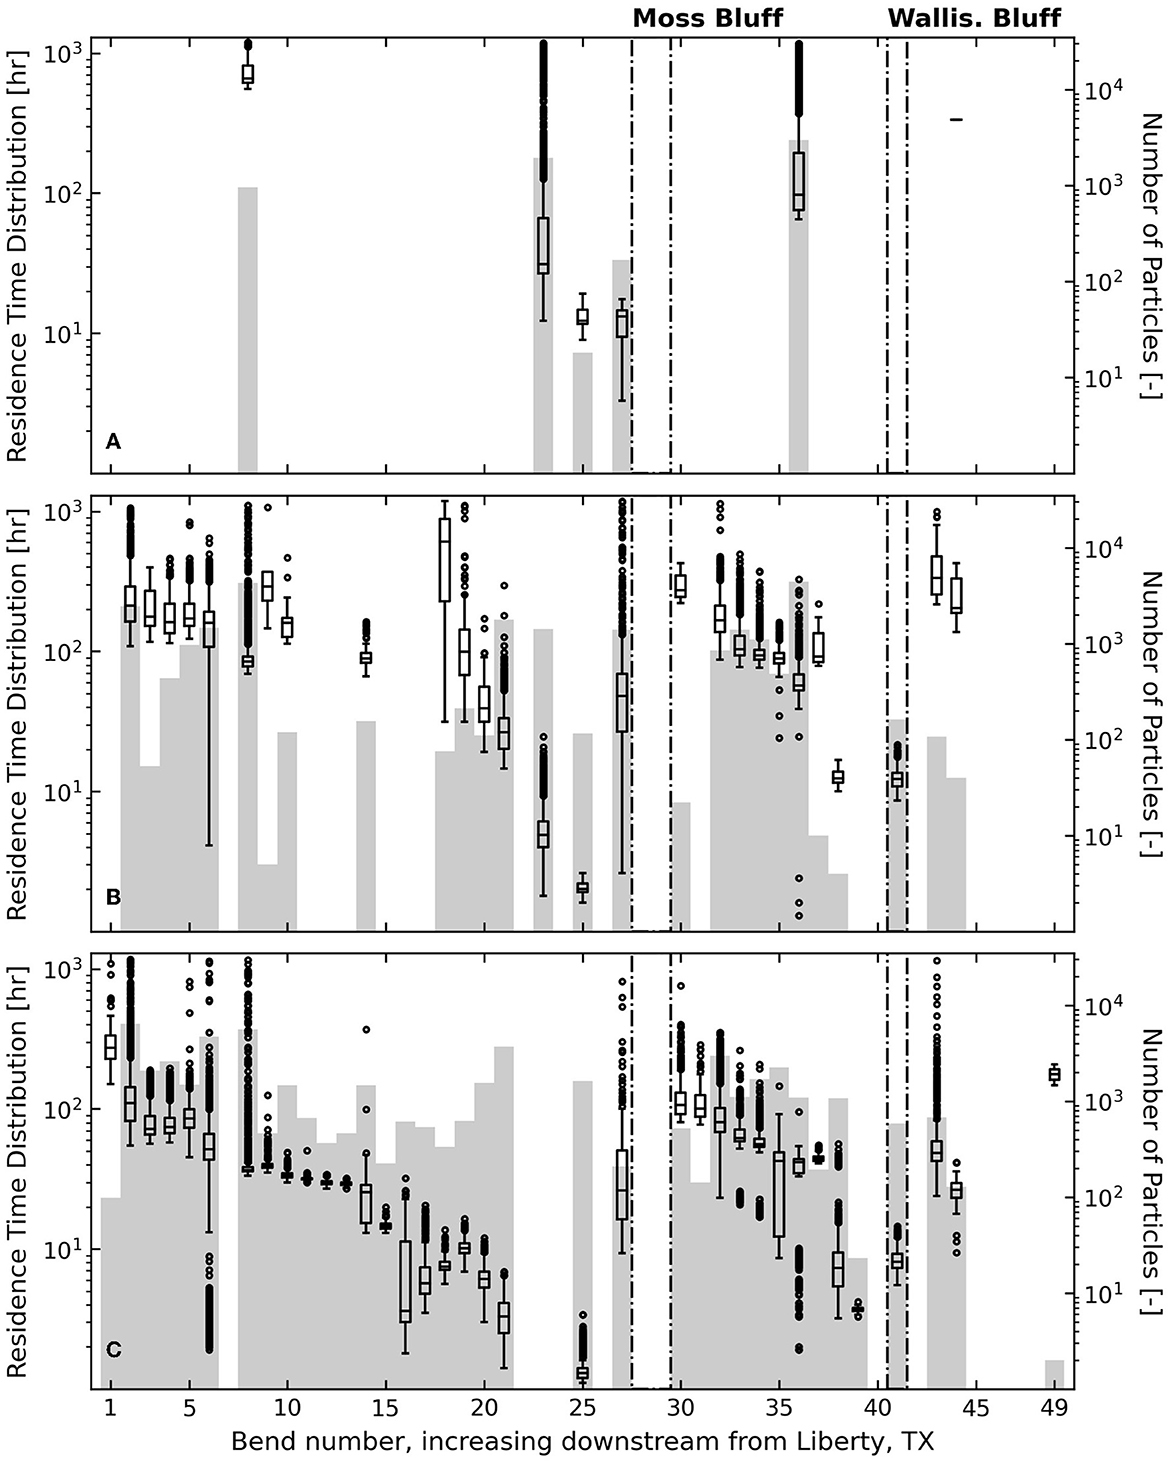
Figure 11. Residence time distributions (box plots) for particles that leave the river through the river bank zone of each river bend on the east side of the river for discharges of (A) 500 m3/s, (B) 800 m3/s, and (C) 1,100 m3/s. Gray bars underneath indicate the number of particles associated with each distribution.
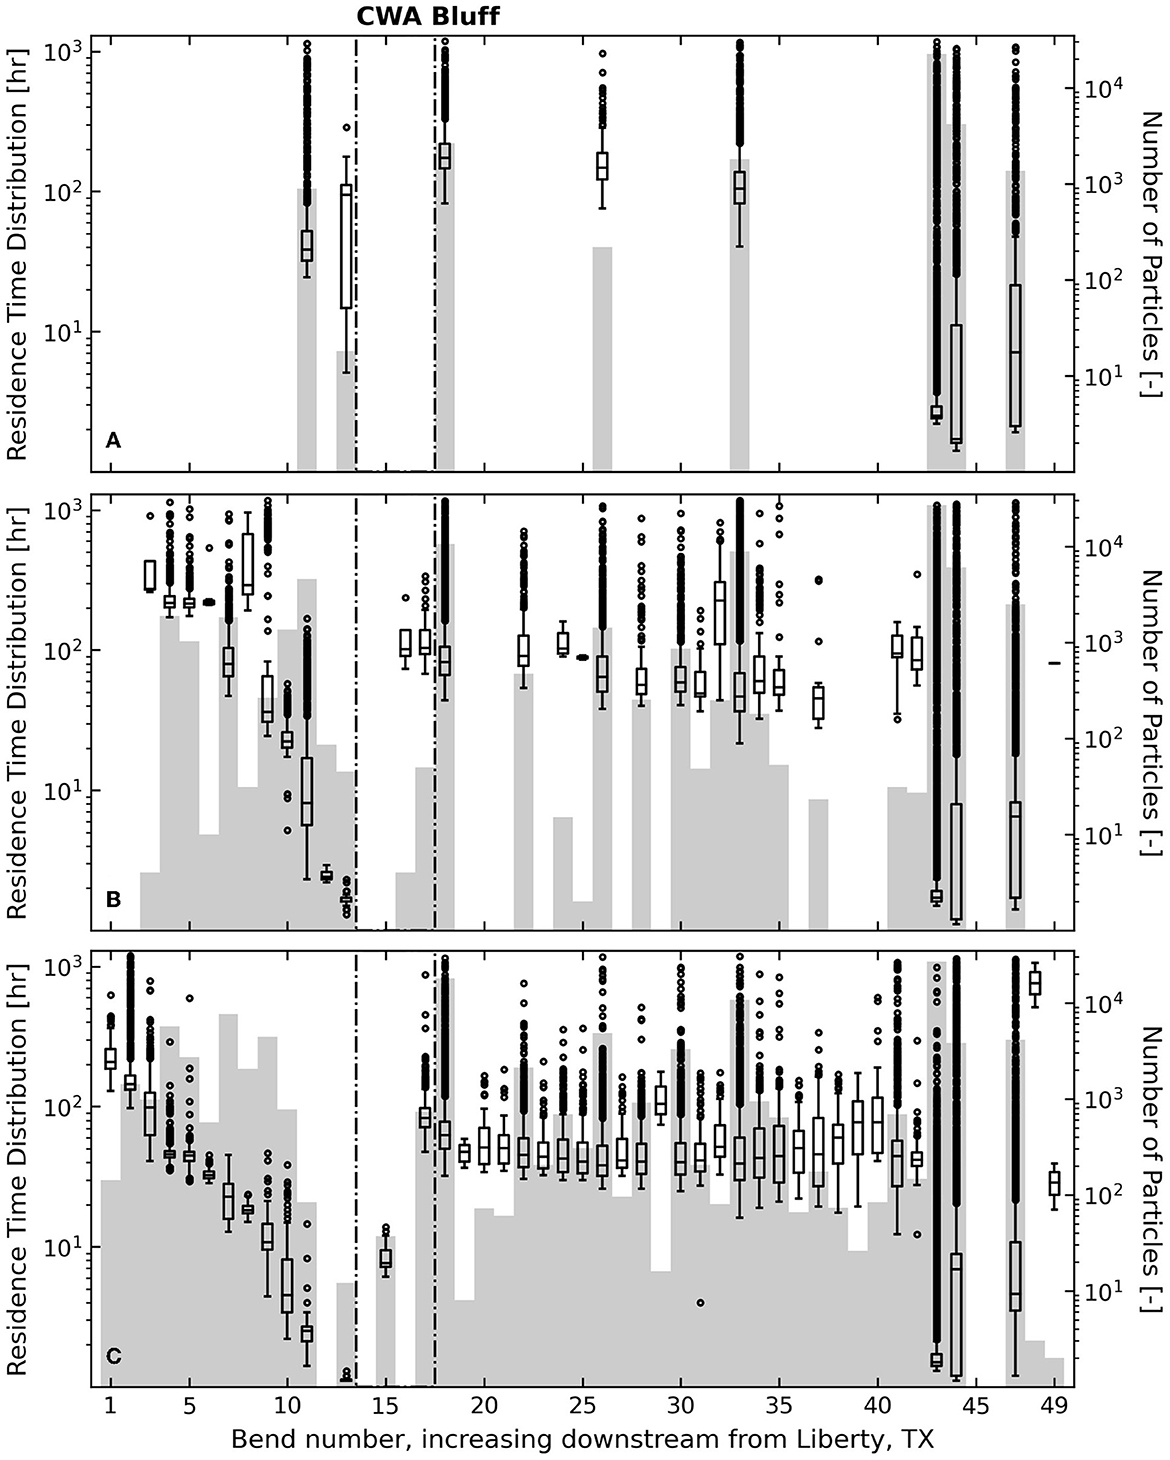
Figure 12. Residence time distributions (box plots) for particles that leave the river through the river bank zone of each river bend on the west side of the river for discharges of (A) 500 m3/s, (B) 800 m3/s, and (C) 1,100 m3/s. Gray bars underneath indicate the number of particles associated with each distribution.
With increasing discharge, residence times become more strongly a function of the location where the water (or particles) entered the floodplain. The three bluffs in the study area have been shown to control the locations of return flow to the river, and these return flow locations are less numerous than the number of outflow locations. It follows, then, that for a given particle, the residence time of that particle is dependent on how far upstream of a bluff it entered the floodplain. On the east side of the river, for example, we see more than an order of magnitude difference in residence times among particles entering the floodplain close to the bluff compared to those entering farther upstream (Figures 11B, C). The range of residence times is similar for the floodplain upstream of Moss Bluff and the floodplain upstream of Wallisville Bluff, even though the adjacent river distance is more than twice as long for the former.
The residence time decrease closer to bluffs is not always consistent, though, as the signal of some of the large floodplain channels remains evident within this transition. For example, at 800 m3/s there is a discontinuity in the decreasing trend of residence times at bend 37 (east side, Figure 11B, transects V–W in Figure 5). Particles entering the floodplain through this channel or upstream of it must flow through Lake Charlotte (Figure 1), which will cause them to take much longer to re-enter the river at the return flow location just upstream of Wallisville Bluff. Particles entering the floodplain downstream of bend 37 via overbank flow (rather than channelized flow) have residence times an order of magnitude less than those of particles from bend 37. Meanwhile, at 500 m3/s there is no lateral exchange at all downstream of bend 37 (Figure 11A). In this scenario, residence times for particles entering between bends 32 and 37 are significantly longer than those of particles entering via the same bends at higher discharges, as the velocities in the floodplain at lower discharges are lower. The difference in residence times at 500 m3/s for east side bends 23 and 25 is also notable, where each bend contains a large floodplain channel; particles from bend 23 have an opportunity to circulate through the deep floodplain upstream of Moss Bluff before returning to the river, while those from bend 25 return almost immediately to the river (Figure 11A). This difference is limited at 800 m3/s, and the outward flux at bend 23 is completely eliminated at 1,100 m3/s, as the flow direction is reversed due to the greater floodplain flows returning to the river upstream of Moss Bluff.
Upstream of CWA Bluff on the west side of the river, there is a decrease in residence time over two orders of magnitude for discharges between 800 and 1,100 m3/s (Figures 12B, C). CWA Bluff is the only bluff on this side of the river, and downstream of this bluff there is no such systematic decrease in residence times. In fact, particles that move to the west floodplain downstream of CWA Bluff never return to the river (no negative fluxes on the west side in Figure 10), and instead flow through the Old River Lake and into Trinity Bay. At a discharge of 1,100 m3/s, particles entering the floodplain from bend 18 (Camp Road, transects F–G in Figure 5) took an average of 71 hours to reach the bay, while those from bend 41 just upstream of the USACE compound spent an average of 76 hours in the floodplain (Figure 12C). While the total distance traveled for particles originating from bend 18 is substantially longer, their shared path through the system of large lakes and estuaries near the bay is likely where net movement toward the bay is the slowest, and so the residence times are similar. For particles leaving the river at bend 43 (within and just downstream of the USACE compound, including the Old River Cutoff), the average residence time drops to 3 h, indicating that the path through the Old River Cutoff is likely the fastest path in the delta. At the very next bend downstream of Old River Cutoff (bend 44), the average jumps back up to 30 hours, as some of the less-frequented paths through the delta islands can be slower.
5 Discussion and conclusions
5.1 Directionality of lateral exchange
The discharge data measured under sub-bankfull conditions (Figure 5) show that there are certain locations along the Trinity River that are largely responsible for bringing flow to the floodplain, and others that are predominantly locations of return flow. We had expected that many floodplain channels and other gaps in the levee where water moved to the floodplain during the rising limb would then bring water back to the river as the flood receded. While we do not know where flow moved to the floodplain prior to our field campaign in April 2023, we did observe only two or three locations where flow was re-entering the river, even as the flood receded. The biggest measured changes in river flow were all flows to the floodplain. Within the backwater reach of the Trinity River, the expected return flows associated with a falling flood wave are counteracted by the increased opportunities for lateral exchange as the normal water surface elevation approaches the elevation of the river bank closer to the bay. In effect, the majority of locations with large pathways between the river and floodplain are predominantly outflow locations. Locations of return flow exist but they are fewer than outflow locations. Furthermore, the magnitude of return flows from the floodplain is significantly less than the flows leaving the river elsewhere (under unsteady conditions).
Model simulations of steady flow conditions illustrate a similar finding, where lateral exchange is dominated by the number of outflow locations, and the return flow locations are limited. Of course, under steady conditions the flow into a floodplain segment must equal the flow out. Only in the floodplain west of the Trinity River and south of CWA Bluff is there a net flow loss, as these flows do not return to the river at any point downstream.
We have identified locations along the river where return flow occurs, in situations where the river stage is falling (Figure 5) and under steady flow conditions (Figure 10). However, it is not certain how these channels would function during the rising limb of a flood event, and whether they would reverse direction after the river-floodplain gradient equalizes or if they would always function as return flow channels. The return flux just upstream of Moss Bluff is the largest single return flux in any of the simulations (bend 27 on east bank, Figure 10), but discharge measurements showed that the return flux here was the least of the three bluff locations (transect N, Figure 5). This discrepancy is partly explained by the presence of other features at this bend that were removing river flow, including the pump station at Moss Bluff and a few nearby floodplain channels. A bigger factor, though, could be the difference in the river-floodplain hydraulics at steady-state compared to the falling limb of a flood of shorter duration. The steady flow models give insight into lateral exchange dynamics under a given set of conditions; future work could explore how lateral flow directions and magnitudes transition from the rising limb to the falling limb of a flood event.
5.2 Controls imposed by bluffs
While river bank topography has been shown in many contexts to be an important control on lateral exchanges during sub-bankfull flows (Byrne et al., 2019; Czuba et al., 2019; Lindroth et al., 2020; Tull et al., 2022; van der Steeg et al., 2023), this study is the first to show that bluffs along the river are even stronger controls on where and how much water moves between the river and the floodplain. The bluffs function as break points for the floodplain, as no floodplain exists between the high bluff topography and the river. Thus, any water that does not infiltrate or leave the floodplain via other means is forced to return back to the river upstream of the bluff (Figures 5, 10). Furthermore, these return locations are typically adjacent to deep floodplain basins where water collects upstream of the bluff (Figures 7, 9, 10).
Along the Trinity River, including the reaches upstream of the study region, the valley width oscillates in such a way that there is no instance of two bluffs directly across from each other. At the northern boundary of the model domain, the city of Liberty is located on a bluff on the east side of the river while the west floodplain continues north from the domain (there is a highway embankment at the domain boundary, but there are several culverts that pass floodwaters underneath). The uneven distribution of bluffs along the river is counterbalanced by an uneven distribution of deep floodplain basins. These basins represent vast reservoirs that support ecosystems and remove nutrients from river water (Castillo, 2020), and the travel times through these basins can be several hundreds of hours (Figures 11, 12). This oscillatory pattern is extremely evident from the model results of inundation volume in river bank zones (Figure 9), where there are no locations where inundation volumes are high on both sides of the river. The high water volumes at these return flow locations are in contrast to the lesser volumes in the river bank zones where water moves to the floodplain. This discrepancy highlights the different flow mechanisms associated with outflow and return flow locations, where the former tends to be channelized flow or flow through smaller gaps in the levee and the latter tends to be unchannelized flow. Although there are large floodplain channels at each of the return flow locations within the study area, it is likely that these channels function as simple tributaries under non-flood conditions, bringing direct runoff from the floodplain to the river. Of course, water also flows into the river through these channels under flood conditions, but high inundation volumes associated with these locations during flood conditions indicate that return flow occurs over a wider area and not just through the channels themselves.
At higher discharges, floodplain residence times vary over two orders of magnitude, depending on the proximity to a bluff that a particle enters the floodplain. For the section of floodplain downstream of the last bluff, residence times are much less dependent on lateral flux location. Deep water that collects just upstream of bluffs creates a slow moving environment that increases residence times, and therefore particles entering upstream of those basins spend several hundreds of hours in the floodplain, while those entering much closer to the return flow location spend less than ten hours in the floodplain. This finding shows that two locations of lateral connectivity along a river reach may have very different functions. For example, a flux occurring far upstream from a bluff could have a disproportionate contribution to important floodplain processes like flood attenuation, water treatment, and fine sediment deposition. It is possible that a lateral connection closer to a bluff could have an equivalent flux magnitude toward the floodplain, but those waters “short-circuit” the floodplain basin too quickly to contribute meaningfully to the ecosystem.
5.3 Controls imposed by river bank topography
Bluffs are a major control on the locations of return flow to the river, and by extension, residence times in the floodplain. Still, variable river bank topography plays an important role in facilitating river-floodplain connectivity. While it is understood that gaps in the levee allow flow to move between the river and the floodplain at sub-bankfull river discharge, the results of this study show that there can be floodplain channels or other bank line gaps that impose more of a control on floodplain hydrodynamics than others. For example, the floodplain channel on the east side of bend 36 is a sort of break point feature that modifies the residence times for fluxes entering the floodplain downstream of that point (Figure 11). The Old River Cutoff remains a major control on the circulation in the delta (Figure 12, although this dynamic is partly a result of the influence of the USACE compound, see Section 5.4). Lastly, the largest gaps in the levee remain a first-order control on river-floodplain connectivity under lower discharge conditions, such as at 500 m3/s. Return flow locations are still bluff-adjacent under these conditions, but the distribution of outflow locations is limited to only the largest openings along the river bank. It is these features that extend the range of discharges at which the river is connected to its floodplain.
Furthermore, inundated area is not necessarily indicative of functional connectivity, whether the inundation is in the river bank zones or deeper in the floodplain. Fluxes between the river and floodplain can occur through narrow channels within high levees that otherwise remain mostly dry. In other words, the areal extent of inundation in a river valley may not be indicative of active transport across the river-floodplain boundary, especially when water can arrive to the floodplain from other sources (Mertes, 1997; Tull et al., 2022). For almost all applications, it is critical to quantify the fluxes through or over the bank when evaluating the hydrological connectivity of a system.
5.4 Abrupt transition points in the system
The similarity in residence times for fluxes occurring downstream of CWA Bluff on the west side (Figures 12B, C) stands in stark contrast with the residence time distributions upstream of each of the three bluffs. CWA Bluff marks the point along the Trinity River where flow never returns to the main river, at least not for sub-bankfull discharges. Downstream of this point, the floodplain transitions to a connected system of rivers, lakes, and estuaries (Old River Lake, Figure 1), which represents an alternate conveyance pathway to the bay. In fact, this estuary has built out its own delta in the bay.
The existence of this delta that is somewhat separate from the main-thread Trinity River highlights two transition points within the system: CWA Bluff and the USACE control structure at Wallisville. The deltas formed by the Trinity River and the Old River are connected hydraulically via the Old River Cutoff, but the constriction at the control structure represents a discontinuity along the river that has likely prevented the delta from growing as a single system. Instead, a fraction of the flow exiting the control structure moves west through the Old River Cutoff, and at higher discharges, this flow diversion is significantly greater than the flow that continues through the Trinity River. This observation implies that there is a limited hydraulic capacity through the USACE compound and that the Old River Cutoff is a necessary feature for equalizing the discharge just downstream of the compound. The capacity of the channel here is also notable because the compound begins just downstream of one of the three major return flow locations along the river (Wallisville Bluff). Whereas just downstream of CWA Bluff and Moss Bluff there are locations where water can leave the river again, downstream of Wallisville Bluff the USACE compound embankments do not allow water to freely leave the river. In other words, water that returns to the river upstream of Wallisville Bluff cannot leave the river until it reaches the Old River Cutoff, where there is a high proportion of flow that leaves the river (Figure 10, bend 43, west side). Thus, the 6-rkm constriction of the channel through the USACE compound represents an abrupt system transition. Meanwhile, CWA Bluff represents a different kind of abrupt transition: a major change in topography where levees are larger downstream and outflows from the river eventually reach the Old River delta rather than the Trinity River delta.
The combination of a limited capacity through the USACE compound and the increased floodplain flows downstream of CWA Bluff compared to other points along the river (Figures 10B, C) results in a system where excess flow is diverted to the Old and Lost Rivers. As discharge increases, we see minimal changes in river bank inundation and lateral fluxes in the delta reach (Figures 8–10). This result is consistent with earlier findings that discharges of approximately 600 to 1,100 m3/s convert the Old River Lake into the primary pathway for freshwater to enter the bay (Lucena and Lee, 2022).
5.5 Insights for floodplain management
The findings from this study provide insights for the management of floodplain ecosystems. The oscillatory, down-valley pattern of river-floodplain fluxes and inundation (Figure 9, Section 5.2) illustrates a need to quantify connectivity on both sides of the river. Floodplain basins directly upstream of bluffs are deep and contain large volumes of water, but there are no locations were those deep basins are situated directly across the river from each other, because there are no bluffs situated directly across the river from each other. We also assume that floodplain ecosystems, including types of vegetation, soil types, and quantities of sequestered carbon, vary in the downstream direction. It is likely that the ecosystems in deep floodplain basins upstream of bluffs differ from those in drier areas farther upstream. This ecosystem heterogeneity in relation to the river valley structure is going to be dependent on a river bank with sufficient lateral connections on both sides of the river. Distinguishing floodplain ecosystems adjacent to bluffs with those farther upstream, as well as locations of river-floodplain fluxes along the river, should be considered in river restoration designs as an important feature of natural river systems.
The relationship between bluff proximity and residence times also has implications for the management of floodplains. Our results show that floodplain ecosystem services, such as nutrient removal, do not occur uniformly. Moreover, inundation and water movement through the floodplain depend critically on the location of valley constrictions, or bluffs. Certain areas of floodplains can be responsible for a disproportionate amount of water treatment and flood storage, as some locations of lateral exchange produce longer residence times in the floodplain while exchanges at other locations enter and leave the floodplain quickly. We recommend that these spatial differences be a factor in the decision-making process when development or other activity on the floodplain is under consideration.
5.6 Insights for river systems with similar characteristics
This study focuses on the hydraulics and topography of the lower Trinity River, but many other river systems share similar characteristics. The Sabine and Neches Rivers and even the smaller San Antonio and Mission Rivers are examples of other systems along the Texas coast where the main channel flows from one edge of the floodplain to the other as it moves downstream, and is bounded by oscillating floodplain segments and bluffs. It is likely that the delivery of water, sediment, and nutrients to the bays along the Texas coast is controlled by these similar topographic constraints. The location of the river with respect to the valley walls should be an important consideration for the management and study of many rivers in the region.
The results of this study have implications for systems outside of the region as well, including inland rivers and floodplains that were formed under very different geologic conditions. Recently studied floodplains in the midwest U.S. (East Fork White River, Indiana and Upper Sangamon River, Illinois) exhibit a similar dynamic of river positioning within the valley that certainly plays a role in how floodplain flow returns to the river (Czuba et al., 2019; Lindroth et al., 2020). Even though the East Fork White River floodplain consists of topography formed by glacial retreat (David et al., 2017), it remains a low-gradient river with similar variability in floodplain width. The management goals of this predominately agricultural floodplain may be different from those of the lower Trinity River, but the return flow and residence time dynamics are likely similar and of critical importance in each system. River valley structure is an important geomorphic control in many other river systems as well, such as the Lockyer Creek in Australia (Croke et al., 2013) and the Solimes-Amazon River in Brazil (Mertes et al., 1996); the current study provides an understanding of how floodplain flow dynamics change based on proximity to valley contractions.
Data availability statement
The models used in this study are open source and available freely. ANUGA is available at https://github.com/GeoscienceAustralia/anuga_core and dorado is available at https://github.com/passaH2O/dorado. Raw data and model files supporting the conclusions of this article will be made available by the authors, without undue reservation.
Author contributions
NT: Conceptualization, Data curation, Investigation, Methodology, Writing – original draft, Writing – review & editing. AM: Conceptualization, Writing – review & editing, Methodology. PP: Conceptualization, Writing – review & editing, Funding acquisition, Supervision.
Funding
The author(s) declare financial support was received for the research, authorship, and/or publication of this article. This work was supported by the National Science Foundation (grant no. EAR-2150975) and Texas Water Development Board (contract no. 2000012435). AM was supported by National Science Foundation Postdoctoral Fellowship (grant no. EAR-1952772). All modeling was performed using resources provided by the Extreme Science and Engineering Discovery Environment (XSEDE), which was supported by the National Science Foundation (grant no. ACI-1548562).
Acknowledgments
The authors acknowledge the Texas Advanced Computing Center (TACC) at the University of Texas at Austin for providing HPC resources that have contributed to the research results reported within this paper (http://www.tacc.utexas.edu). The authors would also like to acknowledge Jayaram Hariharan, Kyle Wright, Mariel Nelson, Hima Hassenruck-Gudipati, David Mohrig, Ben Hodges, and Tian Dong for their feedback on this research, as well as Dan Duncan, Marcy Davis, and Mariel Nelson for their help with field data collection.
Conflict of interest
The authors declare that the research was conducted in the absence of any commercial or financial relationships that could be construed as a potential conflict of interest.
Publisher's note
All claims expressed in this article are solely those of the authors and do not necessarily represent those of their affiliated organizations, or those of the publisher, the editors and the reviewers. Any product that may be evaluated in this article, or claim that may be made by its manufacturer, is not guaranteed or endorsed by the publisher.
Supplementary material
The Supplementary Material for this article can be found online at: https://www.frontiersin.org/articles/10.3389/frwa.2023.1306481/full#supplementary-material
References
Aufdenkampe, A. K., Mayorga, E., Raymond, P. A., Melack, J. M., Doney, S. C., Alin, S. R., et al. (2011). Riverine coupling of biogeochemical cycles between land, oceans, and atmosphere. Front. Ecol. Environ. 9, 53–60. doi: 10.1890/100014
Battin, T. J., Luyssaert, S., Kaplan, L. A., Aufdenkampe, A. K., Richter, A., and Tranvik, L. J. (2009). The boundless carbon cycle. Nat. Geosci. 2, 598–600. doi: 10.1038/ngeo618
Bracken, L. J., Wainwright, J., Ali, G., Tetzlaff, D., Smith, M. W., Reaney, S. M., et al. (2013). Concepts of hydrological connectivity: Research approaches, pathways and future agendas. Earth-Sci. Rev. 119, 17–34. doi: 10.1016/j.earscirev.2013.02.001
Byrne, C. F., Stone, M. C., and Morrison, R. R. (2019). Scalable flux metrics at the channel-floodplain interface as indicators of lateral surface connectivity during flood events. Water Resour. Res. 55, 9788–9807. doi: 10.1029/2019WR026080
Castillo, M. M. (2020). Suspended sediment, nutrients, and chlorophyll in tropical floodplain lakes with different patterns of hydrological connectivity. Limnologica 82, 125767. doi: 10.1016/j.limno.2020.125767
Cheng, F. Y., and Basu, N. B. (2017). Biogeochemical hotspots: Role of small water bodies in landscape nutrient processing. Water Resources Research 53, 5038–5056. doi: 10.1002/2016WR020102
Covino, T. (2017). Hydrologic connectivity as a framework for understanding biogeochemical flux through watersheds and along fluvial networks. Geomorphol. 277, 133–144. doi: 10.1016/j.geomorph.2016.09.030
Croke, J., Fryirs, K., and Thompson, C. (2013). Channel-floodplain connectivity during an extreme flood event: Implications for sediment erosion, deposition, and delivery. Earth Surf. Proc. Landf. 38, 1444–1456. doi: 10.1002/esp.3430
Czuba, J. A., David, S., Edmonds, D. A., and Ward, A. S. (2019). Dynamics of surface-water connectivity in a low-gradient meandering river floodplain. Water Resourc. Res. 55, 1849–1870. doi: 10.1029/2018WR023527
David, S. R., Edmonds, D. A., and Letsinger, S. L. (2017). Controls on the occurrence and prevalence of floodplain channels in meandering rivers. Earth Surf. Proc. Landf. 42, 460–472. doi: 10.1002/esp.4002
Gurnell, A. M., Corenblit, D., de Jalón, D. G., del Tánago, M. G., Grabowski, R. C., O'Hare, M. T., et al. (2016). A conceptual model of vegetation–hydrogeomorphology interactions within river corridors. River Res. Applic. 32, 142–163. doi: 10.1002/rra.2928
Hariharan, J., Wright, K., Moodie, A., Tull, N., and Passalacqua, P. (2023). Impacts of human modifications on material transport in deltas. Earth Surf. Dyn. 11, 405–427. doi: 10.5194/esurf-11-405-2023
Hariharan, J., Wright, K., and Passalacqua, P. (2020). dorado: a Python package for simulating passive Lagrangian particle transport in shallow-water flows. J. Open Source Softw. 5, 2585. doi: 10.21105/joss.02585
Harvey, J., and Gooseff, M. (2015). River corridor science: Hydrologic exchange and ecological consequences from bedforms to basins. Water Resour. Res. 51, 6893–6922. doi: 10.1002/2015WR017617
Hassenruck-Gudipati, H. J., Passalacqua, P., and Mohrig, D. (2022). Natural levees increase in prevalence in the backwater zone: Coastal Trinity River, Texas, USA. Geology 50, 1068–1072. doi: 10.1130/G50011.1
Helton, A. M., Poole, G. C., Payn, R. A., Izurieta, C., and Stanford, J. A. (2014). Relative influences of the river channel, floodplain surface, and alluvial aquifer on simulated hydrologic residence time in a montane river floodplain. Geomorphology 205, 17–26. doi: 10.1016/j.geomorph.2012.01.004
Hiatt, M., Castaneda-Moya, E., Twilley, R., Hodges, B. R., and Passalacqua, P. (2018). Channel-island hydrological connectivity affects exposure time distributions in a coastal river delta. Water Resourc. Res. 54, 2212–2232. doi: 10.1002/2017WR021289
Hiatt, M., and Passalacqua, P. (2015). Hydrological connectivity in river deltas: The first-order importance of channel-island exchange. Water Resourc. Res. 51, 2264–2282. doi: 10.1002/2014WR016149
Holland, J. F., Martin, J. F., Granata, T., Bouchard, V., Quigley, M., and Brown, L. (2004). Effects of wetland depth and flow rate on residence time distribution characteristics. Ecol. Eng. 23, 189–203. doi: 10.1016/j.ecoleng.2004.09.003
Hughes, F. M. R., Adams, W. M., Muller, E., Nilsson, C., Richards, K. S., Barsoum, N., et al. (2001). The importance of different scale processes for the restoration of floodplain woodlands. Regul. Riv. 17, 325–345. doi: 10.1002/rrr.656
Kaushal, S. S., Groffman, P. M., Mayer, P. M., Striz, E., and Gold, A. J. (2008). Effects of stream restoration on denitrification in an urbanizing watershed. Ecol. Applic. 18, 789–804. doi: 10.1890/07-1159.1
Kondolf, G. M., Boulton, A. J., O'Daniel, S., Poole, G. C., Rachel, F. J., Stanley, E. H., et al. (2006). Process-based ecological river restoration: Visualizing three-dimensional connectivity and dynamic vectors to recover lost linkages. Ecol. Soc. 11, 17. doi: 10.5751/ES-01747-110205
Kufel, L., and Leśniczuk, S. (2014). Hydrological connectivity as most probable key driver of chlorophyll and nutrients in oxbow lakes of the Bug River (Poland). Limnologica 46, 94–98. doi: 10.1016/j.limno.2013.10.008
Liang, M., Geleynse, N., Edmonds, D. A., and Passalacqua, P. (2015a). A reduced-complexity model for river delta formation - Part II: Assessment of the flow routing scheme. Earth Surf. Dyn. 3, 87–104. doi: 10.5194/esurf-3-87-2015
Liang, M., Voller, V. R., and Paola, C. (2015b). A reduced-complexity model for river delta formation - Part I: Modeling deltas with channel dynamics. Earth Surf. Dyn. 3, 67–86. doi: 10.5194/esurf-3-67-2015
Lindroth, E. M., Rhoads, B. L., Castillo, C. R., Czuba, J. A., Güneralp, I., and Edmonds, D. (2020). Spatial variability in bankfull stage and bank elevations of lowland meandering rivers: relation to rating curves and channel planform characteristics. Water Resour. Res. 56, e2020WR027477. doi: 10.1029/2020WR027477
Lucena, Z., and Lee, M. T. (2022). Distribution of streamflow, sediment, and nutrients entering Galveston Bay from the Trinity River, Texas, 2016-19. Technical report, US Geological Survey. doi: 10.3133/sir20225015
Mason, J., and Mohrig, D. (2018). Using time-lapse lidar to quantify river bend evolution on the meandering coastal Trinity River, Texas, USA. J. Geophys. Res. 123, 1133–1144. doi: 10.1029/2017JF004492
Mason, J., and Mohrig, D. (2019). Scroll bars are inner bank levees along meandering river bends. Earth Surf. Proc. Landf. 44, 2649–2659. doi: 10.1002/esp.4690
Melack, J. M., and Forsberg, B. (2001). “Biogeochemistry of Amazon floodplain lakes and associated wetlands,” in Biogeochemistry of the Amazon Basin and its Role in a Changing World, eds. M. E. McClain, R. L. Victoria, and J. E. Richey (New York: Oxford University Press), 235–276. doi: 10.1093/oso/9780195114317.003.0017
Mertes, L. A. K. (1997). Documentation and significance of the perirheic zone on inundated floodplains. Water Resourc. Res. 33, 1749–1762. doi: 10.1029/97WR00658
Mertes, L. A. K., Dunne, T., and Martinelli, L. A. (1996). Channel-floodplain geomorphology along the Solimões-Amazon River, Brazil. Geol. Soc. Am. Bull. 108, 1089–1107. doi: 10.1130/0016-7606(1996)108<1089:CFGATS>2.3.CO;2
Mitsch, W. J., BBernal, B., Nahlik, A. M., Mander, Ü., Zhang, L., Anderson, C. J., et al. (2013). Wetlands, carbon, and climate change. Landscape Ecol. 28, 583–597. doi: 10.1007/s10980-012-9758-8
Mungkasi, S., and Roberts, S. G. (2011). “A finite volume method for shallow water flows on triangular computational grids,” in Proceedings 2011 International Conferences Advanced Computer Science and Information System (ICACSIS) (IEEE), 79–84.
Mungkasi, S., and Roberts, S. G. (2013). “Validation of ANUGA hydraulic model using exact solutions to shallow water wave problems,” in Journal of Physics: Conference Series 423. doi: 10.1088/1742-6596/423/1/012029
Nielsen, O., Roberts, S., Gray, D., McPherson, A., and Hitchman, A. (2005). “Hydrodynamic modelling of coastal inundation,” in Proceedings of MODSIM 2005.
Noe, G. B., and Hupp, C. R. (2005). Carbon, nitrogen, and phosphorus accumulation in floodplains of Atlantic Coastal Plain rivers, USA. Ecol. Applic. 15, 1178–1190. doi: 10.1890/04-1677
Noe, G. B., and Hupp, C. R. (2009). Retention of riverine sediment and nutrient loads by coastal plain floodplains. Ecosystems 12, 728–746. doi: 10.1007/s10021-009-9253-5
Noe, G. B., Hupp, C. R., and Rybicki, N. B. (2013). Hydrogeomorphology influences soil nitrogen and phosphorus mineralization in floodplain wetlands. Ecosystems 16, 75–94. doi: 10.1007/s10021-012-9597-0
Passalacqua, P. (2017). The Delta Connectome: a network-based framework for studying connectivity in river deltas. Geomorphology 277, 50–62. doi: 10.1016/j.geomorph.2016.04.001
Passalacqua, P., Belmont, P., and Foufoula-Georgiou, E. (2012). Automatic geomorphic feature extraction from lidar in flat and engineered landscapes. Water Resour. Res. 48, W03528. doi: 10.1029/2011WR010958
Passalacqua, P., Do Trung, T., Foufoula-Georgiou, E., Sapiro, G., and Dietrich, W. E. (2010). A geometric framework for channel network extraction from LiDAR: Nonlinear diffusion and geodesic paths. J. Geophys. Res. 115, F01002. doi: 10.1029/2009JF001254
Phillips, J. D. (2010). Relative importance of intrinsic, extrinsic, and anthropic factors in the geomorphic zonation of the Trinity River, Texas. J. Am. Water Resour. Assoc. 46, 807–823. doi: 10.1111/j.1093-474X.2010.00457.x
Phillips, J. D., and Slattery, M. C. (2007). Downstream trends in discharge, slope, and stream power in a lower coastal plain river. J. Hydrol. 334, 290–303. doi: 10.1016/j.jhydrol.2006.10.018
Phillips, J. D., Slattery, M. C., and Musselman, Z. A. (2004). Dam-to-delta sediment inputs and storage, lower Trinity River, Texas. Geomorphology 62, 17–34. doi: 10.1016/j.geomorph.2004.02.004
Phillips, J. D., Slattery, M. C., and Musselman, Z. A. (2005). Channel adjustments of the lower Trinity River, Texas, downstream of Livingston Dam. Earth Surf. Proc. Landf. 30, 1419–1439. doi: 10.1002/esp.1203
Rathburn, S. L., Shahverdian, S. M., and Ryan, S. E. (2018). Post-disturbance sediment recovery: implications for watershed resilience. Geomorphology 305, 61–75. doi: 10.1016/j.geomorph.2017.08.039
Roley, S. S., Tank, J. L., and Williams, M. A. (2012). Hydrologic connectivity increases denitrification in the hyporheic zone and restored floodplains of an agricultural stream. J. Geophys. Res. 117, 1950. doi: 10.1029/2012JG001950
Seitzinger, S., Harrison, J. A., Böhlke, J., Bouwman, A., Lowrance, R., Peterson, B., et al. (2006). Denitrification across landscapes and waterscapes: a synthesis. Ecol. Applic. 16, 2064–2090. doi: 10.1890/1051-0761(2006)016[2064:DALAWA]2.0.CO;2
Sheibley, R. W., Ahearn, D. S., and Dahlgren, R. A. (2006). Nitrate loss from a restored floodplain in the lower Cosumnes River, California. Hydrobiologia 571, 261–272. doi: 10.1007/s10750-006-0249-2
Shen, Z., Törnqvist, T. E., Mauz, B., Chamberlain, E. L., Nijhuis, A. G., and Sandoval, L. (2015). Episodic overbank deposition as a dominant mechanism of floodplain and delta-plain aggradation. Geol. 43, 875–878. doi: 10.1130/G36847.1
Smith, V. B., Mason, J., and Mohrig, D. (2020). Reach-scale changes in channel geometry and dynamics due to the coastal backwater effect: the lower Trinity River, Texas. Earth Surf. Proc. Landf. 45, 565–573. doi: 10.1002/esp.4754
Sutfin, N. A., Wohl, E. E., and Dwire, K. A. (2016). Banking carbon: a review of organic carbon storage and physical factors influencing retention in floodplains and riparian ecosystems. Earth Surf. Proc. Landf. 41, 38–60. doi: 10.1002/esp.3857
Thoms, M. C. (2003). Floodplain-river ecosystems: lateral connections and the implications of human interference. Geomorphology 56, 335–349. doi: 10.1016/S0169-555X(03)00160-0
Tockner, K., Pennetzdorfer, D., Reiner, N., Schiemer, F., and Ward, J. V. (1999). Hydrological connectivity, and the exchange of organic matter and nutrients in a dynamic river-floodplain system (Danube, Austria). Freshwater Biol. 41, 521–535. doi: 10.1046/j.1365-2427.1999.00399.x
Tull, N., Passalacqua, P., Hassenruck-Gudipati, H. J., Rahman, S., Wright, K., Hariharan, J., et al. (2022). Bidirectional river-floodplain connectivity during combined pluvial-fluvial events. Water Resour. Res. 58, e2021WR030492. doi: 10.1029/2021WR030492
van der Steeg, S., Torres, R., Viparelli, E., Xu, H., Elias, E., and Sullivan, J. C. (2023). Floodplain surface-water circulation dynamics: Congaree River, South Carolina, USA. Water Resour. Res. 59, e2022WR032982. doi: 10.1029/2022WR032982
Wainwright, J., Turnbull, L., Ibrahim, T. G., Lexartza-Artza, I., Thornton, S. F., and Brazier, R. E. (2011). Linking environmental regimes, space and time: interpretations of structural and functional connectivity. Geomorphology 126, 387–404. doi: 10.1016/j.geomorph.2010.07.027
Walling, D., and Owens, P. (2003). The role of overbank floodplain sedimentation in catchment contaminant budgets. Hydrobiologia 494, 83–91. doi: 10.1023/A:1025489526364
Walling, D. E., Owens, P. N., and Leeks, G. J. (1998). The role of channel and floodplain storage in the suspended sediment budget of the River Ouse, Yorkshire, UK. Geomorphology 22, 225–242. doi: 10.1016/S0169-555X(97)00086-X
Ward, J. V., Tockner, K., and Schiemer, F. (1999). Biodiversity of floodplain river ecosystems: Ecotones and connectivity. Regul.Rivers 15, 125–139. doi: 10.1002/(SICI)1099-1646(199901/06)15:1/3<125::AID-RRR523>3.0.CO;2-E
Welti, N., Bondar-Kunze, E., Singer, G., Tritthart, M., Zechmeister-Boltenstern, S., Hein, T., et al. (2012). Large-scale controls on potential respiration and denitrification in riverine floodplains. Ecol. Eng. 42, 73–84. doi: 10.1016/j.ecoleng.2012.02.005
Wohl, E., Brierley, G., Cadol, D., Coulthard, T. J., Covino, T., Fryirs, K. A., et al. (2019). Connectivity as an emergent property of geomorphic systems. Earth Surf. Proc. Landf. 44, 4–26. doi: 10.1002/esp.4434
Wohl, E., Lininger, K. B., and Scott, D. N. (2018). River beads as a conceptual framework for building carbon storage and resilience to extreme climate events into river management. Biogeochemistry 141, 365–383. doi: 10.1007/s10533-017-0397-7
Wright, K., Hariharan, J., Passalacqua, P., Salter, G., and Lamb, M. P. (2022a). From grains to plastics: Modeling nourishment patterns and hydraulic sorting of fluvially transported materials in deltas. J. Geophys. Res. 127, e2022JF006769. doi: 10.1029/2022JF006769
Wright, K., Passalacqua, P., Simard, M., and Jones, C. E. (2022b). Integrating connectivity into hydrodynamic models: an automated open-source method to refine an unstructured mesh using remote sensing. J. Adv. Model. Earth Syst. 14, 3025. doi: 10.1029/2022MS003025
Keywords: floodplains, hydrological connectivity, lateral exchange, residence times, particle routing, levees, bluffs
Citation: Tull N, Moodie AJ and Passalacqua P (2024) River-floodplain connectivity and residence times controlled by topographic bluffs along a backwater transition. Front. Water 5:1306481. doi: 10.3389/frwa.2023.1306481
Received: 03 October 2023; Accepted: 01 December 2023;
Published: 08 January 2024.
Edited by:
Ronald Erwin Pöppl, University of Vienna, AustriaReviewed by:
Katherine B. Lininger, University of Colorado Boulder, United StatesHossein Hamidifar, Shiraz University, Iran
Copyright © 2024 Tull, Moodie and Passalacqua. This is an open-access article distributed under the terms of the Creative Commons Attribution License (CC BY). The use, distribution or reproduction in other forums is permitted, provided the original author(s) and the copyright owner(s) are credited and that the original publication in this journal is cited, in accordance with accepted academic practice. No use, distribution or reproduction is permitted which does not comply with these terms.
*Correspondence: Paola Passalacqua, cGFvbGFAYXVzdGluLnV0ZXhhcy5lZHU=