 Márcia M. G. Alcoforado de Moraes1*
 Gerald N. Souza da Silva2
 Marcelo Pereira da Cunha3
 Nilena B. M. Dias3
- 1Department of Economics, Economic-Integrated Management Research Group, Federal University of Pernambuco, Recife, Pernambuco, Brazil
- 2Civil Engineering Department, Laboratory of Water Resources, Federal University of Paraiba, João Pessoa, Brazil
- 3Department of Energy, School of Mechanical Engineering, University of Campinas, Campinas, Brazil
Achieving sustainable economic growth while preserving environmental balance demands efficient water allocation—especially in regions like Brazil’s Northeast, where sugarcane expansion may intensify water scarcity. In Pernambuco, one of Brazil’s driest states, irrigated sugarcane production has expanded significantly, effectively exporting “blue water” through ethanol and sugar. Using an integrated economic platform that links optimization models with Brazil’s 2011 regionalized input–output matrix, a hydro-economic diagnosis of four interlinked basins revealed that raw water use is heavily concentrated in the humid region. There, the sugar-ethanol complex—comprising irrigated sugarcane cultivation (sector 3), sugar manufacturing (14), and ethanol production (27)—dominates water consumption. Meanwhile, in the semi-arid region, the Water and Sewage sector (56), classified under Services, is the largest water user. Despite accounting for the majority of raw water use, these sectors contribute relatively little to the region’s economic output. Simulations of market-based and non-market-based instruments under a scarcity scenario were used to evaluate economic reallocation trade-offs. The market-based reallocation slightly increased reservoir storage (851.6 vs. 847.5 Mm3) and boosted economic returns by Brazilian Reais 199 million (BRL 12,892 vs. 12,693), but reduced demand satisfaction levels (75.6% vs. 78.7%), equivalent to approximately 35 Mm3 less water use. This reduction stemmed from an 83.6 Mm3 cut to irrigated agriculture, with reallocations of +19.1 Mm3 to Industry and +28.4 Mm3 to Services, generating returns of +BRL 77.75 million and +130.08 million, respectively. The greatest losses in agriculture occurred in the humid region (−79.99 Mm3; −BRL 9.54 million), while the Services sector in the semi-arid region, especially sector 56, saw the largest gains (+21.27 Mm3; +BRL 83.2 million). Industrial sectors 14 and 27 also benefited, offsetting agricultural losses in the humid zone. However, in the semi-arid region, sugarcane (3) remained inefficient despite its growing share. Although the sugar-ethanol sector consumes ~53% of water, it contributes less than 12% of GDP. These findings highlight the limitations of relying solely on economic instruments to promote efficiency. Effective water governance requires alignment with land-use policies—particularly in water-scarce regions—where unregulated sugarcane expansion may displace more efficient crops and hinder broader development strategies such as urbanization and industrial diversification.
1 Introduction
1.1 Motivation
Uncertainty in water availability, along with increasing demand pressures and conflicts, underscores the importance of effective water allocation. This has shifted the focus of integrated water management toward the concept of Integrated Water Resources Allocation and Management (IWRAM) (Allan, 2003). The feasibility of economic growth and the sustainability of future environmental conditions depend on the proper allocation of water among economic sectors. This is particularly crucial in developing countries, where water resources face mounting pressures, including rising agricultural demand, urban expansion, and deteriorating water quality, within a context of weak law enforcement and imbalance of political power. The Brazilian sugarcane agro-industrial sector, which involves sugar and ethanol production from sugarcane, exemplifies these challenges due to its high water consumption and partial operation in water-scarce regions.
Moreover, it illustrates the interdependencies among food (land), energy, and water systems (FEWS). A fundamental scientific understanding is increasingly necessary, given the growing importance of ensuring the sustainable and secure provision of these essential resources. The FEW nexus introduces new dimensions to classical hydrologic problems, making some of these longstanding issues more complex. This complexity aligns with the objectives of Integrated Water Resources Allocation and Management (IWRAM), which the nexus framework complements and reinforces (Cai et al., 2018).
In Brazil, sustainable water management and allocation are critical for bioenergy production and its potential expansion. The growing global demand for first- and second-generation biofuels, particularly within international climate change mitigation policies, could negatively impact blue and gray water resources in specific regions (Castillo et al., 2017). This may also lead to shifts in the economic valuation of water, especially in the Northeast of Brazil (NEB), where bioenergy expansion could aggravate existing water shortages.
The liberalization of agricultural trade can either mitigate or exacerbate water scarcity, depending on management strategies (Schmitz et al., 2013). In cases where liberalization worsens scarcity, agricultural exports may gain a comparative advantage due to the failure of water pricing to reflect local water scarcity in irrigation costs (Biewald et al., 2014). This lack of internalization results in overexploitation and unsustainable development.
Situated in the NEB, Pernambuco is one of the driest states in Brazil. Pernambuco has expanded sugarcane irrigation for ethanol production, effectively making it a virtual exporter of “blue” water to meet domestic biofuel demands, including those of water-rich states (Castillo et al., 2017). Currently, with water costs unaccounted for as a production factor, irrigated sugarcane remains economically viable compared to other crops and activities, exacerbating competition for limited resources. At the same time, the region has received significant public investments in water infrastructure, such as the São Francisco River Interbasin Water Transfer Project (PISF) (Souza Da Silva et al., 2021). These investments are essential for ensuring water security across temporal and spatial scales, following a supply-side management strategy. However, this approach urgently needs to be complemented by demand-side management, including water allocation policies aligned with the IWRAM concept.
Without management policies and instruments that consider the economic valuation of water as a measure of scarcity, particularly in the sugarcane-ethanol sector, bioenergy expansion could further exacerbate water stress. Proper regulation can incentivize more efficient water use, encouraging producers to adjust crop selection or invest in advanced irrigation technologies. Additionally, the introduction of market-based water management instruments, such as charging and water markets in critical scenarios, could further enhance regulatory effectiveness in Brazil.
Water charging is currently the only economic allocation instrument permitted under Brazilian Law No. 9433/97, and even so, it remains only partially implemented across the country. In fact, only 55 state-level river basins had implemented pricing mechanisms, out of more than 200 established basin committees. At the federal level, only 6 out of 10 basins had adopted the instrument. Even among those that have implemented water pricing, the majority set raw water prices primarily with revenue-generation objectives, which fails to promote efficient economic behavior and thus does not fulfill the intended purpose of the instrument. Another economic allocation instrument currently under discussion for inclusion in Brazilian legislation is water market. Although not yet legally permitted, Bill No. 495/2017 is under review and aims to regulate water trading as an additional tool to promote efficient allocation, particularly in the context of water scarcity and crisis situations.
Effective water regulation, specially through economic allocation instruments, requires technological support, including analytical tools, economic models, and Spatial Decision Support Systems (SDSS) to enhance decision-making. These tools must accurately simulate real systems and assess local and regional impacts of various water allocation strategies and instruments under rising demand and uncertain supply. Evaluating these impacts across socioeconomic and hydrological dimensions is essential, with results and trade-offs presented through user-friendly interfaces for decision-makers. Additionally, this technology facilitates stakeholder engagement, fostering awareness of the broader consequences of water allocation decisions.
1.2 A multiobjective approach using economic and hydrological criteria for water allocation decisions as a decision-support tool in evaluating non-market- and market-based water management instruments
Especially in developing countries, Integrated Water Resources Allocation Management (IWRAM) has been considered a Wicked Water problem as defined by Beutler (2016), given the complexity of trade-offs among uses. Technology and economics are determinants of pathways to solutions of wicked water problems (Megdal et al., 2017), as are processes for working with and through stakeholders. Economics provides important concepts and theoretical foundations for solving water conflicts, as it seeks to implement an optimal allocation of scarce resources and considers their social implications (Acemoglu, 2015). Although characterized as an economic problem, water distribution policies have been predominantly based on theoretical foundations of engineering and hydrology, leading to inefficiencies and overutilization of the resource.
This study will present the most recent results obtained from an integrated economic platform developed in the context of interdisciplinary and interinstitutional research projects funded by Brazilian agencies: (i) National Council for Scientific and Technological Development (CNPq -Conselho Nacional de Desenvolvimento Científico e Tecnológico.) in the period 2012 to 2018; and (ii) National Water and Basic Sanitation Agency (ANA-Agência Nacional de Águas e Saneamento Básico) managed by Coordination for the Improvement of Higher Education Personnel (CAPES—Coordenação de Aperfeiçoamento de Pessoal de Nível Superior) during 2018 to 2023. The idea was to make integrated water-economy models available through a Spatial Decision Support System (SDSS—HEAL System) (Souza Da Silva et al., 2021), that is a water allocation policy evaluation tool intended to be supportive for modelers, decision makers, and stakeholders.
As will be described in further detail in section 2.1, three optimization models were developed using the Spatial Decision Support System (SDSS) named HEAL—Hybrid-Economic Allocation System, based on a node-link network, including more than 700 nodes, representing four interlinked basins in Agreste of Pernambuco, the region with the worst water balance in Brazil. These were developed and made available within an integrated platform that included an interregional input–output matrix (IOM) based on a Brazilian input–output matrix for 2011 (Guilhoto et al., 2010), representing the 76 economic sectors in each of the 75 regions of interest. The four interlinked basins are key river basins in the Agreste subregion, named after the Capibaribe, Ipojuca, Una and Sirinhaém rivers. The basins have critical water balances and increasing water transfer needs.
There are two optimization models that represent allocation strategies based on hydrological criteria, and are able to simulate the effect of command-and-control water management instruments. A third model represents an allocation based on economic criteria simulating a market-based instrument. The decision variables for the three optimization models are the same, with the primary ones being the allocated water volumes per user and per month during a scarcity period (2011–2013) in the four interlinked basins. These water distributions, governed by conflicting criteria, illustrate the effects of applying both non-market-based (hydrological criteria) and market-based (economic criteria) management instruments. The decisions during this 3-year period are very important as this was the initial time of an extended drought period that affected the Agreste region and economy until 2018. By 2017, around 60 cities within Agreste region had suffered collapse of their water systems and started to depend on supply from water trucks. Previous results (de Alcoforado Moraes et al., 2021) using the same integrated platform, compared impacts of strategies using only hydrological criteria.
The objective of this study is to simulate both market-based and non-market-based water allocation instruments as optimization problems using an integrated modeling platform. This approach allows for a comprehensive analysis of their hydrological and economic impacts. By incorporating an economic allocation strategy into the model, it becomes possible to compare the outcomes of market and non-market instruments not only in terms of traditional hydrological indicators, such as water security and reservoir levels, but also in terms of economic performance. The model’s primary decision variables are the volumes of water allocated to each user on a monthly basis. In addition to these allocations, the model generates key hydrological outputs such as reservoir storage levels, river flows, and demand satisfaction rates. Furthermore, socioeconomic indicators—including Gross Domestic Product (GDP), employment, and sectoral production—are integrated into the analysis, enabling a more holistic evaluation of the trade-offs involved in different water management strategies.
In order to obtain a better comparison of all those results, we decided to use the Pareto optimality framework, as a tool to combine and compare multiple objectives. The set of Pareto-optimal solutions forms a frontier where improving one criterion necessarily leads to trade-offs in at least one other objective. Consequently, these optimal solutions are also known as dominant solutions, and the Pareto frontier represents a compromise among competing objectives. By examining this frontier, it is possible to assess trade-offs—gains in one objective versus losses in another—by moving from one point to another along the curve. Explicit visualization of these trade-offs through graphical representation enables stakeholders to evaluate the impacts of different solutions on multiple objectives.
A three-dimensional Pareto surface was obtained using three optimization criteria simulated during the scarcity period: demand fulfillment percentage, reservoir storage levels, and economic returns. The measurement of trade-offs between these optimal allocation strategies can be derived from these results. Thus, multi-objective models serve as crucial decision-support tools in formulating water allocation policies and associated management instruments, non-market- and market-based, facilitating multi-criteria and interdisciplinary impact assessments.
The two hydrological criteria representing non-market-based instruments were to maximize demand fulfillment (Allocation Priority, AP) and to maximize reservoir storage levels (Storage Priority, SP). The economic criterion representing market-based allocation was to maximize economic returns (Economic/Efficiency Priority, EP). Since reservoir storage volumes under the AP and EP strategies were similar, their results could be directly compared to assess how additional water, which is not stored but allocated, impacts sectoral distribution and economic returns.
In summary, this study introduces an integrated economic-hydrological model that compares market-based and non-market-based water allocation under scarcity. Using a network optimization model and a regional input–output matrix for 76 economic sectors across 71 regions, it evaluates hydrological outcomes like reservoir storage and demand fulfillment, along with economic impacts and efficiency trade-offs. The three-dimensional Pareto surface visualizes sectoral and spatial effects of water policies. Unlike separate economic and hydrological assessments, this framework shows their interplay and highlights the potential and limits of economic tools for sustainable water use in developing regions.
Using this approach, it was possible to conduct a comprehensive hydro-economic assessment of water use and allocation strategies in a critically water-stressed region of Brazil, using an Integrated Economic Platform that merges optimization models with a regionalized Input–Output Matrix. The analysis revealed a disproportionate concentration of raw water use in the humid Mata region, primarily driven by the sugar-energy complex (irrigated sugarcane, sugar, and ethanol production). Meanwhile, in the semi-arid region, the Water and Sewage sector emerged as the principal user. Despite consuming large volumes, both the sugar-energy and public water supply sectors showed modest economic returns, underscoring inefficiencies in current allocation. The study also highlights a likely underestimation of the public supply sector’s economic value, as only the revenues of the water utility were considered, excluding broader societal benefits associated with providing treated water to urban populations and sectors.
Beyond diagnosis, the study simulates economic reallocation under water scarcity scenarios, comparing the impacts of market-based and non-market-based instruments. These simulations measured outcomes across three dimensions: reservoir storage, economic gains and losses, and water demand satisfaction. The reallocation led to significant cuts in water use by irrigated agriculture—especially in the humid region—while increasing allocations to Industry and Services, resulting in net economic gains. Water and Sewage Sector in the semi-arid region, in particular, experienced the largest increase in.
Developing countries often face greater challenges in implementing Integrated Water Resources Allocation and Management (IWRAM) principles due to increasing pressure on already scarce water supplies, driven by population growth, rapid urbanization, and climate change. Additionally, global demand for agricultural products is rising, while urban, domestic, and industrial water uses are increasingly at risk due to competition with agriculture, particularly in arid and semi-arid regions. In this context, the integrated economic platform proves to be a valuable tool for identifying trade-offs among water management instruments and supporting the design and evaluation of strategies that promote economically efficient water use.
However, the findings also indicate that economic instruments alone may be insufficient to promote structural transformation in water use, especially in regions historically reliant on inefficient irrigated agriculture. In the semi-arid portion of our study area, for instance, the market-based instrument led to an increased share of irrigated sugarcane—an uncompetitive and low-efficiency crop—due to a lack of viable alternatives in the agricultural mix. While efficient sectors such as Water and Sewage benefited from reallocations, outcomes in semi-arid sugarcane production did not improve. This underscores the importance of integrating land-use and water governance to align economic incentives with broader development goals. The main contribution of this study lies in demonstrating the potential of integrated modeling platforms to assess both hydrological and economic outcomes, while also exposing the institutional and structural limitations of relying solely on market mechanisms to achieve sustainable and equitable water management.
1.3 Study area: four interlinked basins at Agreste of Pernambuco state at Northeast of Brazil
The four interlinked basins (Capibaribe, Ipojuca, Una and Sirinhaém) include two climate zones, the Mata (humid costal area) and the Agreste (semiarid region). The Agreste is characterized by irregular rainfall and an annual precipitation to potential evapotranspiration ratio of 0.7. The main water sources of the Agreste region during drought periods are surface reservoirs. Although the Agreste region is not the driest area of the state in terms of water availability, it exhibits the worst water balance due to high demand and urgent needs for increased water supply.
The Agreste region of Pernambuco is home to approximately 2.25 million people (Brazilian Demographic Census published in 2017) is one of the most water-stressed areas in Brazil. Despite its semi-arid climate and limited water storage capacity, it has high water demand due to population density, urbanization, and irrigated agriculture. According to ANA (2020), irrigation accounted for 64% of water consumption in the Agreste in 2018, followed by human supply (21%) and industry (10%). However, these aggregated figures obscure severe local disparities: water supply services in many Agreste municipalities are intermittent, with low continuity and reliability, particularly during drought periods. According to National Sanitation Information System in Diagnosis of Water Services in 2020, the population served by piped water supply in the region is approximately 85%, but actual daily water availability is often limited to a few hours or days per week, especially in rural and peri-urban areas. During the 2012–2018 drought, more than 60 municipalities in the region experienced systemic supply collapse, relying on emergency water trucking for months at a time. These chronic service failures reflect not only physical water scarcity but also institutional fragility, and they have critical implications for water allocation strategies.
The Agreste region is located between the Mata and the Sertão, the latter being the driest region of the state (Figure 1). Despite having higher rainfall indices than the Sertão, the Agreste of Pernambuco has been termed the “New Sertão” as it was more impacted than the Sertão itself during the drought from 2012 to 2018, due to high demand combined with limited supply sources (de Alcoforado Moraes et al., 2021). The region is more densely populated than the Sertão and has low water storage capacity (Baker et al., 2016). Both regions, Sertão and Agreste, are both within the semiarid part of the state, occupying 88% of the state territory while concentrating 18 and 25% of the population of Pernambuco, respectively (IBGE—Brazilian Institute of Geography and Statistics, 2017). The per capita water availability ranges from 400 m3.year−1, in the Sertão, to 800 m3.year−1 in the Agreste. In this context, a major water diversion project named the São Francisco River Transboundary Project (SFTP). SFTP is expected to benefit the Agreste of Pernambuco from a supply of 8 m3.s−1 of water, destined to urban, rural, industrial, aquaculture, and irrigation demand, favoring a population of more than 2 million inhabitants (Guarenghi et al., 2023).
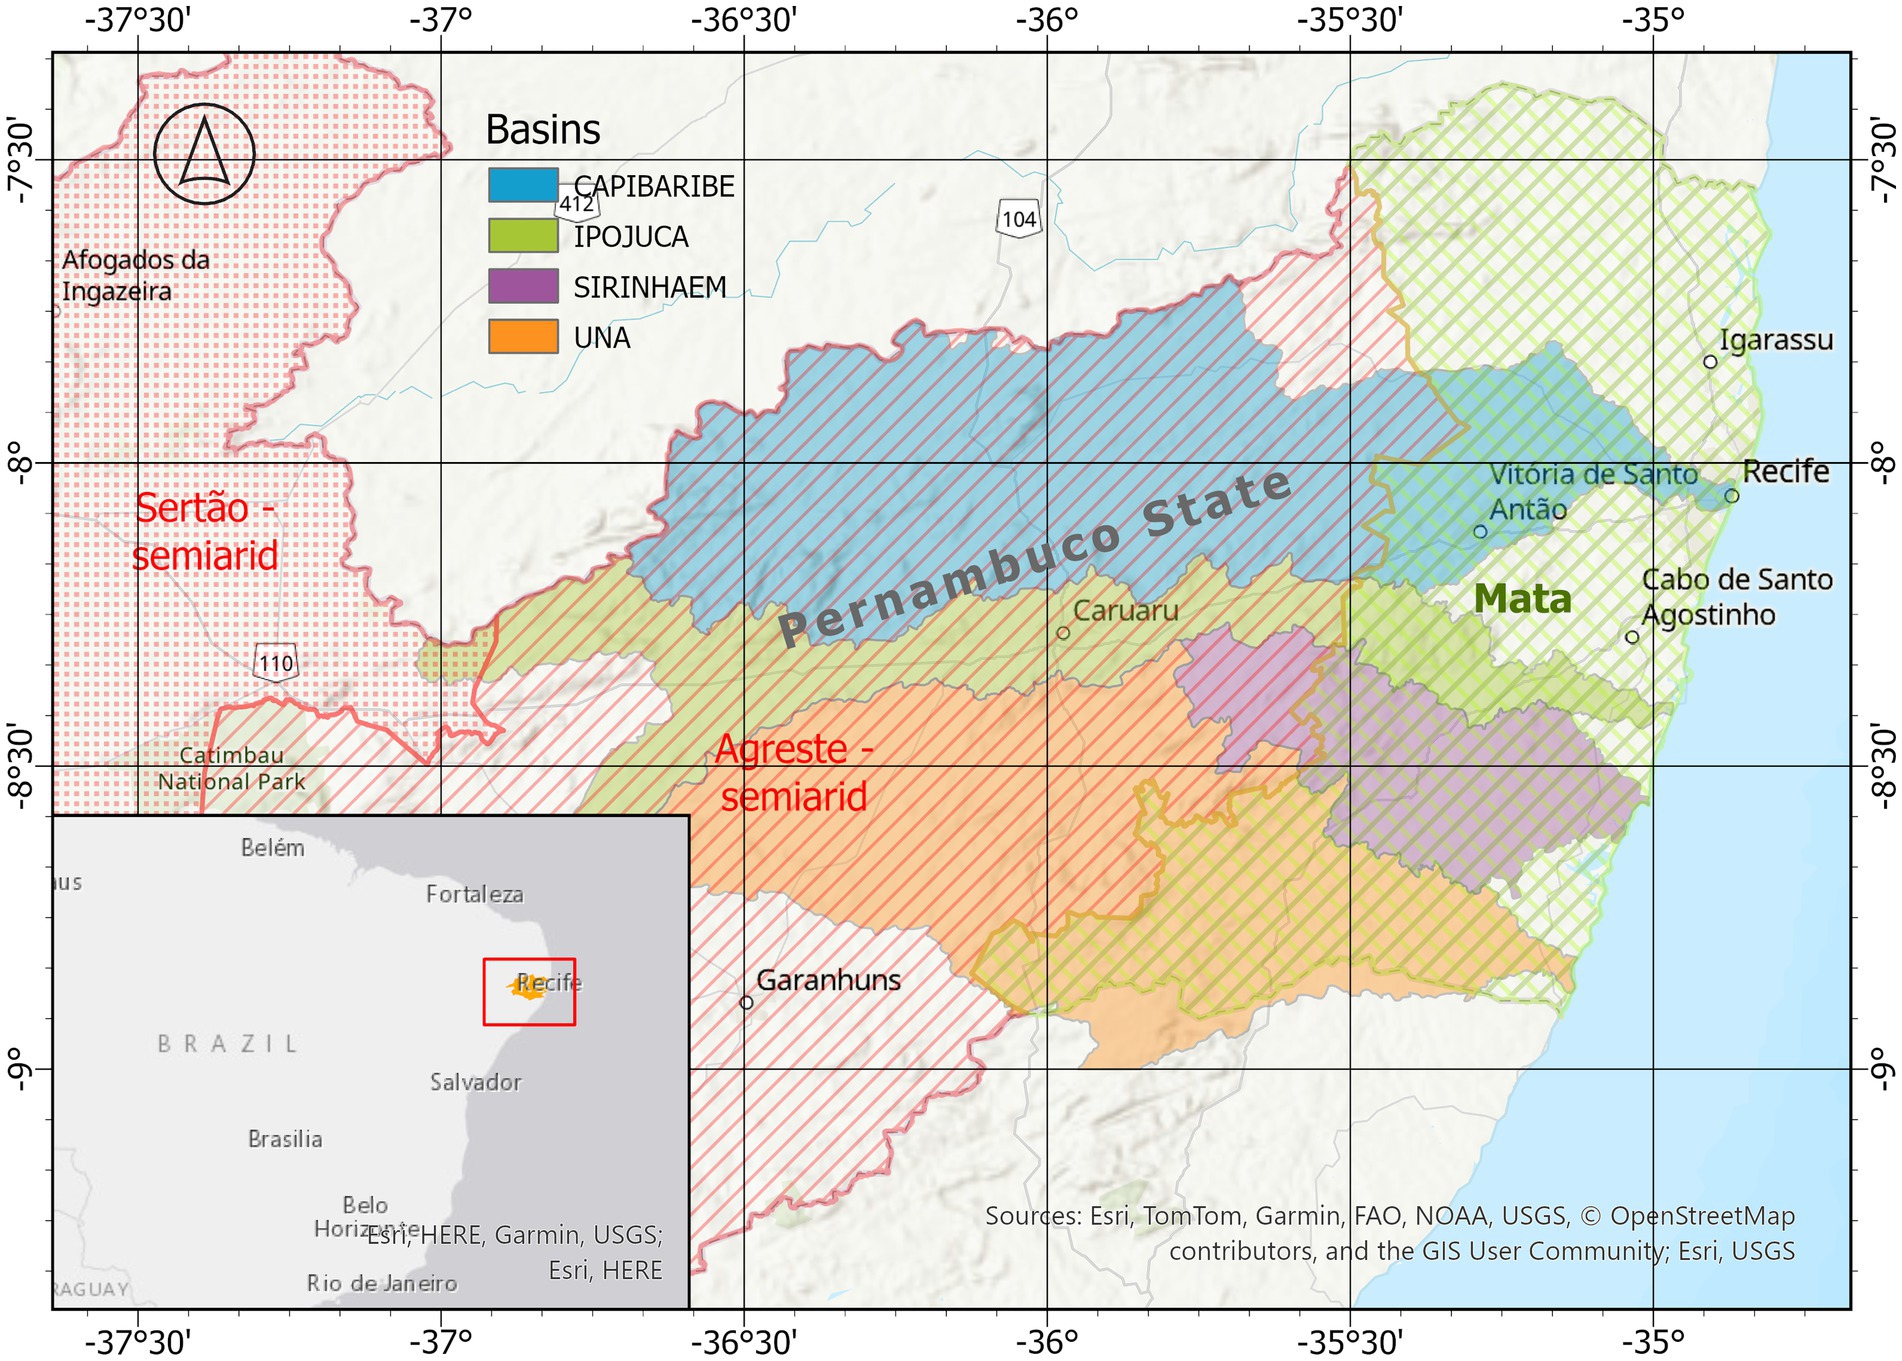
Figure 1. Four interlinked basins at Agreste of Pernambuco state at Northeast of Brazil (NEB).
In the analyzed basins, 288 distinct economic sectors, as classified by the National Classification of Economic Activities (CNAE 2.0—Classificação Nacional de Atividades Econômicas in Portuguese) database of Brazilian Institute of Geography and Statistics IBGE (Instituto Brasileiro de Geografia e Estatística) were identified. Additionally, 88 municipalities in the state of Pernambuco have at least a portion of their territory within one of the four modeled basins. The Input–Output Model (IOM) developed for the basins aggregates sectors and regions due to limitations in the number of elements included in the model.
As a result, 71 geographical regions were identified, which, in this study, are classified as ‘Mata’ and ‘Semiarid’ based on their respective climate zones. Additionally, 76 economic sectors were considered (we have called these microsectors). To align with the Food and Agriculture Organization (FAO, 2018) and the International Standard Industrial Classification (ISIC) of All Economic Activities, these sectors were further aggregated into three major categories: Irrigated Agriculture, Industry (MIMEC—Mining, Manufacturing, Energy, and Construction sectors or more simply Industrial sectors), and Services. We have called those 3 macrosectors.
These basins have been receiving considerable investments in water infrastructure and will be recipients of the SFTP. Due to the SFTP, it is estimated that areas of irrigated agriculture may significantly increase in the study area with the arrival of transposed water. Furthermore, existing legal impediments (Federal Law no. 6961, 2009) to sugarcane irrigation in the Northeast semi-arid region were recently removed by a federal decree signed on November 11th, 2019.
It is crucial in this study area that water distribution among crops within irrigated agriculture, as well as between irrigated agriculture and other economic sectors, be assessed considering both hydrological objectives and the economic returns of water use. This region should benefit from the development of water management instruments capable of implementing a distribution system that not only ensures water security but also provides incentives for more efficient use, prioritizing less water-intensive sectors with better efficiency indicators.
Increased knowledge from water economy models supporting the design of water management instruments for the region studied, as well as for other areas with critical water balances and transfer needs, can serve as a foundation for proposing policy reforms that effectively promote environmentally sustainable economic development. The integrated platform results developed in this study aim to broaden policymakers’ perspectives on the design and evaluation of water policies of this nature.
2 Materials and methods
2.1 The representation of water non-market- and market-based management instruments using an integrated economic platform
The Network-Based optimization model is an approach to solve water resource distribution problems and strategic planning. It is based on the representation of surface water distribution through a network, where the elements are interconnected through specific relationships. In this model, network elements are treated as nodes (Users, Reservoirs, Streams, Inflow) and the relationships between them as links. This network structure allows the creation of a mathematical model that captures the interactions and flows between the system components, enabling the search for the best solution for a given objective, such as maximizing reservoir storages, maximizing economic returns and meeting user demand.
Using a source code generation module in GAMS (General Algebraic Modeling System), made available through a friendly-user interface in the HEAL System (see Figure 2), non-linear optimization models were developed based on a node-link network, representing the four interlinked basins during a scarcity period (2011–2013). The node-link network generation was also supported by the SDSS through a dedicated node-link network generation module. This not only assisted in the spatial localization of nodes and their connections but also facilitated the acquisition of their hydrological and economic information. This was achieved through seamless integration and full compatibility with data available in the National Water Resources Information System (SNIRH – Sistema Nacional de Informações de Recursos Hídricos) as well as other sources, such as the state’s hydrological water rights databases and the IBGE.
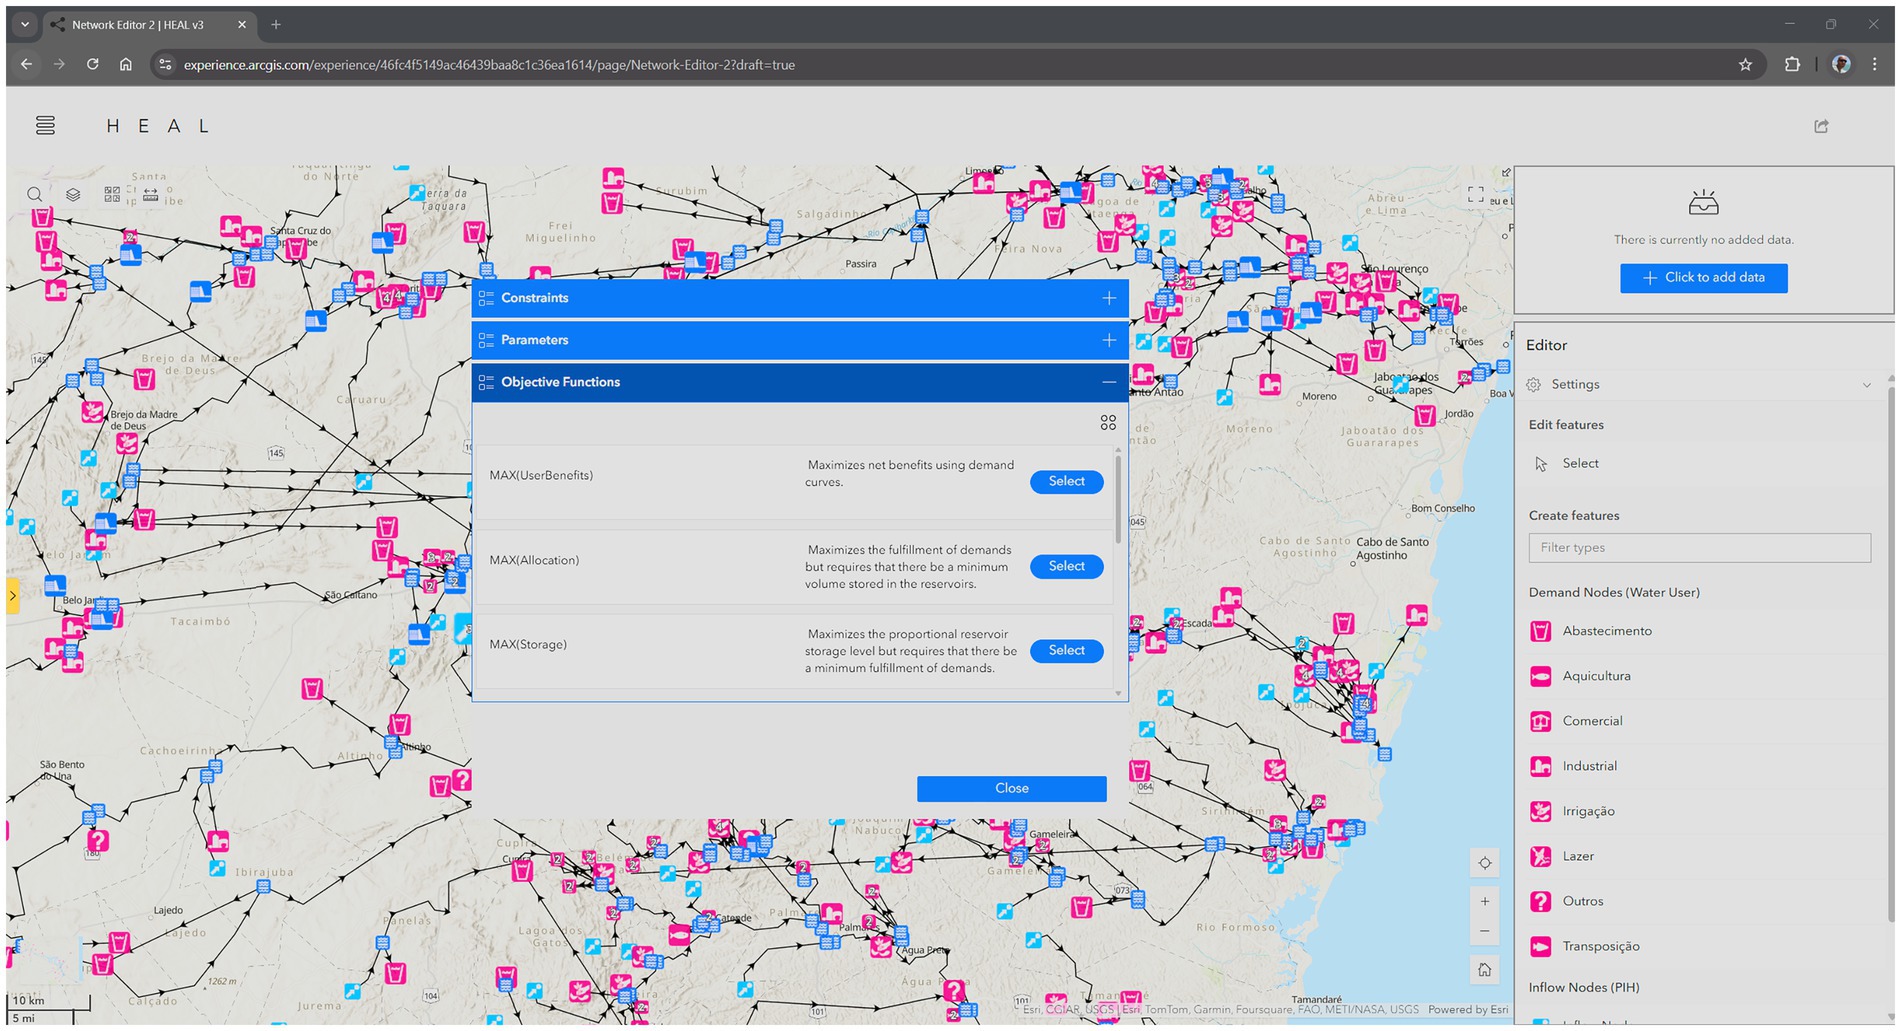
Figure 2. User interface in the source code generation module of the HEAL System.
An optimization model used the criterion of maximizing reservoir storage (Storage priority—SP). The other model used water demand (Allocation Priority—AP). These two, representing allocation strategies based on hydrological criteria, were able to simulate the effect of command-and-control or non-market-based water management instruments. The third model represented an allocation based on efficiency criteria (Efficiency Priority—EP), simulating a market-based management instrument.
Moreover, there was one more optimization model generated in the HEAL System in order to represent the allocation strategy that was actually implemented. For this, we used an optimization criterion that minimized the squared deviation of the difference between observed and result levels in reservoir storage after the distribution of water among users. This meant that the differences between observed values of reservoir levels month by month and year by year and the decided allocations could be minimized, in order to simulate the amount of water actually used during the first 3 years of the scarcity period (2011–2013). This was named the Business-As-Usual (BAU) allocation strategy.
The mathematical formulations of the optimization models, namely the objective functions (OF) and the associated constraints, are presented in Table 1. The OF values for the two allocation strategies simulating non-market-based instruments (AP and SP) rely solely on hydrological data and pursue objectives that consider only issues related to water security, without considering efficiency in resource use.
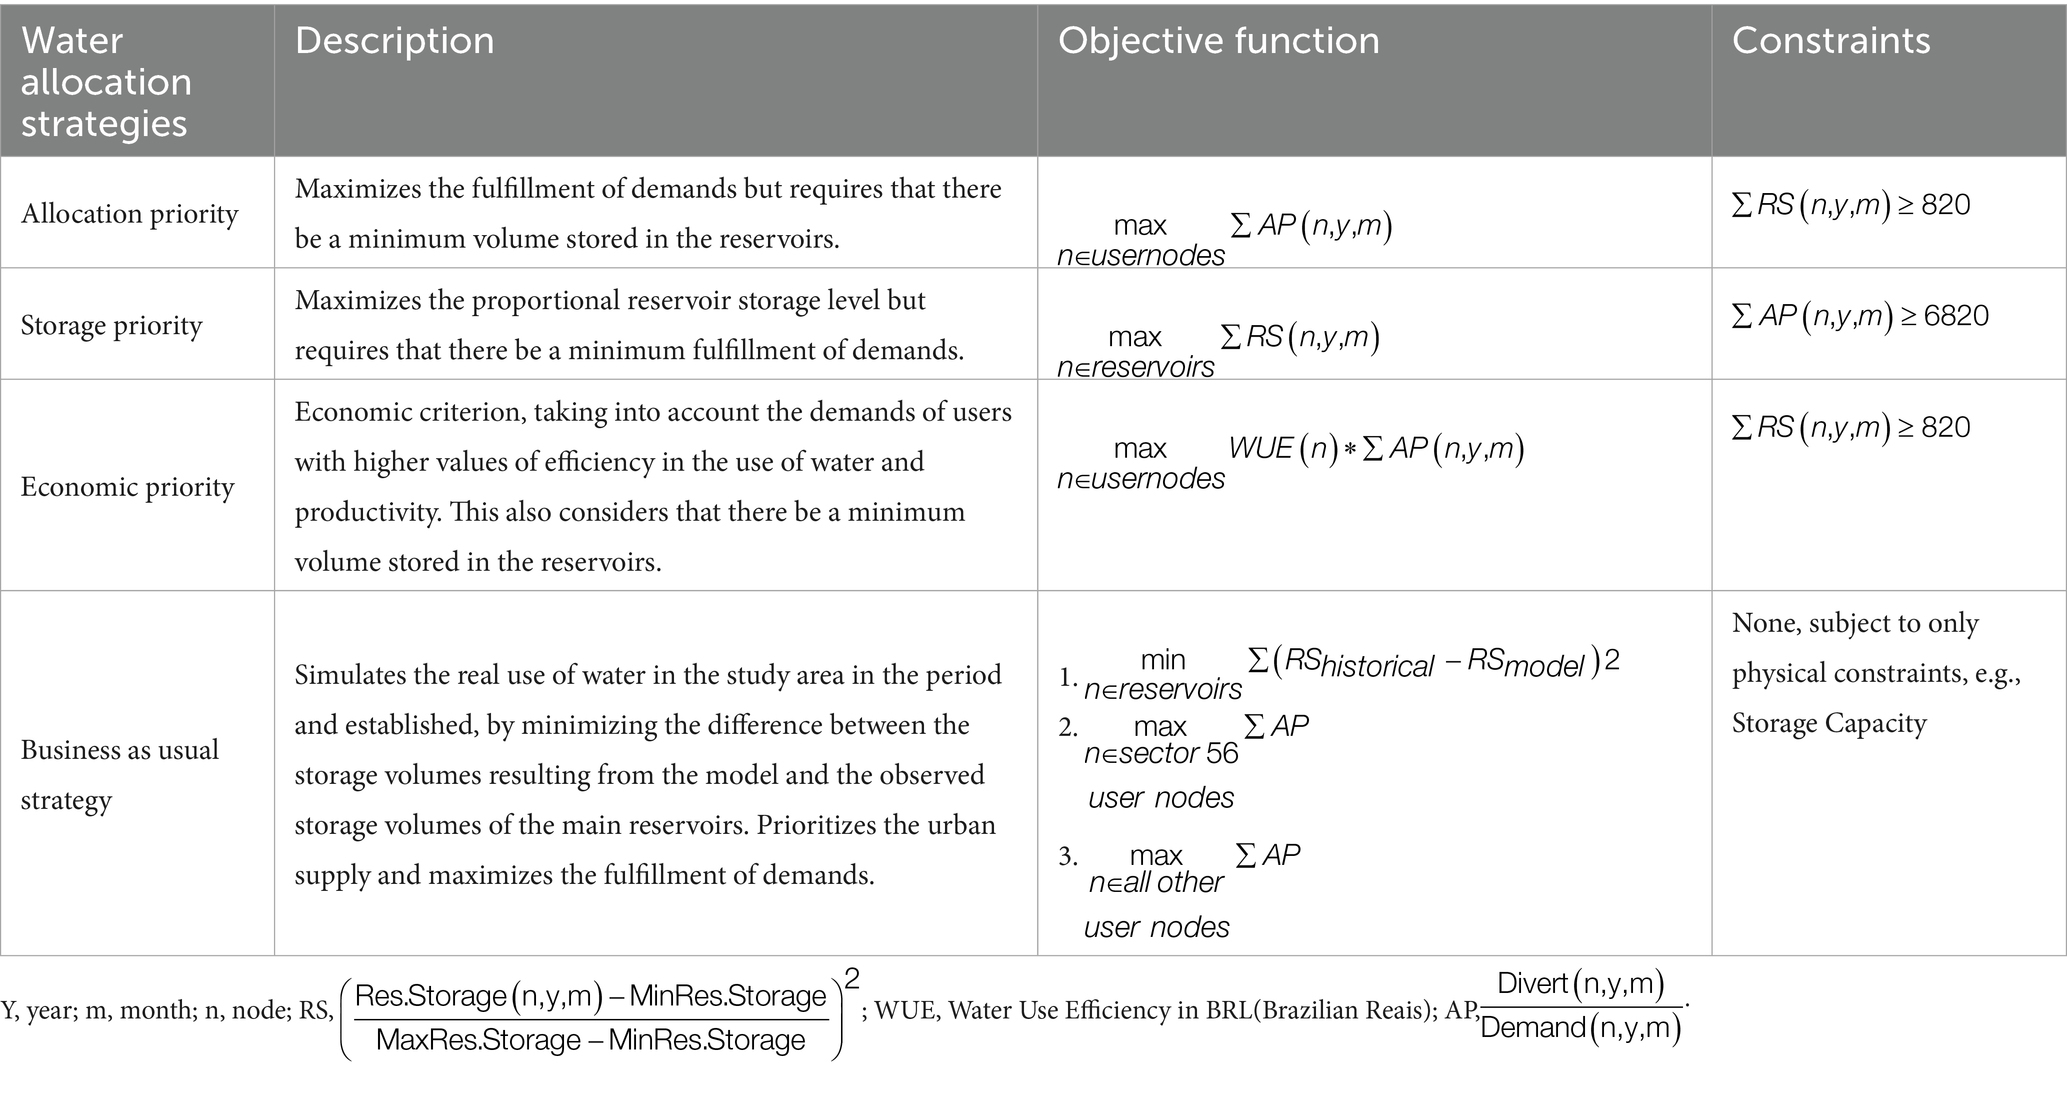
Table 1. Mathematical formulation associated with the optimization models of the simulated allocation strategies.
Regarding the constraints, in the case of the AP model, a minimum value of 820 (94.2% of the total storage capacity) was set for the total average stored volume over 3 years to prevent optimal solutions that could meet demand but would result in excessively low storage levels. This issue was actually observed in the real case simulated by the BAU model. The BAU allocation strategy met a high proportion of demand (95% of the total demand attendance), but resulted in a very low total average stored volume in the reservoirs (59.7%), which, in fact, led to the depletion of many reservoirs and caused significant economic losses, given that the period of water scarcity in the region extended beyond the studied period (2011–2013) until 2018. In the case of the strategy aimed at maximizing total stored volumes (SP—storage priority), a constraint was applied to the demand attendance percentage of 6,820 (82.4%). This constraint was necessary to ensure that some level of water demand would be met, even though the objective of the problem was to maximize the volumes stored in the reservoirs.
In addition to the hydrological information, efficiency indicators (WUE—Water Use Efficiency) for users (demand nodes) were required only for the EP (Efficiency/Economic Priority) model. These were derived from the Input–Output Matrix (IOM) within the model’s platform for the base year (2011), based on sector and regional indicators corresponding to each demand node, as is explained in the next paragraphs (see Figure 3).
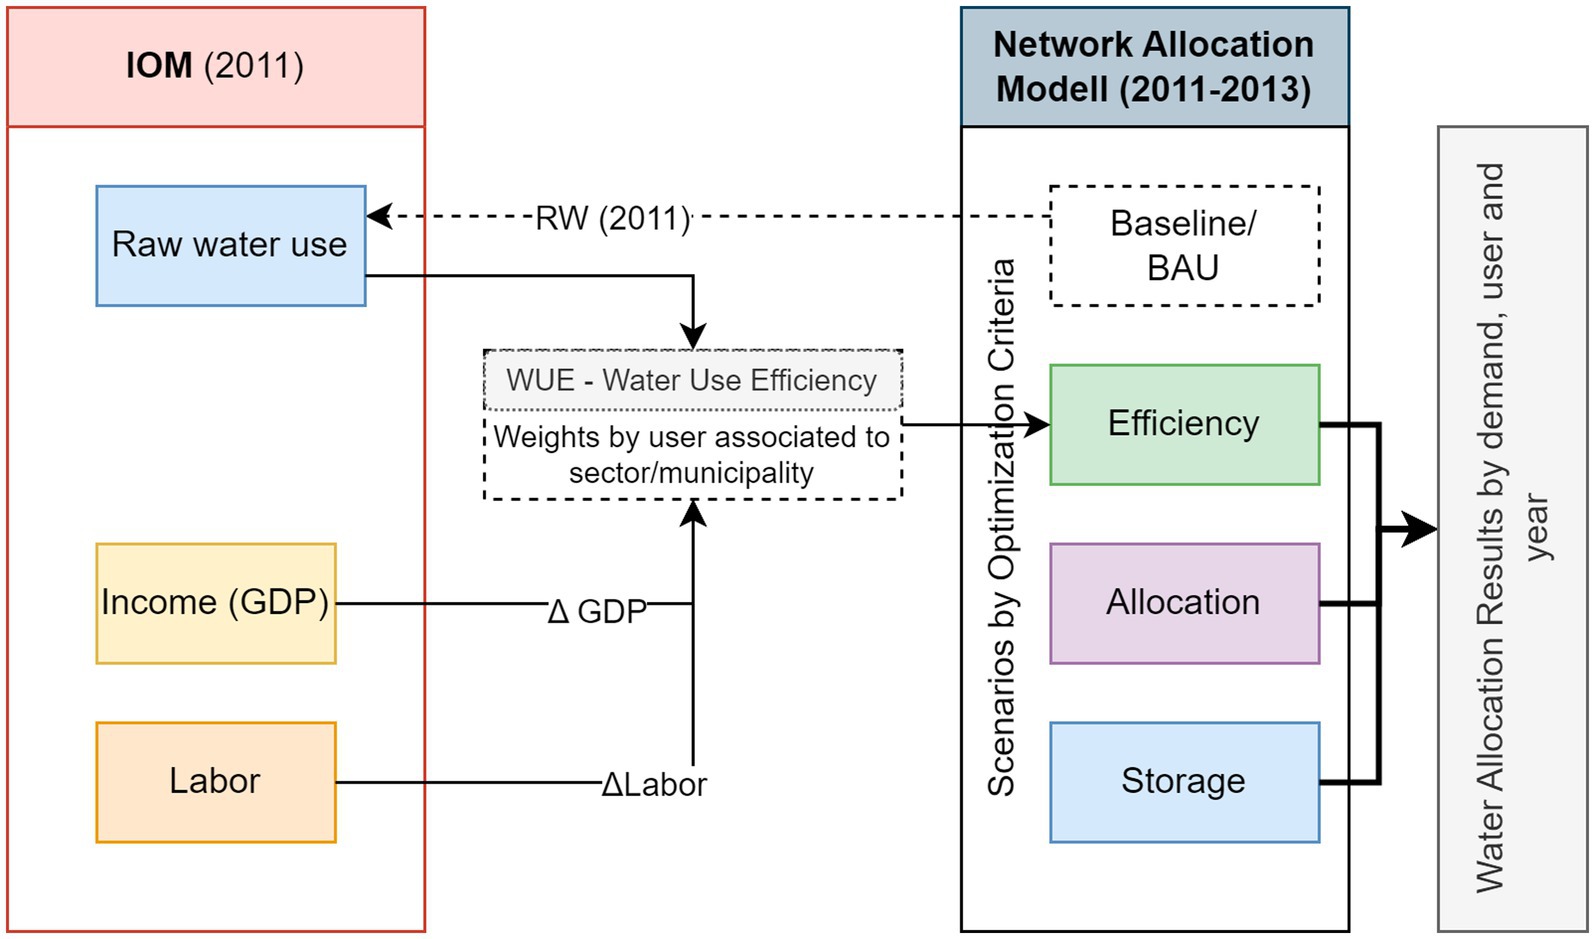
Figure 3. Integrated platform of the optimization models.
The IOM available in the integrated platform was prepared based on the Resource and Use Tables for the year 2011 (IBGE), constructed according to the methodology developed by Guilhoto et al. (2010). The estimated initial matrix presents an aggregation level of 76 sectors and 75 regions. Moreover, the interregional model used in this research describes the economic system not only in terms of interdependent industries, but also in terms of several interrelated regions. The aforementioned IOM is a hybrid matrix, as it includes a row representing water use in physical units. These values comes from the BAU’s results for 2011. These values are considered to be representative of the 2011 study area water use, given that the BAU for 2011 best exemplifies the situation of the reservoirs and the allocation policies used in that year, with priority for human supply. The integration between the two models is possible because there is a complete correspondence between the information on the network nodes (user demands) in the optimization model and the economic microsectors and regions in the IOM. Thus, the quantities of raw water used by each user can be aggregated and uniquely associated with each economic microsector and municipality in the IOM.
Incorporation of the values of the water allocated by the network-based model in the Business-as-usual strategy (BAU) in the IOM as a raw water vector in the IOM hybrid for the year 2011 enabled the production of the WUE indicator for each economic microsector and municipality. The indicator Water Use Efficiency (WUE) is obtained considering the ratio between the GDP [in Brazilian Reais (BRL)] of a region or economic activity, and its consumption of raw water (m3). Therefore, the WUE (BRL/m3) indicates the monetary value generated by the volume of water used. The higher the value of this indicator, the greater the efficiency in the use of water of the sector or region (FAO, 2018; Montoya and Finamore, 2020).
An adjustment was necessary in the calculation of the Water Use Efficiency (WUE) for the microsectors associated with agricultural production, specifically regarding the portion of sectoral production obtained through irrigation. In fact, the production and associated GDP of the main agricultural sectors considered in this study—Sugarcane (microsector 3), Fruit (4), and Other Crop Plants (5)—as obtained from the Resource and Use Tables for the Year 2011 (IBGE), do not differentiate between irrigated and rainfed production/GDP.
Therefore, an adjustment was made to these production/GDP values based on the proportion of irrigated area by crop type and municipality. The GDP was multiplied by this same proportion, disregarding the fact that irrigated crops are more productive. This adjustment provides a rough estimate of the GDP generated by these sectors through the use of blue water only, which is in fact the water allocated considered in this study.
These proportions were obtained from Tables 1013 and 1819 of the 2006 Agricultural Census conducted by Instituto Brasileiro de Geografia e Estatística (IBGE) (2006), which was the valid data base for the study period. The projected values for 2011 by municipality were then based on the latter and made available in the Annual Municipal Agricultural Production (PAM_Produção Agrícola Municipal 2011) dataset.1 The values thus derived and used in this study for adjusting GDP, aggregated into the main agricultural sectors of the study area (sectors 3, 4, and 5), are presented by municipality in Table 2.
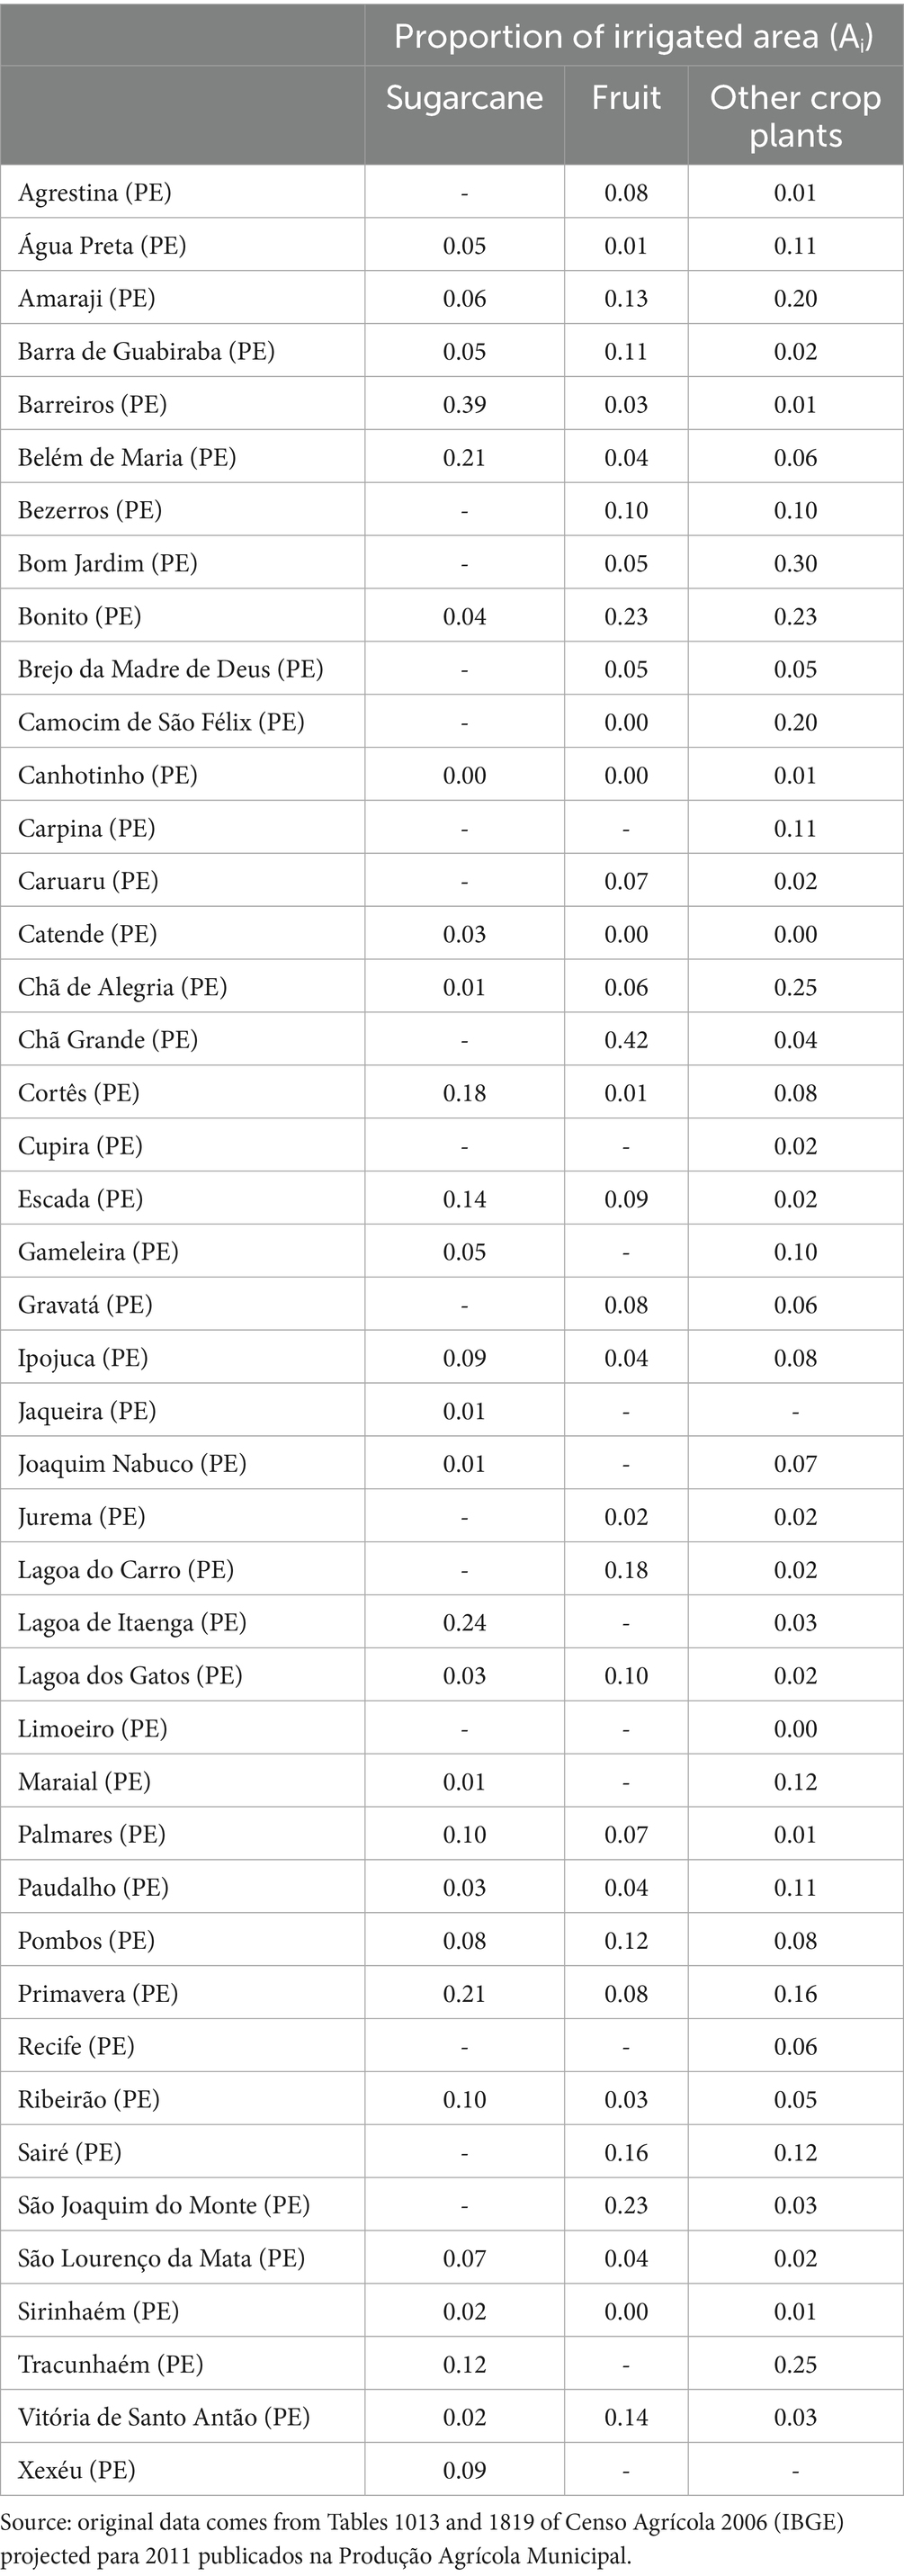
Table 2. Proportion of irrigated area aggregated by microsector and municipality.
All the WUEs obtained through the integration of the models were employed as weights for water allocation to these users, according to the economic microsector and municipality to which they belong, with the objective of maximizing GDP through the optimization model representing the Economic/ Efficiency Priority (EP) allocation strategy. The more efficient the user, the more water would be allocated using this criterion. Thus, the idea was to simulate, in the integrated platform, an allocation based on efficiency results criteria. This efficiency allocation would represent the action of an economic instrument or a market-based one, based on an economic return criterion, allowing for comparison with results that represent the action of the non-market management instruments (AP and SP allocation strategies).
A minimum storage level in the reservoirs was used as the constraint for both the efficiency-prioritized (EP) model and the demand-prioritized model (AP). This was essential for evaluating the trade-offs between these two allocation strategies: one, the hydrological (non-market-based) and the other, economic (market-based) based on the same reservoir water storage minimum level over the three-year period.
The results are not only hydrological ones, i.e., representing reservoir levels, river flows, and user demand fulfillments, but also socioeconomic indicators. Therefore, both hydrological and socioeconomic impacts and the trade-offs between them, are able to be associated to the different water allocation strategies, simulating market and non-market-based instruments.
2.2 The Pareto surface as a tool of multiobjective analysis
The Pareto surface is a useful tool for comparing the optimal points according to different criteria and recognizing the trade-offs between them, i.e., the required exchanges to move from one optimal point to another. This is because Pareto optimal points are frontier points, or dominant points, where improving one objective is only possible at the expense of another. In our study, as described in the previous section, we considered three water allocation strategies among users, two of which are optimal according to hydrological criteria (those represent non-market-based instruments) and one optimal according to the economic criterion (representative of the market-based instruments). Since optimal points in relation to each of the objectives lie on a three-dimensional Pareto surface, where each axis measures one of the objectives, from this surface and its contour curves, the trade-offs between the different allocation strategies can be measured with respect to the three objectives under study. This should provide decision support when choosing between water management instruments.
The three-dimensional Pareto surface composed of optimal points was obtained in GAMS through the HEAL System using a parametric analysis. This involves selecting any one of the three objective functions (e.g., F1) to maximize and treating the others (Fi, i = 2,3) as constraints with lower bound values given by F2* and F3*. These lower bounds of Fi, used as constraints, are obtained when maximizing F1 without conditioning, i.e., without any restrictions on the other objectives. The parametric analysis is then performed by maximizing F1 and varying the lower bounds (right-hand side of the F2 and F3 constraints) at each iteration. The resulting set of solutions forms a set of dominant solutions according to the three criteria.
The algorithm in GAMS for obtaining the Pareto surface was solved with the CONOPT 3 (Constrained Optimization) solver, which is specialized in large-scale nonlinear programming, due to its nonlinearity. A total of 3,752 optimal points were identified, and linear interpolation was applied to generate the wireframe surface shown in Figure 4. This surface comprises only dominant points, including those obtained in the previous section, as they represent optimal solutions with respect to at least one of the criteria represented on the axes.
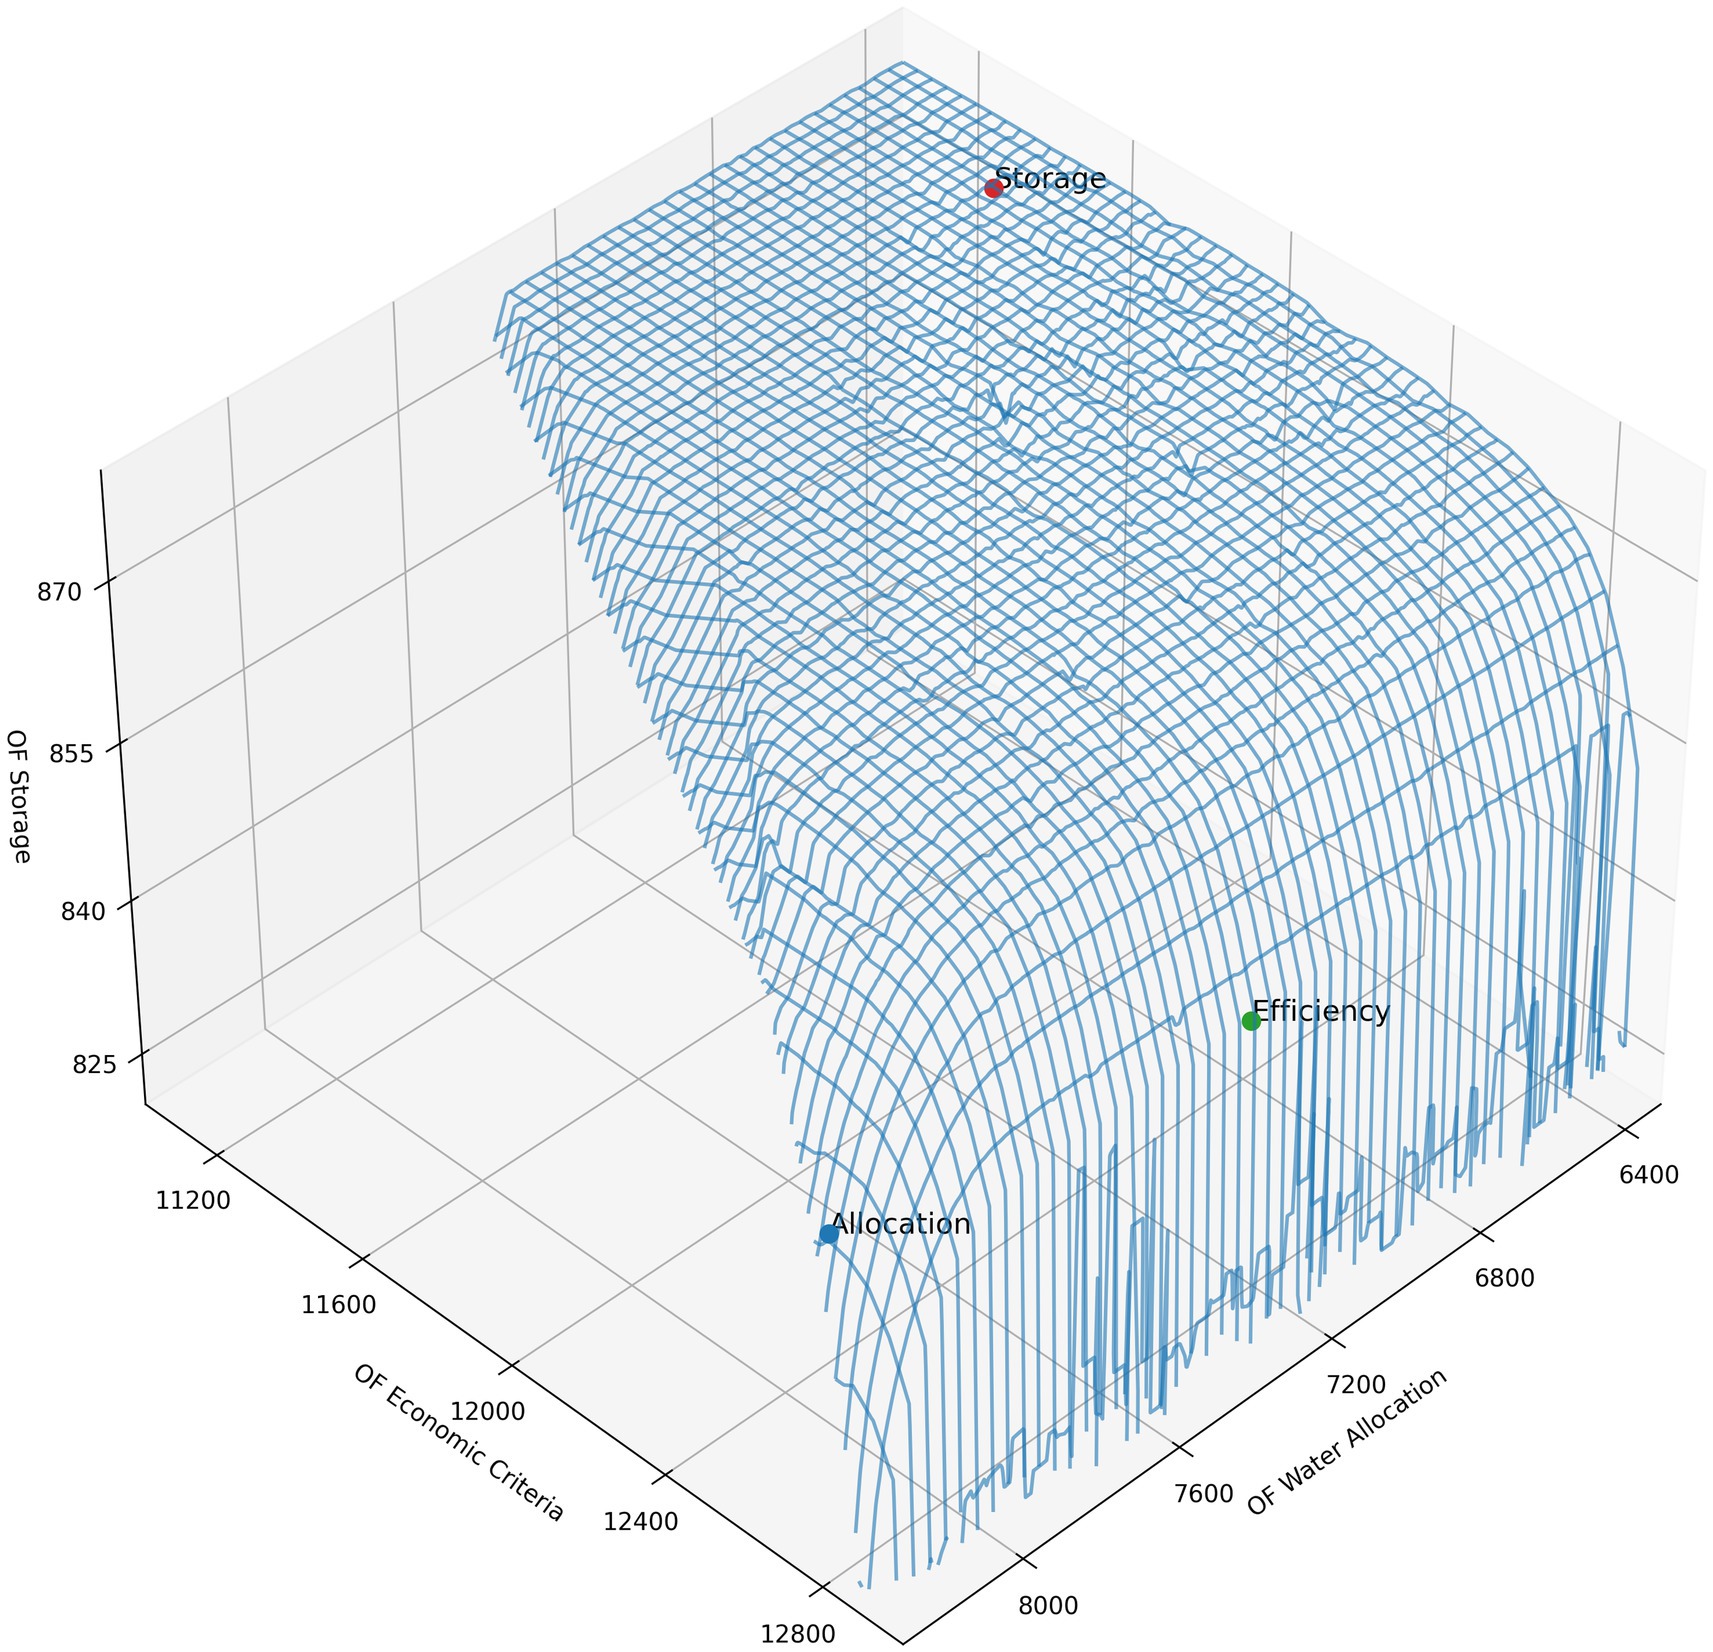
Figure 4. The Pareto surface obtained using the algorithm solved with the CONOPT3 in GAMS.
On the other hand, it is not expected that the BAU appears in the Pareto surface as it is not an optimal solution in relation to any of the three criteria represented on the axes. As a result, this strategy is not part of the frontier of possibilities when considering these three optimization criteria. In another words, BAU is a dominated or interior solution. In the graph, the BAU solution does not even appear as an interior solution because the total storage levels in the reservoirs of BAU’s allocation (59.7%) were significantly lower than the Storage values represented on the associated axis (>820 (94.2%)).
Therefore, the trade-offs studied would be between the three optimal points—i.e., between allocation strategies following different criteria that belong to the Pareto surface. These are measured through the exchanges occurring when transitioning from one point to another. For example, if it is decided to implement, during a period of scarcity, the strategy aimed at maximizing economic returns instead of maximizing user demand fulfillment or average reservoir volumes, it becomes necessary to shift from one optimal point to another on the Pareto surface. This implies that the economic gains achieved will come at the cost of some loss in at least one other criterion, either in user demand fulfillment or reservoir volumes. This multi-objective approach is therefore useful for supporting water management decisions, as it provides all the hydrological and economic measures associated with the conflicting criteria for water allocation during a period of scarcity. Economic (∆GDP), Water (∆RawWater attendance (RW)), and Reservoir volumes (∆S) delta measure economic and hydrological differences between the effects of two different allocation strategies. They can be used as trade-offs between two Pareto surface points by sectors and regions.
3 Results
3.1 Diagnosis of the study area using the integrated economic models platform
The raw water obtained from the BAU results of the optimization model for the reference year (2011), categorized by user, was aggregated by economic microsector and by municipality and then incorporated as an input vector into the IOM. By further aggregating these economic sectors according to the classification suggested by ISIC and grouping the municipalities into two major regions, Mata and Semi-Arid, the pattern of raw water use and the GDP associated in the study area was identified, as illustrated in Figure 5.
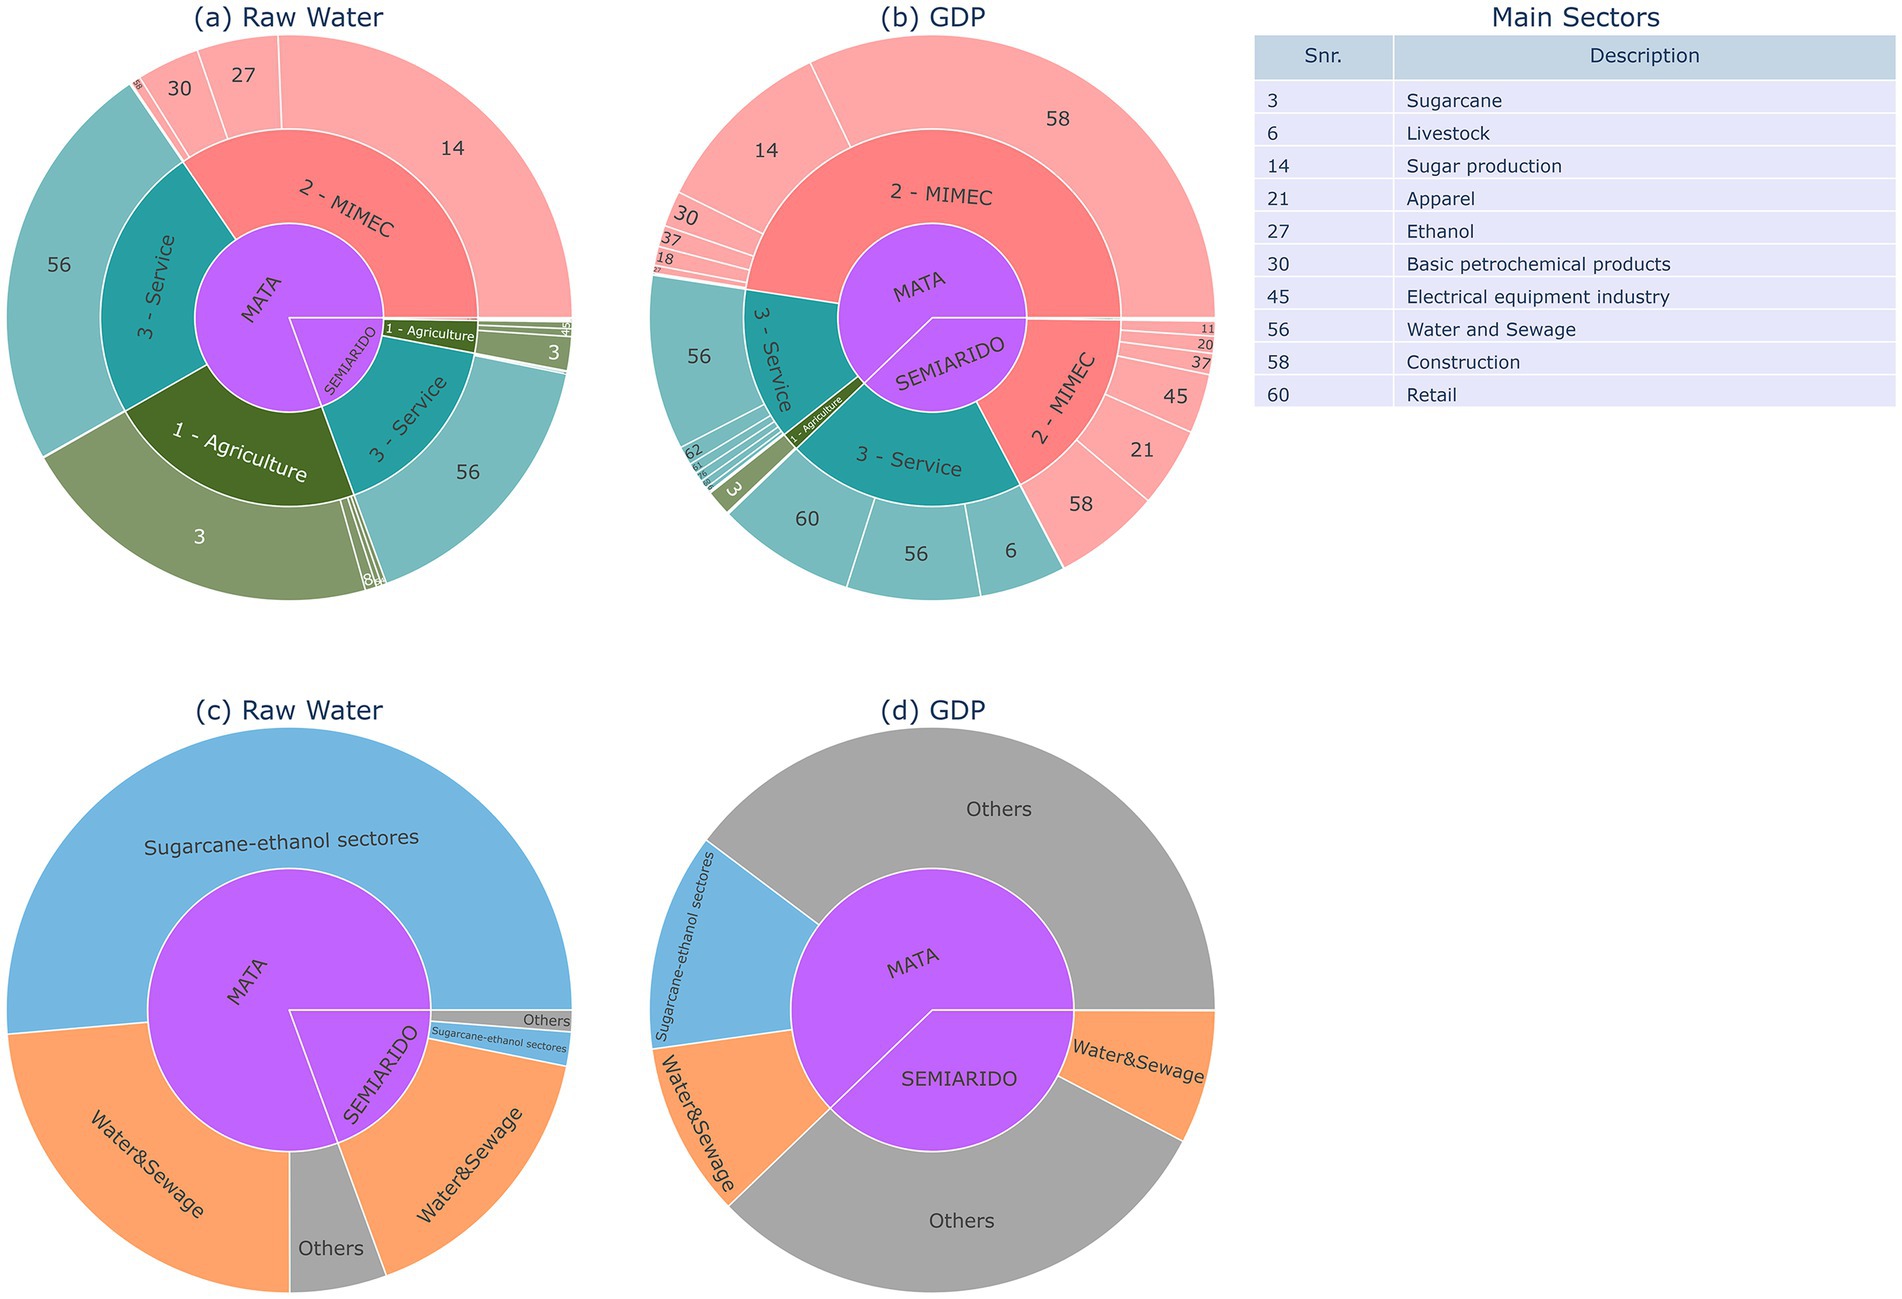
Figure 5. Pattern of Raw Water Use (a) and the GDP associated (b) in the study area in the reference year by economic sector and regions; Pattern of Raw Water Use (c) and GDP (d) of aggregated Sugarcane-ethanol sectors [(14), (27), (3)], Water Sewage [(56)] and Others.
It can be observed that a significant proportion of the raw water use is concentrated in the Mata region (Figure 5a). In this humid region, water use is relatively evenly distributed among the macro-sectors: Irrigated Agriculture, Industry (MIMEC), and Services. An analysis of the Industrial sector, however, shows that the primary water users in the humid region’s industry (MIMEC) the Sugar Manufacturing and Refining sector (14) and the Alcohol Manufacturing sector (27) together account for nearly all industrial water consumption in the region. In the Irrigated Agricultural sector, the irrigated sugarcane cultivation sector (3) is the dominant water user, consuming nearly the entire raw water allocation for irrigated agriculture. Since these three sectors form the sugar-alcohol complex, given that the two industries (14 and 27) rely primarily on sugarcane as an input, the aggregated data indicate that this is the principal water-consuming sector in the humid region and across the entire study area (see Figure 5c). Alongside this, the Water and Sewage sector (56), which utilizes raw water to produce and distribute treated water, emerges as the largest water user in the semi-arid region and the second largest in the overall study area.
The main allocation conflict in the study region, thus, involves the intensive and inefficient sugar-ethanol sector and public supply, that is, the water and sewage sector. Despite public water supply being prioritized in Brazilian legislation, as it supplies households, this sector experienced significant reductions related to the collapse of the main reservoirs during the extreme event (2012–2018), leading to substantial economic losses in the region.
Although these two sectors (the sugar-ethanol sector and public water supply) account for nearly all raw water use, they are not the primary contributors to the economic returns associated with water use in the study area. It is important to note that the GDP calculated and presented in Figures 5b,d exclusively represents the GDP generated through water use. As explained in Section 2.1, the GDP of agricultural products considered in this study corresponds only to the portion of production obtained through irrigation. Therefore, the GDP estimated for the sugarcane sector reflects solely the share of sugarcane production under irrigation.
Figures 5b,d illustrate the distribution of economic returns associated with this raw water use. The returns from the sugar-alcohol sector are primarily from sugar production (14), followed by a small percentage from irrigated sugarcane (3) which lag behind returns from other sectors that have low water intensity, such as the Construction sector (58). This sector (58) represents a significant share of economic returns, particularly in the humid region, where its economic returns exceed those of the Water and Sewage sector (56), which follows as the most significant contributor to economic returns within the Services sector.
Another point important to highlight is that, in the case of the Water and Sewage sector (56), the economic values obtained from this integration stem solely from the pricing of the treated water it produces. This treated water is the sector’s output, derived from the raw water used as an input. In reality, allocations of raw water to the Water and Sewage sector (56) lead to greater economic impacts because they ultimately benefit sectors that receive treated water rather than raw water. However, in the present study, these downstream effects are not accounted for. Additionally, the intangible benefits of meeting household water demand with treated water produced by sector 56 are not included in the economic returns presented in Figure 5.
In the humid region, certain industrial sectors exhibit substantial economic returns despite minimal raw water use, indicating low water intensity and high efficiency. These include the Glass and Non-Metallic Mineral Products Manufacturing sector (37) and the Alcoholic Beverages Manufacturing sector (18). Conversely, the Alcohol Manufacturing sector (27) demonstrates a very low economic return within the industrial sector, despite its significant water consumption, suggesting that it is the least efficient among the most water-intensive sectors.
In the semi-arid region, industrial sectors (MIMEC) do not have a significant share of raw water use, yet they constitute an important portion of the region’s economic returns. Sectors such as Construction (58), Apparel and Accessories Manufacturing (21), Other Machinery and Electrical Equipment Manufacturing (45), Glass and Non-Metallic Mineral Products Manufacturing (37), Textile Manufacturing (20), Animal Slaughtering (except fish) (11), and Mineral Extraction (except oil and natural gas) (9) together account for nearly half of the semi-arid region’s economic returns. This suggests that these sectors, in addition to being low in water intensity, are highly efficient.
Nearly the other half of the semi-arid region’s economic returns originates from the Services sector, with the largest contributions coming from Wholesale Trade (60), Water and Sewage sector (56), and Livestock Farming (6). Among these, the main raw water consumer within the Services sector of the semi-arid region is the Water and Sewage sector, while the others consume negligible amounts of raw water.
3.2 The multi-objective analysis of water allocation strategies: the three-dimensional Pareto surface, its contour curves, and trade-offs
The three allocation strategies studied and their respective results, associated with the three objectives, were positioned on the obtained Pareto surface (see Section 2.2 and Figure 4) along the three axes, each representing an optimization criterion. Since these three strategies constitute optimal points according to at least one of these criteria, given various values for the others, they appear on the surface, characterizing them as dominant strategies.
With three dimensions, the Pareto surface becomes a three-dimensional representation. The visualization of its contour curves on a plane facilitates the analysis of trade-offs between dominant points. Once positioned on the constructed Pareto surface, the values associated with the modeled allocation strategies appear not only on the surface itself but also along its contour curves, enabling the quantification of trade-offs required to transition from one Pareto point to another.
Figure 6 represents contour curves of the surface at various levels of total allocated quantities, ranging from 6,458 (73.8% of the total demand attendance) to 8,252 (99.4%). Along each of these curves, the percentage of demand satisfaction remains constant, with various combinations of stored volumes and associated economic returns.
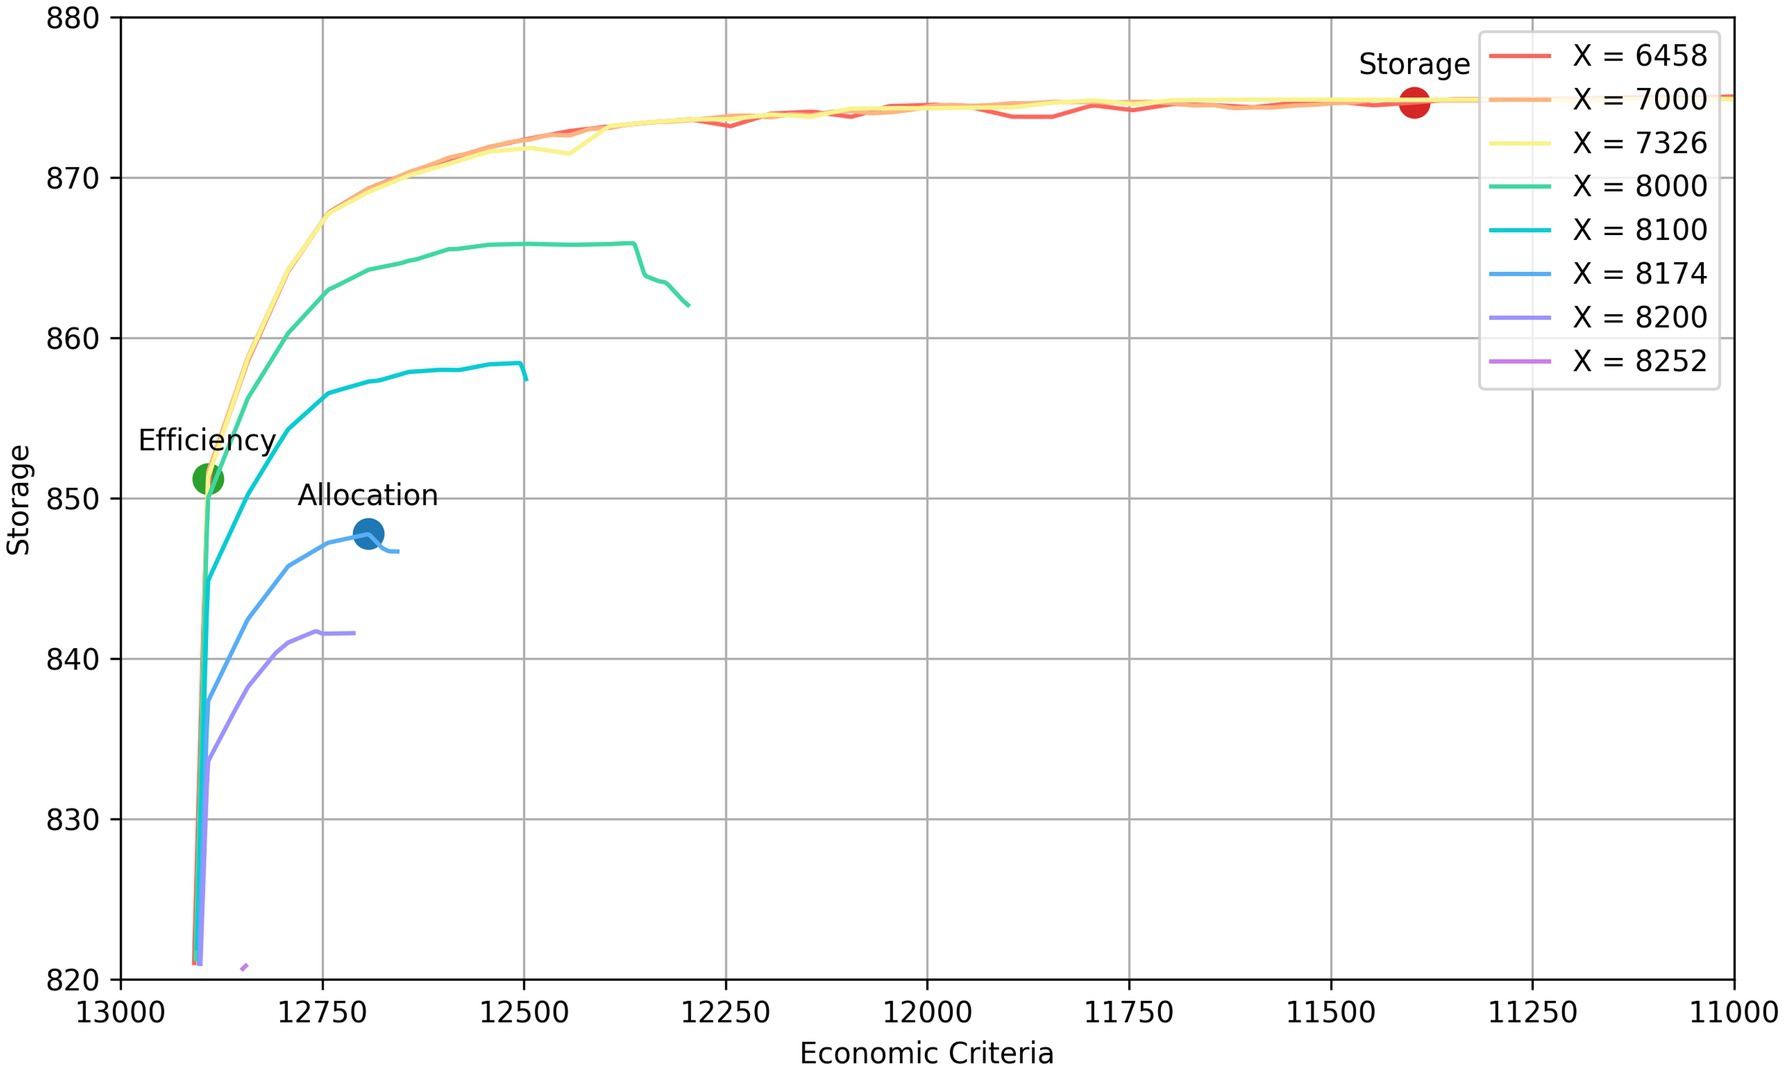
Figure 6. Contour lines of the Pareto surface with constant demand fulfillment.
The analysis revealed important trade-offs among three water allocation strategies—Storage-Priority (SP), Allocation-Priority (AP), and Economic-Efficiency (EP). The SP strategy, which emphasizes keeping water in storage, resulted in the highest reservoir levels (90.6% of storage capacity). However, this came at a significant cost: lower demand satisfaction (73.8%) and lower economic returns (81%). In contrast, both the AP and EP strategies, which release more water for use, achieved better overall results in terms of demand satisfaction and economic value. AP improved demand satisfaction to 78.7% and economic returns to 90.4%, while EP reached 75.6% demand satisfaction and 91.9% of economic returns.
These outcomes highlight a critical trade-off: while both AP (non-market-based) and EP (market-based) strategies sacrifice a small amount of storage, they unlock significant benefits. The EP strategy, in particular, generates R$199 million more in economic value than AP, despite a slightly lower level of demand satisfaction (3.1% less). This trade-off amounts to a difference of roughly 35 million cubic meters in allocated water across the three-year period analyzed.
From a policy perspective, these results suggest that adopting a market-based allocation strategy (EP) can lead to higher economic efficiency with only a modest reduction in service coverage compared to the non-market-based strategy (AP). However, the drop in demand satisfaction also raises equity and resilience concerns, particularly in water-scarce regions. This underscores the importance of using integrated approaches that not only quantify aggregated trade-offs but also consider sectoral and regional equity—analyses that are addressed in the following section.
3.3 Economic and hydrological impacts of water allocation strategies by economic sector and region in the study area under the integrated platform
Initially, the hydrological impacts (see Figure 7) of the three allocation strategies over the 3 years of this study are presented for each of the macrosectors (Industry (MIMEC), Services, and Irrigated Agriculture). The reservoir levels at the end of each of the 3 years are also shown.
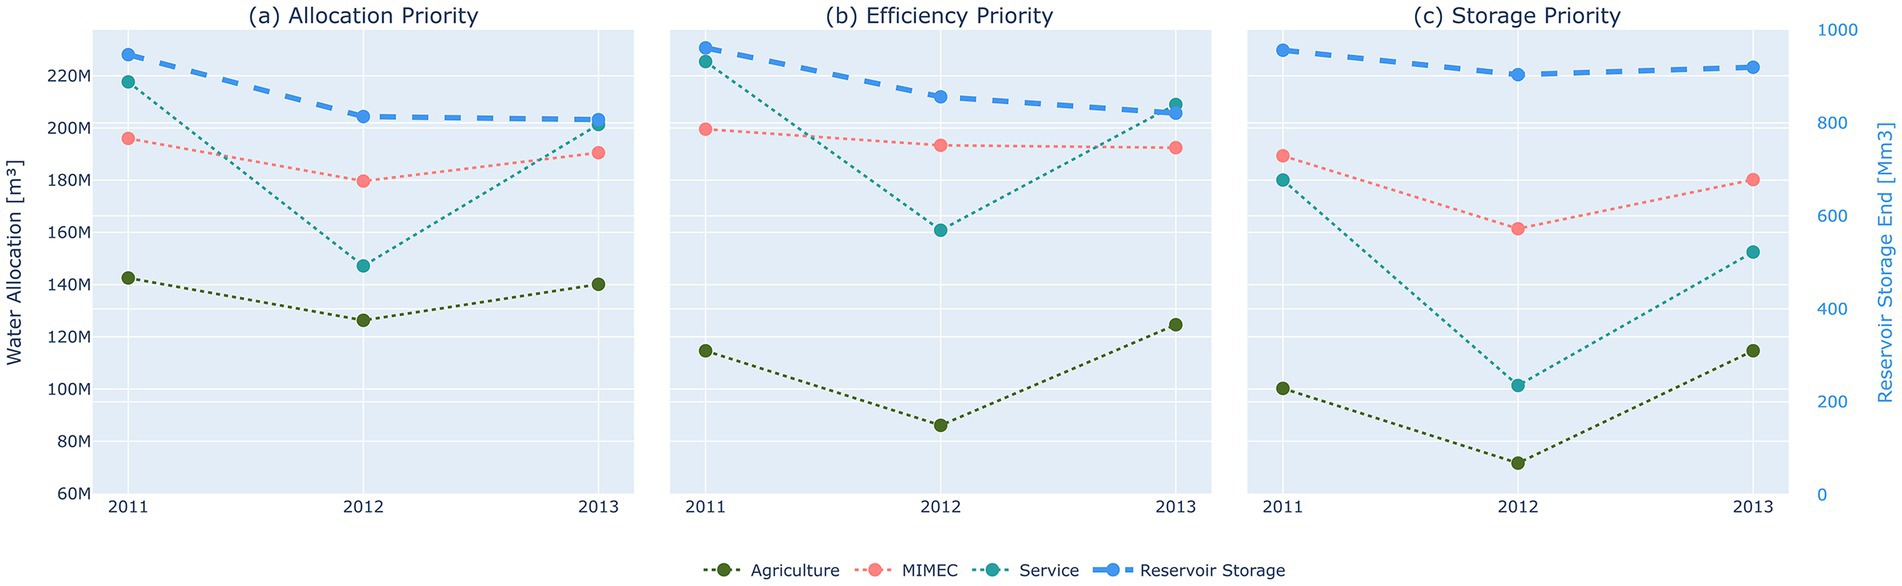
Figure 7. Hydrological impacts of the three allocation strategies over the 3 years are presented for each of the macrosectors: (a) Allocation Priority, (b) Efficiency Priority and (c) Storage Priority.
In general, as expected, the reservoir levels in the Storage Priority (SP) strategy are higher than in the allocation priority (AP) and in the Economic Priority (EP). The latter two exhibit similar reservoir levels, with a slight advantage for the economic strategy (EP) over AP. These higher storage levels in SP are achieved through greater reductions in demand fulfillment and, consequently, in economic returns across the three macrosectors compared to the other strategies.
Despite maintaining similar total reservoir levels, the Allocation Priority (AP) and Economic Priority (EP) strategies differ significantly in how water is redistributed among sectors. The market-based strategy (EP) prioritizes economic returns and, as a result, reallocates water from irrigated agriculture to more economically productive sectors—Industry and Services. This reallocation involves a net reduction of about 35 million cubic meters in total water use, primarily due to a substantial cut in water allocated to irrigated agriculture (−83.6 Mm3). This water is instead directed to Industry (+19.1 Mm3) and Services (+28.4 Mm3) (see Figure 8).
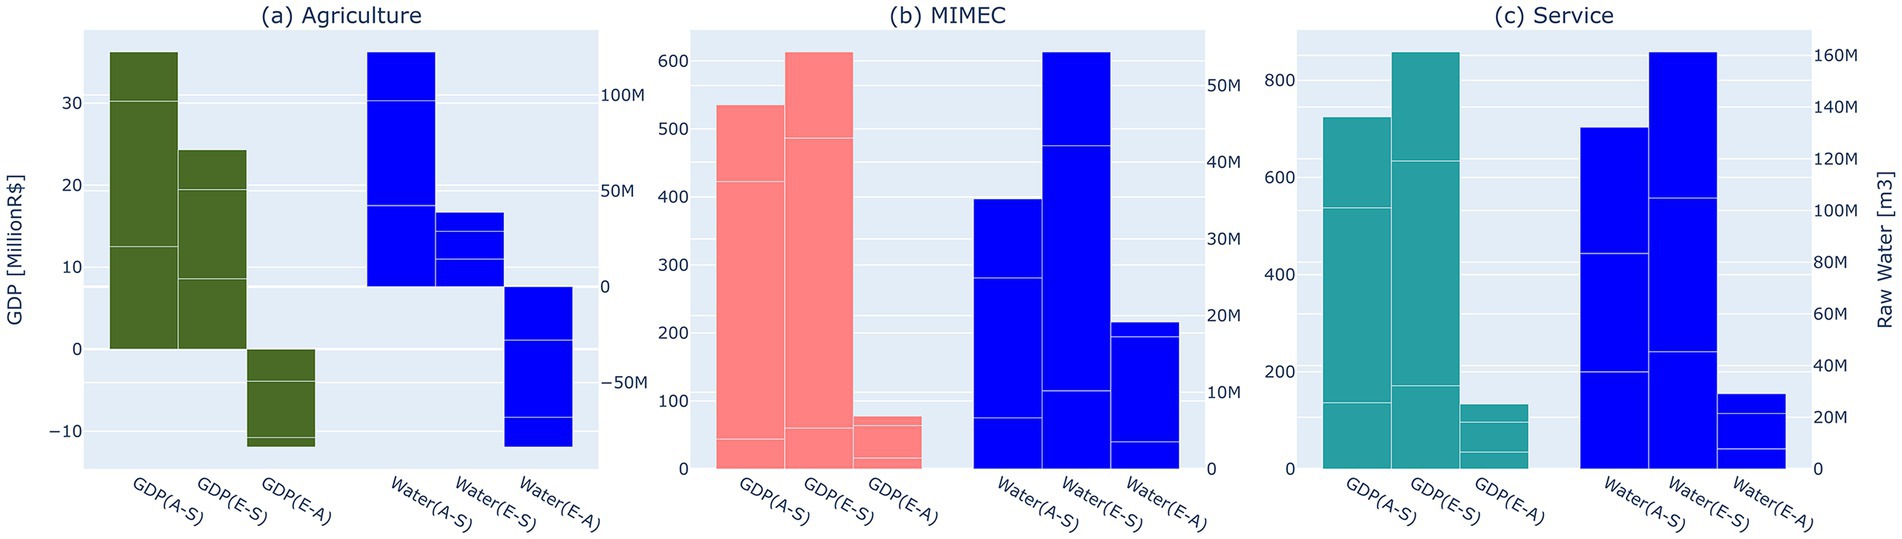
Figure 8. Comparison among total GDP and raw water use impacts of the allocation strategies over the three-year period by macrosector: (a) Irrigated Agriculture, (b) MIMEC (Industry) and (c) Services.
This strategic shift yields a clear economic benefit: although agriculture experiences a small economic loss (−R$11.9 million), this is more than offset by gains in Industry (+R$77.8 million) and Services (+R$130.1 million), resulting in a net increase in total economic returns. These results demonstrate that the market-based instrument (EP) enhances economic efficiency by directing water to sectors with higher economic productivity per unit of water.
Incorporating the regional dimension into the analysis reveals important trade-offs in how water reallocations under the market-based instrument (EP) affect different areas. The most significant reductions in water allocations to agriculture occur in the humid Mata region (−79.99 Mm3), compared to a much smaller reduction in the semi-arid region (−3.61 Mm3) (see Figure 9). As a result, irrigated agriculture in the humid region suffers the largest economic loss (−R$9.54 million), followed by smaller losses in the semi-arid region (−R$2.36 million).
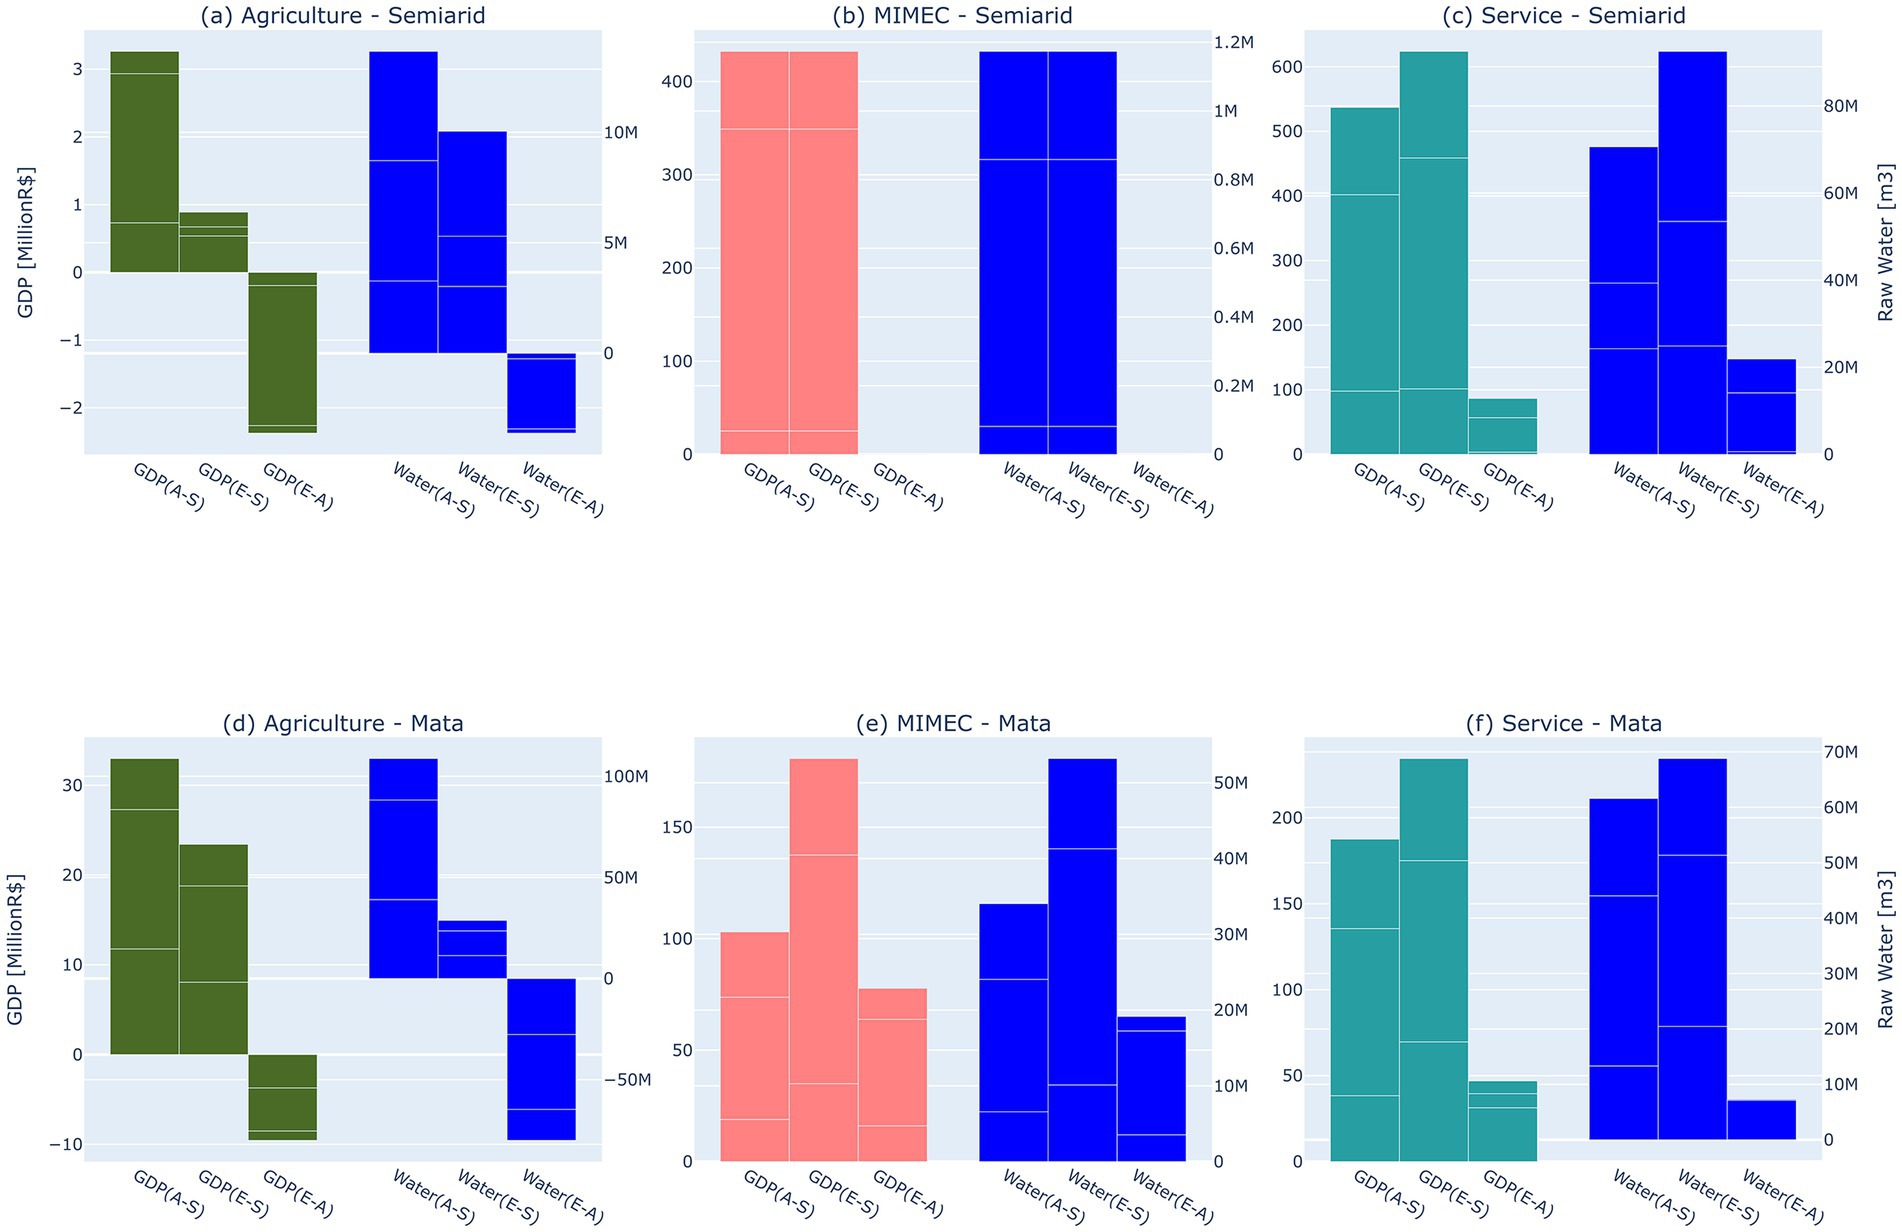
Figure 9. Comparison among total GDP and raw water use impacts of the allocation strategies over the three-year period by macrosector and region: (a) Agriculture - Semiarid, (b) MIMEC - Semiarid, (c) Service - Semiarid, (d) Agriculture - Mata, (e) MIMEC - Mata, (f) Service -Mata. (E-A = EP-AP = Efficiency Priority - Allocation Priority = economic reallocation) (A-S = AP - SP = Allocation Priority - Storage Priority) (E-S = EP - SP = Efficiency Priority - Storage Priority).
In contrast, the sectors receiving increased allocations—primarily Services in the semi-arid region (+21.27 Mm3), Industry in the humid region (+19.16 Mm3), and Services in the humid region (+7.14 Mm3)—generate substantial economic gains. These range from +R$83.19 million in Services (semi-arid) to +R$77.75 million in Industry (humid), and +R$46.89 million in Services (humid). There is no change in water allocation to Industry in the semi-arid region, which results in stable economic output for that sector. In summary, the market-based strategy redirects water from agriculture—mainly in the humid zone—to sectors and regions with higher economic productivity.
By analyzing the proportional changes in water allocation and economic returns relative to the baseline year (2011), we can better understand which sectors and regions gain or lose under a market-based reallocation and how efficiently they convert water into economic value.
The quadrant analysis (Figures 10a,b) helps visualize these dynamics. In the first quadrant, sectors and regions gain both water and economic returns under the market-based scenario. When positioned above the 45° line, they achieve proportionally higher economic returns than water received, signaling efficiency gains from reallocation (i.e., high return per unit of water). These represent desirable outcomes, where economic instruments successfully guide water toward more productive uses. However, when located below the 45° line, sectors still gain water and income, but their economic return increases less than proportionally to water gains—indicating relative inefficiency in converting water into value.
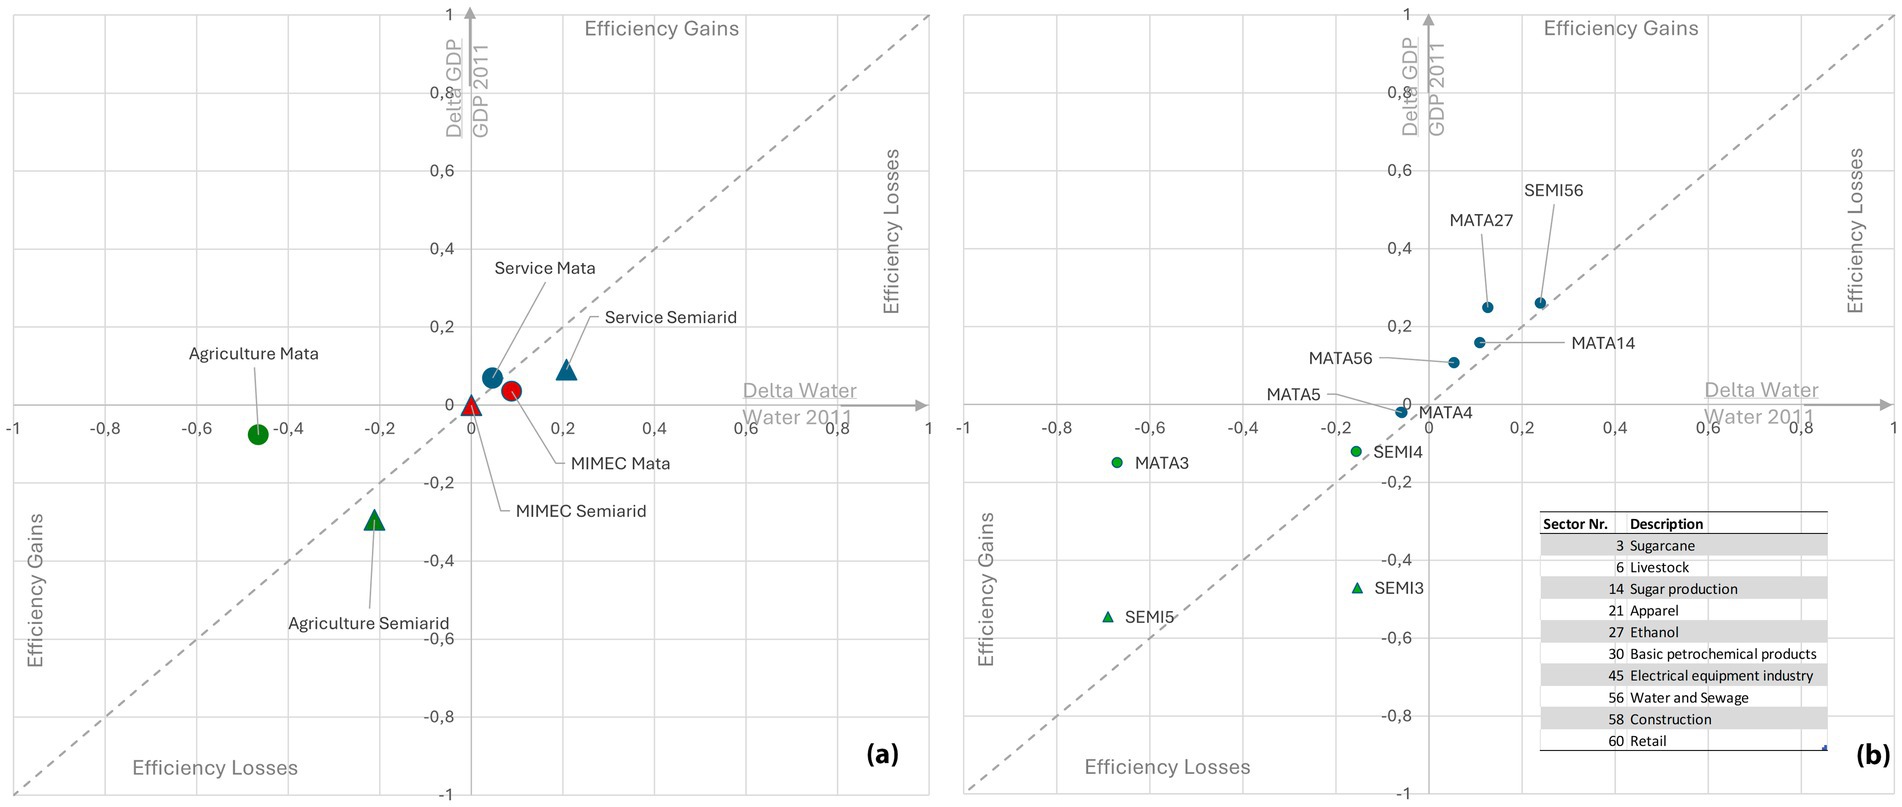
Figure 10. Proportional differences (∆%) in both water allocation and economic returns resulting from the reallocation induced by the market-based instrument (EP-AP) relative to the corresponding values in the BAU scenario for the base year (2011). (a) By macrosector/region; (b) By microsector/region.
In the third quadrant, sectors lose both water and economic output. Those above the 45° line suffer proportionally smaller economic losses than the reductions in water, reflecting a positive trade-off—they were low-efficiency users, so reducing their water use had a limited economic impact. Conversely, sectors below the line lose more economically than the amount of water lost, reflecting inefficient cuts and potentially harmful impacts.
Importantly, no internal efficiency changes (e.g., technology shifts or behavioral adaptation) occur in this analysis. Instead, efficiency gains or losses at the aggregated level emerge solely from how water is redistributed across a structurally diverse economy. Because sectoral and regional WUE (Water Use Efficiency) is constant in the I-O model, the aggregated shifts reveal the interaction between water policy and economic structure—that is, how water flows to more or less efficient areas depending on how sectors and regions are composed.
This interpretation shows that market-based allocation can indeed improve overall water use efficiency, but also that outcomes are highly dependent on the economic makeup of each region. Some regions with high-return service sectors benefit, while others, such as those dominated by low-efficiency irrigated agriculture, may face greater losses. This highlights both the potential and limitations of using economic instruments in real-world water allocation under scarcity, especially when economic diversification is low.
The proportional analysis of water reallocation and economic returns reveals that efficiency gains at the regional or sectoral level depend not only on the volume of water received but also on the internal structure of each sector/region. For instance, the Services sector in the Semi-arid region and the Industry sector in the Mata region received the largest absolute reallocations and highest economic gains under the market-based strategy (see Figure 9). However, both are located below the 45-degree line in the first quadrant of Figure 10a, indicating that their economic returns increased less than proportionally to the additional water they received—resulting in efficiency losses at the aggregated level. In contrast, the Services sector in the Mata region, while receiving a smaller proportional increase in water allocation, exhibited proportionally greater economic returns—positioning it above the 45-degree line. This makes it the only sector/region among the major economic winners that also experienced an efficiency gain.
This somewhat counterintuitive result is explained by the composition of the Services sector in the Mata region. Most of its water use and GDP come from a single microsector: Water and Sewage Services (sector 56). Other microsectors—like retail trade, transport, and personal services—use very little water but contribute significantly to GDP (Figures 5a,b). These low-water, high-value microsectors had their demands fully met in both the market-based and non-market-based scenarios. Therefore, they did not drive the difference in economic outcomes between strategies. The key difference lies in sector 56. Under the market-based strategy, sector 56 received proportionally more water, and because it represents over 80% of the GDP of the Services sector in the Mata region, its efficiency gain lifted the overall efficiency of the aggregated sector/region. In this case, the market-based strategy aligned well with the internal economic structure of the region.
In summary, the unique outcome of efficiency gain for the Services sector in the Mata region is due to: (i) a favorable reallocation to its dominant water-using and high-GDP sector (sector 56); (ii) the minimal water needs of its other economically important microsectors (which always had their demands met); (iii) And the fact that these effects are magnified when results are aggregated at the sector-regional level.
The comparison between the Services sectors in the humid (Mata) and dry (Semi-arid) regions reveals an important insight: even when similar water reallocation patterns occur, efficiency outcomes can differ significantly depending on the economic structure of the sector or region.
In both regions, the Water and Sewage microsector (sector 56) is the only one within the Services sector affected by the economic instrument. In both cases, it receives more water under the market-based reallocation and achieves efficiency gains at the microsector level (Figure 10b). However, the overall outcome for the Services sector differs: in the Mata region, where sector 56 dominates both water use and GDP contribution within the Services sector, the microsector’s efficiency gains translate into overall efficiency gains for the entire sector/region.
In the Semi-arid region, despite an even larger proportional increase in water allocation to sector 56, the overall Services sector does not show efficiency gains. This happens because the semi-arid Services sector also includes two other major contributors to its GDP: (i) The Trade microsector (60), which uses little water but accounts for a large share of GDP and already had 100% of its demand met under both instruments; (ii) The Livestock microsector (6) which is also low in water intensity and experiences the same allocation under both instruments.
These two microsectors dilute the effect of the efficiency gains achieved by sector 56, as they receive no benefit from the economic instrument in terms of increased allocation or economic return. As a result, the overall Services sector in the Semi-arid region does not display a net efficiency gain—even though one of its key components does. These findings underline a key insight: The effectiveness of market-based instruments in improving efficiency at the aggregated level depends not only on which microsectors receive more water, but also on how much those microsectors contribute to the overall GDP and water use of the sector or region.
Furthermore, it is likely that if the economic value of treated water produced by sector 56 were included in the analysis, this would amplify the economic gains and could potentially shift the overall efficiency outcome in favor of the Services sector in the Semi-arid region as well. In summary, sector 56 in both regions benefited from economic reallocation, but only in the Mata region did this lead to efficiency gains at the aggregate level. The reason for that is because in the Mata region, sector 56 dominates the Services sector’s structure, while in the Semi-arid region, other influential microsectors dilute the impact of improvements in sector 56.
The results indicate that the Industry sector in the Mata region, while receiving increased water allocations and experiencing absolute economic gains under the economic (market-based) instrument, did not achieve efficiency gains. This is evidenced by its position below the 45-degree line in the first quadrant of Figure 10a.
This outcome can be explained by the sector’s internal composition. Several microsectors within this aggregated industrial category—such as Civil Construction (58), Basic Petrochemical Manufacturing (30), Glass and Non-metallic Mineral Products Manufacturing (37), and Alcoholic Beverages Manufacturing (18)—are characterized by high economic returns and low water use. These microsectors had their water demands fully met under both the regulatory and economic allocation instruments. Consequently, the economic reallocation had no impact on these dominant microsectors, which significantly contribute to the overall GDP of the industrial sector in the region.
In contrast, the primary users of raw water in the Mata region’s industry—namely the Sugar (14) and Ethanol (27) sectors—did benefit from increased allocations under the economic instrument. These sectors individually demonstrated efficiency gains, as their economic returns increased proportionally more than their water allocations (Figure 10b). However, due to their relatively low contribution to the total GDP of the industrial sector, these individual gains were insufficient to improve the aggregated efficiency of the sector as a whole.
These findings underscore a key limitation of market-based allocation instruments: when a sector’s economic structure is dominated by microsectors that are already efficient and well-supplied, reallocating water to less efficient but more water-intensive sectors may not yield aggregate efficiency improvements. This reinforces the importance of considering sectoral composition in the design and assessment of economic instruments for resource allocation.
An additional complexity arises from the production chain linkages involving the sugar (14) and ethanol (27) sectors. These sectors depend on sugarcane, which is itself a major consumer of raw water and is represented as a distinct microsector in the model. The current analysis does not fully capture these interdependencies, as it does not reintegrate the reallocation results into the Input–Output Model (IOM). As a result, the economic gains for the sugar and ethanol sectors may be overestimated, since they do not account for potential constraints on sugarcane supply under reduced irrigation conditions.
Nonetheless, given that the majority of sugarcane cultivation in the study area is rainfed (Table 2), the projected increases in sugar and ethanol production are expected to occur, albeit to a lesser extent than the model currently suggests. Addressing this limitation—by reintroducing allocation outcomes into the IOM—is identified as a priority for future work.
In contrast, the Industry sector in the Semi-arid region showed no differences between the two instruments in terms of either water allocation or economic outcomes. This is because all microsectors in this sector—such as Manufacture of Apparel and Accessories (21), Civil Construction (58), Textile Products (20), and Extraction of Non-petroleum Minerals (9)—had their water demands fully satisfied under both allocation schemes. These microsectors are generally characterized by low water intensity and high economic productivity, and together account for nearly half of the region’s industrial GDP.
As a result, the point representing the Semi-arid Industry sector appears at the origin in Figure 10a, reflecting a scenario of unchanged allocation and efficiency. This outcome illustrates that in sectors where existing allocation already reflects optimal economic returns per unit of water, there is limited potential for market-based instruments to induce further improvements in efficiency.
The results for the Irrigated Agriculture sector reveal a contrasting pattern between the two regions. It is the only sector in both the Mata and Semi-arid regions to experience reductions in raw water allocation under the economic (market-based) instrument—both in absolute and proportional terms. Consequently, this sector appears in the third quadrant of Figure 10a, indicating a decline in both water allocation and economic returns.
In the Mata region, despite substantial reductions in water allocation, the Irrigated Agriculture sector demonstrates efficiency gains. This outcome arises because the proportional decrease in economic returns is smaller than the proportional reduction in water use, placing this sector above the 45-degree line in the third quadrant of Figure 10a.
These gains are largely driven by the performance of irrigated sugarcane (MATA3), the dominant crop in the region’s agriculture both in terms of water use and GDP contribution (Figures 5a,b). Although this microsector receives the majority (99.75%) of the sector’s water reduction under the economic instrument (Figure 10b), it proves resilient: the drop in water allocation leads to smaller proportional losses in economic output, indicating improved water-use efficiency.
Other crops—Fruit Farming (4) and Other Crops (5)—experience modest reductions in water use under the market-based instrument. For both, the economic losses are proportionally even smaller than the water reductions, resulting in further efficiency gains. Therefore, the entire sector in the Mata region exhibits improved efficiency, driven by both the dominant crop (sugarcane) and complementary crops.
In contrast, the Irrigated Agriculture sector in the Semi-arid region experiences efficiency losses under the economic instrument, even though the water allocation cuts are less severe than in the Mata region. This is due to the fact that the economic losses are proportionally greater than the reductions in water use, placing the sector below the 45-degree line in Figure 10a.
As in the Mata region, irrigated sugarcane (SEMI3) dominates both water use and economic contribution in Semi-arid agriculture. However, this crop proves less resilient to reductions in water: while it experiences only moderate cuts in water allocation, its economic output declines sharply. Among all microsectors in this region, sugarcane is the only one that loses efficiency, as shown in its location in the third quadrant of Figure 10b, below the 45-degree line.
Conversely, the Fruit Farming (4) and Unspecified Crops (5) microsectors show efficiency gains. Despite experiencing larger proportional reductions in water allocation—particularly microsector 5—they exhibit relatively small drops in economic output. These gains, however, are not enough to offset the losses from sugarcane, resulting in overall efficiency losses for the sector in the Semi-arid region.
These findings underscore the dominant role of irrigated sugarcane in shaping the outcomes of water reallocation in both regions. In the Mata region, the economic instrument encourages a more balanced crop distribution, reducing water allocation to sugarcane and thereby enhancing overall efficiency. In the Semi-arid region, however, the market mechanism reallocates relatively more water away from less water-intensive crops [particularly Unspecified Crops (5)], which paradoxically could reinforce the dominance of sugarcane, a crop poorly suited to the region’s water-scarce context.
This outcome highlights a structural limitation of market-based allocation instruments: they may fail to induce desirable shifts in crop mix in regions where the dominant crop is simultaneously inefficient, water-intensive, and insufficiently resilient—and where viable alternatives either offer lower profitability [e.g., Unspecified Crops (5)] or remain marginal in land use [e.g., Fruit Farming (4)].
Thus, while market-based instruments can promote efficiency in contexts where economic and water-use profiles are better aligned (as in the Mata region), their capacity to improve water productivity in structurally mismatched systems (such as Semi-arid irrigated agriculture dominated by sugarcane) is limited.
3.4 Analysis of the effects of an economic reallocation on the main allocative conflict in the study area: the sugar-ethanol sector vs. the water and sewage sector
The results presented in this section aim to interpret the effects of economic reallocation on the two main competing sectors for raw water in the study area: the sugar-ethanol sector (hereafter referred to as “Sucro”) and the public water supply sector (Water and Sewage, sector 56).(see Section 3.1) To capture this allocative conflict more comprehensively, the analysis aggregates the hydrological and economic outcomes of irrigated sugarcane (sector 3), sugar production (sector 14), and ethanol production (sector 27) across the entire study area, and compares them with those of the public supply sector (sector 56), as illustrated in Figure 11.
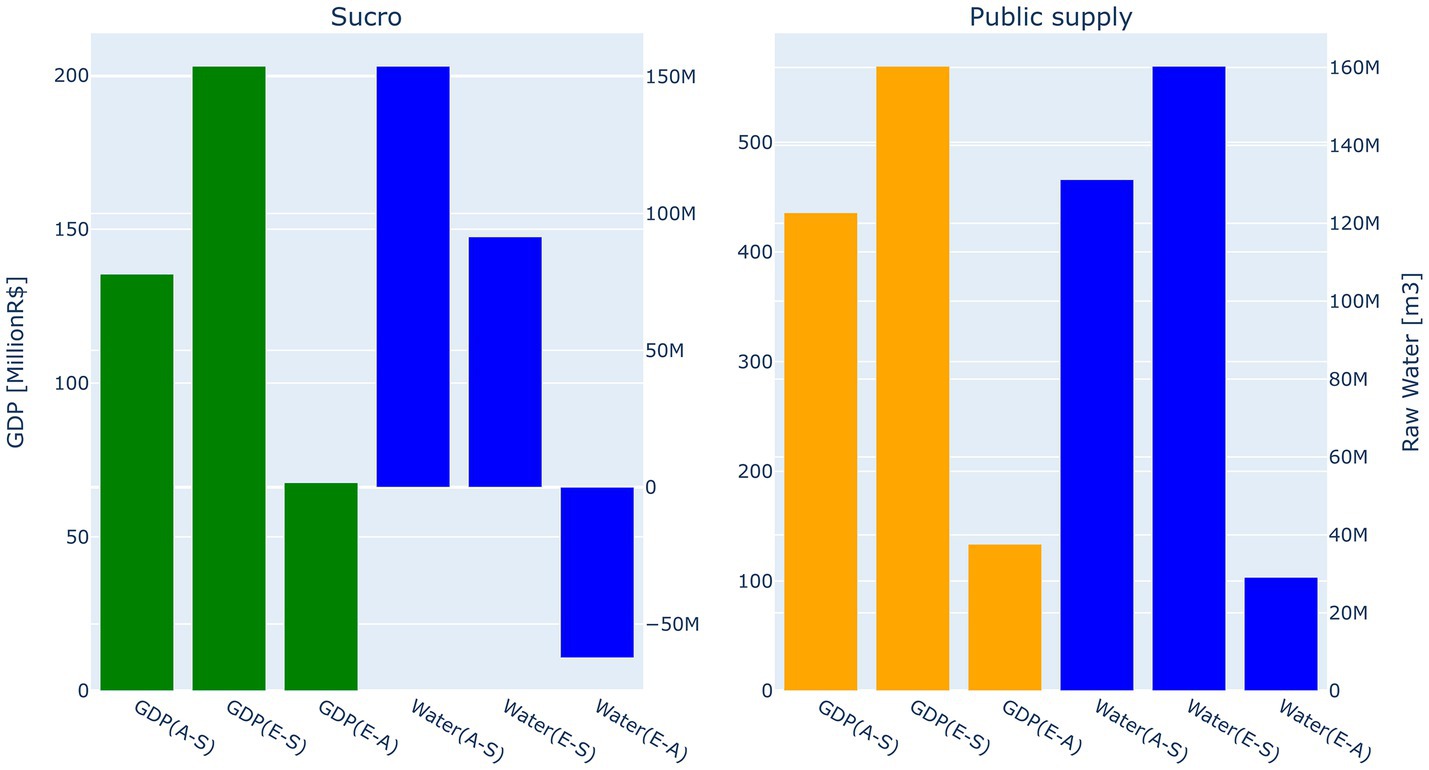
Figure 11. Comparison among total GDP and raw water use impacts of the allocation strategies over the three-year period by aggregated sectors (Sucro and Public supply) in the study area (E-A = EP-AP = economic reallocation).
The application of the economic reallocation instrument (EP-AP) resulted in a net reduction in total demand fulfillment across the study area—approximately 35 million m3 (see section 3.3)—primarily through reductions in water allocated to the Sucro sector, especially to irrigated sugarcane. A portion of this withdrawn water was redirected to the public supply sector, resulting in net economic gains for both aggregated sectors, with particularly significant gains for the public supply sector. These outcomes illustrate the economic instrument’s capacity to enhance water-use efficiency by reallocating water from low-efficiency sectors to those with higher marginal returns.
At the regional level, reductions in water allocations for the sugar-ethanol sector were more substantial in the humid region. However, this sector displayed greater resilience to water scarcity in that region (see Figure 12). Specifically, despite a decrease in water allocation, the irrigated sugarcane microsector in the humid region experienced efficiency gains, with reductions in water use proportionally greater than reductions in economic returns. Moreover, the industrial components of the sugar-ethanol sector (sectors 14 and 27), which operate exclusively in the humid region, received increased water allocations and generated additional economic gains under the economic reallocation scenario. These industrial gains were sufficient to offset the economic losses associated with reduced irrigation in sugarcane, thereby yielding a positive net outcome for the aggregated sugar-ethanol sector in the humid region.
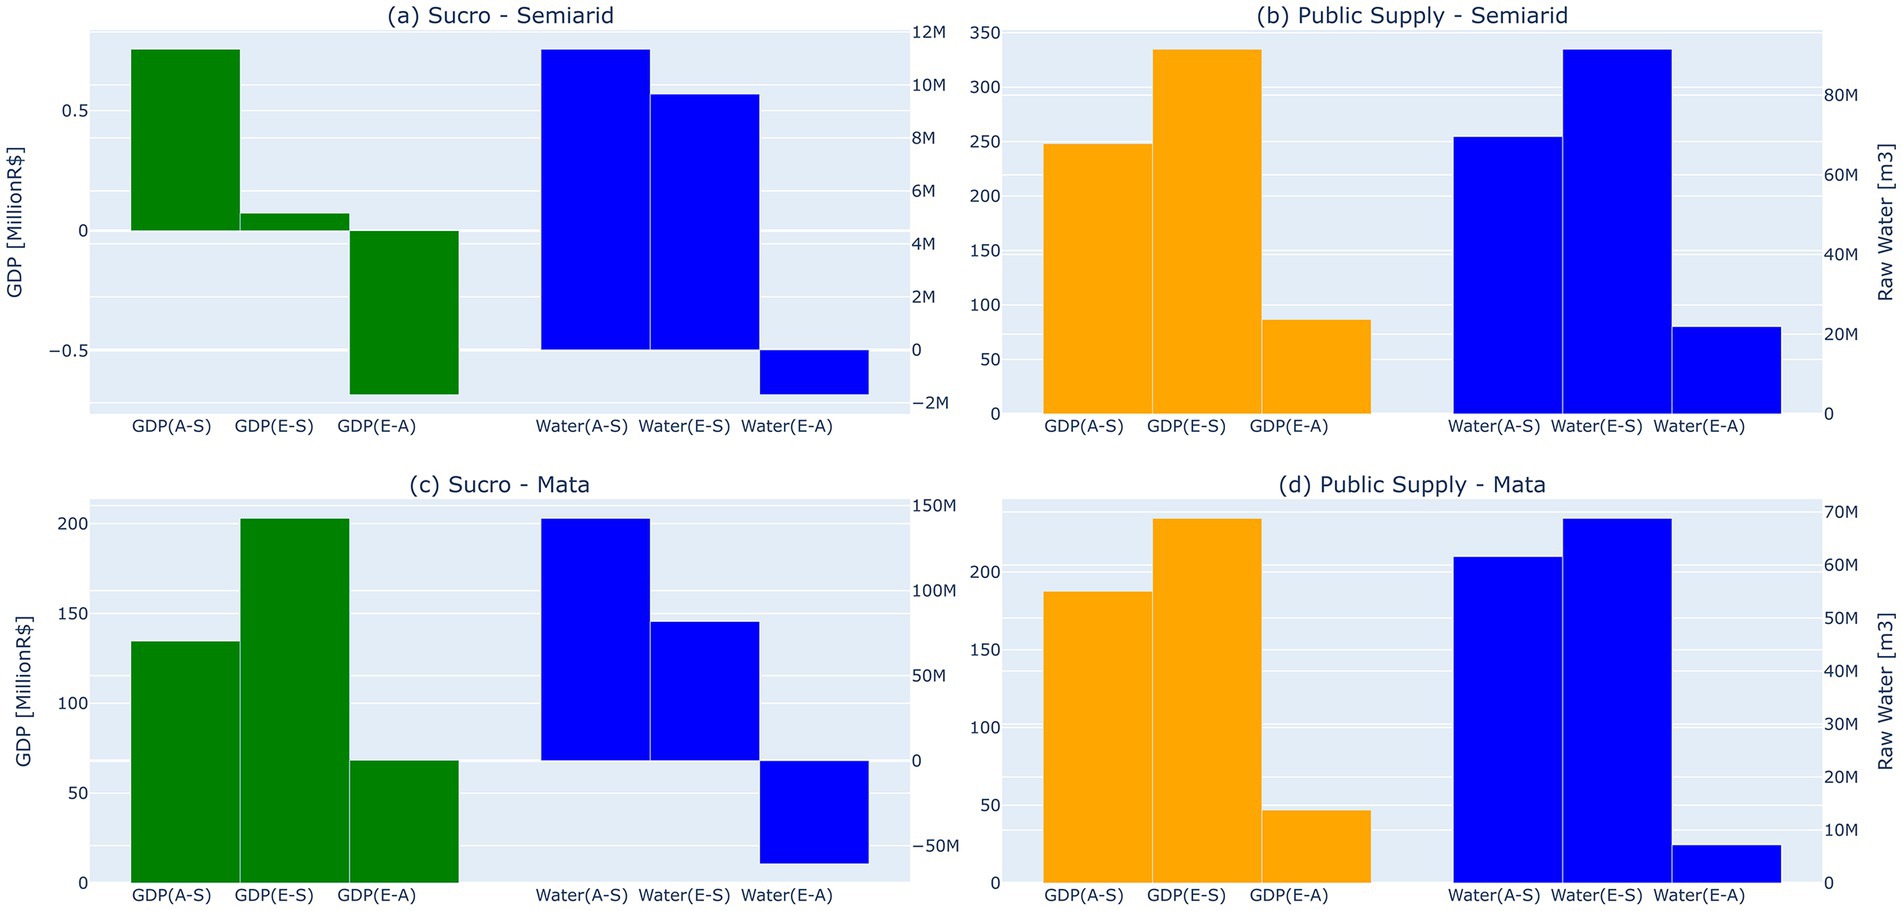
Figure 12. Comparison among total GDP and raw water use impacts of the allocation strategies over the three-year period by aggregated sectors and region: (a) Sucro - Semiarid, (b) Public Supply - Semiarid, (c) Sucro - Mata, (d) Public Supply - Mata (E-A = EP-AP = Efficiency Priority - Allocation Priority = economic reallocation) (A-S = AP - SP = Allocation Priority - Storage Priority) (E-S = EP - SP = Efficiency Priority - Storage Priority).
The economic reallocation, that reduces raw water allocated to the sugar-ethanol sector, especially irrigated sugarcane (sector 3), and redirects it to the public supply sector, leads to overall economic gains, most notably in sector 56, which benefits from increased allocations, particularly in the semi-arid region (+21.27 Mm3 vs. +7.14 Mm3 in the humid region). Even with conservative assumptions that underestimate its returns,2 the public water supply sector achieves higher economic gains than the sugar-ethanol sector— + 83.19 million BRL in the semi-arid region and +46.89 million BRL in the humid region.
These values, even underestimated, exceed the economic returns of the sugar-ethanol sector (sectors 3, 14, and 27), despite the latter two (14 and 27) having overestimated returns.3 It is important to highlight that the sugar-ethanol sector, the largest consumer of raw water in the humid region and in the study area as a whole (~53%), generates less than 12% of the GDP associated with raw water use, demonstrating its low water-use efficiency. Meanwhile, approximately 70% of GDP from water use originates from “Other” sectors, which together consume less than 7% of total water (see Figures 5c,d), and whose demands remain unaffected by the economic reallocation.4
Regionally, the semi-arid irrigated sugarcane sector (SEMI3) suffers efficiency losses even under relatively modest water cuts. Because this crop has low resilience to water scarcity in semi-arid conditions, it becomes an even larger share of the agricultural mix, worsening overall efficiency. This outcome demonstrates that economic instruments alone are insufficient to shift crop patterns in contexts where water-intensive, low-efficiency crops dominate due to historical land-use patterns and economic structures.
In contrast, in the humid region, although irrigated sugarcane also faces allocation cuts, its higher resilience and associated efficiency gains—combined with increased water for industrial sugar and ethanol sectors—allow for net positive economic outcomes within the sugar-ethanol sector (Figure 12c).
When analyzing the semi-arid region as a whole, the economic gains from reallocating water to the public supply sector outweigh the losses faced by the sugar-ethanol sector (see Figures 12a,b). However, the structural imbalance remains: market-based instruments direct water toward more productive uses, but they cannot by themselves correct the underlying land-use and crop mix inefficiencies.
These findings suggest that economic reallocation is effective in redirecting water toward higher-efficiency sectors, especially public supply, but also reveal its limitations in triggering deeper structural changes. To truly improve efficiency and promote sustainable development, particularly in water-scarce regions like the semi-arid zone, economic instruments must be complemented by land-use and agricultural policy reforms.
Future modeling improvements—such as incorporating inter-industry relationships and valuing downstream urban and industrial benefits of treated water—are likely to strengthen the observed trends in favor of reallocating water away from the sugar-ethanol sector and toward the public supply and more efficient sectors.
4 Discussion and conclusion
Irrigation is the largest water-consuming activity in Pernambuco state, accounting for 53% of total water demand in 2018, followed by the industrial sector (19%) and human supply (10%) (ANA, 2020). Water consumption for irrigation increased by approximately 40% between 2000 and 2018, and projections estimate that demand for this activity will reach 34.4 m3/s by 2030. The expansion of irrigated agricultural production could further exacerbate the state’s water deficit. In the semi-arid Agreste region of Pernambuco, irrigation accounted for an even larger share of total water consumption (~, representing 64%) in 2018, while human water supply accounted for 21% (Guarenghi et al., 2023).
Bioenergy-related water use is expected to exacerbate both existing and potential water conflicts in Pernambuco and elsewhere. In this state, sugarcane monoculture represented 83% of the state’s total agricultural output in 2018, occupying 36% of the cultivated area of the state, concentrated primarily in the humid area (Zona da Mata)5 (IBGE—Brazilian Institute of Geography and Statistics, 2019). In this region, sugarcane monoculture is more viable with minimal water supplementation compared to the Agreste semi-arid region due to favorable climatic conditions.
The results of our modeling using the market-based instrument, applied to the four interconnected basins of Pernambuco, suggest a trend favoring the public supply over the sugar-ethanol sector. This is particularly evident in the semi-arid region, where water is reallocated from the sugar-ethanol sector, primarily from irrigated sugarcane cultivation in the humid area (Mata). Consequently, sugarcane production in that region experienced efficiency gains, and the instrument contributed positively to altering the current economic structure of the humid area.
In the semi-arid region of the 4-basins, however, the predominance of the same crop, sugarcane, combined with the presence of either low-profitability crops or more profitable but less widespread alternatives, limited the capacity of market-based instruments to enhance water-use efficiency and alter the crop mix in that region. This outcome underscores the constraints of market-based instruments in reshaping an already established crop mix that is unsuited to the region’s environmental conditions. These findings highlight that the effects of the market-based instrument depend not only on its inherent characteristics but also on the pre-existing economic structure.
According to the System of Environmental-Economic Accounting for Water (SEEA-Water), developed by the United Nations Statistics Division, water managers often have access to data on water use by broad categories of end-users. However, such data are not readily applicable for economic analysis, as the classification of end-users seldom aligns with the classification of economic activities used in national accounts. Most water statistics focus primarily on hydrological aspects, with limited attention given to the economic and social dimensions of water.
There are several critical issues related to water policy, including: (i) what are the impacts of economic growth, international trade rules, and household consumption on water resources? (ii) what are the social and economic effects of water management instruments? (iii) how do economic sectors contribute to pressures on water resources, and what options are available to reduce such pressures? All these questions require that water data be integrated with economic data.
The purpose of the integrated modeling approach presented here is to produce reliable information to support the formulation of water use policies that foster the sustainable management of water resources, thereby preventing future conflicts and unsustainable development. By generating results that consider the hydrological and economic impacts of various water management instruments—while also identifying their limitations—this approach seeks to inform and strengthen regulatory decision-making in water policy.
Furthermore, our approach aligns with the principles of Integrated Water Resources Management (IWRM), as it is based on the understanding that water sources are interconnected with one another, as well as with human activities and other natural resources such as forests and land. Therefore, improving water management requires a holistic perspective that considers all associated resources.
In the case of the irrigated agricultural sector, pre-existing land use plays a crucial role in shaping the effectiveness of management instruments. Examples such as South Africa, a water-scarce country that has implemented regulations on land use and land use change “as an instrument to manage water resources within the broader integrated framework of land use management” (DWA, 1998), should be pursued. Integrating land use management with water management instruments enhances the effectiveness of the latter.
Conversely, Brazil’s Sugarcane Zoning Policy of 2009 (Federal Law No. 6961) was revoked in 2019, allowing public financing for sugarcane irrigation projects in areas that were previously deemed unsuitable from an agroecological perspective, such as semi-arid regions. This policy change potentially favors the expansion of sugarcane over less water-intensive crops in these areas.
Zoning serves as a vital land-use regulation tool for promoting sustainable economic development in Brazil, particularly in the Northeast (NEB), the country’s most water-scarce region. In this area, irrigation is essential for the economic viability of sugarcane cultivation and has expanded in recent years, either partially or fully supplementing the crop’s water demand (Alcoforado de Moraes, 2016; Resende et al., 2016). Ensuring the implementation of zoning policies is crucial for establishing effective water management strategies and instruments aligned with the principles of Integrated Water Resources Management (IWRM).
Without this type of alignment between land use and water policies, even well-designed water allocation instruments may lose their effectiveness in promoting an inter- and intra-sectoral water allocation scheme that enhances efficiency. This is particularly crucial in the agricultural sector and is essential for mitigating potential negative impacts of agricultural expansion while maximizing socio-economic development gains.
Otherwise, water-scarce regions with high potential for bioenergy expansion, such as NEB, may further exacerbate their water resource challenges. In addition to the increase of water supply provided for SFTP for the region, the trend of rising regional average temperatures, and the growing demand for biofuels, driven by the climate crisis, may further intensify water demand for sugarcane irrigation (Araujo, 2020; Koch et al., 2015; Marengo et al., 2017).
In Pernambuco, irrigated sugarcane production has proven to be more advantageous than other crops and economic activities (Castillo et al., 2017), primarily due to current water pricing policies, which do not account for the resource’s scarcity value. Additionally, an agricultural land suitability zoning study (Guarenghi et al., 2023) indicated that irrigation could enable sugarcane cultivation on approximately 123,000 hectares across the four interconnected basins studied, competing with less water-intensive and more resource-efficient crops.6 This expansion could come at the expense of these alternative crops and potentially limit a different development trajectory for the region—one focused on urbanization and industrialization rather than agriculture.
The essence of the Brazilian Water Resources Law (Law No. 9433, enacted in 1997) lies in its decentralized and participatory approach, in which decisions are made collaboratively and through negotiation. River basin committees—comprising representatives of water users, civil society, and public authorities—are responsible for drafting, approving, and monitoring the implementation of the basin plan. This plan is the most strategically significant instrument of Brazil’s water policy, as it is intended to guide the coordinated application of all other policy instruments. It also serves to articulate water management with environmental, sectoral, and municipal planning, thus enabling effective integrated management by river basin.
Specifically, basin plans should guide water allocation in a way that informs the implementation of management instruments such as water use permits and water charges. They should also support decision-making during situations of scarcity and conflict. However, according to a recent World Bank assessment for Brazil (2018), a key shortcoming of basin plans has been the lack of clear criteria for prioritizing water uses under conditions of conflict and chronic scarcity. In fact, a governance gap was identified regarding water allocation and the guarantee of downstream water delivery in adequate quantity and quality. The absence of such critical information hinders the establishment of water management agreements among users and undermines the effective implementation of other management instruments.
The results of the integrated platform associating economic and hydrological impacts to different allocation strategies can contribute to decision-making processes in a participatory context by providing a transparent and accessible information system available to all stakeholders. Additionally, the findings underscore the importance of integrating water management with other public policies, such as land use planning.
However, a key methodological limitation of Input–Output Models (IOMs) is that they are based on fixed, linear relationships between inputs and outputs, do not respond to price changes, and do not account for the possibility of substitution between primary production factors. These limitations can be addressed using a Computable General Equilibrium Model (CGE), another water-economy model calibrated using the IOM. A CGE model can more realistically capture inter-industry relationships and generate price responses. One such CGE model is currently being integrated into the modeling platform. Despite these limitations, the current integration with an IOM still provides valuable insights for policy formulation by revealing structural inefficiencies and emphasizing the need to align water governance with land-use planning.
Data availability statement
The datasets presented in this study can be found in a online repository: https://1drv.ms/f/c/d0e5a9baedfa1461/Ei0XH9iEvPVGuHLZAZ5X4NUBjjJMQG7pYIyw5eALI56-JA?e=TAguiK.
Author contributions
MA: Conceptualization, Formal analysis, Investigation, Project administration, Supervision, Methodology, Resources, Software, Funding acquisition, Software, Writing – original draft, Writing – review & editing. GS: Formal analysis, Investigation, Resources, Software, Data curation, Methodology, Visualization, Funding acquisition, Conceptualization, Validation, Writing – review & editing. MC: Project administration, Supervision, Software, Methodology, Conceptualization, Writing – review & editing. ND: Formal analysis, Software, Validation, Investigation, Writing – review & editing.
Funding
The author(s) declare that financial support was received for the research and/or publication of this article. Financial support for this research has been provided by CNPq/MCTI (10/2023), ANA/CAPES (16/2017), and CT-Hidro project (35/2013).
Acknowledgments
The authors would like to thank the projects teams for the contributions. The English text of this paper has been revised by Sidney Pratt, Canadian, MAT (The Johns Hopkins University), RSAdip—TESL (Cambridge University).
Conflict of interest
The authors declare that the research was conducted in the absence of any commercial or financial relationships that could be construed as a potential conflict of interest.
Generative AI statement
The authors declare that no Gen AI was used in the creation of this manuscript.
Publisher’s note
All claims expressed in this article are solely those of the authors and do not necessarily represent those of their affiliated organizations, or those of the publisher, the editors and the reviewers. Any product that may be evaluated in this article, or claim that may be made by its manufacturer, is not guaranteed or endorsed by the publisher.
Footnotes
1. ^https://www.ibge.gov.br/home/estatistica/economia/pam/2011/default.shtm
2. ^The economic gains attributed to the public supply sector (sector 56) are likely underestimated, as the model does not account for the full economic value of treated water provision to urban populations and sectors.
3. ^The economic returns associated with sugar and ethanol production (sectors 14 and 27) may be overestimated, given that the analysis does not incorporate intersectoral input dependencies—specifically, the reliance of these industries on sugarcane production.
4. ^Except for the Other Fruit Farming sector (4), Cultivation of Unspecified Crops (5), and Livestock (6). The first two sectors exhibit different allocations depending on the management instrument used [see their economic reallocation results (EP-AP) in the humid and dry regions in Figure 10b]. In the case of Livestock (6), demands were not fully met; however, the reductions were identical under both instruments, meaning that E-A = 0.
5. ^In the agricultural sector, the sugarcane activity is the one that most employs in the NEB, behind only the fishing activity (Guilhoto et al., 2010). In 2006, the share of family farming in the sugarcane sector was 14.6%, equivalent to only 1.1% of the share of family farming practiced in the cultivation of the main agricultural products of NEB (Guilhoto et al., 2014).
6. ^The sugarcane sector exhibited the lowest water use efficiency (WUE) in the study area as reported in a previous work (de Alcoforado Moraes et al., 2021).
References
Acemoglu, D., and Laibson, D. (2015). Microeconomics: Theory and Empirical Evidence. Pearson Prentice Hall.
Allan, T. (2003). IWRM/IWRAM: A new sanctioned discourse?. In: SOAS water issues study Group School of Oriental and African StudiesKing’s college London University of London, occasional paper, 50, 1–27.
ANA (2020). Título: Uso da água na agricultura de sequeiro no Brasil (2013–2017). Brasília: Agência Nacional de Águas e Saneamento Básico; Instituto Brasileiro de Geografia e Estatística (IBGE).
Araujo, E. F. M. (2020). Brazilian water resource impacts under global climate and biofuel demand changes : Universidade Federal de Pernambuco (UFPE).
Alcoforado de Moraes, M. M. G., Ribeiro, M. M., Watkins, J. D., Viana, J. N., Figueiredo, L. N., and Silva, G. (2016). Integrated economic models to support decisions on water pricing in biofuel production river basins: three case studies from Brazil. Biofuels Bioprod. Biorefin. 10, 255–269. doi: 10.1002/bbb.1581
Baker, K., Moreda, F., Van Houtven, G. G., and Cai, Y. (2016). Pernambuco food–energy–water nexus: Integrating Hydro-BID into an economic valuation framework. RTI International. Available in: https://www.rti.org/publication/pernambuco-food-energy-water-nexus-integrating-hydro-bid-economic-valuation-framework (aceessed 7 july 2025).
Beutler, L. (2016). What to do about wicked water problems. Arizona Water Resource—The Water Resources Center Quarterly Newsletter, 3–6.
Biewald, A., Rolinski, S., Lotze-Campen, H., Schmitz, C., and Dietrich, J. P. (2014). Valuing the impact of trade on local blue water. Ecol. Econ. 101, 43–53. doi: 10.1016/j.ecolecon.2014.02.003
Cai, X., Wallington, K., Shafiee, M., and Marston, L. (2018). Understanding and managing the food-energy-water nexus–opportunities for water resources research. Adv. Water Resour. 11, 259–273. doi: 10.1016/j.advwatres.2017.11.014
Castillo, R. M., Feng, K., Hubacek, K., Sun, L., Guilhoto, J., and Miralles-Wilhelm, F. (2017). Uncovering the green, blue, and greywater footprint and virtual water of biofuel production in Brazil: a nexus perspective. Sustainability 9:2049. doi: 10.3390/su9112049
de Alcoforado Moraes, M. M. G., Souza Silva, G. N., Cunha, M. P., Dias, N. B. M., Cardoso, T. F., Guilhoto, J. J. M., et al. (2021). Integration of a network-based and an economy-wide water model to support decision making on water resources planning and management in northeastern Brazil. Front. Water 3:723. doi: 10.3389/frwa.2021.681723
Guarenghi, M. M., Da Cunha, M. P., De Moraes, M. M. G. A., and Barros, A. H. C. (2023). Agricultural land suitability for rainfed and irrigated crop cultivation in a semi-arid region of northeastern Brazil. Delos 16, 2628–2647. doi: 10.55905/rdelosv16.n47-008
Guilhoto, J. J. M., Azzoni, C. R., and Ichihara, S. M. (2014). The importance of the family agribusiness to the northeast region GDP. Rev. Econ. Nordeste 45, 136–152.
Guilhoto, J., Azzoni, C. R., Ichihara, S. M., Kadota, D. K., and Haddad, E. A. (2010). Input-output matrix of the Brazilian northeast region: Methodology and results : SSRN, 254.
Guilhoto, J.J. M., Azzoni, C. R., Ichihara, S. K., Kadota, D. K., and Haddad, E. A. (2010). Input–output matrix for the Northeast and its states: methodology and results. Fortaleza: Banco do Nordeste do Brasil.
IBGE—Brazilian Institute of Geography and Statistics (2019). Sistema IBGE de Recuperação Automática. Base de Dados Agregados : Produção Agrícola Municipal.
Instituto Brasileiro de Geografia e Estatística (IBGE) (2006). Censo agropecuário 2006: Resultados preliminares : IBGE.
Koch, H., Biewald, A., Liersch, S., and Azevedo, J. (2015). Scenarios of climate and land-use change, water demand and water availability for the São Francisco river basin. Revista Brasileira de Ciências Ambientais 36, 96–114. doi: 10.5327/Z2176-947820151007
Marengo, J. A., Torres, R. R., and Alves, L. M. (2017). Drought in Northeast Brazil—past, present, and future. Theor. Appl. Climatol. 129, 1189–1200. doi: 10.1007/s00704-016-1840-8
Megdal, S. B., Eden, S., and Shamir, E. (2017). Water governance, stakeholder engagement, and sustainable water resources management. Water 9:190. doi: 10.3390/w9030190
Montoya, M. A., and Finamore, E. B. (2020). Os recursos hídricos no agronegócio brasileiro: Uma análise insumo-produto do uso, consumo, eficiência e intensidade. Rev. Bras. Econ. 74, 441–464. doi: 10.5935/0034-7140.20200021
Resende, R. S., Amorim, J. R. A., de Pacheco, E. P., Meneses, T. N., and Carvalho, T. B. de.. (2016). Planting dates and irrigation demand of sugarcane in the Coastal Tablelands region of Northeast Brazil. Aracaju: Embrapa Coastal Tablelands. (Embrapa Coastal Tablelands. Research and Development Bulletin, 121). Available at: https://www.infoteca.cnptia.embrapa.br/handle/doc/1064904 (Accessed on: July 7, 2025).
Schmitz, C., Lotze-Campen, H., Gerten, D., Dietrich, J. P., Bodirsky, B., Biewald, A., et al. (2013). Blue water scarcity and the economic impacts of future agricultural trade and demand. Water Resour. Res. 49, 3601–3617. doi: 10.1002/wrcr.20188
Keywords: water allocation, optimization, network-based models, input-output models, multiobjective analysis, pareto surface, integrated economic modeling, IWRAM
Citation: Alcoforado de Moraes MMG, da Silva GNS, da Cunha MP and Dias NBM (2025) Trade-offs of water non-market- and market-based management instruments: a Brazilian case study of a sugar and ethanol production area. Front. Water. 7:1603777. doi: 10.3389/frwa.2025.1603777
Edited by:
Serena Ceola, University of Bologna, ItalyReviewed by:
Rana Muhammad Adnan Ikram, Hohai University, ChinaRobert Home, Anglia Ruskin University, United Kingdom
Copyright © 2025 Alcoforado de Moraes, da Silva, da Cunha and Dias. This is an open-access article distributed under the terms of the Creative Commons Attribution License (CC BY). The use, distribution or reproduction in other forums is permitted, provided the original author(s) and the copyright owner(s) are credited and that the original publication in this journal is cited, in accordance with accepted academic practice. No use, distribution or reproduction is permitted which does not comply with these terms.
*Correspondence: Márcia M. G. Alcoforado de Moraes, bWFyY2lhLmFsY29mb3JhZG9AdWZwZS5icg==