 Yunbei Pan
 Maria R. D’Orsogna
 Min Tang
 Thomas Stiehl4
 Tom Chou
- 1Department of Computational Medicine, UCLA, Los Angeles, CA, United States
- 2Department of Mathematics, California State University at Northridge, Los Angeles, CA, United States
- 3Institute of Natural Sciences, Shanghai Jiaotong University, Shanghai, China
- 4Institute of Computational Biomedicine, RWTH Aachen University, Aachen, Germany
- 5Department of Mathematics, UCLA, Los Angeles, CA, United States
Hematopoiesis has been studied via stem cell labeling using barcodes, viral integration sites (VISs), or in situ methods. Subsequent proliferation and differentiation preserve the tag identity, thus defining a clone of mature cells across multiple cell type or lineages. By tracking the population of clones, measured within samples taken at discrete time points, we infer physiological parameters associated with a hybrid stochastic-deterministic mathematical model of hematopoiesis. We analyze clone population data from Koelle et al. (Koelle et al., 2017) and compare the states of clones (mean and variance of their abundances) and the state-space density of clones with the corresponding quantities predicted from our model. Comparing our model to the tagged granulocyte populations, we find parameters (stem cell carrying capacity, stem cell differentiation rates, and the proliferative potential of progenitor cells, and sample sizes) that provide reasonable fits in three out of four animals. Even though some observed features cannot be quantitatively reproduced by our model, our analyses provides insight into how model parameters influence the underlying mechanisms in hematopoiesis. We discuss additional mechanisms not incorporated in our model.
Introduction
Hematopoiesis, the process by which hematopoietic stem cells (HSCs) generate all mature blood cells in an animal through proliferation and differentiation plays a crucial role in an organism’s immune response and maintaining overall homeostasis. Estimates of the number of actively cycling HSC range from 50000–200000 in humans (Lee-Six et al., 2018) and approximately 5,000 in mice (Busch et al., 2015; Mayle et al., 2015). It is well-known that these small numbers of hematopoietic stem cells can generate 1010–1012 cells of multiple cell types daily, over an organism’s lifetime (Fliedner, 2002; Doulatov et al., 2012). Understanding the mechanisms of hematopoiesis can help guide clinical treatment, especially those related to bone marrow transplantation and in the context of blood cancers (Mendelson and Frenette, 2014; Busch et al., 2015; Goyal et al., 2015).
HSCs are often quiescent (Seita and Weissman, 2010), making them hard to track in vivo and difficult to control in vitro. Thus, the HSC dynamics in vivo can only be straightforwardly interrogated through analysis of populations of more downstream progenitors and differentiated blood cells (Bystrykh et al., 2012). One way to quantitatively probe the hematopoiesis process is the labeling of multipotent HSCs by tagging their genomes. The tags can take the form of viral integration sites or barcodes (Grosselin et al., 2013; Kim et al., 2014; Wu et al., 2014; Biasco et al., 2016; Koelle et al., 2017). In a typical in vivo experiment, CD34+ stem cells are extracted, tagged, and then autologously transplanted back into the animal, typically a mouse or a rhesus macaque. CD34+ cells contain HSCs as well as early hematopoietic stem and progenitor cells (HSPCs), with a wide range of estimated relative proportions (Corso et al., 2005; Attar, 2014; Parmentier et al., 2020). The downstream progenitor and mature cells that derive from proliferation of HSCs of a particular tag will form a clone of cells that share the same tag. Clonal tracking of cell tags is thus a powerful tool for interrogating the differentiation process during hematopoiesis (Lyne et al., 2018; Challen and Goodell, 2020; Cordes et al., 2021). For example, the abundances of the different tags that appear in the different types of mature cells can shed light on the branching structure of differentiation and on proliferation dynamics, particularly when coupled with mathematical models and/or simulations (Stiehl and Marciniak-Czochra, 2011; Sun and Komarova, 2012; Székely et al., 2014; Höfer and Rodewald, 2016; Xu J. et al., 2018).
Clonal tracking in mice (Copley et al., 2012; Sun et al., 2014) has revealed the timescales of repopulation dynamics under homeostasis and after bone marrow transplantation (Muller-Sieburg et al., 2012; Verovskaya et al., 2013; Busch et al., 2015), but typically involves very few clones that cover only a small fraction of the HSC population. To transplant many HSC clones in order to see patterns of how clones are distributed during hematopoiesis requires experiments on animals larger than mice.
Transplant experiments in rhesus macaque on the other hand allow for hundreds or thousands of clones to be engrafted into an organism that exhibits population levels and timescales closer to those in humans. One experiment in rhesus macaque involved tracking HSC clonal dynamics of lentivirus-tagged HSCs and early progenitor cells (HSPCs), and following hematopoiesis over a time period comparable to the animal’s life-span (Kim et al., 2010, 2014). Here, CD34+ HSPCs from the bone marrow, which include various progenitor cells, were marked via the integration of a lentivirus vector with an accompanying green fluorescent protein (GFP) tag at random viral integration sites (VISs). After sublethal myeloablative irradiation to eliminate a substantial number of cells in the bone marrow, the tagged HSPCs were autologously transplanted. If these cells divide and differentiate after transplantation, their progeny will inherit the unique VISs. Sampling and sequencing of these mature cells indicates which ones are descendants of a founder HSC. Data collected from four macaques over 14 years were analyzed showing how bias towards the lymphoid or myeloid differentiation branches changes over time. More detailed analyses were also performed in order to connect clonal patterns during hematopoiesis with a mathematical model that describes how self-renewal, differentiation, and subsampling of a multiclone population affects clone abundances and their fluctuations across time (Goyal et al., 2015; Xu S. et al., 2018). By fitting a simple mechanistic model to abundances of hundreds to thousands of clones, random initial differentiation events that each led to a subsequent burst of mature cells was proposed as a mechanism to explain observed population fluctuations. The number of generations L that progenitor cells traverse along a differentiation pathway (lineage) before terminal differentiation was also estimated to be L ∼ 24 for the granulocyte lineage (Xu S. et al., 2018). To obtain this result, a mean-field model for HSC self-renewal was developed and applied to experimental data on granulocytes, using only the mean and variance of clone populations in the data fitting.
In this paper, we improve on the model used in (Xu S. et al., 2018) by developing a framework that can explain population transients and that can predict the density of the number of clones with respect to mean clone sizes. Instead of analyzing VIS data from (Kim et al., 2010, 2014), we consider the barcode data from (Wu et al., 2014; Koelle et al., 2017). In the latter experimental studies, replication-incompetent HIV-derived lentiviral barcoding vectors were used to tag HSCs that were transplanted into four rhesus macaques. The barcode consists of a six base-pair library identification and a 35 base pair high-diversity cellular barcode. As with the VIS experiments, barcoded cells were reinfused in the animals after myeloablative total-body irradiation. Purified samples of blood cells were then subject to low-cycle PCR amplification with the two primers bracketing the barcode. This barcoding approach provides more precise quantification relative to other clonal tracking protocols such as VIS (Kim et al., 2014) and transposon tagging (Sun et al., 2014) approaches. Thus, we will analyze the barcoding data via a mathematical model with the goal of more accurately estimating physiological parameters such as HSC carrying capacity, progenitor cell division rates, and progenitor cell proliferative potential for the granulocyte cell lineage. Although clonal structure of mature cells of different lineages, such as T, B, monocytes, and NK cells, were quantified in (Wu et al., 2014; Koelle et al., 2017), lymphocyte maturation is more complex, involving additional intermediate steps and subsequent immune signaling and mature cell proliferation. Thus, we focus on the simpler and abundant mature granulocyte population (Bystrykh et al., 2012).
In the following Materials and Methods section, we briefly describe the raw data and present the mathematical model. In the Data Analysis and Results section, we describe how measured clone data is compared to predicted clone abundances and show that minimization of the difference leads to reasonable estimates of parameter estimates. Finally, in the Discussion and Conclusions, we provide qualitative insight into how model parameters affect the predicted clonal patterns and discuss further improvements and potential new modeling directions.
Materials and methods
In this section, we describe information extracted from the granulocyte abundance data in (Koelle et al., 2017) and the mathematical model used to describe this data. The experimental parameters associated with the experiments are listed in Table 1, which lists the number of cells (tagged and untagged) transplanted, the barcode library size used, and the total number of different barcodes observed across all samples of all lineages for each animal. These values inform us on the typical magnitude of experimental parameters to which our subsequent model must conform. In Table 2, we list parameters used in our mathematical model as determined either from experimental data or through estimates.
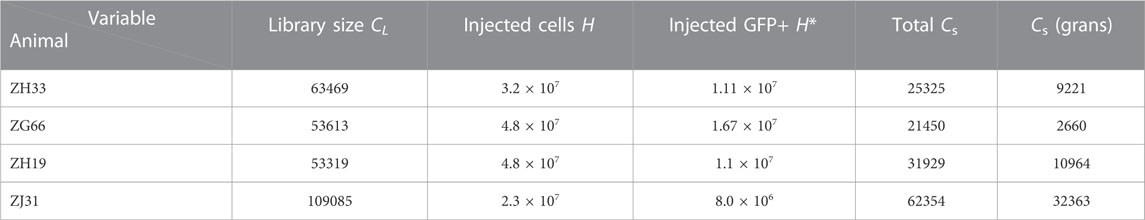
TABLE 1. Transplant parameters. The initial transplant populations for the four animals ZH33, ZG66, ZH19, and ZJ31. The total library size for the cell preparation was in the range CL = 53319 − 109085. The total number of cells injected was H = 2.3 × 10⁷ − 4.8 × 10⁷, of which H* = 8.0 × 10⁶ − 1.67 × 10⁷ were barcoded (corresponding to 23%–35% GFP+ labeling). Across all peripheral blood samples and cell lineages, the total number of barcodes detected in each animal was in the range
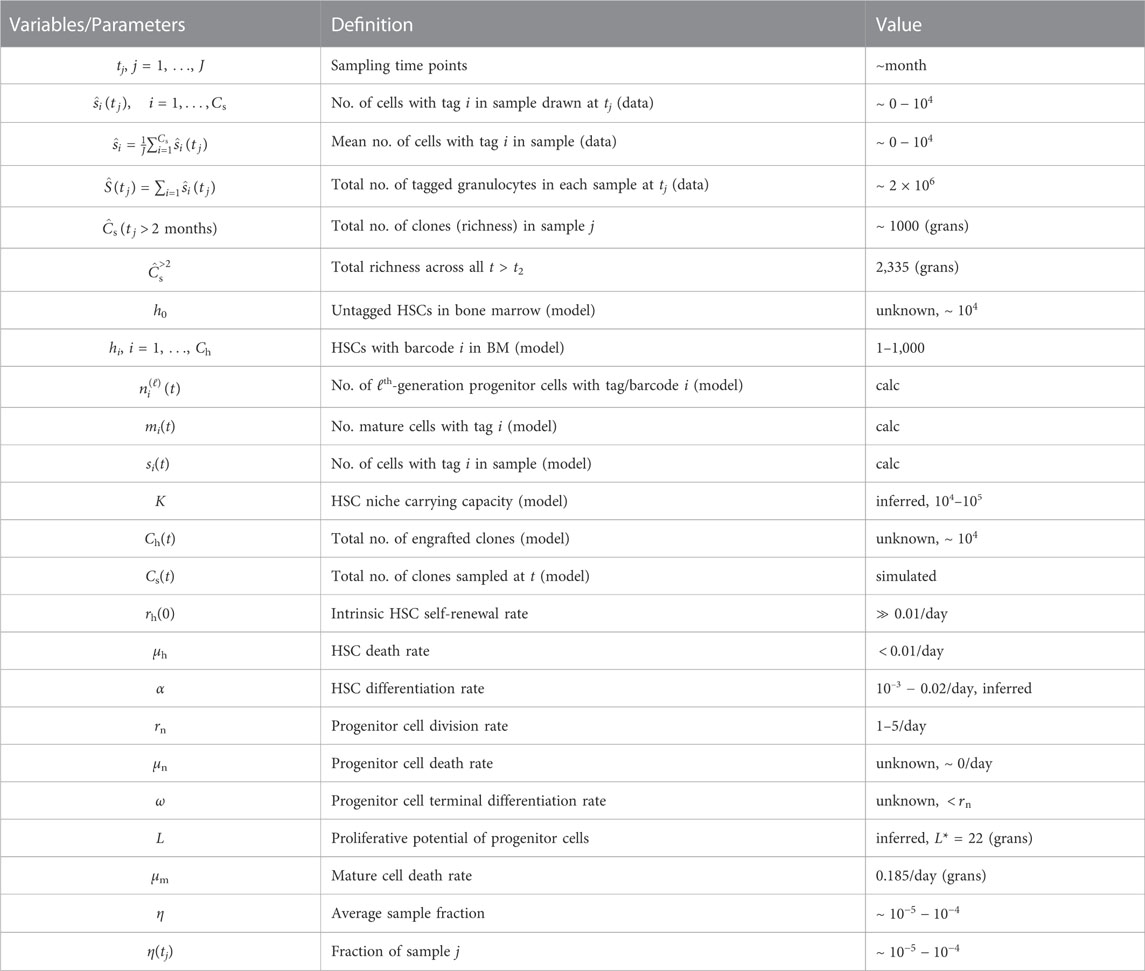
TABLE 2. Overview of variables and parameters. Parameters and variables and their estimated values if known. Some values need to be calculated from our model and are denoted “calc.,” while others need to be self-consistently estimated. For example, from GFP tagging, the fraction of tagged HSCs is approximately
Measured quantities
First, we consider the observed data associated with each animal (Koelle et al., 2017), as shown in Figure 1. Granulocytes in blood samples drawn from each animal at times points tj, j = 1, 2, …, J are sequenced and clonal (barcode) abundances tabulated. The total abundance (number of mature cells of a given cell type),
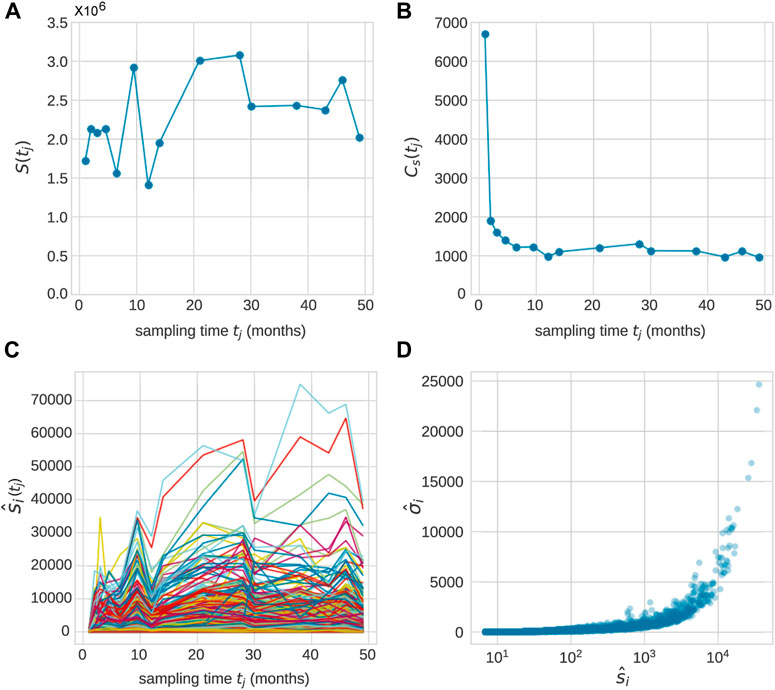
FIGURE 1. After transplantation, peripheral blood samples were taken across J time points tj, j = 1, …, (J). Typically, measurements were taken over 20–49 months and J = 10 − 15. (A) The total population
An example of the abundances of each clone within the granulocyte population from Koelle et al. (Koelle et al., 2017) is shown in Figure 1C. In these experiments, tagged stem cells are transplanted back into a rhesus macaque at t = 0 so that initially each clone consists of a single cell. A series of 1 ≤ j ≤ J samples are taken at time tj after implementation, yielding a set of mature cells. We denote the abundance of clone i (among granulocyte cells) in the sample taken at time tj after transplantation as
Note that the total measured population of any cell type
For each clone at
In the remainder of this paper we will develop a mathematical model that we can simulate to generate total populations, clonal populations, and their associated attributes (si, σi, ρi). Note that while there are many existing mathematical models of hematopoiesis (Colijn and Mackey, 2005; Peixoto et al., 2011; De Souza and Humphries, 2019), they describe only time variations in total populations, rather than that of lower-population, individual clones. We will tune parameters of the model so that its predictions provide a reasonable match to the aforementioned measurements, paying particular attention to clone abundances and clone size variability.
Mathematical modeling
Our mathematical model incorporates known and accepted features of hematopoiesis. Three main cell compartments are considered: hematopoietic stem cells (HSCs), transit amplifying progenitor cells, and peripheral mature cells. Although the stem cell population in bone marrow is large and can be described using a deterministic model, the initial populations within each clone are small and require a discrete stochastic description. We will then assume that a small sample of mature cells is drawn from the animals at times tj, j = 1, 2, …, J and sequenced.
We first describe the initial conditions including the number of HSCs and HSPCs injected into each animal. As listed in Table 1, H is the total number of HSCs injected into each animal, among which H0 are untagged and Hi ≪ H0 contain barcode 1 ≤ i ≤ CH (and are GFP+). The total tagged HSC population is
where
A certain fraction η0 of the H HSCs home into the bone marrow, successfully engraft, and subsequently actively self-renewal and/or differentiate. Engrafted HSC populations are defined by
The random selection of cells into the bone marrow can be thought of as a sampling (without replacement) process. Including the untagged population, the probability distribution of engrafted cells resulting from the injected tagged cell population
where H* and
To extract the overall probability of initial condition h(0), we average Eq. 3 over the prior
Besides the initial condition hi(t = 0) = 1, the initial number of untagged HSCs h0(t = 0) is related to the transplantation efficiency and is generally unknown. Barcodes are associated with a GFP tag and the initial fraction of sampled cells that are GFP+ is
Self-renewal, death, and differentiation into progenitor cells all contribute to the stochastic dynamics of hi. Although the total HSC population in the niche
where rh(0) is the intrinsic proliferation rate of a single, isolated HSC. Note that the untagged HSCs are included through h0. Finally, we assume that HSCs die at rate μh and differentiate at rate α and that these rates, like the growth rate in Eq. 5, do not depend on barcode identity.
As shown in the Supplementary Material, the richness Ch(t) may progressively decrease from random HSC death and extinction and can be estimated by solving for the stochastic birth-death process (neglecting outflux from differentiation) and using generating functions to find
where
In this expression, rh(t) is approximated by
We will also simulate the stochastic birth-death process for HSCs (see Supplementary Material for details), with the differentiation rate α that allows HSCs to differentiate into the progenitor/transit amplifying cell compartment (see Figure 2). Progenitor cells are further distinguished by their generation ℓ. Thus, ℓ not only measures generation number but also an effective differentiation state. Each HSC differentiation event leads to an ℓ = 0 progenitor cell. Since the number of HSCs of any one clone is small, the initial differentiation events from clone i follow a Poisson process with rate αhi. The populations of the subsequent generations of progenitor cells in clone i are denoted by
where Poisson(αhi(t)) is the time-inhomogeneous point Poisson process describing HSC differentiation events. In other words, after a differentiation event at time t1, the probability density of the time Δt to the next differentiation event is given by
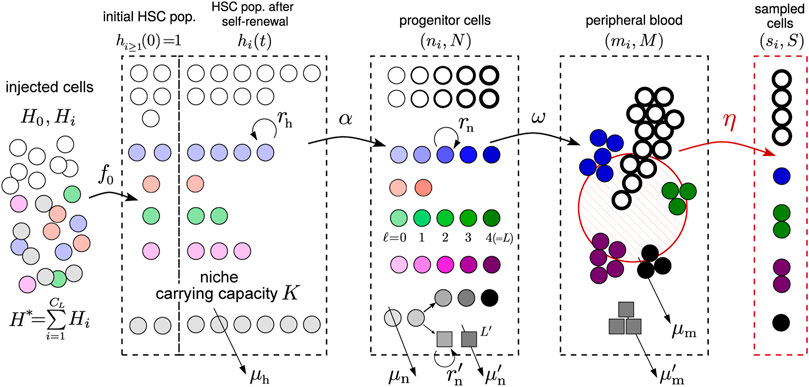
FIGURE 2. Schematic of the hybrid stochastic-deterministic model. Tagged (barcoded) stem cells are transplanted into an animal initially with one cell (hi(t = 0) ≈ 1) per clone. These cells, together with the untagged ones (h0(t = 0) ≫ 1) then undergo self-renewal and death, at rates
In Eq. 8,
Consider a single isolated differentiation event of an HSC at t = 0 belonging to a particular clone. The resulting progenitor cell population after this event is described by Eq. 8 without the Poisson(αhi(t)) term but with an initial condition corresponding to a single ℓ = 0 cell:
The subsequent populations at time t form a temporal “burst” of cells that are described by
We can evaluate all populations
If we assume that mature cells do not appreciably proliferate1, the mature cell population in clone i obeys
where μm is the lineage-dependent turnover rate of mature cells. Using the solution to
The mature cell population burst (of a specific clone) arising from a single, isolated differentiation event is plotted in Figure 3A. Note that the expression for a mature cell burst given in Eq. 12 is derived from the specific initial condition Eq. 9; however, some low-ℓ progenitors are also initially transplanted (see below). Thus, mi(t) will in general depend on the initial numbers of n(ℓ>0)(0).
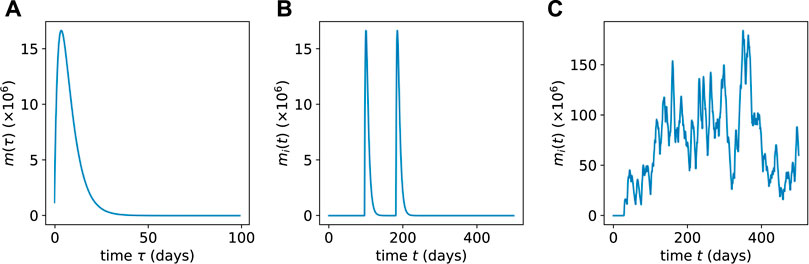
FIGURE 3. (A) The population mi(t) of mature cells resulting from a single HSC differentiation event as obtained from Eq. 12. (B) Multiple concatenated bursts from a low-population HSC clone showing well-separated intermittent pulses obtained via Eq. 13. (C) When the HSC population of a clone is large, the resulting mature cell population bursts merge together and exhibit lower relative variability.
Since Eq. 8 are linear, populations arising from a sequence of Poisson-distributed differentiation events can be constructed by adding those derived from single events occurring at times Tk. In this case, the resulting mature cell population at time t is given by
where mi(t − Tk) is the solution given in Eq. 12 (for the specific initial condition in Eq. 9). Two different sequences of bursts are shown in Figures 3B, C. In Figure 3B, we consider a clone with few HSCs such that αhi(t) ≪ μm. This limit gives rise to differentiation events that occur rarely over the lifespan of mature cells, as depicted Figure 3B. In Figure 3C, we plot a sequence of more frequent mature cell population bursts that arise for more frequent differentiation events αhi(t) ≫ μm from HSCs that are in higher population clones.
Recall that the calculations involving Eqs 8–12 are performed for each clone i, resulting in a series of time-dependent expressions for mi(t) as per Eq. 12. These single event responses are then summed according to Eq. 13 to arrive at the total, time-dependent population of mature cells of a specific type and carrying the same barcode. These predicted whole-organism populations depend on the model parameters
Since the clone abundances are derived from sequencing cells in a small fraction η (for rhesus macaque, η ∼ 10–5 − 10–4) of the animal’s blood taken at times tj, we also need expressions for mature cell populations within a sample. Given the small sample sizes η, low population clones in the mature cell pool can easily be missed. For a given population mi in the whole animal, the probability that si cells are captured in the sample is given by (Chao and Lin, 2012; Xu et al., 2020)
where, for a given cell type (for example granulocytes), S(t) = ∑i=0si(t) is the total number of sampled cells (including untagged ones), M(t) = ∑i=0mi(t) is the total number of circulating mature cells (including untagged ones), and the sampling fraction is η = S/M (which we first assume is the same at each tj).
After computing mi at time tj using Eq. 12, we take the nearest integer value and use it for mi in Eq. 14. We then draw a single value si(tj) from the binomial distribution, assuming η is given. Finally, we simulate our model to generate trajectories of M(t) and then determine the tagged sampled fraction
Equations 5–15 represent a hybrid stochastic-deterministic model since the self-renewal process of a small number of HSCs in each clone and the final sampling step (Eq. 14) are modeled as discrete stochastic processes, while proliferation and differentiation of higher population progenitor and mature cells are treated deterministically via Eqs 8–12. The values si(tj) obtained from the model in Eqs 8–14 are used to generate the predicted clone population mean and standard deviations, si and σi, according to Eq. 1. Both si, σi are then used to determine the density of points ρi. These three values for each clone are then compared to their corresponding values constructed from data
Data analysis and results
Data presentation
The published experimental data in (Koelle et al., 2017) provide data for four rhesus macaques ZH33, ZG66, ZH19, and ZJ31 over a period of 49, 42, 36 and 20 months, respectively. Samples were taken after autologous transplantation with myeloablative conditioning at times tj, 1 ≤ j ≤ J. Possible sampled cells are of five types: T cells, B cells, monocytes, granulocytes and NK cells. Barcoded myeloid (granulocytes and monocytes) and B-cells reach a noisy equilibrium after approximately 1 month, whereas for T-cells the time frame is longer, between 5 to 17 months. Furthermore, since granulocytes comprise a majority of white blood cells, we apply our mathematical and statistical model to the granulocyte lineage. At each sampling time tj, the experimental data from (Koelle et al., 2017) reveals how many cells are sampled from each clone and what type each cell is. Across sampling time points, these sampled populations contain information on the overall abundance, how these abundances fluctuate in time, and the density of the number of clones detected as a function of abundance and abundance variability. Since ZH33 has the longest follow-up period, we use data from this macaque to compare experimental data with our mathematical predictions.
Matching model to data
Validation of our model will rely on matching predictions with available data in the form of
First, we compare Ch(t) (Eq. 6) with the richness
We first set K ≈ 100Ch(0) as the niche carrying capacity since smaller or larger values of K cannot provide the correct average clone sizes or approximately matching values of Cs. This comparison allowed us to obtain rough constraints and approximations to some parameters, particularly μh, rh(0), and Ch(0). Discrete sets of values that are consistent with
The sampled richness
As shown in Figure 4, a fraction of the initial clones are HSPCs. Once these HSPC clones generate a burst of mature cells, they disappear from the animal without being renewed since there are no corresponding HSCs carrying the same barcode. Thus, the HSPC contribution to the overall sampled richness
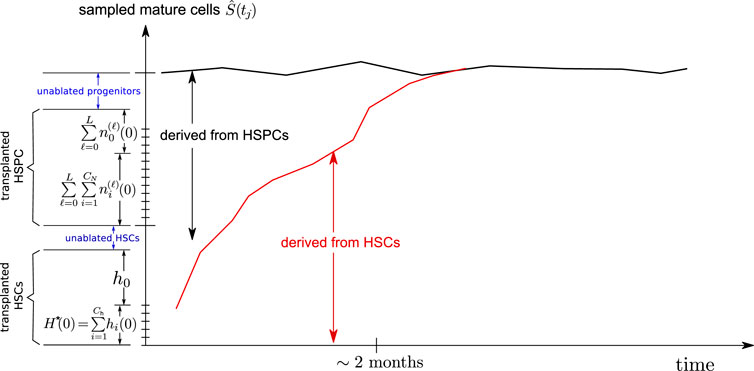
FIGURE 4. Schematic of a mixed HSC/HSPC initial condition. The transplanted CD34+ cells contain HSCs and some progenitor cells (HSPCs), which are exhausted after about 2 months. The remaining richness arises mainly from that of the long term HSCs Ch(0) which then slowly decreases as certain HSC clones become extinct.
Next, we consider the small clones, predominantly arising at short times, and find their average value at the first sample taken at t1. These small clones also yield the highest density values
Next, we least-squares minimize
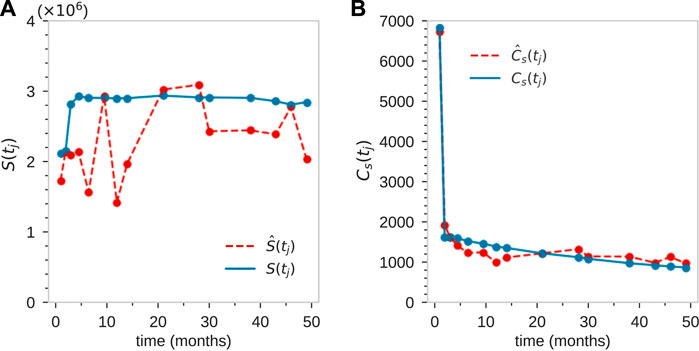
FIGURE 5. For animal ZH33, coarse fitting to the total population of tagged granulocytes S(tj) (A), and the total number of clones at each time point Cs(tj) (B). This initial rough matching was achieved using parameter values L = 22, rn ≈ 2, ω ≈ 0.2, and sampling size η = 10–5.
To compare our modeling results to the remaining experimental data (
Thus, before comparing predicted clone size distributions to measured results, we first cluster the data according to the values of
Figure 6A compares
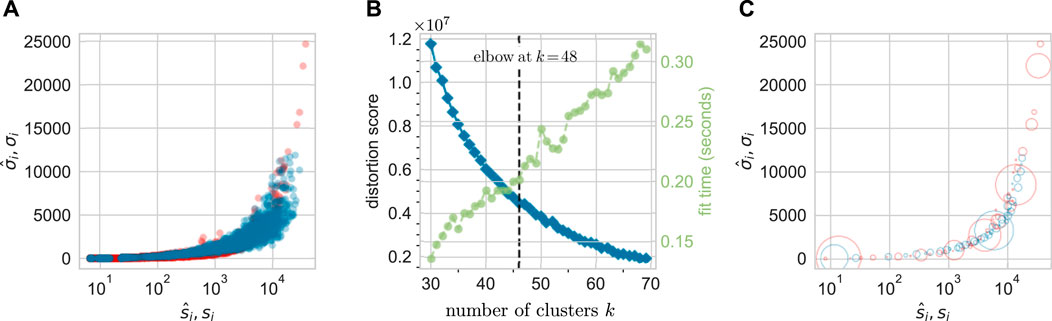
FIGURE 6. A total of 48 clusters are identified via k-means clustering of the data from animal ZH33. (A) The unclustered
Thus, we have clustered measured data according to
In order to compare the clustered data P to the model prediction Q, which are matrices with different numbers of rows, we use the Wasserstein metric, or Earth mover’s distance (EMD) (Villani, 2009; Kolouri et al., 2017) to define a distance between them. Let dk,ℓ denote the distance between cluster pk and cluster qℓ so that the matrix a d = {dk,ℓ} catalogues all possible cluster-cluster distances. We aim to compute a flow map f = {fk,ℓ} that yields the minimal distance between clusters p = {pk} and clusters q = {qℓ} by finding
Subject to the constraints
For all 1 ≤ k ≤ k* and 1 ≤ ℓ ≤ ℓ* and
After finding the optimal flow f, we evaluate the EMD as
Model parameters are varied until our model-derived predictions best match the clustered data by minimizing the EMD. In this paper, we consider only the granulocyte lineage since it is the most abundant and reliably measured with minimal complex dynamics and regulation.
Finally, note the fluctuations in S(tj) which are too large to be captured by the intrinsic stochasticity in our model, as indicated in Figure 5B. These “unknown” fluctuations can arise from a number of processes, including variable sampling fractions η(tj) at each time point tj and fluctuating animal state due to infections, stress, inflammation, etc. These may influence total mature cell populations month to month. Some of these effects can be effectively accounted for by adjusting the mean sample fraction η = 10–5 by an amount Δη(tj) at each time point. Using these values of Δη(tj) to match the data S(tj), and then readjusting the parameters, we find good comparison between the experimental measurements and our model, as shown in Figures 7A–C.
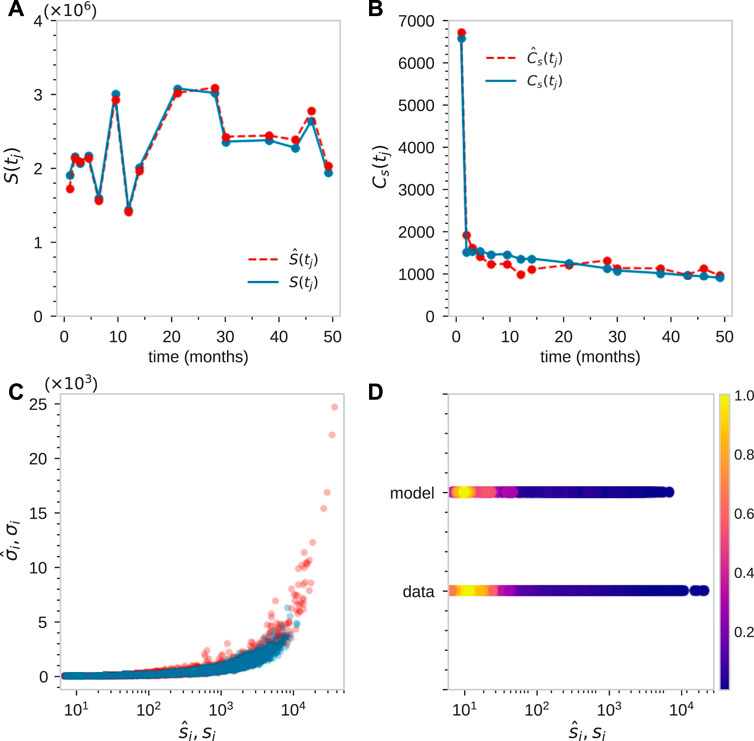
FIGURE 7. Fitting of tagged granulocyte populations for animal ZH33 after time-dependent adjustment of sampling size η(tj). For this animal tj = [1, 2, 3, 4.5, 6.5, 9.5, 12, 14, 21, 28, 30, 38, 43, 46, 49] months. (A) By initially best-matching S(tj), we find η(tj) = [1, 2.03, 1.07, 0.94, 0.68, 1.25, 0.61, 0.83, 1.29, 1.29, 1.01, 1.01, 0.99, 1.14, 0.83]×10–5. (B–D) By searching parameter space to find a good match to
To further show consistency, we then plotted the predicted density and compare it with the data-derived (using KDE) density
Discussion and conclusion
In this paper, we analyzed data from stem cell transplantation experiments in rhesus macaque (Koelle et al., 2017) in which barcoded stem and progenitor cells (HSPCs) were autologously transplanted after myeloablative conditioning. Typically, of the
In order to explain clone size variability, we extend a mathematical model first presented in (Xu et al., 2018). Our hybrid stochastic-deterministic model delineates all the clone populations and assumes regulation of the stem cell proliferation rate through a carrying capacity K, a finite differentiation potential of progenitor cells, terminal differentiation after a fixed number of divisions, and a final sampling step. Since the numbers of HSCs within each clone are typically small, we treated the self-renewal of HSCs within its niche stochastically by a coupled (through the carrying capacity) discrete birth-death process for each clone. In (Xu et al., 2018), the coupling in the stochastic HSC birth-death process was treated using a mean field approximation, which leads to a smaller clone size variability, everything else equal. Random times of asymmetric differentiation of each HSC into the first-stage progenitor cell is described by a rate α. After L differentiation steps, the Lth-stage progenitor cell terminally differentiates into a mature, circulating blood cell. The progenitor and mature cell pools are treated deterministically. We performed stochastic simulations using the Gillespie algorithm (Bortz et al., 1975; Gillespie, 2007) of the entire HSC pool and solve for the progenitor and mature cell populations numerically. Additional feedback mechanisms between the HSC and progenitor pools can be implemented (Klose et al., 2019), but in our case would require a more complex model incorporating two-way coupling between stochastic and deterministic dynamics.
Our model suggests that the sampled clone abundance variation arises primarily from random differentiation events by HSC clones that occur at rate α. Each differentiation event leads to a temporal burst of mature cells of the same clone. We hypothesize that these bursts of mature cell production lead to the variability in sampled clone populations. Other physiological factors related to animal state may still also play a role, but are not considered in our model. Another feature captured by our current model is the transient richness immediately after transplantation. This behavior is explained by our initial condition that contains short-term HSPCs that are within the initial CD34+ pool. These HSPCs quickly differentiate but are not replenished at long times. This distributed initial condition may depend on the experimental protocol and may be indicative of the efficiency, and especially, the composition of the transplant.
Our model also allows us to explore how clone abundance predictions change with parameters. For example, we find that the range of larger clone sizes increase with increases in L, K, and α, in this order. All parameters affect the density of predicted data and cluster sizes. Mature cell death rates, which vary across different cell types, also affect the predicted abundance variations, especially for larger values of μm.
We also note that while percentage of GFP+ cells within each mature cell type (lineage) fluctuated from sample to sample, they generally increased with animal age (after transplant) for all animals. T cells had the largest increase in their barcoded populations during the handful of months after transplantation. Since this timescale is much longer than the progenitor cell transients, this slow increase in tagged cell populations suggests that, assuming a neutral model (barcodes and barcode integration sites do not affect cell proliferation and death rates), (i) that a certain fraction of HSCs remained in situ after radiative ablation, and (ii) the CD34+ barcoded and transplanted HSC population with an enriched GFP+ fraction were slowly activated. Scenario (i) means that some HSCs remained in their niche and continuously generated blood. The transplanted cells with barcoded HSCs (GFP+) can increase in importance if they slowly become more proliferative as they settle into the animal. Thus, the slow increase in GFP+ fraction in all five measured lineages suggest that transplanted cells may recover slowly from the transplantation procedure and increase their contribution to mature blood cell formation.
Finally, we note that there appears to be additional fluctuation mechanisms that are not accounted for in our model. In all animals, there appears to be a few very large clones with very high variability
Animal ZJ31 (see Supplementary Material) appears to be uniquely different from the others in that it exhibited a much larger richness
One assumption of our model that is likely an oversimplification is the neutrality of barcodes. Although different barcodes themselves may not influence cells, different VISs may. For example, aberrant self-renewal arises when using lentiviral vectors (Espinoza et al., 2019) and different VISs of HIV have been shown to affect cellular proliferation rates (e.g., if the VIS is near an oncogene) Yeh et al. (2021). Besides the non-neutrality, we have also neglected stochastic or variable proliferative potential L and the time course of the HSC homing and engraftment into the bone marrow. A random but distributed L would allow a few randomly selected clones to expand further. We also expect that HSC migration and successful settlement into the bone marrow niche is a time-continuous process that provide a proliferation head start for a few early arriving clones. This would ultimately result in fewer clones Cs with some of them at higher populations si(t). An instantaneous (more abrupt) HSC engraftment and a larger spread in L would be more consistent with animal ZJ31 than with the others.
Additional information can be extracted from the clone abundance data to further identify and interrogate such “opposing” behaviors. For example, we have only considered the average autocorrelation of the clone abundances (the variance) and have not constructed cross-correlations between cell types/lineages or correlations across time. Except for the initial period after transplantation, we have assumed a time-inhomogeneous process and have not considered explicit time-dependence such as aging (Muller-Sieburg et al., 2012; de Haan and Lazare, 2018). Physiological aging can be straightforwardly incorporated by e.g., allowing for slow degradation of HSCs, changes in progenitor proliferative potential (Marciniak-Czochra et al., 2009), or changes in HSC niche carrying capacity K(t). Mutations that arise with age may also increase HSC self-renewal (Challen and Goodell, 2020) which could be modeled by a rh(0) that increases with time. Thymic interruptions or involution with age (Lewkiewicz et al., 2019a,b) could also be modeled by assuming a decreasing maturation rate ω(t) when considering the T cell lineage.
While our current model contains a large number of parameters, it seems that a number of them are compensatory and control specific properties of the model predictions. For example, we found that α, L, ω, and η can compensate for each other and form an unknown effective parameter function f(α, L, ω, η). This feature effectively reduces overfitting and might be better analyzed using machine learning methods. Incorporating the more realistic mechanisms discussed above would yield additional effective parameters allowing the model to more accurately reproduce the measured quantities; nonetheless, intermittent differentiation of HSCs remains the key proposed mechanism for understanding intersample clone abundance variations.
Data availability statement
Publicly available datasets were analyzed in this study. This data can be found here: https://doi.org/10.1182/blood-2016-07-728691.
Author contributions
TC, YP, and MD’O developed and analyzed the model and wrote the manuscript. YP organized the data, performed numerical analyses, and data fitting. MT contributed to the analysis of the model and helped shape the stochastic simulation approach. TS provided insight on stem cell biology.
Funding
This work was supported by grants from the NIH through grant R01HL146552 (TC) and the Army Research Office through grant W911NF-18-1-0345 (MD’O) and DMS-1814090 (MD’O).
Conflict of interest
The authors declare that the research was conducted in the absence of any commercial or financial relationships that could be construed as a potential conflict of interest.
Publisher’s note
All claims expressed in this article are solely those of the authors and do not necessarily represent those of their affiliated organizations, or those of the publisher, the editors and the reviewers. Any product that may be evaluated in this article, or claim that may be made by its manufacturer, is not guaranteed or endorsed by the publisher.
Supplementary material
The Supplementary Material for this article can be found online at: https://www.frontiersin.org/articles/10.3389/fsysb.2023.893366/full#supplementary-material
Footnotes
1Certain lineages such as T cells can intermittently proliferate, e.g., upon antigen activation, but we neglect this and use small effective death rates μm for such cell types.
References
Abbuehl, J. P., Tatarova, Z., Held, W., and Huelsken, J. (2017). Long-term engraftment of primary bone marrow stromal cells repairs niche damage and improves hematopoietic stem cell transplantation. Cell. Stem Cell. 21, 241–255. doi:10.1016/j.stem.2017.07.004
Abkowitz, J. L., Catlin, S. N., and Guttorp, P. (1996). Evidence that hematopoiesis may be a stochastic process in vivo. Nat. Med. 2, 190–197. doi:10.1038/nm0296-190
Attar, A. (2014). Changes in the cell surface markers during normal hematopoiesis: A guide to cell isolation. Glob. J. Hematol. Blood Transfus. 1, 20–28. doi:10.15379/2408-9877.2014.01.01.4
Biasco, L., Pellin, D., Scala, S., Dionisio, F., Basso-Ricci, L., Leonardelli, L., et al. (2016). In vivo tracking of human hematopoiesis reveals patterns of clonal dynamics during early and steady-state reconstitution phases. Cell. Stem Cell. 19, 107–119. doi:10.1016/j.stem.2016.04.016
Bortz, A. B., Kalos, M. H., and Lebowitz, J. L. (1975). A new algorithm for Monte Carlo simulation of ising spin systems. J. Comput. Phys. 17, 10–18. doi:10.1016/0021-9991(75)90060-1
Busch, K., Klapproth, K., Barile, M., Flossdorf, M., Holland-Letz, T., Schlenner, S. M., et al. (2015). Fundamental properties of unperturbed haematopoiesis from stem cells in vivo. Nature 518, 542–546. doi:10.1038/nature14242
Bystrykh, L. V., Verovskaya, E., Zwart, E., Broekhuis, M., and de Haan, G. (2012). Counting stem cells: Methodological constraints. Nat. Methods 9, 567–574. doi:10.1038/nmeth.2043
Catlin, S. N., Busque, L., Gale, R. E., Guttorp, P., and Abkowitz, J. L. (2011). The replication rate of human hematopoietic stem cells in vivo. Blood 117, 4460–4466. doi:10.1182/blood-2010-08-303537
Challen, G. A., and Goodell, M. A. (2020). Clonal hematopoiesis: Mechanisms driving dominance of stem cell clones. Blood 136, 1590–1598. doi:10.1182/blood.2020006510
Chao, A., and Lin, C. W. (2012). Nonparametric lower bounds for species richness and shared species richness under sampling without replacement. Biometrics 68, 912–921. doi:10.1111/j.1541-0420.2011.01739.x
Colijn, C., and Mackey, M. C. (2005). A mathematical model of hematopoiesis: II. Cyclical neutropenia. J. Theor. Biol. 237, 133–146. doi:10.1016/j.jtbi.2005.03.034
Copley, M. R., Beer, P. A., and Eaves, C. J. (2012). Hematopoietic stem cell heterogeneity takes center stage. Cell. Stem Cell. 10, 690–697. doi:10.1016/j.stem.2012.05.006
Cordes, S., Wu, C., and Dunbar, C. E. (2021). Clonal tracking of haematopoietic cells: Insights and clinical implications. J. Haematol. 192, 819–831. doi:10.1111/bjh.17175
Corso, A., Varettoni, M., Mangiacavalli, S., Zappasodi, P., Klersy, C., Rusconi, C., et al. (2005). Bone marrow CD34+ cell count is predictive for adequate peripheral progenitor cell collection. Leukemia Res. 29, 159–163. doi:10.1016/j.leukres.2004.05.018
de Haan, G., and Lazare, S. S. (2018). Aging of hematopoietic stem cells. Blood 131, 479–487. doi:10.1182/blood-2017-06-746412
De Souza, D. C., and Humphries, A. R. (2019). Dynamics of a mathematical hematopoietic stem-cell population model. SIAM J. Appl. Dyn. Syst. 18, 808–852. doi:10.1137/18m1165086
Doulatov, S., Notta, F., Laurenti, E., and Dick, J. E. (2012). Hematopoiesis: A human perspective. Cell. Stem Cell. 10, 120–136. doi:10.1016/j.stem.2012.01.006
Espinoza, D. A., Fan, X., Yang, D., Cordes, S. F., Truitt, L. L., Calvo, K. R., et al. (2019). Aberrant clonal hematopoiesis following lentiviral vector transduction of HSPCs in a rhesus macaque. Mol. Ther. 27, 1074–1086. doi:10.1016/j.ymthe.2019.04.003
Fliedner, M. C. (2002). Research within the field of blood and marrow transplantation nursing: How can it contribute to higher quality of care? Int. J. Hematol. 76, 289–291. doi:10.1007/BF03165135
Gillespie, D. T. (1977). Exact stochastic simulation of coupled chemical reactions. J. Phys. Chem. 81, 2340–2361. doi:10.1021/j100540a008
Gillespie, D. T. (2007). Stochastic simulation of chemical kinetics. Annu. Rev. Phys. Chem. 58, 35–55. doi:10.1146/annurev.physchem.58.032806.104637
Goyal, S., Kim, S., Chen, I. S., and Chou, T. (2015). Mechanisms of blood homeostasis: Lineage tracking and a neutral model of cell populations in rhesus macaques. BMC Biol. 13, 85. doi:10.1186/s12915-015-0191-8
Grosselin, J., Sii-Felice, K., Payen, E., Chretien, S., Roux, D. T. L., and Leboulch, P. (2013). Arrayed lentiviral barcoding for quantification analysis of hematopoietic dynamics. Stem Cells 31, 2162–2171. doi:10.1002/stem.1383
Höfer, T., and Rodewald, H. (2016). Output without input: The lifelong productivity of hematopoietic stem cells. Curr. Opin. Cell. Biol. 43, 69–77. doi:10.1016/j.ceb.2016.08.003
Kim, S., Kim, N., Presson, A., Metzger, M., Bonifacino, A., Sehl, M., et al. (2014). Dynamics of HSPC repopulation in nonhuman primates revealed by a decade-long clonal-tracking study. Cell. Stem Cell. 14, 473–485. doi:10.1016/j.stem.2013.12.012
Kim, S., Kim, N., Presson, A. P., An, D. S., Mao, S. H., Bonifacino, A. C., et al. (2010). High-throughput, sensitive quantification of repopulating hematopoietic stem cell clones. J. Virology 84, 11771–11780. doi:10.1128/JVI.01355-10
Klose, M., Florian, M. C., Gerbaulet, A., Geiger, H., and Glauche, I. (2019). Hematopoietic stem cell dynamics are regulated by progenitor demand: Lessons from a quantitative modeling approach. Stem Cells 37, 948–957. doi:10.1002/stem.3005
Koelle, S. J., Espinoza, D. A., Wu, C., Xu, J., Lu, R., Li, B., et al. (2017). Quantitative stability of hematopoietic stem and progenitor cell clonal output in rhesus macaques receiving transplants. Blood 129, 1448–1457. doi:10.1182/blood-2016-07-728691
Kolouri, S., Thorpe, M., Slepcev, D., and Rohde, G. K. (2017). Optimal mass transport: Signal processing and machine-learning applications. IEEE Signal Process. Mag. 34, 43–59. doi:10.1109/MSP.2017.2695801
Lee-Six, H., Friesgaard-Obro, N., Shepherd, S., Grossmann, S., Dawson, K., Belmonte, M., et al. (2018). Population dynamics of normal human blood inferred from somatic mutations. Nature 561, 473–478. doi:10.1038/s41586-018-0497-0
Lewkiewicz, S., Chuang, Y. L., and Chou, T. (2019a). A mathematical model of the effects of aging on naive T cell populations and diversity. Bull. Math. Biol. 81, 2783–2817. doi:10.1007/s11538-019-00630-z
Lewkiewicz, S., Chuang, Y. L., and Chou, T. (2019b). Dynamics of T cell receptor distributions following acute thymic atrophy and resumption. Math. Biosci. Eng. 17, 28–55. doi:10.3934/mbe.2020002
Lyne, A. M., Kent, D. G., Laurenti, E., Cornils, K., Glauche, I., and Perie, L. (2018). A track of the clones: New developments in cellular barcoding. Exp. Hematol. 68, 15–20. doi:10.1016/j.exphem.2018.11.005
Marciniak-Czochra, A., Stiehl, T., and Wagner, W. (2009). Modeling of replicative senescence in hematopoietic development. Aging (Albany NY) 1, 723–732. doi:10.18632/aging.100072
Mayle, A., Luo, M., Jeong, M., and Goodell, M. A. (2015). Flow cytometry analysis of murine hematopoietic stem cells. Nature 518, 542–546.
Mendelson, A., and Frenette, P. S. (2014). Hematopoietic stem cell niche maintenance during homeostasis and regeneration. Nat. Med. 20, 833–846. doi:10.1038/nm.3647
Muller-Sieburg, C. E., Sieburg, H. B., Bernitz, J. M., and Cattarossi, G. (2012). Stem cell heterogeneity: Implications for aging and regenerative medicine. Blood 119, 3900–3907. doi:10.1182/blood-2011-12-376749
Parmentier, S., Kramer, M., Weller, S., Schuler, U., Ordemann, R., Rall, G., et al. (2020). Reevaluation of reference values for bone marrow differential counts in 236 healthy bone marrow donors. Ann. Hematol. 99, 2723–2729. doi:10.1007/s00277-020-04255-4
Parzen, E. (1962). On estimation of a probability density function and mode. Ann. Math. Statistics 33, 1065–1076. doi:10.1214/aoms/1177704472
Peixoto, D., Dingli, D., and Pacheco, J. M. (2011). Modelling hematopoiesis in health and disease. Math. Comput. Model. 53, 1546–1557. doi:10.1016/j.mcm.2010.04.013
Radtke, S., Colonna, L., Perez, A. M., Hoffman, M., Kean, L. S., and Kiem, H. P. (2020). Isolation of a highly purified HSC-enriched CD34+CD90+CD45RA− cell subset for allogeneic transplantation in the nonhuman primate large-animal model. Transplant. Direct 6, e579. doi:10.1097/TXD.0000000000001029
Rosenblatt, M. (1956). Remarks on some nonparametric estimates of a density function. Ann. Math. Statistics 27, 832–837. doi:10.1214/aoms/1177728190
Seita, J., and Weissman, I. L. (2010). Hematopoietic stem cell: Self-renewal versus differentiation. Wiley Interdiscip. Rev. Syst. Biol. Med. 2, 640–653. doi:10.1002/wsbm.86
Shepherd, B. E., Kiem, H. P., Lansdorp, P. M., Dunbar, C. E., Aubert, G., LaRochelle, A., et al. (2007). Hematopoietic stem-cell behavior in nonhuman primates. Blood 110, 1806–1813. doi:10.1182/blood-2007-02-075382
Silverman, B. W. (1986). Density estimation for statistics and data analysis. London: Chapman & Hall.
Stiehl, T., and Marciniak-Czochra, A. (2011). Characterization of stem cells using mathematical models of multistage cell lineages. Math. Comput. Model. 53, 1505–1517. doi:10.1016/j.mcm.2010.03.057
Sun, J., Ramos, A., Chapman, B., Johnnidis, J. B., Le, L., Ho, Y. J., et al. (2014). Clonal dynamics of native haematopoiesis. Nature 514, 322–327. doi:10.1038/nature13824
Sun, Z., and Komarova, N. (2012). Stochastic modeling of stem-cell dynamics with control. Math. Biosci. 240, 231–240. doi:10.1016/j.mbs.2012.08.004
Székely, T., Burrage, K., Mangel, M., and Bonsall, M. (2014). Stochastic dynamics of interacting haematopoietic stem cell niche lineages. PLoS Comput. Biol. 10, e1003794. doi:10.1371/journal.pcbi.1003794
Verovskaya, E., Broekhuis, M. J., Zwart, E., Ritsema, M., van Os, R., de Haan, G., et al. (2013). Heterogeneity of young and aged murine hematopoietic stem cells revealed by quantitative clonal analysis using cellular barcoding. Blood 122, 523–532. doi:10.1182/blood-2013-01-481135
Wu, C., Li, B., Lu, R., Koelle, S. J., Yang, Y., Jares, A., et al. (2014). Clonal tracking of rhesus macaque hematopoiesis highlights a distinct lineage origin for natural killer cells. Cell. Stem Cell. 14, 486–499. doi:10.1016/j.stem.2014.01.020
Xu, J., Wang, Y., Guttorp, P., and Abkowitz, J. L. (2018a). Visualizing hematopoiesis as a stochastic process. Blood Adv. 1, 2637–2645. doi:10.1182/bloodadvances.2018023705
Xu, S., Böttcher, L., and Chou, T. (2020). Diversity in biology: Definitions, quantification and models. Phys. Biol. 17, 031001. doi:10.1088/1478-3975/ab6754
Xu, S., Kim, S., Chen, I. S. Y., and Chou, T. (2018b). Modeling large fluctuations of thousands of clones during hematopoiesis: The role of stem cell self-renewal and bursty progenitor dynamics in rhesus macaque. PLoS Comput. Biol. 14, e1006489. doi:10.1371/journal.pcbi.1006489
Yeh, Y. H. J., Yang, K., Razmi, A., and Ho, Y. C. (2021). The clonal expansion dynamics of the HIV-1 reservoir: Mechanisms of integration site-dependent proliferation and HIV-1 persistence. Viruses 13, 1858. doi:10.3390/v13091858
Keywords: stem cells, hematopoiesis, barcodes, clonal tracking, differentiation
Citation: Pan Y, D’Orsogna MR, Tang M, Stiehl T and Chou T (2023) Clonal abundance patterns in hematopoiesis: Mathematical modeling and parameter estimation. Front. Syst. Biol. 3:893366. doi: 10.3389/fsysb.2023.893366
Received: 10 March 2022; Accepted: 09 January 2023;
Published: 09 February 2023.
Edited by:
Jayajit Das, The Ohio State University, United StatesReviewed by:
Steven M. Abel, The University of Tennessee, United StatesWenjie Sun, Institute Curie, France
Copyright © 2023 Pan, D’Orsogna, Tang, Stiehl and Chou. This is an open-access article distributed under the terms of the Creative Commons Attribution License (CC BY). The use, distribution or reproduction in other forums is permitted, provided the original author(s) and the copyright owner(s) are credited and that the original publication in this journal is cited, in accordance with accepted academic practice. No use, distribution or reproduction is permitted which does not comply with these terms.
*Correspondence: Maria R. D’Orsogna, ZG9yc29nbmFAY3N1bi5lZHU=; Min Tang, dGFuZ21pbkBzanR1LmVkdS5jbg==; Tom Chou, dG9tY2hvdUB1Y2xhLmVkdQ==