 Gregory S. Orf1†
 Kenn Forberg1†
 Todd V. Meyer1Illya Mowerman1Aurash Mohaimani1
 Matthew L. Faron2Cheryl Jennings3
 Alan L. Landay3
 D. Yitz Goldstein4Amy S. Fox4
 Michael G. Berg1*
 Gavin A. Cloherty1
- 1Abbott Laboratories, Abbott Diagnostics Division, Infectious Disease Research, Abbott Park, IL, United States
- 2The Medical College of Wisconsin, Milwaukee, WI, United States
- 3Rush University Medical Center, Chicago, IL, United States
- 4Montefiore Medical Center, Albert Einstein College of Medicine, Bronx, NY, United States
Background: Surveillance of SARS-CoV-2 across the globe has enabled detection of new variants and informed the public health response. With highly sensitive methods like qPCR widely adopted for diagnosis, the ability to sequence and characterize specimens with low titers needs to keep pace.
Methods: Nucleic acids extracted from nasopharyngeal swabs collected from four sites in the United States in early 2020 were converted to NGS libraries to sequence SARS-CoV-2 genomes using metagenomic and xGen target enrichment approaches. Single nucleotide polymorphism (SNP) analysis and phylogeny were used to determine clade assignments and geographic origins of strains.
Results: SARS-CoV-2-specific xGen enrichment enabled full genome coverage for 87 specimens with Ct values <29, corresponding to viral loads of >10,000 cp/ml. For samples with viral loads between 103 and 106 cp/ml, the median genome coverage for xGen was 99.1%, sequence depth was 605X, and the “on-target” rate was 57 ± 21%, compared to 13%, 2X and 0.001 ± 0.016%, respectively, for metagenomic sequencing alone. Phylogenetic analysis revealed the presence of most clades that existed at the time of the study, though clade GH dominated in the Midwest.
Conclusions: Even as vaccines are being widely distributed, a high case load of SARS-CoV-2 infection persists around the world. Viral genetic surveillance has succeeded in warning the public of new variants in circulation and ensured that diagnostic tools remain resilient to a steadily increasing number of mutations. Target capture offers a means of characterizing low viral load samples which would normally pose a challenge for metagenomic sequencing.
Introduction
Since the first cases of severe acute respiratory syndrome coronavirus 2 (SARS-CoV-2) infection were reported in late 2019 in China, nearly 205 million cases of coronavirus disease 2019 (COVID-19) and 4.3 million COVID-19 deaths have been reported (as of August 2021; Johns Hopkins University, https://coronavirus.jhu.edu/). The severity of COVID-19 symptoms and the risk of hospitalization and/or death are linked to various patient co-morbidities, age, and viral load (VL) (1, 2). Sequencing and phylogenetic analyses have been used to track the global spread of SARS-CoV-2; for example, in the United States, the virus first entered from the west into Washington state from China, and then from the east into New York from Europe (3–6). Over time, surveillance efforts have documented the emergence of variants and major clades, with the ascendency of clade G (containing spike-D614G) and its descendants over the early clades S (containing NS8-L84S), V (containing NS3-G251V), and L (7, 8). In late 2020 and early 2021, new SARS-CoV-2 variants linked to heightened transmissibility have been reported almost monthly, such as Alpha, Beta, Gamma, and Delta, revealing the need for constant and rapid surveillance to characterize mutations and evaluate their effects on infection patterns and vaccine efficacy (9–12).
A tremendous amount of sequencing information has been generated for SARS-CoV-2, with well over 1 million sequences deposited in GISAID and the NCBI as of August 2021 (https://www.gisaid.org/ and https://www.ncbi.nlm.nih.gov/sars-cov-2/). These sequences are generally >99.9% identical, distinguished by only a few SNPs (13). As an RNA virus, SARS-CoV-2 has a capacity for rapid mutation, and variants will continue to arise as the pandemic persists and the virus circulates. The introduction of vaccines may also be applying a selective pressure on the virus. While there are >1 million SARS-CoV-2 sequences in GISAID, having a sensitive, scalable, reliable, and rapid whole-genome sequencing method for low VL specimens is needed. Thus, far, genetic surveillance has relied on multiplex PCRs (e.g., the ARTIC method); however, two weaknesses of this method are inherent amplification bias and mutations that negatively affect the generation of amplicons (14–17). Additionally, in individuals with low VL, PCR-based methods must be even more sensitive to detect the virus.
Random priming coupled to xGen target enrichment permits both metagenomic exploration and direct capture for sequencing of SARS-CoV-2 from the same library. Long probe lengths readily tolerate the limited number of expected mutations (all known SARS-CoV-2 genomes are >99.8% identical) and amplify targeted libraries from low VL specimens. As demonstrated by our previous work with HIV, Hepatitis B, and Hepatitis Delta viruses, and Bonsall et al.'s work with Hepatitis C virus, the xGen approach is a highly sensitive tool to maximize viral genome coverage when coupled with Illumina's next-generation sequencing platform (18–21). Here, we examined SARS-CoV-2 full-genome diversity on specimens collected from sites in the Midwest and Northeast United States from March to June 2020. We detected sequences representative of all clades that existed at the time, and in specimens with low viral loads, we applied a SARS-CoV-2-specific xGen approach to achieve full genome coverage.
Methods
Specimen Sourcing
Nasopharyngeal specimens (N = 194) in viral transfer medium (VTM) were procured from Medical College of Wisconsin (MCW; N = 100; collected in Milwaukee, U.S.A between 30 Mar 2020 and 03 Apr 2020), iSpecimen, Inc. (N = 20; collected in Michigan, U.S.A. on 21 Mar 2020), RUSH University Medical Center (N = 40; collected in Chicago, U.S.A. on 05 May 2020), and Montefiore Health System (N = 34; collected in New York City, U.S.A. between 08 Apr 2020 and 17 Apr 2020) and processed at Abbott Diagnostics (Abbott Laboratories, Abbott Park, IL). To review patient medical histories, MCW IRB FWA number 00000820 under project PRO40025 was approved on 09 Feb 2021 by committee number 5.
Virus Quantification
Specimens were heat-inactivated at 65°C for 30 min in a Biosafety Level 3 (BSL-3) facility, then subjected to the RealTime SARS-CoV-2 qualitative EUA diagnostic assay. There are 10 unread (“dark”) cycles on the Abbott Molecular platform, in which case Ct values are 10 less than most other manufacturer assays; the Ct values reported in this study are adjusted by 10 to include the dark cycles. Viral loads were approximated based on equivalent Ct values obtained with a RealTime SARS-CoV-2 quantitative assay on the m2000sp/rt that uses calibrators and controls (Abbott Molecular, Des Plaines, IL) (22–24).
Nucleic Acid Extraction for Sequencing
Remaining volumes of the inactivated specimens were subjected to total nucleic acid (TNA) extraction on an m2000sp (Abbott Molecular, Des Plaines IL) using a research-use only RNA/DNA protocol (500 μl input/50 μl eluate). This TNA extraction uses silica coated magnetic particles for capture and modified buffers to recover both RNA and DNA.
mNGS Library Production
Metagenomic libraries (mNGS) were prepared in a 96-well format with an epMotion automated liquid handler (Eppendorf North America, Enfield, CT). Starting with 10 μl of TNA, RNA was reverse transcribed with random primers and oligo-deoxythymidine using Superscript IV (SSRT-IV) 1st Strand reagents (Life Technologies, Carlsbad, CA), followed by 2nd strand synthesis with Sequenase v2.0 DNA Polymerase (Applied Biosystems, Foster City, CA). Double stranded DNA/cDNA was recovered with Agencourt AMPpure XP beads (Beckman Coulter, Brea, CA). The purified DNA/cDNAs were tagmented and barcoded using a Nextera XT Library Prep Kit (Illumina Inc., San Diego, CA) coupled with custom non-biotinylated IDT-Nextera indexes (IDTDNA, Coralville, IA) using 24 cycles of amplification. Nextera libraries were purified with Agencourt AMPpure XP beads (Beckman Coulter) and assessed for quality and concentration by a 2200 TapeStation (Agilent, Santa Clara, CA) and Qubit fluorometer (Life Technologies), respectively.
SARS-CoV-2 xGen Capture
xGen probe sets were designed by, and purchased from, IDTNDA (Coralville, IA) based on the NCBI Wuhan-Hu-1 reference strain sequence, accession NC_045512.2. A total of 498 probes, each 120-nt in length, tiled the genome with 2X coverage. Probe stocks modified with a 5′ biotin tag (3 pmol supplied of each probe) and blocking oligos complementary to Nextera Set A i5 and i7 index primers (1 μl per reaction) were included in the kit. The hybridization procedure (including probe and blocking oligo working concentrations), streptavidin bead captures, and washes were performed essentially as previously described (20). Following bead capture and removal of non-bound libraries, an initial 12 cycles of amplification were performed with the libraries bound to the beads, followed by elution off streptavidin beads and a repeat KAPA amplification of 10 cycles. SARS-CoV-2 xGen captures were performed on mNGS libraries for which <90% genome coverage was obtained. In general, 15–25 Nextera libraries were pooled per capture, stratified by Ct as described below.
Next-Generation Sequencing (NGS)
Metagenomic libraries were segregated according to SARS-CoV-2 Ct values prior to multiplexing. To avoid intra-run contamination from “barcode hopping,” those with high viral loads (Abbott RealTime SARS-CoV-2 Ct <15, Ct <25 for other manufacturers) were pooled and sequenced together while those with low viral loads (Abbott RealTime SARS-CoV-2 Ct > 15) were pooled and sequenced on separate runs. Genome coverage results determined which libraries proceeded to additional xGen capture and enrichment. SARS-CoV-2 xGen libraries were sequenced independently of corresponding mNGS libraries since these share the same barcodes. mNGS and xGen libraries were sequenced on a MiSeq (in-house) or a HiSeq (Novogene, Sacramento, CA) using 2x 150 bp paired-end chemistry.
Sequence Analysis
Mapping of NGS reads to the NCBI NC_045512.2 reference sequence was performed with CLC Genomics Workbench 21.0 software (Qiagen, Aarhus, Denmark). Duplicate reads were removed for xGen-enriched libraries as previously described (19). The consensus SARS-CoV-2 sequence for each specimen was generated using the Extract Consensus Sequence function in the NGS Toolbox.
SNPs in each specimen relative to the reference sequence were recorded in Excel using the pivot table function. Pairwise global alignments of each full genome sequence against the reference strain were generated and merged together in BioEdit (Nucleics, Woollahra, Australia) and evaluated with Los Alamos National Laboratory's online Highlighter tool (https://www.hiv.lanl.gov/content/sequence/HIGHLIGHT/highlighter_top.html) using the NC_045512.2 sequence as the master reference. Nucleotide changes were indicated by color: green (mutation to A), red (mutation to T), orange (mutation to G), light blue (mutation to C), dark blue (ambiguous base call), and gray (nucleotide deletion) hashes. Additionally, a local instance of the open-source NextClade software (https://github.com/nextstrain/nextclade) was used to output a table of every SNP and assign GISAID-style and NextStrain-style clades for each sequence.
Phylogenetic Analysis
NextStrain (https://nextstrain.org/ncov/global) was accessed on January 14, 2021. This service sub-samples the entire GISAID database (https://www.gisaid.org) for sequences representative of the overall clade and regional distribution of SARS-CoV-2 genomes to perform a reduced time-correlated lineage analysis. From GISAID, we downloaded all ~4,000 sequences that appeared in NextStrain on that day, eliminated those sequences with <95% genome coverage, then calculated the clade (e.g., S, G, GH, etc.) and regional (e.g., North America, Europe, etc.) distributions of the remaining sequences. Then, 110 sequences (including the Wuhan-Hu-1 reference) were randomly sampled such that the distribution of clade assignments and regions was the same as before the random sampling. These 110 sequences were used as our reference dataset and their accession numbers are listed in the Supplementary Data.
The 110 references were combined with 79 of our 87 in-house generated sequences (8 of the 87 sequences were omitted due to excessively long, i.e., >200 bp long, strings of ambiguous or un-called nucleotides) into a single file, then full-genome multiple sequence alignment was performed using the program MAFFT v7.475 (25) with the settings optimized for full-length alignment of closely related (>99% identity) viral genomes (https://mafft.cbrc.jp/alignment/software/closelyrelatedviralgenomes.html). The 5′ and 3′ UTRs were then removed from the alignment due to the general concentration of ambiguous base calls and sequencing errors in these regions (26, 27).
The evolutionary history of these 189 sequences was inferred using the Maximum Likelihood method implemented in IQ-TREE (28). Sequence alignment revealed that in a total of 29,383 aligned sites, 28,409 were constant/invariant (96.6825%) and 232 sites were parsimony-informative. Forty-eight nucleotide models were tested using IQ-TREE's ModelFinder tool (29). The General Time Reversible substitution model with empirical base frequencies and a two-category model of flexible rate-heterogeneity-across-sites (GTR+F+R2) generated the lowest Bayesian Information Criterion score (108,416.6063) and was considered the best to describe the substitution pattern. By default, IQ-TREE uses a stochastic algorithm for finding initial ML trees. The Nearest Neighbor Interchange (NNI) heuristic method was then performed to further improve those starting trees. The ML tree generated with the highest log likelihood (−52,212.7286) is presented in this study. Additionally, 1,000 Ultrafast Bootstrap (UFboot) replications (30) and 1,000 replications of the Shimodaira-Hasegawa approximate likelihood ratio test (SH-aLRT) (31) were performed to provide branch supports to the presented tree.
The ML tree was imported into Dendroscope for mid-point rooting (32). Simple mid-point rooting was chosen due to the statistical uncertainty in outgroup-rooting SARS-CoV-2 phylogenies (33). The rooted tree was then visualized using ggtree (34). The presented tree is drawn to scale, with branch lengths scaled by the average number of substitutions per site. All nodes with support >60% for both the SH-aLRT and UFboot tests are denoted with black dots.
Retrieval and Parsing of GISAID Sequence Data
All SARS-CoV-2 sequences (n = 657,448) present in the GISAID database on March 3, 2021 were downloaded and evaluated for variation from reference NC_045512.2 using a Docker implementation of NextClade (https://hub.docker.com/r/neherlab/nextclade). Sequence annotations were then parsed in Perl using the JSON::XS (v4.03) CPAN module to identify variants NSP3:S1682F (n = 834), S:Q677R (n = 157), and ORF3a:S171L (n = 6,029). Collection and submission dates for Milwaukee S:Q677R sequences USA/WI-UW-950/2020 and USA/WI-UW-957/2020 were extracted from the associated GISAID metadata file.
Nucleotide Sequence Accession Numbers
The N = 79 full-length SARS-CoV-2 genome sequences which were part of the phylogenetic analysis were submitted to GenBank under the accessions MZ363485-MZ363563.
Results
Target Capture Dramatically Improves Genome Coverage of Low VL SARS-CoV-2 Specimens
One-hundred ninety-four nasopharyngeal swabs in VTM with positive SARS-CoV-2 diagnostic tests were collected from several clinical sites in the United States between March 2020 and June 2020. We first subjected these specimens to the Abbott RealTime SARS-CoV-2 qPCR EUA assay. This assay has 10 “dark” cycles that are not read, so to relate our data to values obtained by other manufacturers, we add 10 cycles to the Ct. The Ct distribution for these specimens (Figure 1A; left panel) indicated approximately one third (36%) had Ct ≤ 25, corresponding to a viral load > 5.35 log copies/ml. Another 39% had Ct 25–35, with viral loads between 5.35 log and 2.1 log copies/ml. Seventeen percent had detectable virus below 2.0 log copies/ml. The remaining 8% tested negative in our laboratory by the Abbott RealTime SARS-CoV-2 qPCR assay, even though they tested positive at the originating laboratory. This Ct distribution is consistent with SARS-CoV-2 titers determined by Abbott for unrelated specimens, including N = 48 specimens sold by New York Biologics (New York, NY; of which N = 9 were actually qPCR negative by Abbott RealTime) and from N = 51 Abbott RealTime positive specimens obtained from 11 pre-clinical sites across the United States; when these cohorts are combined (N = 99), a similar Ct distribution to the present study is observed (Figure 1A, right panel). This same trend is evident in the literature, wherein the majority of SARS-CoV-2 clinical specimens had titers <100,000 cp/ml, which generally presents a challenge for further characterization by NGS (35, 36).
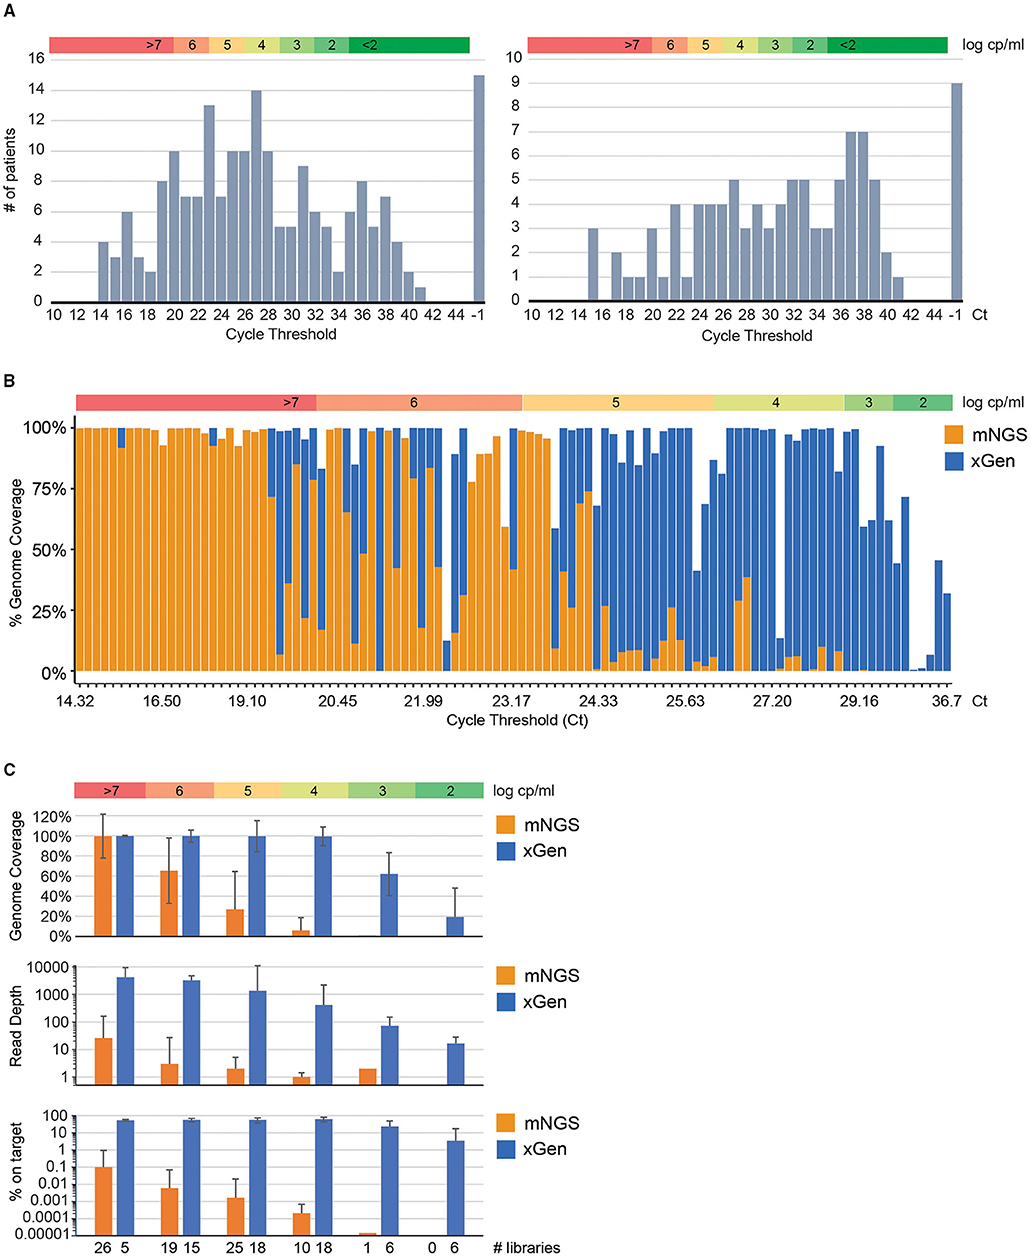
Figure 1. Target capture dramatically improves genome coverage of low viral load SARS-CoV-2 infections. (A) Distribution of Ct values for presumed positive specimens. Values obtained from the m2000 ± 10 dark cycles are shown. Collaboration-sourced/purchased nasopharyngeal swab specimens sequenced in this study (N = 194, left) are shown along with a separate panel of pre-clinical/purchased specimens for which only Ct values were determined (N = 99, right). Specimens that were confirmed qPCR negative by Abbott's RealTime test were indicated as positive by the originating lab. (B) Stacked histogram plot indicating genome coverage (y-axis) without (mNGS; orange) or with (xGen; blue) SARS-CoV-2 xGen target capture. Libraries (N = 106) with paired NGS and VL data are sorted from low to high Ct (x-axis). (C) Sequence statistics (median ± standard deviation for genome coverage, read depth, and % “on target”) by viral load intervals comparing mNGS (orange) to xGen (blue). In each panel, a color bar illustrating the VL range in log cp/ml is included to facilitate comparison of VL to Ct.
Metagenomic libraries (mNGS) were generated for the N = 194 cohort (Rush, Montefiori, iSpecimen, and MCW) by coupling randomly primed cDNA synthesis to a Nextera XT Library Prep kit for barcoding and adapter addition. Libraries were segregated into groups according to Ct value to avoid “barcode hopping” of high titer specimen reads into those with low titers. As expected, mNGS genome coverage (Figure 1B; orange bars) was greatest for specimens with low Ct values. Any specimen with VL higher than 7.0 log cp/ml obtained full coverage, but this varied considerably across 6 log, and below 5.9 log we were assured of only partial coverage. In total, 16 out of 194 specimens generated enough mNGS reads to assemble a SARS-CoV-2 genome with >90% coverage.
To address the remaining specimens that did not generate >90% genome coverage via mNGS, we deployed custom biotinylated xGen probes tiling the Wuhan-Hu-1 (NC_045512.2) reference genome to select and amplify SARS-CoV-2 sequences from the metagenomic Nextera libraries. xGen target capture was performed on libraries with 5–90% coverage by mNGS and qPCR Ct values between 20 and 36. A substantial boost in coronavirus reads per million total reads and genome coverage was realized across this spectrum of VLs, even in those at log 2 cp/ml or lower (Figure 1B; blue bars). We consistently obtained near-complete or complete genome coverage for specimens below a threshold of Ct = 29, corresponding to 10,000 cp/ml or higher. Beyond this cutoff, recovery of the SARS-CoV-2 sequence was highly variable, in agreement with data for other viruses to which we have applied specific xGen target enrichment (18–20). Specimens that were negative by qPCR were also negative by xGen-NGS.
For viral loads in excess of 106 cp/ml, xGen exhibits superior genome coverage (99.8 vs. 65.3%), depth (3246X vs. 3X), and “on target” rates (56 vs. 0.006%) compared to mNGS, but target capture is generally unnecessary in this range (Figure 1C). The true utility of xGen is demonstrated for samples with between 103-106 cp/ml, corresponding to viral loads at which most were collected (Figure 1A). Comparing xGen to mNGS, median genome coverage over this interval was 99.1 vs. 13%, sequence depth was 605X vs. 2X, and the “on-target” rate was 57 vs. 0.001% (Figure 1C; Supplementary Table 1). Below 103 cp/ml we still obtained partial genomes (19 ± 29%) at moderate read depths (16.5X ± 12). Adding the full genomes generated by xGen-NGS to those generated by mNGS, 87 genomes with >85% coverage were available for characterization.
Clade Representation Matches Global Trends
Our 87 genomes were aligned to the Wuhan-Hu-1 NC_045512.2 reference to reveal SNPs and indels (Figure 2A). Sequences were grouped by collection site and listed in descending order by viral load, with each nucleotide change (A, T, C, G) represented by a different color. Our observations were consistent with a meta-analysis performed on 48,635 strains retrieved from GISAID on June 26, 2020, which ran concurrent with the time we collected our specimens (8). Genomes had an average of 8.7 SNPs (range: 4–16) compared to 7.23 globally, with transitions (usually C → T, in red) favored over transversions and indels. Due to early collection of these specimens, we utilize the GISAID clade nomenclature, which was more commonly used at the time.
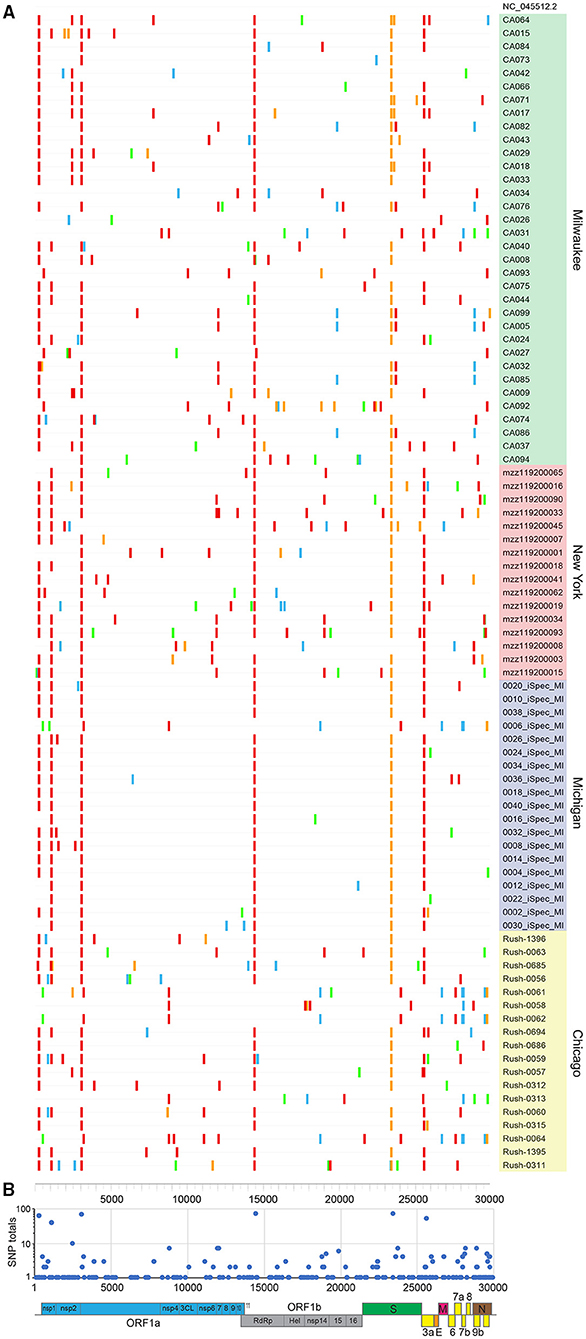
Figure 2. SARS-CoV-2 sequences share a common lineage but are identified by unique SNPs. (A) SNPs present in 87 new full genomes. Patient sequences are grouped by site and listed in descending order by viral load. (B) Total number of SNPs tabulated at each nucleotide position. Annotated SARS-CoV-2 genome illustrates affected open reading frames.
The majority of sequences (>81%) contained hallmark SNPs at the four positions (relative to the Wuhan-Hu-1 reference genome) indicative of the major clade G: 241 (C → T; 5′UTR; silent), 3037 (C → T; nsp3; silent), 14408 (C → T; nsp12b/RDRP; P314L), and 23403 (A → G; spike; D614G) (Table 1, Figure 2B). Most sequences from New York (Montefiori) and Michigan (iSpecimen) were GH clade, a derivative of G that was dominant from an early time in the Americas, with co-occurring SNPs at positions 1,059 (C → T; nsp2; T85I) and 25,563 (G → T; ORF3a; Q57H). Within this GH clade there were four related strains from New York (mzz119200090, −034, −093, and −015) with additional shared mutations at positions 11,916 (C → T; nsp7; S25L) and 18,998 (C → T; nsp14; A320V). These were known to circulate in North America and were seen occasionally in specimens from other cohorts (e.g., Rush-0063). By contrast, most Midwest sequences from Chicago (Rush) and Milwaukee (MCW) lacked the 1,059 and/or 25,563 mutations. Of note are four specimens from Wisconsin (CA017, −018, −064, and −071) which have a spike mutation at position 23,592 (A → G; spike; Q677R). This spike mutation has not been widely reported. Three of these specimens contain two other novel mutations at positions 7,764 (C → T; nsp3; S1682F) and 25,904 (C → T; ORF3a; S171L). A specimen from New York, mzz119200019, contains the mutation at position 25,904, but not the ones at positions 23,592 or 7,764.
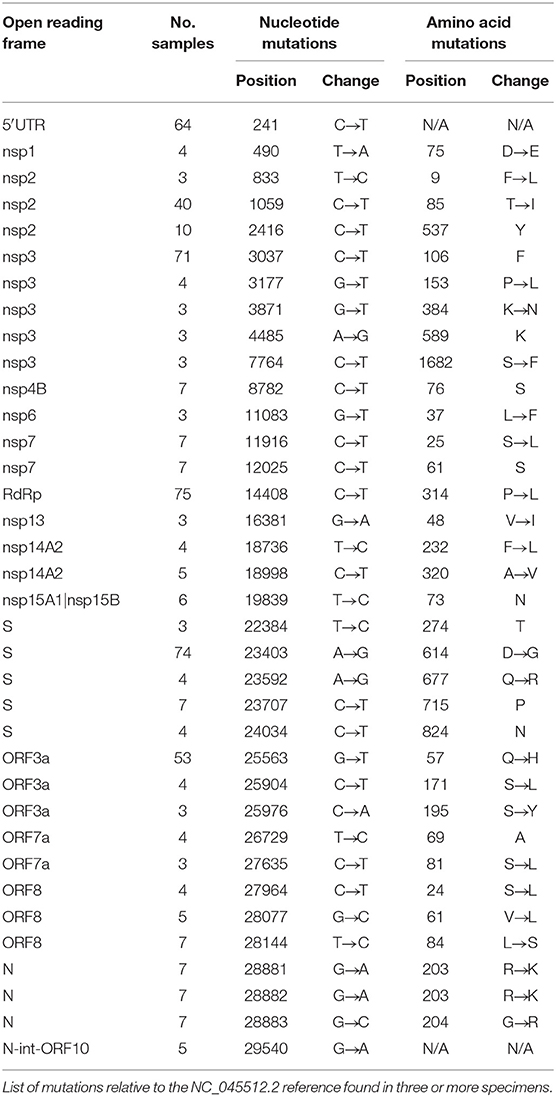
Table 1. Catalog of SNPs detected in study.
We observed the linked G28881A/G28882A/G28883C mutations (nucleocapsid, R203K/G204R) indicative of the GR clade seven times, all originating from the Milwaukee site. These same individuals (CA082, CA076, CA099, CA005, CA032, CA085, and CA086) also possessed silent mutations at positions 12,025 and 19,839, a variant which has not yet been widely reported. At the time these specimens were collected, the GR clade was most common in Europe, Australia, and South America (8).
There were seven specimens from the Midwest presumably belonging to the S clade, defined by mutations at positions 8,782 (C → T; nsp4; silent) and 28,144 (T → C; orf8; L84S). Three of five specimens from Chicago (Rush-0061,−0062,−0064) and one from Michigan (0006-iSpec-MI) shared the same additional mutations at positions 490 (T → A; nsp1; D75E), 3,177 (G → T; nsp3; P153L), 18,736 (T → C; nsp14A2; F232L), 24034 (C → T; spike; silent at 824N), 26729 (T → C; ORF7a; silent at 69A), 27,635 (C → T; ORF7a; S81L), 28,077 (G → C; ORF8; V61L), and 29,700 (A → G; 3′UTR). The other two Chicago specimens (Rush-0058 and−0313) had no SNPs in common besides those at positions 8,782 and 28,144. Chicago specimens Rush-0059,−0060, and−0064 possessed a mutation at position 11,083 (G → T; nsp6; L37F) that normally defines the V clade; however, none of these had the linked G251V mutation in ORF3a at position 26,144, but in fact contained all the signature mutations indicative of the GH clade.
The profiles of five specimens from Milwaukee did not match any widely reported criteria and presumably belong to an “O” clade. CA026 was dissimilar to all other specimens, lacking all mutations in common to the other 86 sequences. CA092 and CA093 were distinct from all other specimens but highly related to each other, with shared mutations at positions 556, 10,029, 12,729, 18,812, 22,295, and 29,711. CA027 was largely devoid of SNPs, but resembled CA092 and CA093 by having a mutation at position 556 (C → T; nsp1; silent at 78Y) and CA092, CA093, and CA026 by having a mutation at position 29711 (G → T; 3′-UTR). Specimen CA034 also has a mutation pattern unlike most other specimens, except that it contains a mutation at position 25,563 (G → T; ORF3a; Q57H) that is usually indicative of the GH clade. Curiously, specimen CA034 does not contain other mutations indicative of the G clade or its descendants.
Mutational Profiles Are Representative of Those Found Early in the Pandemic and Reflect Multiple Independent Introductions
Phylogenetic trees were constructed to confirm the clade assignments that were made based on SNPs alone. One hundred and nine full-length SARS-CoV-2 sequences with representatives from each clade were downloaded from GISAID on January 14, 2021 and aligned with 79 of our 87 complete genomes and the Wuhan-Hu-1 reference to construct maximum likelihood trees (Figure 3). As expected from our analysis of hallmark SNPs, most specimens grouped within the GH clade, with high representation from all four sampling sites. Most of the Michigan (iSpecimen) and Milwaukee (MCW) specimens within the GH clade had short branch lengths, owing to their relatively low number of mutations, whereas related specimens from Chicago (RUSH) and New York (Montefiore) had longer branch lengths.
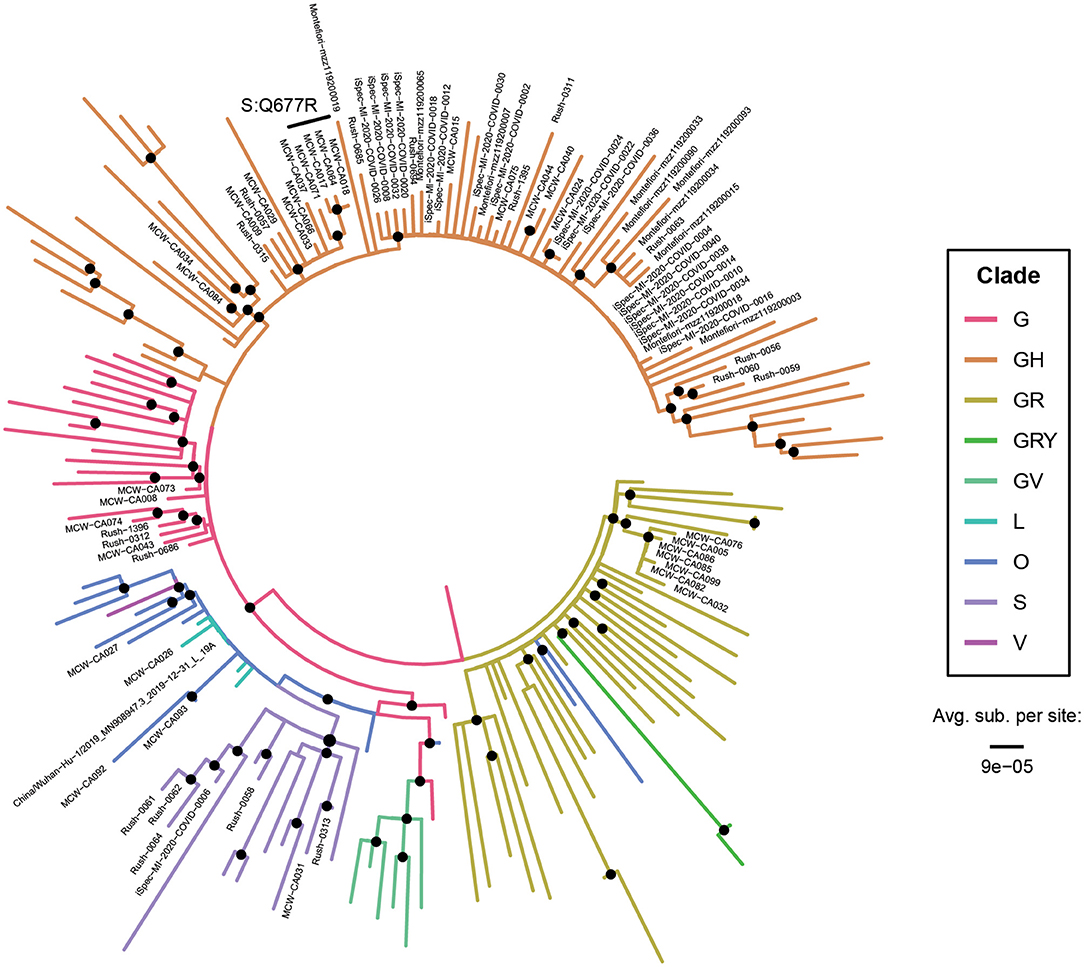
Figure 3. All major clades were represented in the United States at the start of the epidemic. A phylogenetic tree of 110 reference SARS-CoV-2 genomes (unlabeled tips) and 79 SARS-CoV-2 genomes from Abbott (labeled tips). Branches are color-coded by clade (which was corroborated by analysis of the hallmark clade-defining SNPs) and their lengths are calibrated to the average number of substitutions per site. The tree is rooted on the midpoint and specimens bearing the spike Q677R mutation are specifically denoted. Nodes with branching support >60% for Ultrafast Bootstrap and >60% for Shimodaira-Hasegawa approximate likelihood ratio test are denoted with black dots. All bootstrapping values can be found in Supplementary Figure 1.
The four Wisconsin specimens bearing the Q677R spike protein mutation (CA017, −018, −064, and −071) formed a monophyletic group within the GH clade, indicating that this mutation arose just once in our cohort and that these four specimens are likely closely related in time and space. Indeed, a retrospective chart review revealed 3 of the 4 subjects (all 61 years of age or older) were from the same long-term care facility and all had the additional mutation at position 7,764. While patients would have been symptomatic, no medical records outside of the testing could be obtained. Q677 lies within a loop near the furin cleavage site, downstream of the receptor binding domain. Except for the proline (P681) immediately proximal to the polybasic RRAR motif and Q675 (~4,600 mutant sequences), Q677 exhibits greater diversity compared to other residues in this disordered region (Supplementary Figure 2). As of 03 Mar 2021, Q677R has only been reported in 157 sequences and mutations at positions 7,764 and 25,904 have independently and individually been reported in 834 and 6,029 GISAID depositions, respectively. Linking of all three mutations has previously only been observed in two specimens in the GISAID database: USA/WI-UW-950/2020 on 15 May 2020 and USA/WI-UW-957/2020 on 18 May 2020, both also from Wisconsin and deposited on 05 Aug 2020.
The GR clade sequences were all from Milwaukee and these also clustered together with short branch lengths. We detected a small number of original clade G specimens in Chicago and Milwaukee, and we confirmed the presence of S and O clade representatives in the Midwest. Thus, our tree depicts the heterogeneity of clades found early in the pandemic and reflects a low number of accumulated mutations. The specimens CA027, −026, and −093, which could be assigned to no known clade, clustered close to the Wuhan-Hu-1 reference sequence in our tree. The other O clade specimen, CA034, does not branch near these other three and represents a separate O lineage.
Discussion
The enormous worldwide effort to sequence SARS-CoV-2 specimens has produced the most complete picture of the emergence and early evolution of a viral pathogen in real-time (37). Genetic surveillance of this virus is necessary to identify new variants that can lead to superspreading events, evasion of diagnostic tests, and circumvention of vaccination efforts. In this study, we succeeded in applying a SARS-CoV-2-specific xGen enrichment method to boost sequencing coverage in specimens with low VL. With metagenomic NGS alone, we could only recover high-coverage genomes from specimens with high VL (reliable high coverage >log 7 cp/ml, variable rates of high coverage down to log 5.6 cp/ml); however, our xGen enrichment method allowed us to extend this coverage in specimens with VLs as low as log 2–3 cp/ml. This range of sensitivity agrees with that observed by Xiao et al. (38); however, our study used more clinical specimens and compared target capture-derived genome coverage directly to qPCR Ct values obtained from the on-market Abbott RealTime SARS-CoV-2 assay.
While no greater genetic diversity was observed in the low viral load samples (nor did we expect to see this), we stress that a benefit of the method is its “on target” rate. With more than half (57%) of xGen reads aligning to SARS-CoV-2 vs. 0.001% for mNGS, this represents a substantial improvement for samples in the log 3–6 cp/ml interval (Supplementary Table 1). A one-time purchase of probes, minimal reagent cost, and an additional day of work will add expense; however, we contend that the data quality (e.g., genome coverage, sequence depth) and the ability to multiplex more samples per NGS run is more than worth the trade-off. Additionally, xGen target enrichment has an advantage over multiplex PCR techniques like ARTIC in that leftover unenriched metagenomic libraries can be analyzed by NGS to look for secondary acute or chronic infections that may contribute to a patient's disease state.
Using xGen target enrichment also provides flexibility in obtaining full genomes over a larger window during infection. Low VL specimens may simply result from being collected during the early stage of viremia or just prior to clearance when viral loads are expected to be low. Thus, one can capture full genomes of strains that are still be capable of transmitting and contributing to the pandemic. Since over half of the 194 SARS-CoV-2-positive clinical specimens evaluated in this study had VL values below log 5 cp/ml (Ct > 26, Figure 1A), we extrapolate that this enrichment method could potentially double the number of specimens from which full SARS-CoV-2 genomes can be recovered by NGS in other laboratories.
With xGen-NGS we were able to recover an extra 71 full or nearly-full genomes from medium and low VL specimens, bringing our total to 87. This >4X boost in quality genomes recovered allowed us to better evaluate the geographic distribution of SNPs at an early stage of the pandemic in the midwestern and northeastern United States. Through SNP and phylogenetic analysis, we observed an overall pervasiveness of specimens belonging to the GH clade, reinforcing previous work showing that this clade quickly became dominant in the United States in the spring of 2020 (8). However, a surprising finding was the high level of clade diversity seen from the specimens originating from MCW and Rush in May-June 2020; this indicates that in the early stages of the pandemic the populous greater Chicago and Milwaukee areas (separated by <100 miles) acted as a “melting pot” of sorts. The presence of clade G (and its descendants; probably due to early introduction from Europe) and clades S/V/O/L (probably due to early introduction from Asia) highlights the high probability of multiple introduction events due to international travel before mitigation efforts were put into place.
On the other hand, less diversity was seen in the specimens sourced from New York City (Montefiori Health System); all specimens closely clustered within Clade GH in Figure 3. Linking this finding to the mitigation efforts that were in place at the time potentially indicates that the travel and business restrictions imposed on the city during its first major case wave in the spring of 2020 temporarily lessened viral diversity. Equally homogenous were the specimens from Michigan (iSpecimen). Though these specimens were collected even earlier in the pandemic (March 2020) and could be biased due to a smaller sample size, the majority of them belonged to clade GH, which at the time contained an overall higher number of SNPs than most other clades. We can thus conclude that even before the first major American mitigation efforts were imposed in early March, the emergence of clade GH and its further diversification had already been achieved for some time.
A Q677R mutation in spike (position 23,592) was observed in four symptomatic patients in Wisconsin. Surveillance efforts have independently identified multiple lineages containing other Q677 mutations, such as Q677P and Q677H, on the rise in the southeastern and southwestern United States in the latter half of 2020 (39). It was suggested that given the proximity to the S1/S2 boundary in spike this mutation may affect proteolytic processing and cell entry, providing a selective advantage for transmissibility to drive convergent evolution at this position (39). The appearance of Q677 variants around the globe supports the idea of positive selection (40). Alternatively, an alignment of betacoronaviruses illustrates Q677 is not well-conserved and that multiple amino acids are tolerated at this position (41). The paucity of other reported mutations for SARS-CoV-2 in the immediate vicinity reflect this evolutionary conservation (Supplementary Figure 2). These Milwaukee variants containing 7,764 and 25,904 mutations ultimately did not spread out of Wisconsin, but our collection in April 2020 establishes a much earlier emergence of Q677 mutations in general, in agreement with those deposited by nearby University of Wisconsin-Madison (GISAID sequences USA/WI-UW-950/2020 and USA/WI-UW-957/2020).
More recent variants of concern affecting the spike receptor binding domain (RBD, aa 350-550) such as N501Y, E484K, K417T, and P681R from the Alpha (B.1.1.7), Beta (B.1.351), Gamma (B.1.1.28), and Delta (B.1.617.2) variants, respectively, now dominate worldwide (9, 10, 12). Sequencing infections in a high-quality manner is the first step for ascertaining whether new mutations have appeared and if they have potential to impact transmissibility, disease progression, or immune evasion (42–45). Having the ability to sequence low viral load samples through xGen target enrichment will allow us to characterize specimens that may be recalcitrant to standard sequencing approaches, positively contributing to the mission of recovering as many SARS-CoV-2 sequences as possible.
Data Availability Statement
The datasets presented in this study can be found in online repositories. The names of the repository/repositories and accession number(s) can be found at: https://www.ncbi.nlm.nih.gov/genbank/, MZ363485-MZ363563.
Ethics Statement
The studies involving human participants were reviewed and approved by Rush Medical Center, Medical College of Wisconsin, Montefiori Health Center. The patients/participants provided their written informed consent to participate in this study.
Author Contributions
GO and MB performed data analysis, interpretation, and wrote paper. KF performed experiments and analysis. TM, IM, and AM performed bioinformatic analysis. MF, CJ, AL, DG, and AM supervised specimen collection. GC supervised project and wrote paper. All authors contributed to the article and approved the submitted version.
Funding
All funding for this research was provided by Abbott Laboratories. The funder provided support in the form of salaries for authors GO, KF, TM, IM, AM, MB, and GC, but did not have any additional role in the study design, data collection and analysis, decision to publish, or preparation of the manuscript.
Conflict of Interest
GO, KF, TM, IM, AM, MB, and GC are all employees and shareholders of Abbott Laboratories.
The remaining authors declare that the research was conducted in the absence of any commercial or financial relationships that could be construed as a potential conflict of interest.
Publisher's Note
All claims expressed in this article are solely those of the authors and do not necessarily represent those of their affiliated organizations, or those of the publisher, the editors and the reviewers. Any product that may be evaluated in this article, or claim that may be made by its manufacturer, is not guaranteed or endorsed by the publisher.
Acknowledgments
We thank Dr. Mary Rodgers and Dr. Mark Anderson (Abbott Laboratories) for specimen procurement and inventory management.
Supplementary Material
The Supplementary Material for this article can be found online at: https://www.frontiersin.org/articles/10.3389/fviro.2021.765974/full#supplementary-material
Supplementary Figure 1. Phylogenetic tree explicitly displaying all strain names and bootstrapping values. The tree from main text Figure 3 is shown in a rectangular format with all bootstrapping values shown. The format of the boostrapping values is as follows: [SH-aLRT support (%)/ultrafast bootstrap support (%)].
Supplementary Figure 2. Genetic diversity of residues flanking the furin cleavage domain. Summary of mutations reported in GISAID within the disordered loop domain at the furin cleavage site.
Supplementary Table 1. Sequencing statistics for mNGS and xGen libraries. Results are listed in descending order of viral loads, with Ct values not adjusted for 10 unread cycles. On target percentages were calculated by dividing COVID-19 reads by total reads. Grayed out cells indicate that the library was either not sequenced (mNGS) or not prepared (xGen) based on viral loads.
References
1. Faico-Filho KS, Passarelli VC, Bellei N. Is higher viral load in SARS-CoV-2 associated with death? Am J Trop Med Hyg. (2020) 103:2019–21. doi: 10.4269/ajtmh.20-0954
2. Wang B, Li R, Lu Z, Huang Y. Does comorbidity increase the risk of patients with COVID-19: evidence from meta-analysis. Aging. (2020) 12:6049–57. doi: 10.18632/aging.103000
3. Holshue ML, Debolt C, Lindquist S, Lofy KH, Wiesman J, Bruce H, et al. First case of 2019 novel coronavirus in the United States. N Engl J Med. (2020) 382:929–36. doi: 10.1056/NEJMoa2001191
4. Team C-I. Clinical and virologic characteristics of the first 12 patients with coronavirus disease 2019 (COVID-19) in the United States. Nat Med. (2020) 26:861–8. doi: 10.1038/s41591-020-0877-5
5. Maurano MT, Ramaswami S, Zappile P, Dimartino D, Boytard L, Ribeiro-Dos-Santos AM, et al. Sequencing identifies multiple early introductions of SARS-CoV-2 to the New York City region. Genome Res. (2020) 30:1781–8. doi: 10.1101/gr.266676.120
6. Gonzalez-Reiche AS, Hernandez MM, Sullivan MJ, Ciferri B, Alshammary H, Obla A, et al. Introductions and early spread of SARS-CoV-2 in the New York City area. Science. (2020) 369:297–301. doi: 10.1126/science.abc1917
7. Korber B, Fischer WM, Gnanakaran S, Yoon H, Theiler J, Abfalterer W, et al. Tracking changes in SARS-CoV-2 spike: evidence that D614G increases infectivity of the COVID-19 virus. Cell. (2020) 182:812–27.e19. doi: 10.1016/j.cell.2020.06.043
8. Mercatelli D, Giorgi FM. Geographic and genomic distribution of SARS-CoV-2 mutations. Front Microbiol. (2020) 11:1800. doi: 10.3389/fmicb.2020.01800
9. Sabino EC, Buss LF, Carvalho MPS, Prete CA Jr, Crispim MAE, Fraiji NA, et al. Resurgence of COVID-19 in Manaus, Brazil, despite high seroprevalence. Lancet. (2021) 397:452–5. doi: 10.1016/S0140-6736(21)00183-5
10. Tegally H, Wilkinson E, Giovanetti M, Iranzadeh A, Fonseca V, Giandhari J, et al. Detection of a SARS-CoV-2 variant of concern in South Africa. Nature. (2021) 592:438–43. doi: 10.1038/s41586-021-03402-9
11. Tegally H, Wilkinson E, Lessells RJ, Giandhari J, Pillay S, Msomi N, et al. Sixteen novel lineages of SARS-CoV-2 in South Africa. Nat Med. (2021) 27:440–6. doi: 10.1038/s41591-021-01255-3
12. Volz E, Mishra S, Chand M, Barrett JC, Johnson R, Geidelberg L, et al. Assessing transmissibility of SARS-CoV-2 lineage B. Engl Nat. (2021) 593:266–9. doi: 10.1038/s41586-021-03470-x
13. World Health Organization. Report of the WHO-China Joint Mission on Coronavirus Disease 2019 (COVID-19). (2020). p. 40.
14. Jayamohan H, Lambert CJ, Sant HJ, Jafek A, Patel D, Feng H, et al. SARS-CoV-2 pandemic: a review of molecular diagnostic tools including sample collection and commercial response with associated advantages and limitations. Anal Bioanal Chem. (2021) 413:49–71. doi: 10.1007/s00216-020-02958-1
15. Kim D, Lee JY, Yang JS, Kim JW, Kim VN, Chang H. The architecture of SARS-CoV-2 transcriptome. Cell. (2020) 181:914–21.e10. doi: 10.1016/j.cell.2020.04.011
16. Taiaroa G, Rawlinson D, Featherstone L, Pitt M, Caly L, Druce J, et al. Direct RNA sequencing and early evolution of SARS-CoV-2. bioRxiv [Preprint]. (2020). doi: 10.1101/2020.03.05.976167
17. Tyson JRJP, Stoddart D, Sparks N, Wickenhagen A, Hall G, Choi JH, et al. Improvements to the ARTIC multiplex PCR method for SARS-CoV-2 genome sequencing using nanopore. bioRxiv [Preprint]. (2020). doi: 10.1101/2020.09.04.283077
18. Berg MG, Olivo A, Forberg K, Harris BJ, Yamaguchi J, Shirazi R, et al. Advanced molecular surveillance approaches for characterization of blood borne hepatitis viruses. PLoS ONE. (2020) 15:e0236046. doi: 10.1371/journal.pone.0236046
19. Forberg K, Rodgers MA, Dawson GJ, Sauleda S, Olivo A, Vallari A, et al. Human pegivirus 2 exhibits minimal geographic and temporal genetic diversity. Virology. (2019) 539:69–79. doi: 10.1016/j.virol.2019.10.012
20. Yamaguchi J, Olivo A, Laeyendecker O, Forberg K, Ndembi N, Mbanya D, et al. Universal target capture of HIV sequences from NGS libraries. Front Microbiol. (2018) 9:2150. doi: 10.3389/fmicb.2018.02150
21. Bonsall D, Ansari MA, Ip C, Trebes A, Brown A, Klenerman P, et al. ve-SEQ: Robust, unbiased enrichment for streamlined detection and whole-genome sequencing of HCV and other highly diverse pathogens. F1000Res. (2015) 4:1062. doi: 10.12688/f1000research.7111.1
22. Berg MGZW, Lucic D, Degli-Angeli EJ, Anderson M, Forberg K, Olivo A, et al. Development of the RealTime SARS-CoV-2 quantitative Laboratory Developed Test and correlation with viral culture as a measure of infectivity. J Clin Virol. (2021) 143:104945. doi: 10.1016/j.jcv.2021.104945
23. Degli-Angeli E, Dragavon J, Huang ML, Lucic D, Cloherty G, Jerome KR, et al. Validation and verification of the Abbott RealTime SARS-CoV-2 assay analytical and clinical performance. J Clin Virol. (2020) 129:104474. doi: 10.1016/j.jcv.2020.104474
25. Katoh K, Standley DM. MAFFT multiple sequence alignment software version 7: improvements in performance and usability. Mol Biol Evol. (2013) 30:772–80. doi: 10.1093/molbev/mst010
26. Hong SL, Lemey P, Suchard MA, Baele G. Bayesian phylogeographic analysis incorporating predictors and individual travel histories in BEAST. Curr Protoc. (2021) 1:e98. doi: 10.1002/cpz1.98
27. Morel B, Barbera P, Czech L, Bettisworth B, Hubner L, Lutteropp S, et al. Phylogenetic analysis of SARS-CoV-2 data is difficult. Mol Biol Evol. (2021) 38:1777–91. doi: 10.1093/molbev/msaa314
28. Nguyen LT, Schmidt HA, von Haeseler A, Minh BQ, IQ-TREE. a fast and effective stochastic algorithm for estimating maximum-likelihood phylogenies. Mol Biol Evol. (2015) 32:268–74. doi: 10.1093/molbev/msu300
29. Kalyaanamoorthy S, Minh BQ, Wong TKF, von Haeseler A, Jermiin LS. ModelFinder: fast model selection for accurate phylogenetic estimates. Nat Methods. (2017) 14:587–9. doi: 10.1038/nmeth.4285
30. Hoang DT, Chernomor O, von Haeseler A, Minh BQ, Vinh LS. UFBoot2: improving the ultrafast bootstrap approximation. Mol Biol Evol. (2018) 35:518–22. doi: 10.1093/molbev/msx281
31. Anisimova M, Gascuel O. Approximate likelihood-ratio test for branches: a fast, accurate, and powerful alternative. Syst Biol. (2006) 55:539–52. doi: 10.1080/10635150600755453
32. Huson DH, Richter DC, Rausch C, Dezulian T, Franz M, Rupp R. Dendroscope: an interactive viewer for large phylogenetic trees. BMC Bioinformatics. (2007) 8:460. doi: 10.1186/1471-2105-8-460
33. Pipes L, Wang H, Huelsenbeck JP, Nielsen R. Assessing uncertainty in the rooting of the SARS-CoV-2 phylogeny. Mol Biol Evol. (2021) 38:1537–43. doi: 10.1093/molbev/msaa316
34. Yu G, Smith DK, Zhu H, Guan Y, Lam TTY. ggtree: an r package for visualization and annotation of phylogenetic trees with their covariates and other associated data. Methods Ecol Evol. (2017) 8:28–36. doi: 10.1111/2041-210X.12628
35. Buchan BW, Hoff JS, Gmehlin CG, Perez A, Faron ML, Munoz-Price LS, et al. Distribution of SARS-CoV-2 PCR cycle threshold values provide practical insight into overall and target-specific sensitivity among symptomatic patients. Am J Clin Pathol. (2020) 154:479–85. doi: 10.1093/ajcp/aqaa133
36. Jefferson T, Spencer EA, Brassey J, Heneghan C. Viral cultures for COVID-19 infectious potential assessment - a systematic review. Clin Infect Dis. (2020). doi: 10.1093/cid/ciaa1764. [Epub ahead of print].
37. Sironi M, Hasnain SE, Rosenthal B, Phan T, Luciani F, Shaw MA, et al. SARS-CoV-2 and COVID-19: a genetic, epidemiological, and evolutionary perspective. Infect Genet Evol. (2020) 84:104384. doi: 10.1016/j.meegid.2020.104384
38. Xiao M, Liu X, Ji J, Li M, Li J, Yang L, et al. Multiple approaches for massively parallel sequencing of SARS-CoV-2 genomes directly from clinical samples. Genome Med. (2020) 12:57. doi: 10.1186/s13073-020-00751-4
39. Hodcroft EBDD, Oguntuyo K, Snyder DJ, Van Diest M, Densmore KH, Schwalm KC, et al. Emergence in late 2020 of multiple lineages of SARS-CoV-2 Spike protein variants affecting amino acid position 677. bioRxiv [Preprint]. (2021). doi: 10.1101/2021.02.12.21251658
40. Hodcroft EB, Zuber M, Nadeau S, Vaughan TG, Crawford KHD, Althaus CL, et al. Emergence and spread of a SARS-CoV-2 variant through Europe in the summer of 2020. medRxiv [Preprint]. (2021). doi: 10.1101/2020.10.25.20219063
41. Walls AC, Park YJ, Tortorici MA, Wall A, McGuire AT, Veesler D. Structure, function, and antigenicity of the SARS-CoV-2 spike glycoprotein. Cell. (2020) 183:1735. doi: 10.1016/j.cell.2020.11.032
42. Davies NG, Abbott S, Barnard RC, Jarvis CI, Kucharski AJ, Munday JD, et al. Estimated transmissibility and impact of SARS-CoV-2 lineage B.1.1.7 in England. Science. (2021) 372:eabg3055. doi: 10.1126/science.abg3055
43. Wibmer CK, Ayres F, Hermanus T, Madzivhandila M, Kgagudi P, Oosthuysen B, et al. SARS-CoV-2 501Y.V2 escapes neutralization by South African COVID-19 donor plasma. Nat Med. (2021) 27:622–5. doi: 10.1101/2021.01.18.427166
44. Zhou D, Dejnirattisai W, Supasa P, Liu C, Mentzer AJ, Ginn HM, et al. Evidence of escape of SARS-CoV-2 variant B.1.351 from natural and vaccine-induced sera. Cell. (2021) 184:2348–61.e6. doi: 10.1016/j.cell.2021.02.037
Keywords: next generation (deep) sequencing (NGS), target enrichment, SARS-CoV-2, xGen, coronavirus-COVID-19
Citation: Orf GS, Forberg K, Meyer TV, Mowerman I, Mohaimani A, Faron ML, Jennings C, Landay AL, Goldstein DY, Fox AS, Berg MG and Cloherty GA (2021) SNP and Phylogenetic Characterization of Low Viral Load SARS-CoV-2 Specimens by Target Enrichment. Front. Virol. 1:765974. doi: 10.3389/fviro.2021.765974
Received: 27 August 2021; Accepted: 02 November 2021;
Published: 23 November 2021.
Edited by:
Chris Illingworth, University of Cambridge, United KingdomReviewed by:
Pilar Moreno, Universidad de la República, UruguayFrancesca Di Giallonardo, University of New South Wales, Australia
Copyright © 2021 Orf, Forberg, Meyer, Mowerman, Mohaimani, Faron, Jennings, Landay, Goldstein, Fox, Berg and Cloherty. This is an open-access article distributed under the terms of the Creative Commons Attribution License (CC BY). The use, distribution or reproduction in other forums is permitted, provided the original author(s) and the copyright owner(s) are credited and that the original publication in this journal is cited, in accordance with accepted academic practice. No use, distribution or reproduction is permitted which does not comply with these terms.
*Correspondence: Michael G. Berg, bWljaGFlbC5iZXJnQGFiYm90dC5jb20=
†These authors have contributed equally to this work