1
Department of Biology, West Virginia University, Morgantown, WV, USA
2
Biomedical Engineering, Johns Hopkins University, Baltimore, MD, USA
3
Center for the Neural Basis of Cognition, Carnegie Mellon, Pittsburgh, PA, USA
Each down stroke of an insect’s wings accelerates axial airflow over the antennae. Modeling studies suggest that this can greatly enhance penetration of air and air-born odorants through the antennal sensilla thereby periodically increasing odorant-receptor interactions. Do these periodic changes result in entrainment of neural responses in the antenna and antennal lobe (AL)? Does this entrainment affect olfactory acuity? To address these questions, we monitored antennal and AL responses in the moth Manduca sexta while odorants were pulsed at frequencies from 10–72 Hz, encompassing the natural wingbeat frequency. Power spectral density (PSD) analysis was used to identify entrainment of neural activity. Statistical analysis of PSDs indicates that the antennal nerve tracked pulsed odor up to 30 Hz. Furthermore, at least 50% of AL local field potentials (LFPs) and between 7–25% of unitary spiking responses also tracked pulsed odor up to 30 Hz in a frequency-locked manner. Application of bicuculline (200 µM) abolished pulse tracking in both LFP and unitary responses suggesting that GABAA receptor activation is necessary for pulse tracking within the AL. Finally, psychophysical measures of odor detection establish that detection thresholds are lowered when odor is pulsed at 20 Hz. These results suggest that AL networks can respond to the oscillatory dynamics of stimuli such as those imposed by the wing beat in a manner analogous to mammalian sniffing.
Studies of neural processing in primary olfactory networks have sought to determine whether precise spike synchronization on an oscillatory timescale reflects an odorant identity encoding process (Laurent and Davidowitz, 1994
; Laurent and Naraghi, 1994
; Laurent et al., 1996b
, 2001
Wehr and Laurent, 1996
; Stopfer et al., 1997
, 2003
). Other studies have argued that precise spike timing reflects context-dependent processes, which highlight the details of the interaction of the organism’s sensory array with the environment (Christensen and Hildebrand, 1997
; Christensen et al., 1998
; Lei and Hansson, 1999
; Vickers et al., 2001
; Lei et al., 2009
). In the case of temporal encoding, there are at least two identifiable temporal response patterns that have been correlated with an animal’s ability to discriminate between odors. One is characterized by spike time synchrony of distributed output neurons on a timescale defined by odor-driven subthreshold oscillatory responses of the primary olfactory network (e.g. Stopfer et al., 1997
). A second time scale that correlates with odor discrimination is defined by a highly reproducible sequence of responses from clusters of synchronously spiking neurons (e.g. Daly et al., 2004b
). These population-level response sequences require on the order of 240 ms from stimulus onset to become optimally distinctive and odor-dependent (Daly et al., 2004b
; Staudacher et al., 2009
). However, when insect antennae are passively exposed to random fluctuations in odor stimuli their antennal responses reflect the temporal pattern of the stimulus and variations in odor concentration (Vickers et al., 2001
; Geffen et al., 2009
). This raises the question of how temporal encoding processes are affected when olfactory stimuli are presented in a manner that is both temporally and biologically realistic.
Recent studies of the fluid dynamic effects of the insect wing beat (Loudon and Koehl, 2000
; Sane, 2006
; Sane and Jacobson, 2006
) as well as neurophysiological measures of antennal responses (Lemon and Getz, 1997
; Barrozo and Kaissling, 2002
; Bau et al., 2002
, 2005
) and behavioral responses (Justus et al., 2002
) suggest that the olfactory systems of at least some insects may receive periodic olfactory input that is perhaps analogous to mammalian sniffing. This raises some intriguing, but as yet, unanswered questions. For example, how is an oscillating olfactory input reflected in central representations within the first synaptic relay, the antennal lobe (AL)? Are these temporal dynamics filtered out or possibly enhanced by local processing within the AL? Is there any functional consequence to receiving olfactory input in this periodic manner? That is, does periodic stimulation affect olfactory acuity in the behaving animal?
To address the above questions we designed a series of physiological and behavioral experiments using the moth Manduca sexta. Manduca typically beats its wings at 18–20 Hz during tethered flight (Frye, 2001a,b
; Sane and Jacobson, 2006
), and up to ∼28 Hz during free flight within a wind tunnel (M. A. Willis, unpublished personal observation). We show that physiological measures of antennal input, as well as AL local field potential (LFP) and unitary spiking patterns, “track” odorants pulsed up to and beyond the wing beat frequency range and that this tracking appears to be dependent on GABAergic transmission within the AL. Furthermore, we show that psychophysically determined odor detection thresholds are lowered when odor stimuli are pulsed at 20 Hz.
Subjects
All moths were reared in our laboratory under standard rearing conditions. At pupal stage 17, individuals were placed into brown paper bags and kept in an incubator (Percival Scientific; I66VLC8) in a reversed 16/8 light/dark cycle at 25ºC and 75% relative humidity. Every day at the beginning of the dark cycle, bags with newly eclosed adults were dated. All moths were kept for at least 3-days post-eclosion to ensure complete development of the olfactory system. Subjects used for electroantennogram (EAG) experiments were aged 3–5 days post-eclosion, while moths used in all other experiments were 5–7 days post-eclosion. Equal numbers of males and females were used in the behavioral and EAG studies. Only male moths were used for multichannel studies, to ensure that the data could be compared with previous studies (Daly et al., 2004a,b).
Stimulus Delivery
Figure 1
A shows a schematic of the general features of the stimulus delivery system used in all experiments. All preparations were placed 2 cm in front of the exhaust vent to create a constant airflow across the antennae. At the position of the antenna, the velocity of the ambient airflow was between 0.2–0.3 m/s as measured with a hot wire anemometer (Traceable Hot Wire Anemometer; Fisher Scientific). The nozzle of the odor delivery device was one of the three openings of a nylon barbed T-fitting with a 1.6-mm inner diameter. This opening was placed 3 mm directly in front of the leading edge of the antenna and aimed toward the center of its length. The other two openings of the T-fitting received either clean air or air from the same source but passed through an odor cartridge.
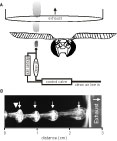
Figure 1. Schematic of the general experimental setup in Experiments 1–3. (A) A single line feeds air into the valve and can be switched between the blank and the odor cartridges, which merge about 2 mm before the output nozzle. (B) High speed imaging of olfactometer output at 50 Hz with a velocity of 0.3 m/s and a 10:40-ms duty cycle. Titanium tetrachloride, which produces a neutrally buoyant condensate, was used to visualize this 50-Hz pulse train. The odor nozzle is just out of view to the left. The large arrowhead indicates where the antenna was placed during physiological experiments. Small inset arrows identify individual pulses. Because some titanium tetrachloride condenses at the tip of the nozzle, there is a constant stream even when the valve is not open. Note also that as individual pulses approach and pass through the opening of the exhaust (vertical white line) they are stretched indicating that the draw is faster than the puffing velocity.
Air for the odor delivery system was supplied via a central air line, passed through a 500-cc Drierite cartridge to extract moisture (Indicating Drierite; Drierite: 23025) and then through 500-cc of active charcoal (Sigma-Aldrich: C3014) in a modified Drierite cartridge. Cleaned air was then passed through an adjustable glass ball flow meter (Cole-Parmer: 1-010293), which controlled stimulus velocity and was set to 0.5 m/s. From the flow meter, the air was rehumidified by passing it through an aquarium aerator stone in deionized water. Humidified air was then fed into a three-way odor control valve (Lee Co.: LFAA1200118H). Normally, clean air flowed into the inlet port then immediately out a second normally open port. For odor stimulation, the valve was activated, which resulted in air being shunted to the normally closed port. The normally closed port was connected to an odorant cartridge via 1.5-mm ID tubing (Tygon; Cole–Parmer). The outputs of both the normally open and normally closed ports were connected to two ports of the barbed T-fitting described above. Hence clean and odor laden air could be interleaved to maintain a constant flow across the antenna at all times. The effluent from the nozzle was then drawn into the exhaust vent directly behind the experimental preparation.
The activation of the three-way valve was controlled via custom computer scripts. Because different hardware and software was used for different experiments, the timestamps indicating valve openings were analyzed using power spectral density (PSD) to confirm the frequency of each pulse train. Note that the stimulation frequency delivered by each device was consistent yet slightly differing from the desired value; hence we report actual frequencies for each experiment (to within an integer). At all frequencies, odors were delivered at a duty cycle of 50% unless reported otherwise. To test whether individual odor pulses within pulse trains were discrete up to 50 Hz, we imaged the output of the odor delivery device using liquid smoke (titanium–tetrachloride; Acros Organics: 197231000; Figure 1
B). Figure 1
B shows that individual pulses from the odor cartridge line interleave with the clean air and remain discrete puffs in pulse trains up to 50 Hz.
Odor cartridges were made from borosilicate glass tubing and nylon end fittings and had an inner volume of 1.7 ml. Odors were applied to a piece of #1 Whatman filter paper, which was inserted into the cartridge. We used the same 10 monomolecular odors as in previous studies (Tables 1
A/B; Daly et al., 2001
, 2007
, 2008
) (Daly et al., 2001
, 2007
, 2008
), but not all odors were used in all experiments. For behavioral experiments, odors were diluted with mineral oil (Fisher Scientific; O121-1) to 0.001–10.0 µg/2 µl in log steps; dilutions were calculated based on density. For electrophysiological experiments, both pulsed and continuous stimuli were presented for 3 s except where noted otherwise. Pulse trains were sequentially presented with decreasing frequencies. All stimuli were separated by 20 s inter-trial intervals. Following the presentation of the total frequency sequence, the odor cartridge was changed and the sequence was repeated with a different odor.
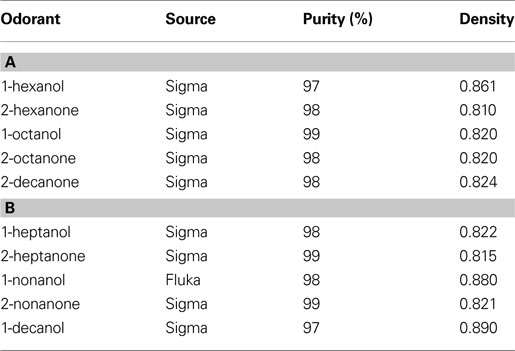
Table 1. Primary (A) and secondary (B) panel of odorants used in experiments. Listing of odorant, source, purity and density.
Electroantennogram (EAG) Recordings
A total of 10 antennae from five male and five female animals were prepared as previously described (Daly et al., 2007
). Briefly, antennae were excised at the base of the flagellum. The excised flagellum was further cut at the base and the tip resulting in a final length of ∼1.2 cm; these cuts also exposed both ends of the antennal nerve. Conductive gel (Spectra 360; 0341-0012-08) was used to enhance electrical conductivity and to mount the flagellum on a two channel (signal and reference) electrode holder designed for EAG recording. The signal was amplified 10-fold by a head stage (Syntech, PRG-2), further amplified by a 2-channel signal processing system optimized for EAG signals (Syntech, IADC-2), then fed into and recorded with a Cheetah data acquisition system (high pass: 0.5 Hz; sampling rate: 10.7 kHz; Neuralynx).
Antennae were stimulated with undiluted 2-hexanone or with a blank odor cartridge at different pulse frequencies. Stimuli were presented five times at all test frequencies with odor and blank trials being alternated. Pulse frequencies were varied between 10–40 Hz to obtain frequency-response profiles for antennal input.
Multiunit and Local Field Potential Recordings Under Normal and GABA Disrupted Conditions
A detailed description of the preparation for multichannel recordings is given in (Daly et al., 2004a
). Male moths were restrained in 12 mm inner diameter copper tubes with molten soft dental wax. The AL was exposed by excising a portion of the head capsule directly above the brain. Some connective tissue and trachea were removed to expose the AL. Movement of the moth’s right (recording side) antenna was minimized by cutting the intrinsic antennal muscles and placing minuten pins into the wax above and below the antenna, thereby immobilizing it completely. The AL was superfused with physiological saline (Heinbockel et al., 1998
) throughout preparation and experimentation. A 16- channel silicon microprobe with two shanks (2 × 2 TET, NeuroNexus Technologies, Ann Arbor, MI, USA) was inserted into the AL via an HS6-3 motorized micromanipulator controlled by a MCL-3 electronic controller and joystick (World Precision Instruments, Sarasota, FL, USA), which displayed probe depth in µm. Probes were always placed at roughly the same site on the boundary between the AL and protocerebrum. After removing a small part of a large trachea, which runs along this boundary, the probes could be placed with little or no dimpling. Probe depth was between ∼550–650 µm. Variation in probe depth was the result of optimizing the yield of single units in each recording. Probe signals were buffered by a 27 channel head stage preamplifier (HS 27, Neuralynx, Bozeman, MT, USA), which was connected to a 24 channel amplifier array of the Cheetah data acquisition system (Neuralynx, Bozeman, MT, USA). Unitary event data from the 16 electrode sites were band pass filtered at 600–6000 Hz and sampled at 33.3 kHz per channel (12 bit). Additionally, the signals of the upper- and lowermost electrodes on each of the two shanks (four total recording sites across the AL) were continuously sampled at 11.1 kHz to provide local field potential recordings. These data were bandpass filtered at 1–125 Hz using a windowed sync filter with 4000 taps for analysis.
The spike sorting methods implemented here have been detailed elsewhere (Daly et al., 2004b
). Briefly, unitary spike sorting was performed offline in a partially automated fashion. Raw tetrode data were pre-processed using the BubbleClust function of the MClust toolbox for Matlab (Version 3.5; A.D. Reddish). BubbleClust uses a kth-nearest neighbor algorithm to classify events across the 4 recording channels of each tetrode using spike energy and the first two principal components of the waveforms. This results in a decision tree, which segregates events from lowest to highest neighbor density. At each region of neighbor density, the summary statistics used to assess unit fidelity and stability included peak plots, autocorrelations, cross correlations, inter-spike interval (ISI) histograms and peak by channel by time plots. Clusters of events representing unique spike waveform profiles across the four recording channels that were consistent over time were retained and exported to the MClust toolbox for Matlab for the second processing step. Clusters of events were then manually refined, using convex hulls. Three criteria were used to select clusters: their waveforms had to be stable over time, they contained less than 3% of spikes with ISIs of 2 ms or shorter, and they were separated from each of the neighboring clusters by at least 2 standard deviations. Finally, each refined cluster was defined as one “unit” and a vector of time stamps was exported for each unit for further analysis.
For both LFP and unitary responses we quantified how well the AL tracked periodic input. Nine male moths were stimulated with a blank and the primary panel of odorants (see Table 1
A); five of the animals were additionally stimulated with the secondary panel of odorants (see Table 1
B). Here we used a larger panel of odors relative to the EAG experiments to both increase the probability of recording odor-elicited unitary responses and to establish whether any pulse-tracking effects were odor- dependent. The sequence of odor stimuli was randomized. As an internal control, 2-hexanone and a blank were repeated (where possible) after the complete panel of odors was presented. The first group of animals (n = 4) was stimulated with pulse-train frequencies ranging from 10–40 Hz using Table 1
A odorants; this stimulus regime was identical to the EAG experiments. Preliminary analysis indicated that pulse-tracking oscillatory responses were present throughout this range of frequencies. Thus, a second group of animals (n = 4) was stimulated with frequencies ranging from 10–72 Hz (using Table 1
A/B odorants). At these higher frequencies, antennal boundary layer effects were minimized by increasing the flow velocity of the olfactometer to 3.0 m/s, which is well within the maximum flight speed of this moth. In the second group of four moths, after completion of the stimulation, superfusion with saline was changed to saline with bicuculline methiodide (BMI; 200 µM; Sigma-Aldrich), a competitive GABAA antagonist in Manduca (Christensen et al., 1998
). The preparation was superfused with the BMI solution for 10 min prior to repeating the stimulus protocols and maintained throughout the second presentation of odorants. Because we used a whole-moth preparation, the perfusion solution became mixed with the animals’s hemolymph; hence a complete wash was not possible. In both groups of moths, continuous odor stimuli were also delivered to assess intrinsic oscillatory activity that is known to occur in this species in response to continuous odor stimulation (Heinbockel et al., 1998
). Finally one moth was stimulated with only 20 Hz stimuli using Table 1
A/B odorants; each odor was repeated 10 times for each pulsing frequency.
Psychophysical Detection Thresholds
A total of 60 male and female moths were used to establish whether a periodic stimulus enhances olfactory sensitivity in the behaving animal. A detailed description of this preparation as well as the conditioning and testing protocols is given in (Daly and Smith, 2000
). Each moth was placed into a 1.27 cm aluminum tube and held in position with pieces of pipe cleaner and tape. The proboscis was extended and threaded into a ∼4 cm length of Tygon tubing (1.27-mm ID). A Teflon coated silver electrode (0.125-mm Diameter) was placed into the right side of the head capsule and into a large feeding muscle and an indifferent electrode was placed into the contra-lateral compound eye. This preparation allowed us to monitor unconditioned and conditioned feeding responses during conditioning and testing procedures.
Using well-established Pavlovian methods, moths were conditioned using an undiluted odorant as the conditioning stimulus (CS) and 0.75 M sucrose solution as the unconditioned stimulus (US). Application of sucrose solution to the tip of the proboscis innately elicits an unconditioned feeding response (UR), which is clearly observed using electromyography (EMG; see Daly and Smith, 2000
). In all conditioning trials, moths were presented with a 4-s continuous CS. Three seconds into the CS presentation, a 4-s US was presented, producing a forward pairing of the CS and US with a 1-s CS-US overlap. Each moth received six conditioning trials separated by 6 min. Acquisition of the conditioned response (CR) was monitored during the 3 s prior to US application. Increased EMG activity during CS presentation but prior to presentation of the US was recorded as a CR. With EMG wires in place, moths remained in the aluminum tubes for the entire experiment, but between conditioning and test trials, they were returned to the incubator.
Testing for presence of the CR was performed 24 and 48 h after conditioning. Pulsed and continuous testing protocols were randomized between the 24 and 48-h test days. Stimuli were either pulsed at 20 Hz or presented continuously. In all cases, moths were first presented with a blank stimulus (no odor) to quantify and correct for non-olfactory responses caused by non-olfactory cues of the two respective stimulation protocols. Subsequently, each moth was tested with the concentration series from the lowest to the highest concentration. For pulsed stimuli, odor (or the blank) was presented as a 10:40 ms on:off duty cycle. The total duration of the pulse train was 4 s and, thus, the total integrated time the odor valve was open and delivering odorant was 800 ms. To ensure that the total amount of odor presented between the pulsed and continuous stimulus was the same, the continuous stimulus had a duration of 800 ms during the test trials. Whether pulsed or continuous stimuli were presented, a CR was recorded if the moth responded with an increase in EMG activity within 7 s of the onset of the stimulus; this is consistent with our standard testing protocol (Daly and Smith, 2000
).
Analysis
Power spectral density analysis
The spectral content of the neurophysiological measurments was calculated using PSD for each pulse frequency in order to quantify the presence and relative strength of pulse tracking. Welch’s method of PSD analysis was implemented in Matlab (The Mathworks). Before spectral analysis, EAGs and local field potentials (LFPs) were bandpass filtered from 5–80 Hz using a custom windowed sync filter combined with a 60 Hz notch filter. Spike time data from individually sorted neural units were binary interpolated to a constant sampling rate by placing a value of one into every bin where a spike was present and zeros for all empty bins; the resulting time series were then similarly bandpass filtered. Welch’s method was implemented by splitting the filtered signal into eight blocks of equal length with 50% overlap between blocks and computing a 65536 point, fast Fourier transform on each block. Blocks were then averaged to yield the final PSD. The method and parameters used were chosen to provide a frequency resolution of 0.16 Hz.
Three measures from the PSD results were generated to statistically assess stimulus-driven oscillatory power present in each response. First, since the measure of power in a PSD for a particular frequency band lies in the area under the curve of the band, we integrated the frequency band 2 Hz above and below the stimulation frequency. This resulted in a single scalar value for power within the integration window. A 4 Hz integration window was used because it was the minimum window width sufficient to capture all of the power elicited by pulsed input across all recordings. The resulting measures of integrated power were then normalized to a z-score value within each moth. Normalizing power values within an animal eliminated relative differences in power across subjects that were attributable to experimental differences such as electrode quality and probe placement. Normalizing allowed statistical comparison of relative differences in power across stimulation conditions (e.g. pulsed versus continuous) using pair-wise type 2 t-tests (Welch’s t-test).
We developed a second method to quantify responses to pulsed stimuli on a case-by-case basis by counting the number of units or LFPs that were classified as pulse-tracking responses. All normalized PSDs from LFPs or unitary responses from peristimulus pulse trains, with the same frequency regardless of odor, were compared to a similarly computed and normalized set of values calculated from continuous stimuli. Pulse tracking was identified by assessing whether normalized power values for pulsed stimuli were significantly higher at the pulsing frequency than those from continuous stimuli (Welch’s t-test; p < 0.05). This process was repeated for each stimulation frequency for each recorded LFP or unit.
The results of the second method provided a statistical estimate of the number of LFPs and units that could track pulses. This method appeared conservative relative to what was observable by visual inspection of the mean PSD results. That is, there were several clear examples of pulse tracking among sorted units in particular that were not identified by our statistical criterion; this is likely attributable to the relatively small number of repeats per frequency that we were able to collect (n = 10). We therefore developed a third method for assessing pulse tracking; it was based on identification of the most prominent peak in each PSD. Here, mean PSDs corresponding to each pulse-train frequency across all odors were used. We then established whether the highest peak in the PSD was the input frequency (+/−0.5 Hz, maximum frequency = 45 Hz). If this criterion was met the given unit was identified as pulse tracking at that frequency. Given that the relationship between statistical significance and biological significance remains unclear, a comparison of the two methods provides a reasonable range for pulse-tracking efficacy at each frequency. We note that while the highest peak criteria usually identified the same units as those chosen by the statistical criteria, there were also examples of statistically significant peaks which were not identified by the highest peak criteria.
Time frequency-response spectrograms
Time frequency-response spectrograms were used to visualize the time-dependency of the spectral content of LFPs. Peristimulus voltage traces were extracted from −0.5 to 1.5 s of stimulus onset and filtered as described above. A Short-Time Fourier Transform (STFT) was calculated with the “tfrsp” function in the Time-Frequency Toolbox for Matlab (http://tftb.nongnu.org/
). The resulting spectrogram shows frequency content changes within the peri-stimulus time window. For this analysis, we used 1984 time bins within a 2-s time window, 1000 total frequency bins (76 of which were between 0 and 100 Hz) and a 250-point Hamming window. All spectrograms of responses to a single odor were averaged for each time-frequency pixel. Mean spectrogram results were then normalized to a global z-score distribution for across condition comparisons.
Statistical comparison of behavioral data
First, in order to correct for differences in false positive CRs due to non-olfactory aspects of the pulsed and continuous stimulation protocols, we subtracted the responses elicited by the corresponding blank stimuli from the responses to each concentration for each individual moth. Implicit in this correction method is the assumption that non-olfactory induced responses produced a linearly additive effect with odor irrespective of concentration. Results were then analyzed in SAS (SAS Institute Inc., Cary, NC, USA) using the ANOVA procedure. Here, we assessed the main effects of stimulation method, concentration and their two-way interaction.
We sought to assess whether the olfactory system of the moth Manduca sexta has the ability to track an intermittently presented odor stimulus, pulsed at frequencies below, at or above its intrinsic wing beat frequency range. To assess the efficacy of pulse tracking, we recorded responses to either of two stimulus types: a “pulsed” stimulus with odor delivered periodically at a specific frequency or a “continuous” stimulus where odor (or blank) was delivered continuously throughout the stimulation period. We compared the spectral content of responses elicited by the pulsed stimulus to those elicited by the continuous stimulus. By systematically increasing the frequency of the pulsed stimuli we sought to find the frequency at which responses to pulsed stimuli were not significantly different from continuous. In other words, we wanted to identify the frequency that no longer produced significantly more power in the PSD than the continuous stimulus. This effective cutoff frequency provides an upper limit of the pulse tracking ability of the system.
EAG Responses Track Pulses Up to 30 Hz
We first characterized the upper pulse-tracking frequency of the antennal nerve, via EAG responses. Figure 2
Ai represents a typical EAG trace in response to a 3-s long 20-Hz pulse train of undiluted 2-hexanone. The single trace is shown before (cyan) and after application of the band pass filter (blue). Figure 2
Aii displays similar traces from the same antenna in response to a 3-s continuous odor stimulus (cyan: raw; green: filtered). A comparison of the filtered traces shows the presence of a consistent oscillating signal during pulsed stimulus presentation that is absent in the continuous presentation (blue in Figure 2
Ai vs. green in Figure 2
Aii). This difference in responses suggests that the oscillations are a result of pulsing the stimulus and not an intrinsic property of the antenna’s response to odor. The PSD analysis displayed in Figure 2
Bi shows the frequency components of the two filtered traces. The PSD produced by the continuous stimulation (green) does not show any significant peaks. This contrasts with the PSD of the pulsed stimulus (blue), which has a narrow-band peak at 20 Hz, which in this case was the stimulation frequency. Figure 2
Bii shows how the amount of power in a PSD was quantified by integrating the PSD band around the pulsing frequency (+/−2 Hz). The same method was used for continuous stimulus conditions. We used this method to quantify differences in pulse tracking across a range of frequencies for three stimuli conditions: pulsed odor, a pulsed blank cartridge, and a continuous odor stimulus (Figure 2
C, n = 50 repeats per frequency: five trials per animal, 10 animals total; responses based on normalized integrated power values averaged across animals). Pair-wise Welch’s t-tests were used to characterize differences in values within a frequency across different stimulation conditions. The difference between pulsed odor and continuous odor indicates the capacity of the antennal sensory cells to collectively track pulsed stimuli (green carets) whereas differences between the pulsed odor and pulsed blank specifically highlights the relative contribution of olfactory to non-olfactory frequency responses (pink asterisks; p < 0.05 each comparison). Regression lines in Figure 2
C are based on third order polynomials with R2 values of 0.99, 0.96 and 0.95 for the pulsed odor, pulsed blank and continuous stimulus, respectively. These results indicate that the receptors, at least at the level of the antennal nerve response, can entrain to a pulsed stimulus that persists up to 30 Hz (Figure 2
C green carets). However comparison of pulsed odor versus a pulsed blank suggests that odor-specific pulse-tracking persists up to at least 25 Hz (Figure 2
C pink asterisks). The trends for both the pulsed blank and pulsed odorant indicate that the efficacy of pulse tracking as a function of stimulation frequency drops systematically as frequency is increased. These results indicate that olfactory receptor neurons can accurately reflect a periodic stimulus through the majority of this species’ wing beat frequency range.
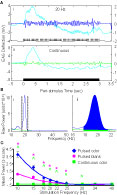
Figure 2. Electroantennogram responses to pulsed odor. (A) Antennal nerve responses to periodic (i) versus continuous (ii) olfactory input. Stimulus representations are shown at the bottom of each panel. Unfiltered EAG voltage trace (cyan; left Y-axis) shows a slow wave response to both 20 Hz and continuous stimuli. High pass filtering (5 Hz) unmasks superimposed oscillations in the response to the pulsed, but not the continuous stimulus (blue/green; right Y-axis). (B) Power spectral density of pulsed (blue) and continuous (green) voltage traces show 20-Hz oscillations in the response to the pulsed stimulus. Dotted lines (i) highlight a 4-Hz region around the pulse stimulus frequency. (ii) This 4-Hz band around the input frequency was integrated to obtain total power value for both pulsed and continuous responses. Note that the pulsed area includes the continuous area as well. (C) Mean integrated EAG power as a function of frequency for pulsed odor (blue diamonds), pulsed blank (pink circles), and continuous odor stimulation (green squares). 3rd order trend lines are shown in the respective colors. Results are based on z-score normalized integrated power and error bars indicate SEM. At each frequency, significant differences between periodic responses of pulsed odor and pulsed blank are indicated by a pink asterisk; significant differences between pulsed odor and continuous odor responses are indicated by a green caret (both: t-test; p < 0.05).
LFPs Entrain to Oscillating Input Up to 72 Hz
Having established that the antenna has the capacity to track a periodic olfactory stimulus delivered at species-typical wing beat frequencies, we next investigated whether the antennal lobe (AL), the first point of synaptic interaction in the olfactory pathway, could also track stimuli pulsed at the tested frequencies. We recorded AL local field potentials (LFPs) and neural units in intact animals using multichannel electrode arrays while stimulating the antenna with odors.
Figure 3
summarizes results for the analysis of LFPs. Figure 3
Ai displays a single unfiltered (cyan) AL LFP response to undiluted 2-hexanone pulsed for 3-s at 20 Hz. Inset in this figure is the same response trace after filtering (5–80 Hz band pass + 60 Hz notch; blue). The filtered trace shows regular oscillations of the LFP signal, which are indicative of a tracking response. Note that there is one LFP cycle for each odor pulse in the pulse train. By comparison, Figure 3
Aii displays the intrinsic oscillatory response to a 3-s long continuous odor stimulus from the same animal (cyan: unfiltered; green: filtered). Continuous odor presentation also drives an LFP oscillatory response, but there is a lack of regularity in the oscillations of the filtered trace relative to when the odor is pulsed. To quantify this relative difference across all experimental animals, Figure 3
B displays the mean normalized integrated power as a function of frequency and stimulation protocol using the same methods described for Experiment 1. Also shown is a summary of the statistical comparison of integrated power by stimulus protocol within each frequency. As before, we compared responses of a single pulsed odor (2-hexanone) to both a pulsed blank and a continuous odor stimulus (n = 48 total: 3 repeats each per animal, 4 animals, 4 LFPs per animal). Means were computed by first normalizing integrated values within an LFP response and then computing means by frequency across all LFPs. Regression lines are based on third order polynomials with R2 values of 0.92, 0.93 and 0.71 for the pulsed odor, pulsed blank and continuous stimulus respectively. As with the EAGs, oscillatory responses to pulsed odor were significantly larger than responses to continuous odor; this effect persisted up to 34 Hz (Figure 3
B green carets, p < 0.05). Additionally, pulsed odor presentation generated significantly higher power than a pulsed blank, except at 15, 18 and 30 Hz (Figure 3
B pink asterisks, p < 0.05). However, it is worth noting that in these three exceptions, there was a trend towards more power in the presence of odorant. These results establish that AL LFPs entrain to the stimulus when presented at frequencies at and around the wing beat; this is particularly true of odor-driven responses.
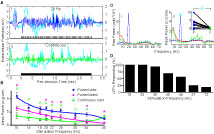
Figure 3. Antennal lobe LFPs reflect periodic input. (A) Unfiltered LFPs traces (cyan) in response to a 20 Hz pulsed (i) or continuous (ii) stimulus. A stimulus representation is shown at the bottom of each panel. As with EAG responses, a pulsed input induces a periodic response that is unmasked by filtering (i, blue), which is not present when a continuous stimulus is used (ii, green). (B) Mean LFP power as a function of pulse frequency for pulsed odor (2-hexanone; blue), a pulsed blank (pink) and a continuous odor stimulus (green). Error bars indicate SEM. Significant differences between the pulsed odor and the blank or the continuous stimulus are denoted by an asterisk or caret, respectively (t-test; p < 0.05). (C) Raw (i) and z-score (ii) PSDs from a single LFP, averaged over all odor presentations of a single frequency (20 Hz) for pulsed (blue), continuous (green) stimulation, and spontaneous (red) activity. The cyan asterisk in (ii) indicates a peak in the PSD, which is significantly higher than the corresponding value elicited by continuous stimulation (p < 0.05). This PSD peak of the neural response is located at the same frequency that was used for pulsing the odor. Error bars indicate SEM and are shown in 3 Hz intervals. Inset in (ii) compares the normalized PSD values for all trials at the stimulation frequency of 20 Hz in response to pulsed (blue diamonds) or continuous (green squares) odor presentation. Lines connect stimulations of identical odors. X-axis indicates pulsed (P) or continuous (C). Asterisk is same asterisk in main figure. (D) Percentage of LFPs (16 total, 4 animals) that respond significantly to pulsing (p < 0.05) by stimulus frequency using the criteria shown in (C). The drop in number responding at 57 Hz may partially be due to the roll-off of the 60 Hz notch filter.
The above analysis indicates that pulsed odor stimulation elicits a significant increase in spectral power within a narrow band surrounding the pulsing frequency, an effect which may persist up to at least 34 Hz and perhaps beyond. However, these experiments could not assess the odor-dependent nature of pulse tracking because we used a single odor. Furthermore, we could not determine the upper boundary of pulse-tracking ability in the LFP because they clearly tracked pulses even at the highest frequency used (40 Hz) relative to a pulsed blank.
To address these limitations, we repeated these experiments using a wider frequency range and a broader panel of odorants (Tables 1
A/B) in a different set of animals (n = 4). We also implemented a different method for identification of pulse tracking in individual LFPs (Figure 3
C). In this case, for each LFP recording site, we averaged the PSD results for a given pulse frequency across all odors. We then tested whether the mean power by frequency due to pulsing was significantly higher as compared to the continuous stimuli (Welch’s t-test, p < 0.05). The blue lines shown in Figures 3
Ci,Cii reflect the mean raw (i) and normalized (ii) PSD profiles for one recording site for all presentations of odor at 20 Hz (n = 11 stimuli). Also shown are the raw and normalized PSD profiles for continuous (n = 11 stimuli, green) and spontaneous (n = 80 stimuli, red) activity. In this case, at the pulsing frequency, the mean normalized power produced by pulsing odor was significantly higher than power generated by the continuous stimuli or power generated by spontaneous activity (p < 0.05). Individual comparisons for a given odor (example inset in Figure 3
Cii) indicate that this significant effect was evident in most pair-wise comparisons. Results of this analysis were tabulated for each pulsing frequency and are summarized in Figure 3
D as the percentage of LFPs displaying a significant increase in oscillatory activity at the pulsing frequency relative to a continuous stimulus (n = 16 LFP recordings, 4 animals). All the LFPs showed significant oscillatory activity at the pulsing frequencies up to 20 Hz, 94% of the LFPs showed significant oscillatory activity at 30 Hz. Surprisingly, approximately 20% of the LFPs were entrained to odor pulsed up to 72 Hz.
Single Units Entrain to Pulsed Stimuli Up to 30 Hz
Given the well-established relationship between LFP oscillations and spiking behavior of principal cells in primary olfactory networks across a diversity of species (e.g. Gelperin and Tank, 1990
; Wehr and Laurent, 1996
; Kashiwadani et al., 1999
), it stands to reason that spiking behavior of single units from the corresponding multiunit recordings may also entrain to or “track” pulsed odorants. Figure 4
summarizes the results from the 34 units from 4 animals. Figure 4
A shows an exemplar peri-stimulus time raster plot from a single unit in response to 10, 1-s long, 20 Hz pulse trains for each of the 10 odorants (listed in Tables 1
A/B) plus 10 responses to a blank (i.e. 110 total pulse trains). Inset below is a normalized histogram of the summed activity during these responses. In both the raster and the histogram there is a well-defined oscillating response component that tracks the 20-Hz pulse train. Close inspection of the responses to individual odorants and the blank reveals that this unit displayed bursting behavior in response to each discrete pulse of odorant. In some cases however, the unit did not respond to all pulses in the train. Additionally, this unit responded to the blank to a limited degree with modest pulse tracking suggesting a non-olfactory component to the response; this is not surprising due to the fact that non-olfactory responses to pulsed stimuli were observed in both EAG and LFP responses.
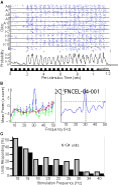
Figure 4. Single units are entrained by pulsed odor stimulation. (A) Peri-event raster (top) and histogram (bottom) of a single unit in response to 1-s long 20-Hz pulse trains. Each hashmark represents a single action potential. Black horizontal lines demark 10 repetitions each for a given odorant or a blank (listed on the y-axis; A = alcohol, K = ketone, and the associated number represents the number of carbon units on the side chain). Peri-stimulus histogram (bottom) is binned at 0.005 s. Y-axis indicates spike probability and X-axis indicates time in seconds and pulse timing (inset below). Data past 1.2 s post-stimulus are not shown because this unit was completely quiescent for ∼0.5 s after the response ended. (B) Methods for identification of pulse-tracking behavior of individual units. (i) Statistical method based on the comparison of mean PSDs in response to a pulsed (3 s at 30Hz; blue) or continuous (3 s; green) stimulus and for spontaneous activity (3 s; red). Error bars indicate SEM and are shown every 3 Hz. (ii). Highest peak criterion for identification of pulse-tracking units based on relative height of PSD peak around stimulus pulse frequency. Dotted lines +/−0.5 Hz around 30 Hz input frequency mark the frequency criterion for the peak. Dashed line marks the highest PSD value that is not at the pulsing frequency. Y-axis shown on left is the same for i and ii. (C) The percentage of responding units (34 total, 4 animals) by frequency. Grey bars indicate count using highest peak criteria (cf. 4Bii) and black bars indicate count using statistical criteria (cf. 4Bi).
Statistical analysis of PSD results, as described in Figure 3
C, were again implemented for unitary data an example of a mean PSD for one unit is displayed in Figure 4
Bi. Normalized PSD results were based on 3-s samples for pulsed and continuous responses as well as 3-s samples of spontaneous activity (n = 10 repeats pulsed and continuous; stimulation using Table 1
A odors; n = 80 repeats for spontaneous analyses). In the example shown, there was a well-defined spike in mean power at the precise pulse frequency of 30 Hz. Nevertheless, by statistical standards, this was not a significant increase in power at 30 Hz relative to a continuous stimulus. However, the relationship between statistical significance and biological significance is unclear. Therefore we developed and implemented a “highest PSD peak” criterion, which scores a unit as responding at a pulse frequency if the highest peak in the mean normalized PSD profile was the pulsing frequency (+/−0.5 Hz, maximum frequency = 45 Hz). As described in Figure 4
Bii, using the highest peak PSD criterion identifies this unit as pulse tracking at 30 Hz. Figure 4
C represents a tabulation of the percentage of units that tracked pulses using both the statistical (black bars) and the highest peak (gray bars) criteria. Both methods identify a relatively large percentage (35–40%) of the recorded units which entrained to pulse frequencies of 15 Hz and below. Between 15 and 25% of the units continued to track pulses up to 22 Hz. Finally, if we consider the highest PSD peak criterion, approximately 25% of recorded units persist in responding to pulsed stimuli up to 30 Hz then drop out by 34 Hz. To the best of our knowledge, we show for the first time that a substantial subset of neurons in a primary olfactory network can track pulsed odor stimuli up to 30 Hz. Based on these results we attempted to characterize the cell types within the AL which tracked pulsed stimuli at this frequency range using intracellular methods. Two PNs and one LN of 15 intracellularly recorded neurons tracked odors up to 15 Hz (Supplementary Materials).
GABAA Signaling is Necessary for Normal Pulse Tracking
GABAA signaling by local interneurons has been shown to play an integral role in the precise timing of action potentials in the Manduca AL (Christensen et al., 1998
) as well as generally being essential for the generation of normal LFP oscillations in olfactory systems (Wehr and Laurent, 1999
). We explored the contribution of GABAA signaling in maintaining pulse tracking within the AL using BMI, a selective GABAA antagonist in Manduca (Waldrop et al., 1987
; Christensen et al., 1998
). We reasoned that if pulse tracking in the AL were strictly the result of feed forward input from the antennal nerve to projection neurons (PNs), without input from local interneurons, we would expect that GABAA blockade should have little effect on pulse tracking in both LFPs and single units.
In a subset of experiments (n = 4 animals), after completing the stimulation protocols, we began superfusion with physiological saline from the same stock supply but with BMI (200 µM) added. Figure 5
A displays a mean time frequency-response spectrogram before (i) and during BMI application (ii) from a single animal. In this case, when 20-Hz pulse trains were presented to the antenna, a corresponding 20-Hz peak in the spectral response emerged in the AL LFP and persisted for the duration of the pulse train. During BMI application, however, we observed that the majority of the 20-Hz oscillatory power was abolished. Figure 5
B displays a comparison of the mean integrated oscillatory power in the LFP prior to (grey bars) and during BMI application (white bars) as in Figure 3
B. Here we show that pulse-driven oscillatory activity in the AL was significantly diminished at all pulsing frequencies used in this study (t-test, p < 0.05). Figure 5
C shows the response of a single unit before (i) and during BMI application (ii) using the same stimulus as in Figure 5
A with a series of five ketones with increasing carbon-chain-length. During normal conditions this unit (same animal; different tetrode from unit in Figure 4
A) pulse tracks well to K7 and K8, intermediate to K9, but not to K6 and K10. Thus, pulse tracking is odor-specific for this unit as was qualitatively the case for most of the pulse tracking units in this study. During BMI application, this unit stopped tracking pulsed odors. Applying the same statistical and highest PSD peak criterion as in Figure 4
C to unitary data both before and during BMI application, we observed that no cell tracked pulses beyond 10 Hz during BMI application using the highest peak criterion and none tracked at any frequency using the statistical criterion (Figure 5
D). As mentioned in Materials and Methods, a “wash” condition was ineffective and hence not shown. Our attempt to wash BMI was not successful in the whole-moth preparation because the saline/BMI-perfusate mixes with the hemolymph. In this dataset we did not observe the same magnitude of unitary pulse-tracking responses as in our initial study (see Figure 4
C). Nevertheless, relative to pre-BMI conditions, these results indicate that pulse tracking as observed in LFP and unitary activity is clearly GABAA-dependent, implying that the local network maintains the stimulus-driven oscillation.
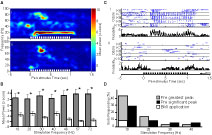
Figure 5. The specific GABAA antagonist BMI affects LFP and single unit responses to pulsed stimuli. (A) Spectrogram of LFP before (i) and during (ii) BMI bath application (200 µM) in response to a 1 s 20 Hz pulse train with 1-hexanol. Average values are based on 10 (i) and 5 (ii) repetitions from the same animal. Color bar on right and x-axis indicates values for both graphs. The strong power band around 20 Hz (i) is completely abolished by BMI (ii). (B) Mean integrated LFP power pre- (dark grey bars) and post- (white bars) BMI application. Stimulation frequencies are indicated on the x-axis. Results based on z-score normalization performed within each stimulation frequency and each animal. Asterisks indicate statistically significant differences in power for comparisons of pre- versus post-BMI application (t-test, p < 0.05). Note values for pre-BMI are significantly larger than post-BMI at all frequencies. (C) Raster and histogram for a single unit in response to five 1-s long 20-Hz pulse trains using 6–10 carbon ketones before (i) and during (ii) BMI bath application. Histogram binned at 0.005 s. (D) Percentage of single units responding to pulsed odor presentations before and after BMI superfusion (35 total units, 3 animals) based on the statistical (black) and highest peak criterion (grey). For both conditions, white bars indicate the respective percentage of units that continued to pulse track during BMI application.
Pulsing Odor Enhances Olfactory Acuity
Given that the AL can track a pulsed odor stimulus, we next asked if a periodic stimulus has an effect on olfactory function as measured behaviorally. Specifically, we asked whether pulsing odor enhances measures of odor detection relative to a continuous odor stimulus (Daly et al., 2007
). Groups of moths were trained to respond to an odor and then tested on subsequent days for the presence of a CR using both pulsed and continuous test stimuli; a schematic is shown in Figure 6
A. Moths were tested across a series of log step increases in odor concentration. Figure 6
B displays the mean response to odor as a function of concentration for both continuous (circles) and pulsed (square) stimulation after correcting for differences in responses to a pulsed or continuous blank. Analysis of variance indicated that the mean response to the CS as a function of stimulus concentration was significant. Thus, as stimulus concentration increased, moths responded more (p < 0.05). Moreover, ANOVA also indicated that when odor was pulsed versus presented continuously moths were significantly more likely to respond (p < 0.001). There was no statistical interaction between stimulus presentation method and concentration (p > 0.05). This pattern of results indicates that there is a main effect shift to increased sensitivity to odor stimulation when the odorant was pulsed. These findings suggest that pulsing odorant improves detection of that odor relative to a continuous stimulus.
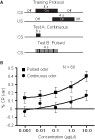
Figure 6. Pulsing odor lowers detection thresholds. (A) Schematic of training and testing protocols for assessing detection thresholds. Animals were trained to respond to an odor presented continuously for 4-s using sucrose as a US. Acquisition of the CR was assessed using both test stimuli: either A on the first and B on the second day or vice versa. Test A was a 0.8-s continuous odor stimulus and Test B a 4-s stimulus pulsed at 20 Hz with a 10:40 ms on:off duty cycle. Stimulus durations and duty cycles adjusted so that the total odor delivered for Test A was identical to Test B. (B) Mean conditioned response as a function of concentration of pulsed stimulation (squares) or continuous stimulation (circles). Error bars indicate standard error. Responses elicited by pulsed or continuous blank stimuli were subtracted from response measures for each concentration. Therefore, the percent response for the lowest concentration for the continuous stimulus is below 0.
Previous biomechanical studies showed that insect wing beating periodically pulls air through the antennal sensillar array (Loudon and Koehl, 2000
), supposedly increasing odorant-receptor interactions (Koehl et al., 2001
). In the moth Manduca sexta, the wing beat generates an oscillating change in airflow velocity around the antennae by approximately 15 cm/s during tethered flight (Sane and Jacobson, 2006
). We therefore asked whether a stimulus, presented in a periodic fashion like that produced by wing beat, affects olfactory responses in this insect’s antennae and AL. Guided by the results of Sane and Jacobson (2006)
, we used a stimulus pulsing regime that approximated the natural frequency of the wing beat. Using EAG measures, we showed that antennal responses entrained to these oscillating stimuli. Furthermore, when odor was present, it resulted in a larger oscillatory response (relative to a blank) and this trend persisted through, but not beyond, the wing beat frequency range (18–28 Hz). Antennal responses to pulsed odor in this study are therefore consistent with previous findings in other moth species (Barrozo and Kaissling, 2002
; Bau et al., 2002
, 2005
). However, our finding that pulse tracking also occurs in response to a blank is not consistent with these studies. This inconsistency could be due to species differences (cf. Bau et al., 2002
) or possibly to differences in the odor delivery systems that were used.
To the best of our knowledge, we provide the first evidence that a periodic input is tracked by primary olfactory networks at frequencies consistent with an insect’s wing beat, whereas prior studies have only looked at maximum frequencies of 8–15 Hz (Christensen and Hildebrand, 1997
; Christensen et al., 1998
; Lei and Hansson, 1999
; Geffen et al., 2009
). We note that some pulse tracking in LFP oscillations and unitary spiking also occurred in response to the blank stimulus, despite the fact that the air was carefully filtered in all experiments. Nevertheless, in the presence of an odorant, LFPs responded with significantly larger amplitude oscillations, as evidenced by increased power in the PSD. LFPs also tracked pulsed odors well beyond the wing beat frequency (in some cases up to 72 Hz); additionally, between 15–25% of all single units tracked pulses up to 20 Hz, between 7–25% tracked up to 30 Hz and some units even showed evidence of tracking up to 40 Hz (less than 5%). The result that AL LFPs entrain to the 72-Hz stimulus implies that a population of olfactory receptor neurons was able to track pulsed odor at these frequencies, even though our EAG measurements indicated a ceiling of 30 Hz for odorant-receptor responses. It remains unclear whether the EAG pulse-tracking responses were achieved through individual neurons collectively responding to pulse after pulse or whether ensembles of olfactory receptor neurons cooperate to collectively track. Indeed, the EAG is relatively a crude measure and cannot resolve different receptors or receptor populations. Thus, it will be important to characterize the temporal responses properties of individual olfactory receptor neurons with single sensillum recordings (Shields and Hildebrand, 2000
).
The observation that a blank stimulus elicits periodic responses in the EAG suggests a non-olfactory, possibly mechano-sensory, contribution to the response. These non-olfactory responses could arise from several possible sources including mechano-sensory and gustatory hairs found on both the dorsal (Lee and Strausfeld, 1990
) and trailing edge (Lee and Strausfeld, 1990
; Stengl et al., 1990
) of the antennal flagellum, as well as from presumed mechanoreceptive scales on the trailing edge of the flagellum (Stengl et al., 1990
). Non-olfactory or multimodal responses from AL PNs have been observed in other insects (Boeckh et al., 1984
; Anton and Hansson, 1994
) in addition to M. sexta (Staudacher et al., 2009
). Non-olfactory responses have also been observed in the mammalian olfactory epithelium (Walsh, 1956
; Macrides and Chorover, 1972
). There is currently no evidence indicating that mechanoreceptor neurons ramify in the glomeruli of the AL in insects. However, a small number of descending inputs from higher brain centers are known in Manduca, so it is possible that information about mechano-sensory stimuli may be carried back to the AL via these neurons (Homberg et al., 1988
). In either case, our data suggests (see Figures 2 and 3
) that the AL must operate within the context of a noisy background.
Odor Plume Tracking as a Two Component Process
There is an emerging body of evidence suggesting that the tracking of odor to its point of origin is composed of two behavioral components: counterturning behaviors, which move the organism laterally through the odor plume, and sniffing or sniff-like behaviors, which are superimposed on counterturning and may serve to periodically sample odor at discrete points in space and time (Porter et al., 2007
). Both behavioral processes result in an intermittent interaction of the olfactory epithelium with the odor plume. Insects, from beetles (Fadamiro et al., 1998
) to flies (David 1979
; Willemse and Takken, 1994
) to moths (e.g. Kennedy and Marsh, 1974
; Willis and Baker, 1984
) exhibit a specifically patterned set of odor-guided behaviors commonly referred to as “casting” (reversing anemotaxis) and “zigzagging” (positive optomotor anemotaxis). Casting and zigzagging behaviors appear to be necessary for plume tracking to an odor source, and because they cause intermittent sampling of the olfactory environment have been classically considered synonymous with mammalian sniffing (Willis and Baker, 1984
). Mammals also exhibit counterturning behaviors as they walk or move their head back and forth across an odor trail (Porter et al., 2007
). Furthermore, mammals periodically sample the olfactory environment through sniffing as they move. Sniffing is actively and dynamically modulated by the animal to aid in olfactory perception. Sniffing in mammals provides an oscillating input from the epithelium to the olfactory bulb (Wesson et al., 2008b
), which effectively synchronizes the active sub-population of output neurons (Kashiwadani et al., 1999
). Our results demonstrate that when we produce periodic stimuli similar to what is produced by the wing beat (Sane and Jacobson, 2006
), olfactory input drives the AL on a periodic timescale. It is known that some moth species flick their antennae in a manner similar to crustaceans; however, Manduca does not (Kevin C. Daly, personal observation). We therefore propose that wing beating affects olfactory responses in a manner analogous to sniffing in mammals. In this case, the periodicity of olfactory input caused by the wing beat would be superimposed on the zigzagging and casting behaviors (Willis and Baker, 1984
). Despite the fact that some have argued that the temporal resolution of insect olfactory systems optimally represent odor information using a slower time scale (Geffen et al., 2009
), the conclusion that moths periodically sample on a wing beat time scale is not surprising. Sniffing-like behavioral analogs have previously been noted across diverse taxa such as snakes (Halpern and Kubie, 1980
), fish (Kux et al., 1988
), crabs, stomatopods and lobsters (Goldman and Koehl, 2001
; Goldman and Patek, 2002
; Mead et al., 2003
). Furthermore, it has also been shown in another moth species that overall upwind progress toward an odor source is optimized when odor was pulsed at 17–25 Hz (Justus et al., 2002
), frequencies consistent with a beating wing.
Pulse Tracking Is GABAA Dependent
We also found that bath application of the competitive GABAA antagonist BMI abolishes pulse-driven oscillatory activity in both LFP and unitary spiking measures. Previously, it has been shown that many of the local interneurons in the AL are GABAergic (Homberg et al., 1987
; Waldrop et al., 1987
; Christensen et al., 1998
). Other studies show that local inhibitory interactions between glomeruli sharpen the temporal resolution of pheromone-driven responses in PNs (Christensen and Hildebrand, 1997
). Thus, it is reasonable to propose that inhibitory local interneurons contribute to the AL’s ability to maintain and pass information about the temporal structure of olfactory stimuli to higher brain centers. This is also consistent with several studies indicating that stimulus-driven oscillatory activity in primary olfactory networks is mediated by reciprocal interactions between GABAergic local interneurons and principal output neurons (Wellis and Kauer, 1993
; Stopfer et al., 1997
; Friedman and Strowbridge, 2003
; Lagier et al., 2004
, 2007
). Our results support the idea that local interactions within the AL mediate the precise synchronization of outputs based on the context of the stimulus input (Christensen et al., 1996
, 1998
Christensen and Hildebrand, 1997
; Vickers et al., 2001
). That is, under normal conditions when a moth moves through space, it intermittently contacts plumes of odor, which wing beating might discretize into a temporal pattern of input; this would result in synchronous oscillatory bursts of AL output which are phase locked to the wing beat.
Physiological data from mammalian models suggest that feedback mechanisms from the respiratory system appear to modulate sniff-driven oscillatory activity in the OB (Ravel et al., 1987
; Ravel and Pager, 1990
; Young and Wilson, 1999
; Fontanini and Bower, 2005
). Isolation of the OB from these centrifugal inputs desynchronizes mitral cell spiking and the respiration cycle (Potter and Chorover, 1976
). Based on our in vivo extracellular results, we expected examples of intracellularly recorded neurons tracking pulsed odor at higher frequencies than what were actually observed. Our results, as well as previous studies of AL interneuron (i.e. LNs and PNs) responses to pulsed odor stimuli, indicate that these cells are only capable of pulse tracking up to 5–15 Hz under these conditions (Christensen et al., 1996
; Lemon and Getz, 1997
; Heinbockel et al., 1999
; see also Supplementary Material) (Christensen et al., 1996
; Lemon and Getz, 1997
; Heinbockel et al., 1999
). However, in the classical reduced preparation, commonly used for intracellular recordings, any potential ascending connections from the central pattern generator that mediates flight are severed. This loss of centripetal input from thoracic ganglia to the AL may affect the AL’s ability to track pulses, and may account for the observed lack of higher frequency pulse tracking in intracellularly recorded neurons. Indeed, a pair of bilateral neurons ascending from the mesothoracic ganglion to the AL and other brain regions has been identified (Homberg, 1994
). Though little is known about these neurons other than their histamine immuno-reactivity, their existence indicates a possible connection between flight pattern generators and odor processing centers. Future studies will therefore need to explore the role of centripetal input in mediating AL pulse-tracking responses within the AL.
Periodic Input Enhances Olfactory Sensitivity
A fundamental question is whether periodic input plays a functional role in sensory perception. To address this we used a psychophysical assay of odor detection. Moths were trained to respond to a novel monomolecular odor and subsequently tested across a dilution series of that odor, which was presented either as a 20 Hz pulse train or as a continuous stream. Consistent with the prediction that odorant-receptor interactions would be enhanced by periodic input, comparison of the concentration response functions for the pulsed and continuous presentations demonstrate that moths are indeed able to detect the odorant at lower concentrations when the odor is pulsed. This also suggests that the physiological mechanisms, which mediate pulse-tracking behavior within the AL, may serve to enhance sensory perception. What remains critically important yet unknown is how these mechanisms achieve enhanced sensitivity at the level of sensory perception. We see at least two possible ways in which pulse tracking might be used by olfactory systems to achieve this.
First, there may be specific information content encoded in individual pulse responses that relates the perception of an odor to a discrete point in space and time. In the current study we show that measures of LFP oscillatory power produce very narrow spectral peaks around the pulse frequency indicating a tight entrainment of the LFP to an oscillating stimulus. It may be speculated that the olfactory system is adapted for input at these frequencies. If so, the current findings bear directly on the interpretation of oscillatory-based models of odor identity encoding (Laurent et al., 1996a
; Wehr and Laurent, 1996
; Stopfer et al., 1997
). For example, the wing beat cycle time (ca. 35–55 ms) could represent the frame rate of the olfactory system, whereby each cycle produces a discretely sampled, processed and perceived olfactory moment. This is consistent with current behavioral and physiological results in mammals, which indicate that odor discrimination can occur within one or two sniffs (Uchida and Mainen, 2003
; Uchida et al., 2006
; Wesson et al., 2008a,b). Both population analytic (Daly et al., 2004b
; Galan et al., 2004
; Brown et al., 2005
; Staudacher et al., 2009
) and behavioral (Ditzen et al., 2003
; Budick and Dickinson, 2006
) results in insects suggest that the time to process odor cues is on the order of ∼250 ms. This does not imply that a 250-ms stimulus is required. Rather, this is the time for transduction, processing and initiation of the behavioral response; successive cycles are likely being processed simultaneously at different points in the pathway. However, given that odor plumes often consist of dispersed small filaments of odor (Murlis et al., 1992
) and that Manduca sexta flies at about ∼0.60–1.0 m/s (personal observation) during odor-guided flight, a single exposure of an odor filament may only last for a single wing beat cycle in many instances.
Alternatively, there is considerable data demonstrating that LFPs in the insect AL intrinsically oscillate in response to an ongoing stimulus presentation (Laurent and Davidowitz, 1994
; Laurent and Naraghi, 1994
; Stopfer et al., 1997
); this has long been known to occur in vertebrates as well (e.g. Adrian, 1942
). It has been proposed that this intrinsic oscillation provides a timing mechanism by which different sub-populations of output neurons from across the primary olfactory network transiently synchronize. On a cycle by cycle basis, this produces a unique spatial activation pattern that evolves across several successive cycles. Olfactory networks might therefore be driven by the periodic effects of the wing beat and resonate at these frequencies. This may serve to enhance the temporal precision of the LFP oscillation (i.e. decrease frequency variability) and thereby enhance the processing of odor in time. Indeed our results show that the intrinsic oscillations driven by a continuous stimulus are relatively smaller and more broadband that those driven by a periodic stimulus and this clearly influences spike burst timing. Nevertheless, it remains to be seen precisely how consistent the wing beat frequency is during naturalistic flight. However, as argued above, plume structure and flight speed may limit the number of cycles per exposure, particularly in filamentous plumes; thus, integrating samples may not actually be possible on a consistent basis in order to enhance representation (cf. Vickers and Baker, 1992). In either case, it is clear that the subtleties of how the olfactory system interacts with odor in the real world directly and profoundly affects processing and output from the AL.
The authors declare that the research was conducted in the absence of any commercial or financial relationships that could be construed as a potential conflict of interest.
We thank Drs. Sarah Farris and Nathan Urban for critical review of the manuscript, Drs. Wolf Huetteroth and Joachim Schachtner for the identification of a PN, and Everett Daly for his sketch of the M. sexta head. This research was funded by NIH/NIDCD R03DC05535 and R01DC009417 and NIH/NCRR P20RR015574 to Kevin C. Daly
The Supplementary Material for this article can be found online at http://www.frontiersin.org/cellularneuroscience/paper/10.3389/neuro.03/001.2010/