Department of Morphology and Cell Biology, Oviedo University, Oviedo, Spain
In addition to some other functions, melanopsin-expressing retinal ganglion cells (RGCs) constitute the principal mediators of the circadian photoentrainment, a process by which the suprachiasmatic nucleus (the central clock of mammals), adjusts daily to the external day/night cycle. In the present study these RGCs were immunohistochemically labelled using a specific polyclonal antiserum raised against mouse melanopsin. A daily oscillation in the number of immunostained cells was detected in mice kept under a light / dark (LD) cycle. One hour before the lights were on (i.e., the end of the night period) the highest number of immunopositive cells was detected while the lowest was seen 4 h later (i.e., within the first hours of the light period). This finding suggests that some of the melanopsin-expressing RGCs “turn on” and “off” during the day/night cycle. We have also detected that these daily variations already occur in the early postnatal development, when the rod/cone photoreceptor system is not yet functional. Two main melanopsin-expressing cell subpopulations could be found within the retina: M1 cells showed robust dendritic arborization within the OFF sublamina of the inner plexiform layer (IPL), whilst M2 cells had fine dendritic processes within the ON sublamina of the IPL. These two cell subpopulations also showed different daily oscillations throughout the LD cycle. In order to find out whether or not the melanopsin rhythm was endogenous, other mice were maintained in constant darkness for 6 days. Under these conditions, no defined rhythm was detected, which suggests that the daily oscillation detected either is light-dependent or is gradually lost under constant conditions. This is the first study to analyze immunohistochemically the daily oscillation of the number of melanopsin-expressing cells in the mouse retina.
Circadian rhythms are oscillations with a period of about 24 h. Animals express these rhythms in their behavior and their physiology. The main role of the so-called circadian system is to set the time at which physiological and behavioral events occur with respect to the 24-h period, i.e. the day/night cycle. By anticipating physiological processes, organisms get ready for predictable changes in the environment. The period of the inner clock is not exactly 24 h and, hence, it must be entrained everyday. Twilight transition provides the most reliable indicator of environmental time and mediates this synchronization, a process that has been called photoentrainment. The principal pacemaker in mammals is the hypothalamic suprachiasmatic nucleus (SCN) (Foster and Hankins, 2002
).
The perception of the external day/night cycle, which is perhaps the most important function of the so-called non-image-forming visual system, is mediated by rod/cone photoreceptors and by intrinsically photosensitive retinal ganglion cells (ipRGCs) whose phototransduction is based on the photopigment melanopsin (Berson et al., 2002
; Hattar et al., 2003
). These ipRGCs transmit light information to the SCN through a monosynaptic pathway called the retinohypothalamic tract (RHT), allowing the photoentrainment to the external light-dark cycle (Gooley et al., 2001
; Hankins et al., 2008
; Hannibal et al., 2002
; Hattar et al., 2002
; Panda et al., 2002
). Some other major projections of these cells include the olivary pretectal nucleus, which controls pupil constriction and the intergeniculate leaflet, in which photic and non-photic circadian cues converge (Fu et al., 2005
). Minor innervation from the ipRGCs is also received in brain areas involved in the promotion of sleep (the ventrolateral preoptic nucleus), gaze control (superior colliculus), image-forming vision (dorsal lateral geniculate nucleus), etc. (Fu et al., 2005
). Apart from perceiving light, melanopsin-expressing RGCs are also the principal conduits for rod-cone input to the mentioned responses (Güler et al., 2008
), and in fact, their targeted destruction altered the effects of light on circadian rhythms (Göz et al., 2008
).
The retina itself behaves as a clock, showing circadian oscillations. Which cells contribute to the clock mechanism that drives the inner retinal rhythm, as well as to what extent the ipRGCs are involved in such mechanism, is still unknown. Hannibal et al. (2005) and Sakamoto et al. (2004
, 2005)
demonstrated that melanopsin mRNA shows a daily oscillating pattern, with a peak in the transitional phase from day to night, whilst the minimum was observed at the end of the night. This rhythm appears to be influenced by rod/cone inputs, since melanopsin expression in rats with retinal degeneration, lacking rod and cone photoreceptors, is lower than in controls and also arrhythmic (Sakamoto et al., 2004
). Moreover, the elimination of dopamine in the rat retina provoked an alteration in the expression of melanopsin mRNA (Sakamoto et al., 2005
), which means that dopamine is also involved in this daily oscillation. Under constant darkness pigmented rats (Sakamoto et al., 2005
) showed an attenuated oscillation of melanopsin mRNA expression; however, Hannibal et al. (2005) and Mathes et al. (2007)
showed that this daily rhythm was abolished by exposure to constant conditions.
The melanopsin daily rhythm could be observed in the early postnatal development, when rods and cones are not functional yet (Hannibal et al., 2007
), which means that, at least at this early stage, is independent of the rod/cone input. Also, the ipRGCs were seen to be responsive to light stimulation since postnatal day (P) 0 (Sekaran et al., 2005
; Tu et al., 2005
). Moreover, it has been reported that the SCN begins to respond to stimulation of the retina at P0–1 (Lupi et al., 2006
), or at P4 (Muñoz-Llamosas et al., 2000
) depending on intensity of the light administered, suggesting that functional connections between the retina and the SCN are already established on the day of birth.
Two main different morphological types of melanopsin-expressing RGCs have been previously described: M1 and M2 cells, which show different dendritic arborisation in different sublayers of the inner plexiform layer (IPL). Baver et al. (2008)
demonstrated that these cell subpopulations have different brain projections, and in a recent study by Schmidt and Kofuji (2009)
electrophysiological differences between them were also reported.
In the present work we have analyzed for the first time the daily variation of the number of the mouse melanopsin-expressing ipRGCs and of their main subpopulations, by means of immunohistochemistry, as well as the effects of darkness on such variation.
Animals and Experimental Design
Male pigmented mice C3H/He were used in the present study. Although commercially available C3H/He mice are retinally degenerate (rd/rd), we only studied C3H/He mice with normal retinas, i.e. wild-type at the rd locus (+/+), which were kindly donated by Dr. R. G. Foster (Oxford University, UK).
All the animals were maintained in the central animal care facilities under constant temperature conditions (20 ± 2°C), fed with standard food and tap water ad libitum and maintained under a 12-h light/12-h dark cycle (LD). As we will indicate below, a group of animals were also exposed to continuous darkness (DD). Under LD conditions the illumination source was a white light fluorescent lamp, so that the animals were exposed to an intensity of 200 lux at cage level.
Within the 24-h period two timing systems were considered in the present study: zeitgeber time (ZT), when the rhythms of the animals are synchronised with the external cycle (LD conditions); and circadian time (CT), when the animals show their endogenous rhythms (DD conditions).
In order to study the possible oscillation of melanopsin-expressing cells under the LD cycle or the effects of DD, several groups of mice were analyzed.
LD mice
Mice aged 1–3 months kept under 12-h light/ 12-h dark were used. Animals were killed at ZT3, ZT8, ZT13, ZT18, ZT23 (ZT0 = lights on, ZT12 = lights off, n = 4 animals at each time point). In order to analyze the postnatal development of this daily rhythm pups of P1 and P5 were used. Pups were kept with their mothers under LD conditions until P1 and P5. Two time points were analyzed: ZT3 and ZT23.
DD mice
To study the effects of constant darkness (DD), a group of adult mice were maintained in DD conditions for 6 days and killed at CT3, CT8, CT13, CT18 and CT23 (n = 4 animals at each time point). To calculate the CT of these animals we considered that the period length was 23.5 h, as estimated in previous publications (Hatori et al., 2008
; Rollag et al., 2003
).
Tissue Preparation
In order to minimize pain, animals were anaesthetized prior to sacrifice. Experiments were performed in accordance with the European Communities Council Directive of 24 November 1986 (86/609/EEC). Eyes from decapitated animals were removed and fixed in a 4% paraformaldehyde solution in 0.1 M phosphate buffer (PB), pH 7.4, for 24 h, and then washed in PB for 24 h at 4°C. Then, the cornea and lens were removed and the eyecup was dehydrated through a graded series of ethanol and embedded in paraffin. Only one eyecup per animal was used for the present study. 10 μm–thick sections covering the whole eyecup were obtained from the paraffin blocks with a microtome and then mounted onto slides in six parallel series, of which only one was used. Paraffin sections were collected on gelatine-coated slides, deparaffined in xylene, hydrated in ethanol and placed in phosphate-buffered saline solution (PBS 0.01 M phosphate, 0.15 M NaCl) for 10 min.
For immunohistochemical labelling, endogenous peroxidase activity was blocked by immersion in a solution of 0.3% hydrogen peroxide in PBS at room temperature (RT) for 30 min. Then they were washed twice for 5 min in PBS containing 0.4% Triton-100 (PBS-T) at RT to enhance permeability. Unspecific binding was blocked with normal goat serum (Vector Labs) diluted in PBS for 30 min. at RT. This was followed by incubation with the UF006 anti-mouse melanopsin polyclonal antibody at a dilution 1:5000 at 4°C for 3 days. This antiserum, which was raised in rabbit against the N-terminus peptide of the mouse melanopsin, was generously donated by Dr. Ignacio Provencio (University of Virginia, USA). Immunoreaction was visualized via the avidin–biotin–peroxidase method (Elite ABC kit, Vector Labs), using 0.025% DAB (3-3quotidn diaminobenzidine tetrahydrochloride; Sigma) in 0.003% hydrogen peroxide Tris–HCl (0.05 M, pH 7.5) buffer as chromogen. Finally, the sections were dehydrated in an ethanol series, cleared in eucalyptol, and coverslipped.
Cell Count and Classification
Retinal sections were observed in a bright-field microscope (Nikon Eclipse E400). The somata of melanopsin-immunopositive cells were counted in the whole area of all the retinal sections of the series analyzed (1 out of 6 series per retina were used). Immunopositive cells were classified in M1 or M2 cells attending to the location of their soma and dendritic processes.
Statistical Analysis
The SPSS 15 software was used for all the statistical analyses of the present study. Kolmogorov–Smirnov test was used to confirm the normality of the data. The homogeneity of the variances was assessed with Levene’s test. Student’s t-tests were performed when the groups to be compared were only two. One-way ANOVA tests were used to analyse the total number of melanopsin-immunopositive cells, as well as the numbers of M1 and M2 cell subpopulations, throughout the LD cycle and throughout the DD cycle. Post hoc tests were performed to detect differences between specific time-points. In order to study possible interactions between the variables “cell subpopulation” and “time-point” throughout the LD cycle or the DD cycle, factorial ANOVA tests were performed. The number of melanopsin-expressing cells per retinal sample was presented as mean ± SEM. p < 0.05 was considered statistically significant.
Melanopsin immunostaining could be observed in somata, dendrites and proximal segments of axons. Melanopsin-expressing cells were located throughout the retina and their somata were found either in the ganglion cell layer (GCL) or displaced in the inner nuclear layer (INL). Two dendritic plexuses could be distinguished in the inner plexiform layer (IPL) (Figure 1
): one in the innermost sublamina (ON) and another in the outermost sublamina (OFF).

Figure 1. A representative micrograph of melanopsin immunostained retina of adult mice. Two plexuses can be observed in the IPL, one in the innermost layer (OFF sublayer, asterisks) and the other in the outermost layer (ON sublayer, arrows). Three immunostained cells can be seen: two M1 cells (with dendritic arborization in the OFF sublayer) and one M2 cell (with dendritic arborization in the ON sublayer). GCL, ganglion cell layer; IPL, inner plexiform layer; INL, inner nuclear layer; OPL, outer plexiform layer; ONL, outer nuclear layer. Scale bar: 50 μm.
Two clearly distinguishable cell populations were considered for the present study attending to the different location of their somata and dendritic processes (Figure 1
):
• M1 cells, with robust dendrites arborizing in the outer margin of the IPL (OFF-sublayer). Within this group, most of the cells, which were frequently heavily stained, had their somata located in the GCL. Some other cells had their somata displaced in the amacrine cell sublayer (i.e., the inner margin of the INL). Among the latter, heavily and weakly stained cells could be observed (not shown in the figure).
• M2 cells had their somata located in the GCL and their dendritic processes, which were finer and more numerous that those of M1 cells, were placed in the inner margin of the IPL (ON-sublayer). These cells usually showed weak staining.
Some other cell populations (not shown) were only occasionally seen and, hence, were not considered for our analysis: a few immunostained cells had their somata located in the amacrine cell layer and their processes in the inner margin of the IPL (ON sublayer) and some other cells seemed to arborize in both the inner and outer plexuses of the IPL.
Number of Melanopsin-Immunostained Cells through the LD Cycle
Under LD conditions an oscillation in the total number of cells that expressed melanopsin was detected in adult mice retinas (Figure 2
). The highest number of immunopositive cells was found 1 h before lights were on (ZT23), while the lowest was seen 4 h later (ZT3) (p < 0.001). Then, a small increase of the number of immunopositive cells, which is maintained during the late day and the early night, was observed (not significative). The increase of melanopsin-expressing cells was found at the late night (p < 0.05).
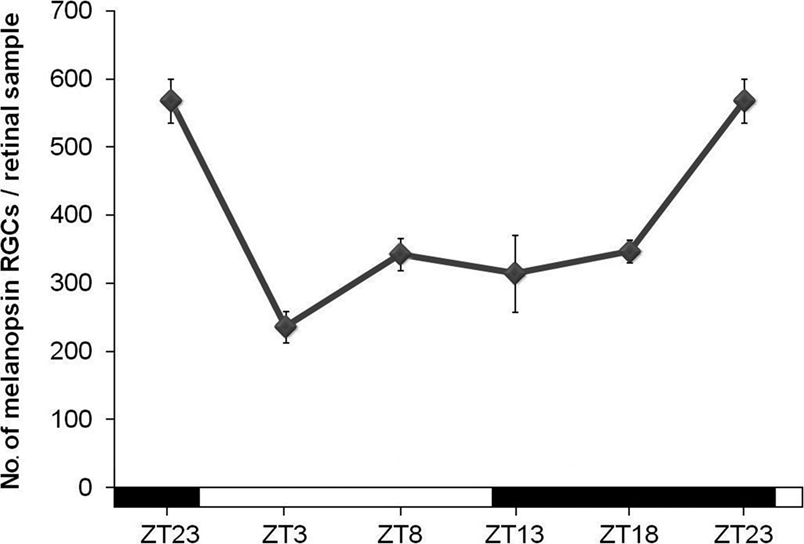
Figure 2. Number of immunopositive cells throughout the 12 h L/12 h D cycle. The ANOVA test revealed a daily significant oscillation (p < 0.001). Post hoc tests detected a significant decrease at the beginning of the light period (p < 0.001) and an increase at the end of the night (p < 0.05). (n = 4 at each time-point).
In order to find out whether such differences between ZT23 and ZT3 were also present at the early postnatal stages, the retinas of newborn mice of P1 and P5 were also analyzed. In this case, a significant increase between ZT23 and ZT3 was found at P5 (p < 0.01). Such increase was not so marked as in adults. At P1 no statistical difference was detected between these time-points (Figure 3
).
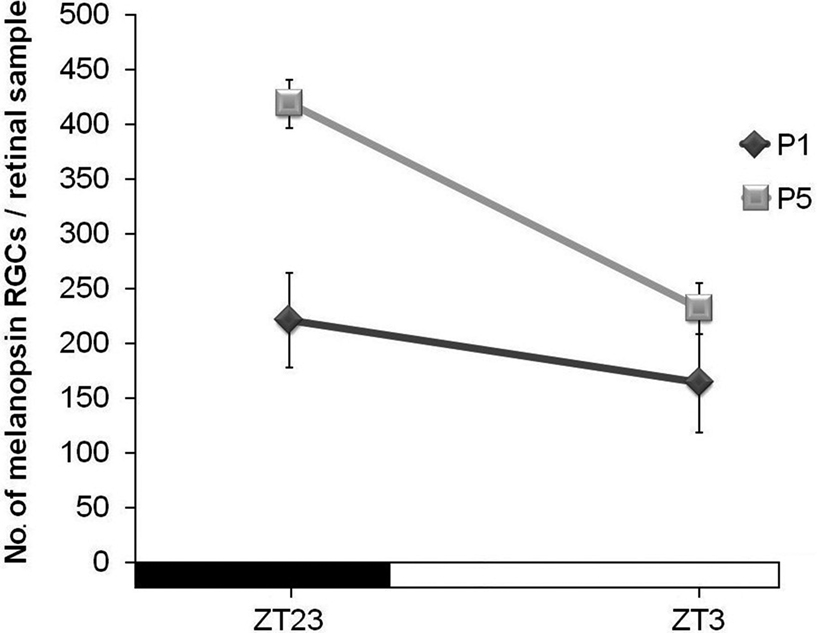
Figure 3. Number of immunostained cells at ZT23 and ZT3 in the early postnatal development (mice were maintained under an LD cycle). Significant differences could be detected at P5 (p < 0.01), but not at P1. (n = 4 per group at both time-points).
When M1 and M2 cells were counted separately under LD conditions, factorial ANOVA revealed an interaction between “cell subpopulation” and “time-point” (p < 0.001), which indicates that variations of both cell subpopulations were significantly different. One-way ANOVA tests for each subpopulation revealed that both of them had different oscillations throughout the period analyzed (M1 cells, p < 0.001; M2 cells, p < 0.01). In fact, as can be seen in Figure 4
, the M1 cell oscillation is more pronounced than that of M2 cells, in which just a significant difference was found between ZT18 and ZT23 (p < 0.05). Also, the ratio between these two cell types changed at some time-points: at ZT3 M2 cells were more abundant than M1 (p < 0.001), and at ZT18, vice versa (p < 0.01), as revealed by Student’s t-tests performed to compare both cell subpopulations in parallel at the same time points. The maxima were observed at ZT23 and, after the onset of the light period (ZT3), the decrease of M1 cells was stronger than that of M2 cells (Figure 4
).
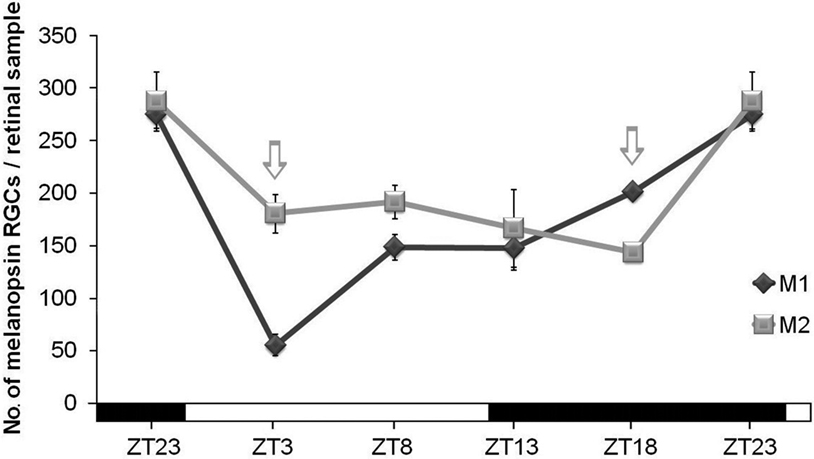
Figure 4. M1 and M2 cell subpopulations counts under LD conditions. One-way ANOVA tests revealed significant oscillation during the LD cycle for M1 cells (p < 0.001) and for M2 cells (p < 0.01). M1 cells showed a sharp decrease (p < 0.001) at the onset of the light period and then an increase between ZT3 and ZT8 (p < 0.01). For M2 cells, a significant difference was only detected between ZT18 and ZT23 (p < 0.05). Arrows indicate the two time-points in which the numbers of both cell subpopulations were significantly different (p < 0.001 at ZT3 and p < 0.01 at ZT18). (n = 4 per group at all the time-points analyzed).
We also analyzed whether M1 and M2 cells presented a similar oscillation between ZT23 and ZT3 at P5. Student’s t-tests revealed that while M2 cells showed no fluctuation between these time-points at this early postnatal age, M1 cells did show a fluctuation (p < 0.001), which was parallel to that found in adults (Figure 5
).
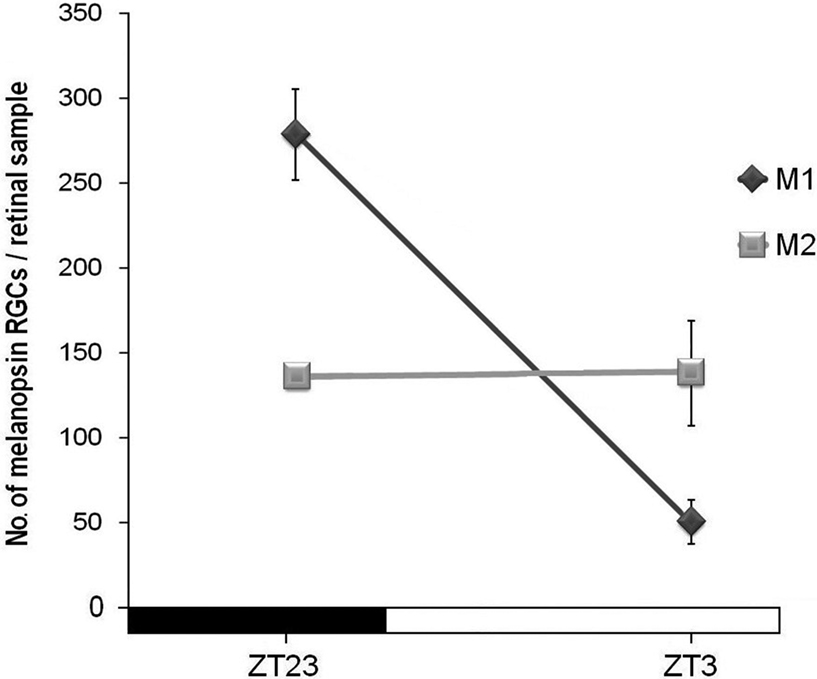
Figure 5. Number of M1 and M2 melanopsin cells of P5 mice at ZT23 and ZT3. Only M1 cells showed significant difference between these time-points (p < 0.001). (n = 4 per group at both time-points).
Number of Melanopsin-Immunostained Cells in DD Conditions
With the aim to study whether or not the melanopsin oscillation was endogenous, animals were maintained in DD for 6 days. Under DD, differences between the highest and the lowest numbers disappeared (p > 0.05) and no rhythm could be detected (Figure 6
).
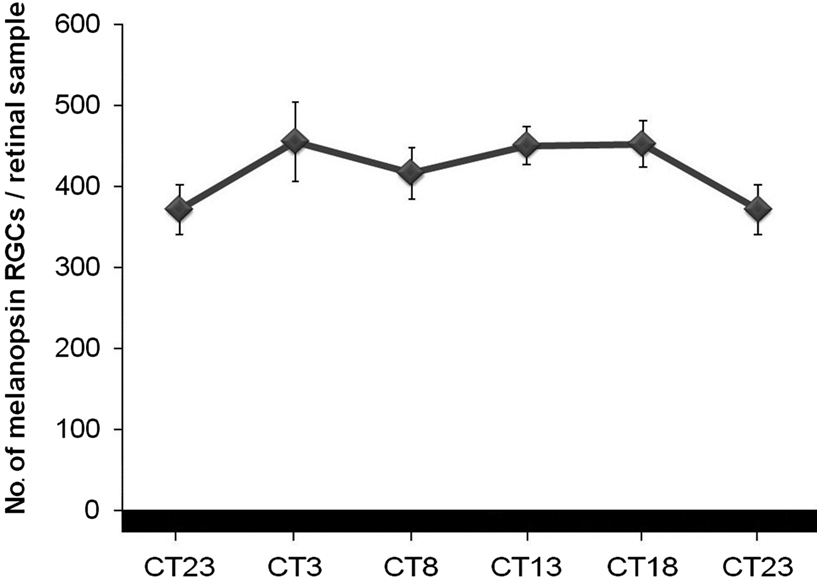
Figure 6. No rhythm was detected in the number of melanopsin cells in DD conditions (ANOVA test: p > 0.05). (n = 4 at each time-point).
When analyzed separately under these DD conditions, the ratio between both cell subtypes changed with regard to those in LD conditions: M1 cells maintained a higher number than M2 cells at all the time-points studied (Figure 7
). Factorial ANOVA test did not reveal interaction between “cell subpopulation” and “time-point”, which means that both cell populations behave similarly throughout the period analyzed. One-way ANOVA tests and post hoc tests for each cell subpopulation revealed that M1 cells maintained rather constant values throughout the period, but curiously M2 cells did show a daily oscillation (p < 0.01), with a small but significant diminution at the end of the subjective night between CT18 and CT23 (p < 0.05).
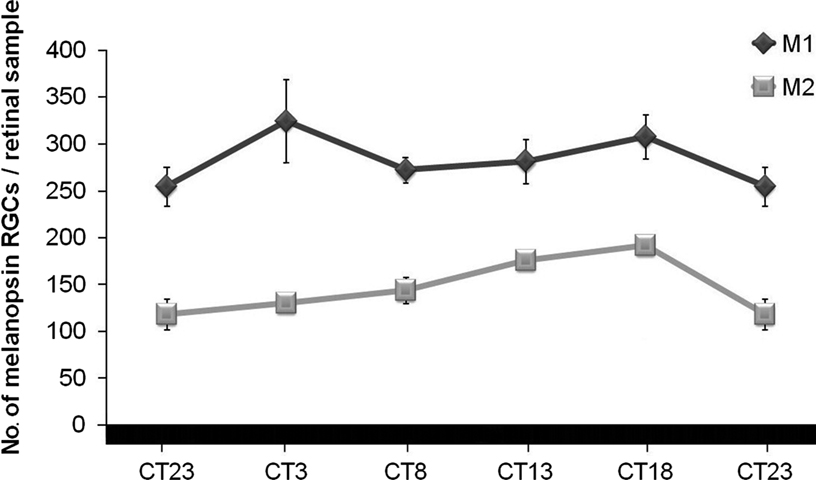
Figure 7. Numbers of M1 and M2 cells under DD conditions. While M1 cells maintained rather constant values, significant oscillation was observed for M2 cells (one-way ANOVA test: p < 0.01). A decrease in the number of M2 cells at the end of the subjective night (p < 0.05) was detected by a post hoc test. (n = 4 per group at each time-point).
In addition to environmental cyclic fluctuations, rhythms are present in organisms, organs and cells. Some of these oscillations even persist in absence of external cues and constitute a way by which the organisms are prepared to predictable variations of the environment. These autonomous oscillators are considered biological clocks. Other organs and cells oscillate because they are governed by primary autonomous oscillators or simply as a response to environmental fluctuations. The retinal circadian clock was the first extra-SCN oscillator to be discovered in mammals (Tosini and Menaker, 1996
). The endogenous oscillators of the retina are supposed to constitute an organized network to control many of the physiological, cellular and molecular rhythms that are present within this organ (Tosini et al., 2008
). The nature of the cells that constitute such network has not been yet completely established. As an example, cone/rod photoreceptors, which release melatonin that peaks at night, and a subpopulation of amacrine/interplexiform cells that produce dopamine peaking at day, are known to form an intercellular feedback loop that regulate circadian retinal physiology (Green and Besharse, 2004
). The C3H/He mice used in the present study, unlike some other mouse strains, have robust retinal melatonin rhythms that persist even after several days under continuous darkness (Tosini and Menaker, 1998
), indicating that the retinal clock is fully operative and, therefore, this murine strain constitutes an appropriate model to study oscillations within the retina.
Since they were discovered a decade ago, melanopsin-expressing cells have continuously been subject of thorough study. Together with the cone/rod photoreceptors, these photosensitive neurons contribute to circadian photoentrainment, but also have other remarkable roles (Fu et al., 2005
; Göz et al., 2008
; Hattar et al., 2003
), including the modulation of some classical image-forming visual pathways. Barnard et al. (2006)
demonstrated that the differences between the electroretinographic responses of the cone cell pathway at midday and at midnight are related to the presence of melanopsin-expressing RGCs. This suggests that these cells are somehow involved in the fluctuations occurring within the retina. Daily oscillations of both the melanopsin mRNA and the melanopsin protein have been previously reported in the rat (Hannibal et al., 2005
; Sakamoto et al., 2004
). In these studies, the total content of mRNA and the total amount of protein, by means of RT-PCR and Western-blot analyses, respectively, were measured. However, to date no previous studies had been done with regard to the possible variation in number of melanopsin-expressing cells through the 24-h cycle. The results presented in this paper clearly demonstrate that this number does oscillate throughout the day/night cycle, with a maximum at the end of the dark period (ZT23) and a minimum within the first hours of the light period (ZT3). A remarkable conclusion can be immediately extracted from this finding: at least some ipRGCs turn on and off during the LD cycle. When we analyzed these two time points (ZT3 and ZT23) at P1 and P5, i.e. the early postnatal stage when the rod/cone photoreceptors are not yet functional, we only could detect significant difference between them at P5, which suggests that the melanopsin system gradually develops within the early postnatal period. In the previous studies mentioned (Hannibal et al., 2005
; Sakamoto et al., 2004
) the maximum levels of melanopsin mRNA and protein in the rat occur at the transition from day to night, which is difficult to fit with our results in the mouse, in which the peak occurs in the transition from night to day. It must be taken into account that two mammalian species may have a different physiology and also that the total amount of protein detected by Western-blot analyses need not reflect the number of immunostained cells.
It is important to remark that the present work analyses for the first time the daily oscillation of M1 and M2 cells, which are the main morphologically and physiologically different subpopulations recognised among the melanopsin-expressing RGCs (Baver et al., 2008
; Schmidt and Kofuji, 2009
). In adult mice the numbers of both cell types reached the maximum and the minimum at similar times of the day; however, these numbers did not run parallel, which means that the ratio of the two cell types varied throughout the day/night cycle. This finding might be related to their likely distinct functional roles, since they have different dendritic stratification and physiology (Schmidt and Kofuji, 2009
), as well as different brain projections (Baver et al., 2008
); however, further data are required to discuss the meaning of their different oscillation through the LD cycle.
When M1 and M2 cells were analyzed separately at P5, difference between ZT3 and ZT23 was only significant for M1 cells, which indicates that this cell subpopulation develops earlier than the M2 cells, a fact that might also be related to their distinct central connectivity and functional roles. Of the two cell subpopulations described above, only one has been reported to date in the rat and this makes any comparison between the two species more difficult. Such cell population in the rat retina likely correspond to the mouse M1 cells, due to their common dendritic arborization in the OFF sublamina, and also to the fact that antibodies raised against the C-terminus of the rat melanopsin specifically labeled the M1 cells in the mouse (Baver et al., 2008
). Hannibal et al. (2007)
detected a daily rhythm in neonatal rats (P5) that could correspond to the oscillation described in this paper for the mouse M1 cells at the same postnatal day. Our finding, like theirs, supports the idea that at least the oscillation of M1 cells during the 24-h cycle is independent of the rod/cone input, since it was detected even before these photoreceptors were developed. On the other hand, Sakamoto et al. (2004)
observed that cone/rod photoreceptor loss in RCS-rdy rats abolishes melanopsin production by the ipRGCs. Curiously, in a mouse model Semo et al. (2003)
did not observe any significant diminution of melanopsin production after retinal degeneration, which again reveals the variability between species. M2 cell oscillation, which was only detected in adults in our experiments, might depend on the development of other retinal neurons, like rod/cone photoreceptors or the dopaminergic amacrine cells, which are not functional at the early postnatal stage.
After 6 days under constant darkness, we did not detect any rhythm in the total number of melanopsin-immunostained cells, which suggests that the oscillation is not endogenous, but subjected to the day/night cycle. When M1 and M2 cells were analyzed separately, their ratio was roughly maintained at all the time-points analyzed, with the exception that M2 cells showed a small but significant decrease at the end of the subjective night in such experimental conditions. This finding is difficult to explain, but suggests that the physiology of the two subpopulations is different and still poorly understood. Whether the melanopsin oscillation through the 24-h period is endogenous or not is a controversial matter. Sakamoto et al. (2005)
detected an attenuated circadian oscillation in melanopsin mRNA in rats after 2 days in constant darkness. In contrast, Mathes et al. (2007)
reported in a different rat strain that the daily rhythm of melanopsin mRNA was abolished after both constant light or constant darkness exposure, suggesting that the regulation of the melanopsin gene does not rely on a circadian oscillator but is directly illumination-dependent. Therefore, no comparisons can be established between our results in mice and any of these studies. Moreover, only M2 cells showed a small fluctuation in constant conditions. Therefore, no comparisons can be established between our results in mice and any of these studies. Moreover, only M2 cells showed a small fluctuation in constant conditions. If the melanopsin-expressing RGCs had an endogenous rhythm, they should work in a synchronized way. If this was the case, exposure to continuous darkness might induce disruption of the coupling among them and, thus, a loss of their circadian oscillation. Additional analyses on each cell subpopulation, administering shorter periods of exposure to constant conditions, are needed to clarify this issue.
Our study contributes to understanding the physiology of melanopsin-expressing cells and their two subpopulations, which respond differently to changes in environmental conditions. Some of these retinal neurons seem to turn on and off during the LD cycle. Moreover, the effects that these cells exert on different brain areas might be additive, i.e., dependent on the number of cells being active at a certain time. Apart from the physiological importance that this finding may have on its own, this could also explain some quantitative differences reported in previous studies by other authors regarding the melanopsin content of the retina, and why some retinal ganglion cells that project to the SCN do not show melanopsin immunostaining (Sollars et al., 2003
). These cells that do not apparently express the melanopsin photopigment might correspond to retinal samples taken at hours in which such cells were switched off, but still might transmit inputs from the cone/rod pathway to the brain. Differences found in previous studies regarding the total number of melanopsin-expressing cells in the retina, or the numbers of M1 and M2 cell subpopulations, might also be derived from different times of the day for sample collection. Further research is needed to answer questions related to the networks established among neurons within the retina and to what extent the melanopsin-expressing neurons contribute to the circadian physiology of this organ.
The authors declare that the research was conducted in the absence of any commercial or financial relationships that could be construed as a potential conflict of interest.
The UF006 antiserum was generously donated by Dr. Ignacio Provencio, University of Virginia, USA. The C3H/He mice (wild-type at the rd locus) were kindly donated by Dr. Russell G. Foster (Oxford University, UK). This study was supported by Grant BFU2006-15576 (from the Spanish Ministry of Science and Innovation) to J.M. García-Fernández, I. González-Menéndez was supported by fellowship BP07-088 (from the Spanish FICYT).
Güler, A. D., Ecker, J. L., Lall, G. S., Haq, S., Altimus, C. M., Liao, H. W., Barnard, A. R., Cahill, H., Badea, T. C., Zhao, H., Hankins, M. W., Berson, D. M., Lucas, R. J., Yau, K. W., and Hattar, S. (2008). Melanopsin cells are the principal conduits for rod-cone input to non-image-forming vision. Nature 453, 102–105.