RIKEN Brain Science Institute, Wako, Japan
Humans and animals are known to share an ability to estimate or compare the numerosity of visual stimuli, and this ability is considered to be supported by the cortical neurons that have unimodal tuning for numerosity, referred to as the numerosity detector neurons. How such unimodal numerosity tuning is shaped through plasticity mechanisms is unknown. Here, I propose a testable hypothetical mechanism based on recently revealed features of the neuronal dendrite, namely, cooperative plasticity induction and nonlinear input integration at nearby dendritic sites, on the basis of the existing proposal that individual visual stimuli are represented as similar localized activities regardless of the size or the shape in a cortical region in the dorsal visual pathway. Intriguingly, the proposed mechanism naturally explains a prominent feature of the numerosity detector neurons, namely, the broadening of the tuning curve in proportion to the preferred numerosity, which is considered to underlie the known Weber–Fechner law-dependent accuracy of numerosity estimation and comparison. The simulated tuning curves are less sharp than reality, however, and together with the evidence from human imaging studies that numerical representation is a distributed phenomenon, it may not be likely that the proposed mechanism operates by itself. Rather, the proposed mechanism might facilitate the formation of hierarchical circuitry proposed in the previous studies, which includes neurons with monotonic numerosity tuning as well as those with sharp unimodal tuning, by serving as an efficient initial condition.
Humans and animals are known to share an ability to estimate or compare the numerosity of sensory stimuli or voluntary movements, referred to as the number sense (Dehaene, 1997
). Difficulty of the comparison of two numerosities, measured by the response time or the error rate, is known to increase along with the decrease in their ratio (Brannon and Terrace, 1998
; Dehaene and Changeux, 1993
; Gallistel and Gelman, 1992
) according to the Weber–Fechner law (Dehaene, 2003
; Fechner, 1860
; Weber, 1850
). Recently, neurons showing unimodal tuning for the number of visual stimuli (Nieder and Merten, 2007
; Nieder and Miller, 2004
; Nieder et al., 2002
) or the order of repetitive movements (Sawamura et al., 2002
) were found in the monkey neocortex, and are considered to underlie such rudimentary numerical competence of animals and humans (Nieder, 2005
; Nieder and Dehaene, 2009
). Moreover, it was shown that the tuning curve of these neurons broadens along with the increase in the preferred numerosity (Nieder and Merten, 2007
; Nieder and Miller, 2003
), suggesting that the degree of interference between the tuning curves can explain the Weber–Fechner law in numerical cognition (Dehaene, 2003
; Nieder and Miller, 2003
).
As for the mechanism of the neuronal numerosity tuning, Dehaene and Changeux (1993)
have proposed a neural network model, before the discovery of the number-selective neurons in monkeys. According to their model, each single visual stimulus (object) is represented, after being processed through the dorsal visuospatial pathway, as a similar level of localized activity in a cortical region, referred to as the location map (Figure 1
A). The location map was assumed to project to another population of neurons, referred to as the summation clusters, that have monotonic numerosity tuning with various activation thresholds. Unimodal numerosity tunings then emerge in the neurons downstream of the summation clusters by receiving central excitation and lateral inhibition (Dehaene and Changeux, 1993
). From a theoretical point of view, it was pointed out (Verguts and Fias, 2004
) that since the mapping from the location map to the neurons with unimodal numerosity tuning is linearly inseparable, implementing this mapping requires another neural population, such as the summation clusters, in between (Minsky and Papert, 1969
). In experiments, neurons having monotonic numerosity tuning have recently be found in the lateral intraparietal area (Roitman et al., 2007
), in line with the prediction of the model (Dehaene and Changeux, 1993
).
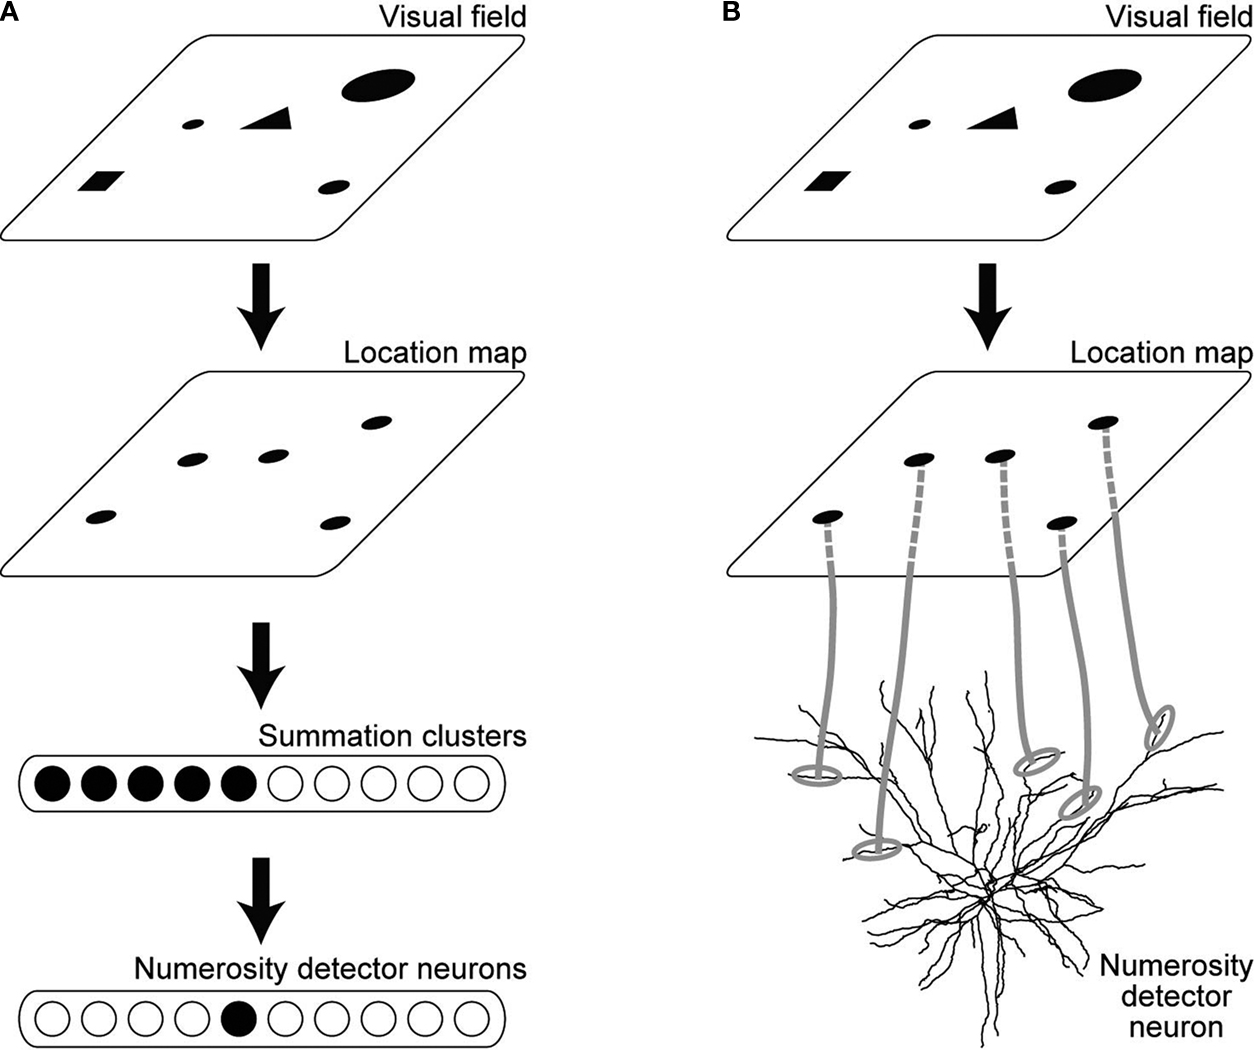
Figure 1. Neural circuitry connecting to the numerosity detector neurons. (A) Hierarchical circuitry proposed in the existing models. Visual field is mapped onto the location map, where each stimulus is represented as a similar level of localized activity regardless of the original size or the shape. The location map projects to the neurons called the summation clusters, which have monotonic numerosity tuning with various activation thresholds. Unimodal numerosity tunings emerge in the neurons downstream of the summation clusters by receiving central excitation and lateral inhibition. (B) Direct projection form the location map to the numerosity detector neurons proposed in the present study. The morphology of the neuron was adapted by permission from Macmillan Publishers Ltd: [Nature] Mainen and Sejnowski, 1996
, copyright (1996).
It is unknown, however, how such a hierarchical circuitry as proposed in the model (Dehaene and Changeux, 1993
) is shaped by plasticity mechanisms in the brain. Verguts and Fias (2004)
have addressed this issue, and demonstrated by simulation that if there exist neurons having monotonic numerosity tuning (i.e., the summation clusters) from the beginning, then neurons showing unimodal numerosity tuning can be developed via biologically plausible unsupervised learning. They have not shown whether or not monotonic and unimodal numerosity tuning can be developed together via unsupervised learning given the location map at the beginning. Instead, they have shown that if unimodally tuned neurons exist from the beginning, monotonically tuned neurons can be developed afterward via supervised learning. Since supervised learning is not considered to be implemented by plasticity mechanisms in the cerebral cortex, as noted by the authors, this result cannot directly relate to actual circuit formation in the cortex. Nevertheless, it reminds us of the possibility that the summation clusters might actually be developed after, rather than before, the unimodally tuned neurons are developed.
In the present paper, I propose a hypothesis on how unimodal numerosity tuning can be shaped, given the location map proposed in the previous study (Dehaene and Changeux, 1993
), through cooperative plasticity induction among nearby dendritic sites (Morita, 2009
), which has been theoretically predicted (Govindarajan et al., 2006
; Mehta, 2004
; Mel, 1993
; Poirazi and Mel, 2001
) and recently demonstrated in hippocampal pyramidal cells (Harvey and Svoboda, 2007
; Harvey et al., 2008
; Larkum and Nevian, 2008
; Losonczy et al., 2008
; Morita, 2009
; Sjöström et al., 2008
), in combination with dendritic nonlinear input integration, which was also theoretically predicted (Koch et al., 1982
; Mel, 1993
; Poirazi et al., 2003b
) and demonstrated in hippocampal and neocortical pyramidal cells (Gasparini et al., 2004
; Liu, 2004
; Losonczy and Magee, 2006
; Milojkovic et al., 2005
; Nevian et al., 2007
; Polsky et al., 2004
; Schiller et al., 2000
; Wei et al., 2001
). Notably, the indication of the necessity of an intermediate neural population because of the linearly inseparable nature of the mapping (Verguts and Fias, 2004
) is no longer applicable given that single neurons implement multiple nonlinear operations (Poirazi et al., 2003b
) (Figure 1
B). According to the proposed mechanism, the tuning curve broadens roughly in proportion to the preferred numerosity, explaining the experimental results (Nieder and Merten, 2007
; Nieder and Miller, 2003
) and thereby providing a possible mechanistic explanation of the Weber–Fechner law in numerical cognition (Dehaene, 2003
; Nieder and Miller, 2003
). The simulated tuning curves are less sharp than reality, however, and together with the evidence from human imaging studies that numerical representation is a distributed phenomenon (Dehaene et al., 2004
), it may not be likely that the proposed mechanism operates by itself. Rather, the proposed mechanism might initially shape rough numerosity preference, which would then facilitate the formation of the hierarchical circuitry proposed in the previous studies (Dehaene and Changeux, 1993
; Verguts and Fias, 2004
) by serving as an efficient initial condition.
Model
I propose a hypothetical mechanism of the formation of unimodal numerosity tuning as follows:
(I) A single visual stimulus (object) evokes a similar level of localized activity in the “location map” regardless of the size, position in the visual field, or any other physical features, and thereby the number of the localized activities on the location map matches the number of the visual stimuli (numerosity) (Figure 1
B), in the same manner as considered in the previous models (Dehaene and Changeux, 1993
; Verguts and Fias, 2004
) (Figure 1
A). In addition, the level of each localized activity decreases with the numerosity, presumably by recurrent (lateral) inhibition (Carandini and Heeger, 1994
) that was demonstrated to be prevalent in neocortical circuits (Kapfer et al., 2007
; Shu et al., 2003
; Silberberg and Markram, 2007
). Most simply, the total activity (sum) in the location map could be normalized to the same level regardless of the numerosity. I first examined this simplest case. In reality, however, whether recurrent inhibition can implement such a perfect normalization is uncertain; it may be more likely that the level of each localized activity decreases along with the numerosity but to a lesser extent so that the total activity sublinearly increases, as considered in a previous model (Verguts and Fias, 2004
). Therefore, later I also examined this second possibility, showing that the main features of the model behavior remain unchanged.
(II) The original notion of self-organizing map (Amari, 1980
; Kohonen, 1982
; von der Malsburg, 1973
) refers to that nearby inputs are mapped onto nearby neurons because of the spatially restricted recurrent excitation, combined with the Hebbian plasticity induced by concurrent pre- and post-synaptic neuronal firing activities (Figure 2
A). Recently, it was suggested (Archie and Mel, 2000
; Govindarajan et al., 2006
; Larkum and Nevian, 2008
; Mehta, 2004
; Mel, 1993
, 2007
; Mel et al., 1998
; Morita, 2009
; Poirazi and Mel, 2001
) that the principle of self-organizing map can also operate in a finer scale, specifically, nearby inputs can be mapped onto nearby sites on the same dendritic branch of a single neuron (Figure 2
B) because of the branch-specific (i) electrical and (ii) biochemical cooperativity, possibly combined with (iii) the dendritically-regulated plasticity induced by concurrent pre-synaptic neuronal firing and post-synaptic dendritic spike generation. Here, the electrical cooperativity (i) refers to supralinear synaptic integration and dendritic spike generation, as predicted (Mel, 1993
; Poirazi et al., 2003a
,b
) and observed in the neocortex and the hippocampus (Gasparini et al., 2004
; Losonczy and Magee, 2006
; Milojkovic et al., 2005
; Nevian et al., 2007
; Polsky et al., 2004
; Schiller et al., 2000
; Wei et al., 2001
) while the biochemical cooperativity (ii) means spatially restricted availability of the plasticity-related proteins, as recently suggested (Govindarajan et al., 2006
) and observed for Ras in the hippocampus (Harvey et al., 2008
), and the plasticity induction by dendritic spikes (iii) was observed in the hippocampus (Golding et al., 2002
; Harvey and Svoboda, 2007
). This mechanism, referred to as the clustered plasticity (Govindarajan et al., 2006
; Harvey and Svoboda, 2007
), was recently demonstrated in the hippocampus (Harvey and Svoboda, 2007
). Moreover, other recent findings, specifically, branch-specific change in the excitability via activity-dependent regulation of potassium channels, named the branch strength potentiation (Losonczy et al., 2008
) and activity-dependent secretion of brain-derived neurotrophic factor (BDNF) from individual spines (Tanaka et al., 2008
), may also facilitate such a self-organizing map at the single neuron level (Morita, 2009
). The exact meaning of the “nearby inputs” in the above would depend on the nature of the inputs such as the level of the firing rate or the firing patterns, but since the relevant branch-specific events have rather long time scales, specifically, more than tens of milliseconds for the dendritic NMDA spikes (Nevian et al., 2007
; Polsky et al., 2004
; Rhodes, 2006
; Schiller et al., 2000
) and minutes or more for the local availability of plasticity-related proteins (Govindarajan et al., 2006
; Harvey and Svoboda, 2007
; Harvey et al., 2008
), millisecond-order spike synchronization may not be necessary; being coactive in the same epoch of the order of seconds or more may be enough at least under certain conditions. Based on these considerations, I assumed that inputs from the same portion of the location map are “nearby” (in the above sense) whereas those from different portions are not, so that inputs from the same portion of the location map tend to be clustered onto single dendritic branches whereas those from different portions tend to project to different parts of the dendritic tree, or more specifically, to different dendritic branches (Figure 1
B). In consequence, each localized activity on the location map, corresponding to an individual visual stimulus, usually activates a different dendritic branch, though strict one-to-one correspondence can be somewhat degraded (see below).
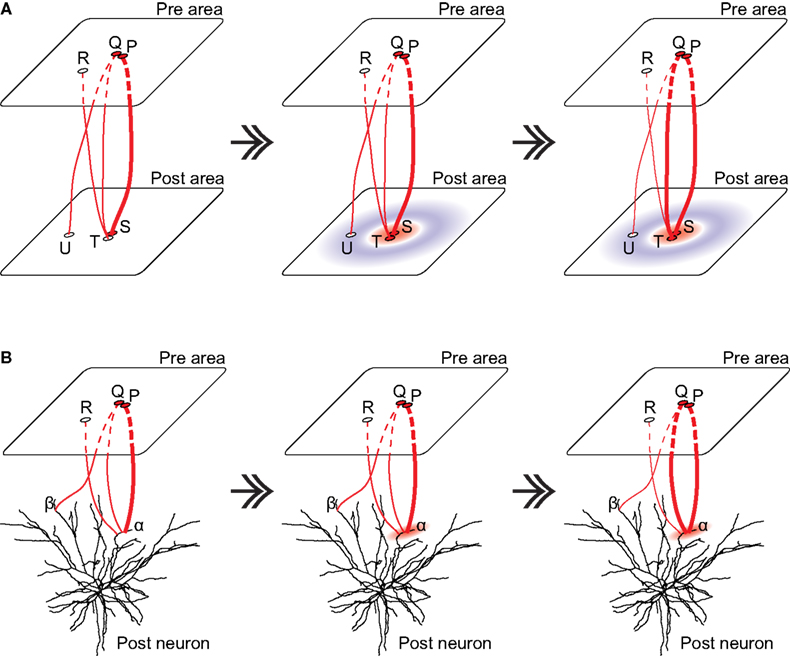
Figure 2. Self-organizing map in different scales. (A) The original notion of self-organizing map. Left: Assume that the neurons P and Q tend to be coactive, representing the sources of “nearby inputs” to the “post” area, and that the connection from the neuron P to the neuron S is slightly stronger (as indicated by the line width) from the beginning just because of randomness. Receiving such a strong input, the neuron S becomes active when the neurons P and Q are active (as indicated by the red color). Middle: Assume that nearby (either physically or functionally) neurons in the “post” area mutually excite whereas distant neurons mutually inhibit (indicated by the red and blue colors, respectively) through recurrent connections. Then, the activated neuron S excites nearby neurons, including the neuron T. Receiving both the feed-forward excitation from the neuron Q and the recurrent excitation from the neuron S, the neuron T now becomes active. Right: Since the neuron Q and the neuron T are now coactive, the connection between them is strengthened whereas other connections (Q and U, or R and T) are weakened, according to the Hebbian plasticity. (B) Self-organizing map at the single neuron level. Left: Assume that the neurons P and Q again tend to be coactive. Assume that the connection from the neuron P to the dendritic branch α is slightly stronger from the beginning just because of randomness. Middle: Since the branch α receives such strong excitation from the neuron P, there emerge electrical and biochemical events, both of which are restricted to that branch; the former is supralinear summation of post-synaptic potentials and subsequent dendritic spike generation and the latter is spatially restricted availability of the proteins necessary for synaptic potentiation (indicated by the red feathering). Right: In consequence, other synapses on the same branch receiving inputs in the same time epoch, including the synapse from the neuron Q, become strengthened by virtue of the cooperative plasticity induction. Note that although this figure explains so-called associativity, cooperativity is also expected to occur. The morphology of the neuron was adapted by permission from Macmillan Publishers Ltd: [Nature] Mainen and Sejnowski, 1996
, copyright (1996).
(III) Each dendritic branch implements nonlinear input integration through dendritic spike generation (Gasparini et al., 2004
; Losonczy and Magee, 2006
; Mel, 1993
; Milojkovic et al., 2005
; Nevian et al., 2007
; Poirazi et al., 2003b
; Polsky et al., 2004
; Schiller et al., 2000
; Wei et al., 2001
). Specifically, when and only when the input to a branch exceeds a certain threshold, the branch gives an excitation to the cell body so as to contribute to action potential generation (Figures 3
A,B, small graphs in the left). I assumed that the level of the threshold varies from neuron to neuron, similar to what was assumed in the previous model (Dehaene and Changeux, 1993
) but here for the dendritic threshold rather than for the somatic threshold. Threshold should also vary from branch to branch within a single neuron; this was incorporated later. The inter-neuronal variability in the threshold is expected to emerge from the difference in global properties of the neuron such as the cell size or the expression level of relevant genes, or in the amount of inhibition provided by nearby interneurons, whereas the intra-neuronal variability would emerge from morphological and physiological variations between branches. I assumed that the branch is saturated whenever it receives suprathreshold input (i.e., binary) for the sake of simplicity. This can actually be a good approximation (c.f., Nevian et al., 2007
; Wei et al., 2001
), although considering continuous nonlinearity (e.g., sigmoidal) might be more precise.
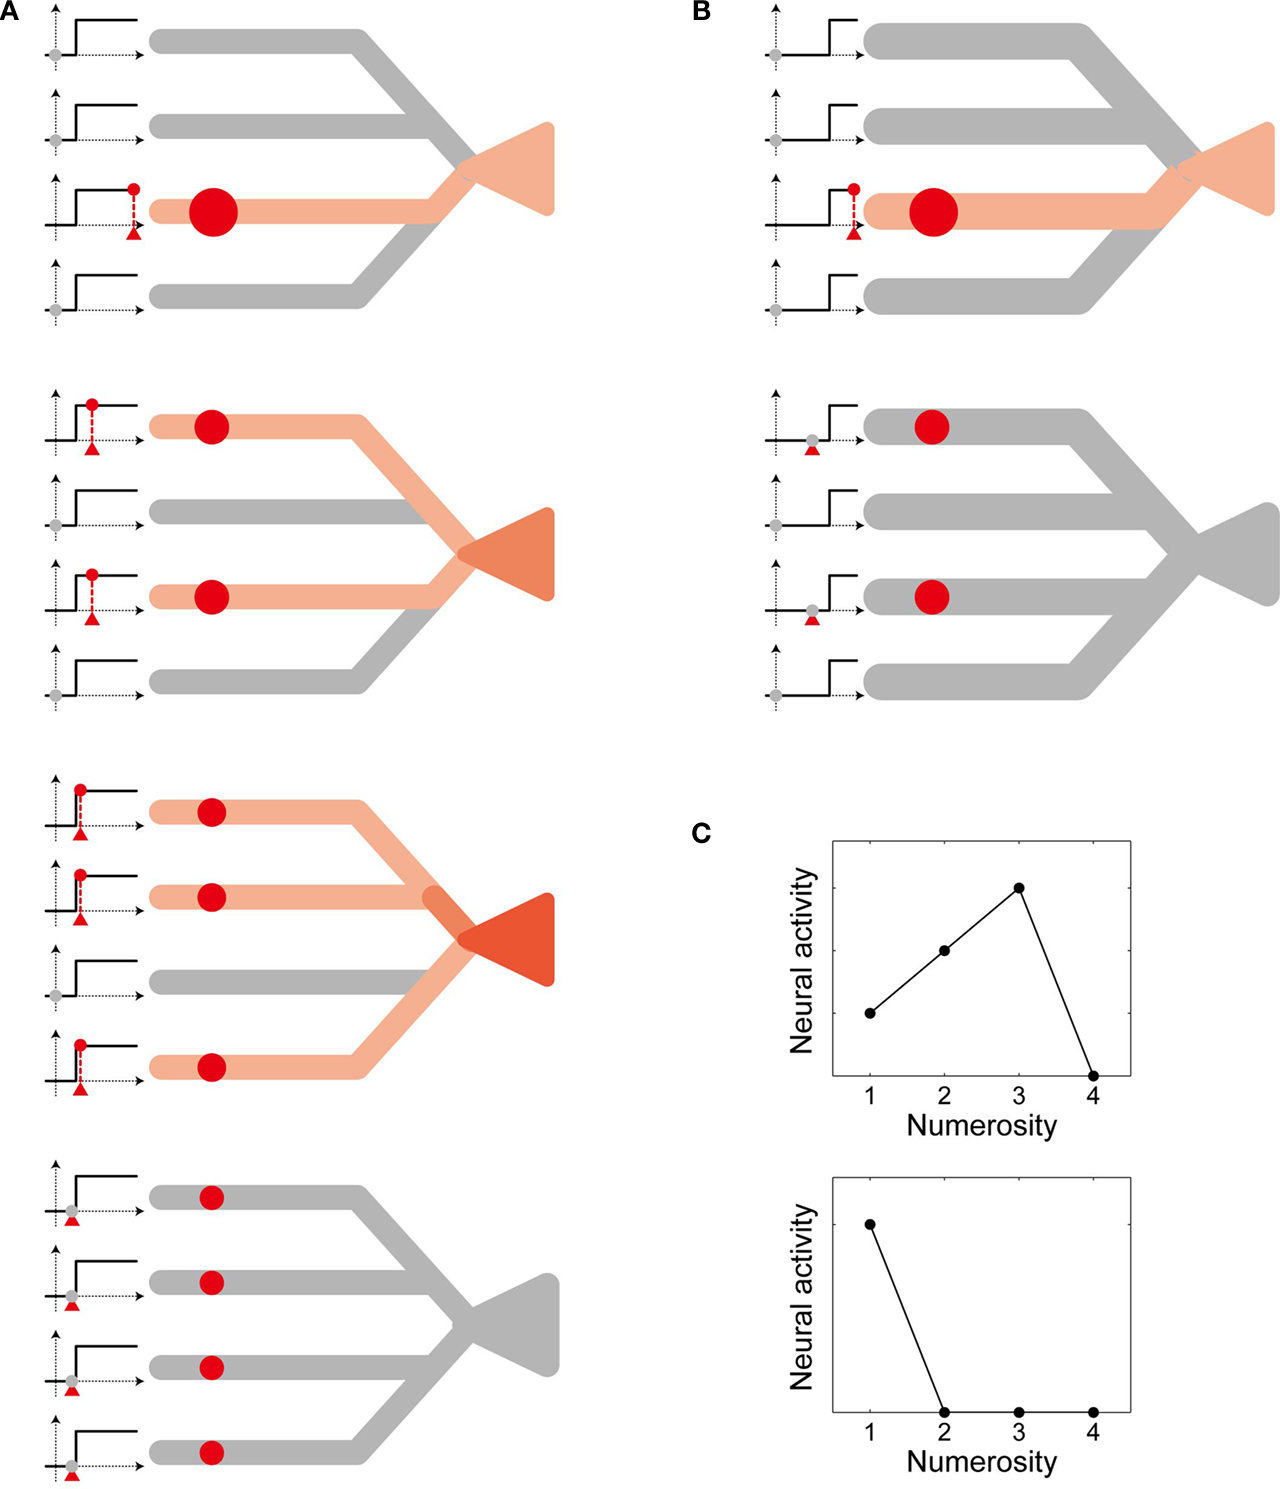
Figure 3. Schematic diagram of the proposed mechanism of unimodal numerosity tuning. Consider neurons having four dendritic branches (for the purpose of explanation). (A) A neuron receives inputs (red circles) on 1, 2, 3, or 4 branches (top to bottom, respectively). In the first three cases, the input exceeds the threshold in individual branches, as shown in the left graphs, so that the neural activity increases along with the number of the branches that receive inputs (indicated by the contrast of the red color). In the last case (bottom), however, the input on each branch is below the threshold and thus the neuron remains inactive. (B) The same as (A) except that this neuron has a higher threshold. (C) Numerosity tuning of the neuron (A) (top) and the neuron (B) (bottom). The tuning is unimodal, and the preferred numerosity differs according to the level of the threshold.
Simulation Results
Let us see how the model works in a simple case where the neuron has four dendritic branches (Figure 3
). When there are two visual stimuli, and thus two localized activities in the location map, the neuron receives inputs on two different branches (Figure 3
A, second from the top). Given that these inputs are larger than the dendritic threshold, as indicated in the left small graphs, the neural activity becomes “2”. If there is only one visual stimulus instead, and thus input is applied only to a single branch (Figure 3
A, top), the neural activity decreases to “1”, because the branch is saturated and thus it cannot provide more excitation to the cell body than the previous case. Hereby this neuron turned out to be more activated, or more selective, to the numerosity 2 than to 1, as indicated by the color in the figures. If there are three stimuli and the inputs are applied onto three branches (Figure 3
A, third from the top), the neural activity increases to “3”. However, if there are four stimuli (Figure 3
A, bottom), the input to individual branches can no longer exceed the threshold, because of the presumed decrease in the level of each localized activity in the location map along with the numerosity [in the assumption (I)], so that the neural activity becomes “0”. In this way, the neural activity differs according to the number of visual stimuli, resulting in the unimodal tuning property (Figure 3
C, top). Now, consider another neuron that has a higher threshold (Figure 3
B). For this neuron, a single visual stimulus evokes suprathreshold input on a single branch (Figure 3
B, top) whereas two visual stimuli evoke only subthreshold inputs on two branches (Figure 3
B, bottom). Therefore, the neural activity becomes “1” for the numerosity 1 but “0” for 2 (Figure 3
C, bottom), demonstrating that the numerosity preference differs according to the level of the threshold.
Numerosity tuning curves of three neurons, each of which has 50 dendritic branches but with three different levels of threshold, are shown in Figure 4
A; neural activity is normalized so that the maximum is equal to 1 (throughout the paper), primarily for the purpose of illustration but such a normalization might actually be realized at least to some extent by homeostatic mechanisms (Ibata et al., 2008
; Turrigiano and Nelson, 2004
). As shown in the figure, as the threshold decreases (from blue to green, and then to red), the preferred numerosity increases. Notably, the width of the tuning curve also increases proportionally, as naturally expected from the mechanism. This is in line with the experimental observations (Nieder and Merten, 2007
; Nieder and Miller, 2003
, 2004
; Nieder et al., 2002
). More specifically, such a proportionality indicates that the widths of the tuning curves will become equal if they are plotted on the logarithmic scale (Figure 4
C). Therefore, this can naturally explain the Weber–Fechner law-dependent accuracy in numerosity estimation and comparison tasks (Dehaene, 2003
; Nieder and Miller, 2003
). The shape of the tuning curve, however, looks different from reality; the right slope is too steep. This point can be resolved in the course of making the model more realistic. First, although the input magnitude and the dendritic threshold were so far assumed to be the same for all the branches in a single neuron, in reality they are expected to differ from branch to branch at least to some extent. If such intra-neuronal branch-to-branch variability in either the input magnitude or the dendritic threshold is incorporated (modeled by Gaussian pseudo random numbers: see Model details for details) in addition to the inter-neuronal variation that was already considered, there appears a tail on the right side of the tuning curve (Figure 4
B, top and middle panels, respectively). This can be explained as follows. Provided there exists variability in the level of input to branches (and no intra-neuronal variability in the threshold, for simplicity) (Figure 4
B, top), then even if the average of the input (over trials and branches) is smaller than the threshold (i.e., there are more items than the preferred numerosity of the neuron of the case without the variability), input can sometimes (i.e., in some trials and for some branches) exceed the threshold by virtue of the variability, thereby causing neuronal firing. Likewise, provided there exists intra-neuronal variability in the dendritic threshold (and no variability in the input magnitude, for simplicity) (Figure 4
B, middle), then even if the input is smaller than the average of the threshold (i.e., again, there are more items than the preferred numerosity of the neuron of the case without the variability), neuron can still fire when the inputs are applied onto branches whose thresholds are smaller than the average. Second, since the number of the branches is limited and the plasticity rule would not always operate perfectly, inputs from different portions on the location map might sometimes converge onto the same dendritic branch, as mentioned at the end of the assumption (II). Incorporating such an input convergence also causes an increase in the expected neural activity for larger numerosities (Figure 4
B, bottom: arrows), thereby contributing to the right-side tail when it is combined with the variability introduced above. Inversely, single localized activity may be formed at an arbitrary location and thus may sometimes project to two or more branches, possibly further broadening the tuning curve, although it is possible that localized activity can only be formed at numerous but finite predetermined positions (i.e., attractors; c.f. Brody et al., 2003
; Wang, 2001
), each of which projects to a single dendritic branch.
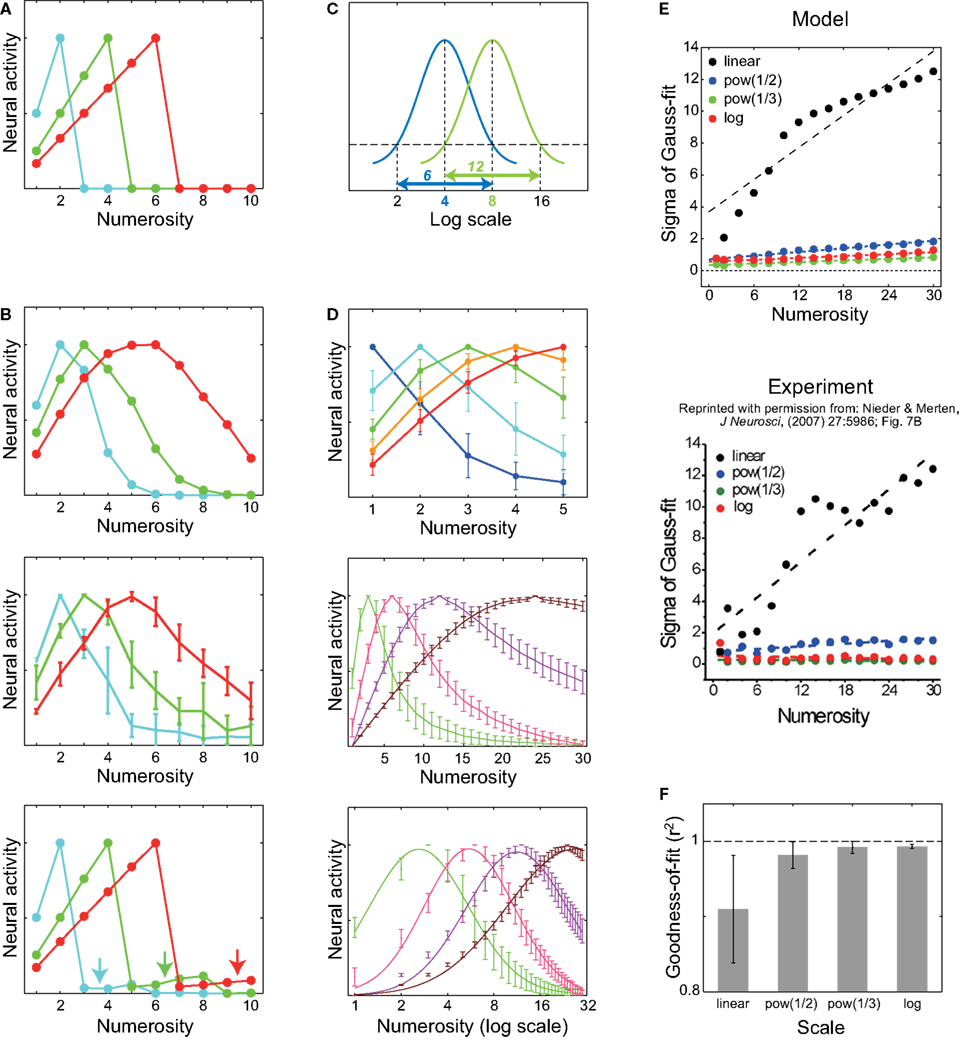
Figure 4. Numerosity tuning curves obtained by simulations of the proposed mechanism. Neurons having 50 dendritic branches were considered. (A) Tuning curves of neurons with three different threshold levels are shown. As the threshold decreases (from blue to green, and then to red), the preferred numerosity increases, and notably, the width of the tuning curve also increases proportionally. (B) Possible elaborations of the model by which the tuning curve entails right-oriented asymmetry as observed in the experiments. Top: Variability in the input magnitude was incorporated. Middle: Intra-neuronal variability in the threshold was incorporated. The error bars indicate the standard deviations over ten neurons. Bottom: One-to-one correspondence between the localized activity in the location map and the dendritic branch (Figure 1
B) was degraded so that each branch received inputs from up to three distant portions of the location map. (C) Schematic diagram showing that if the tuning curve has the same shape in the logarithmic scale, the peak (most preferred numerosity) and the width of the tuning curve varies proportionally. (D) Top and middle: Numerosity tunings, taking all of (B) into account, in the cases of the preferred numerosity around 1 ∼ 5 (top) or 3, 6, 12, and 24 (middle). Bottom: The same tuning curves in the middle panel plotted on the logarithmic scale, with the Gaussian fitting curves. The curves are asymmetric in the linear scale (middle), but become more symmetric in the logarithmic scale (bottom). (E) Top: How the dependence of the tuning width (the standard deviation of the Gaussian fittings) on the preferred numerosity changes with the scale. The width drastically increases with the preferred numerosity when plotted on the linear scale (black dots), whereas the change in the width is much less in the cases with the nonlinear scales (blue, red, and green dots), consistent with the experimental observations (Bottom: Reprinted from (Nieder and Merten, 2007
), Figure 7B by permission of the Journal of Neuroscience.). (F) The goodness of the Gaussian fit in the different scales. The logarithmic scale gives the best fit, indicating that the tuning curve becomes most symmetric in that scale.
The top and middle panels of Figure 4
D show the numerosity tunings, taking into account all of the above, namely, variability in the input (Figure 4
B, top) as well as in the threshold (Figure 4
B, middle) and the input convergence (Figure 4
B, bottom), in the cases of the preferred numerosity at 1 ∼ 5 (top) or 3, 6, 12, and 24 (middle). They appear comparable to those observed in the experiments (Nieder and Merten, 2007
; Nieder and Miller, 2003
, 2004
; Nieder et al., 2002
); specifically, the model well reproduced the observation that the width increases with the preferred numerosity. The bottom panel of Figure 4
D shows the same tuning curves in the middle panel plotted on the logarithmic scale, with the fitting curves of the normal distributions (Gaussians). As shown in the panel, the tuning widths become more comparable and the shapes become more symmetric in the log scale than in the linear scale (middle panel), in line with the experiments (Nieder and Merten, 2007
; Nieder and Miller, 2003
). The top panel of Figure 4
E shows how the dependence of the tuning width, defined by the standard deviation of the fitted Gaussian functions, on the preferred numerosity changes with the scale on which the tuning curves are plotted. As shown in the panel, the width drastically increases with the preferred numerosity when plotted on the linear scale (black dots), whereas the changes in the width are much less in the cases with the nonlinear scales (blue, green, or red dots), consistent with the experimental observations shown in the bottom panel (Reprinted from (Nieder and Merten, 2007
), Figure 7B by permission of the Journal of Neuroscience). Figure 4
F shows the goodness of the Gaussian fit in the different scales; the nonlinear scales give better fits than the linear scale, reflecting that the tuning curves are more symmetric in the nonlinear scales (Figure 4
D, middle and bottom).
Robustness and Plausibility
Next, I examined how the behavior of the model depends on the parameter values, in particular, the degree of variability in the input magnitude (Figure 4
B, top) and the dendritic threshold (Figure 4
B, middle), or the number of dendritic branches. Figure 5
A shows the simulation results when the variability in the input magnitude and the dendritic threshold was decreased; standard deviation per mean was 0.2 for both, compared with 0.3 in the simulations described in the above (Figures 4
D–F). As shown in Figure 5
A, emergence of the unimodal number selectivity and broadening of the tuning curves along with the numerosity were preserved, whereas the shape of the tuning curve was affected, i.e., the right tail was reduced (decayed faster), as can be expected from the mechanism mentioned before (Figure 4
B, top and middle). Consequently, the tuning curves became better fitted by Gaussian in the scale of the power functions rather than in the log scale, although the log scale still gives better Gaussian fitting (i.e., better symmetry) than the linear scale (Figure 5
Ae). Similar outcomes were obtained when the convergence of the multiple inputs corresponding to different portions of the location map onto the same branch (Figure 4
B, bottom), which was assumed (up to three branches) in the simulations described in the above (Figures 4
D–F), was not considered, as shown in Figure 5
B. Conversely, increasing the variability in the input magnitude and the dendritic threshold (standard deviation per mean was 0.4, compared with the original 0.3), as well as increasing the degree of input convergence (i.e., allowing the convergence of inputs from up to five different portions, compared with the original up to three portions), thickened the right tail of the tuning curves so that the logarithmic scaling gave even better symmetry than the scaling with the power functions (Figures 5
C,D, respectively), compared with the results with the original parameter values (Figures 4
D–F), though the difference between Figures 4 and 5
D is small. It is therefore suggested that the model can well reproduce the experimental observation that the tuning curve becomes most symmetric in the logarithmic scale (Nieder and Merten, 2007
; Nieder and Miller, 2003
), provided there exist sufficient variability in the input magnitude and the dendritic threshold and/or a certain degree of input convergence. Figures 5
E,F show the results of the cases where the number of dendritic branches was decreased (30 branches, compared with the original 50 branches) or increased (100 branches), respectively. The variability in the input magnitude and the dendritic threshold was also increased in the latter case (standard deviation per mean was 0.4, compared with the original 0.3). As shown in the figures, the main features of the model behavior explained above (Figures 4
D–F) were preserved in those cases [if the standard deviation per mean was set to 0.3 in the case of 100 branches, the power function scale gave slightly better Gaussian fits than the log scale (not shown)].
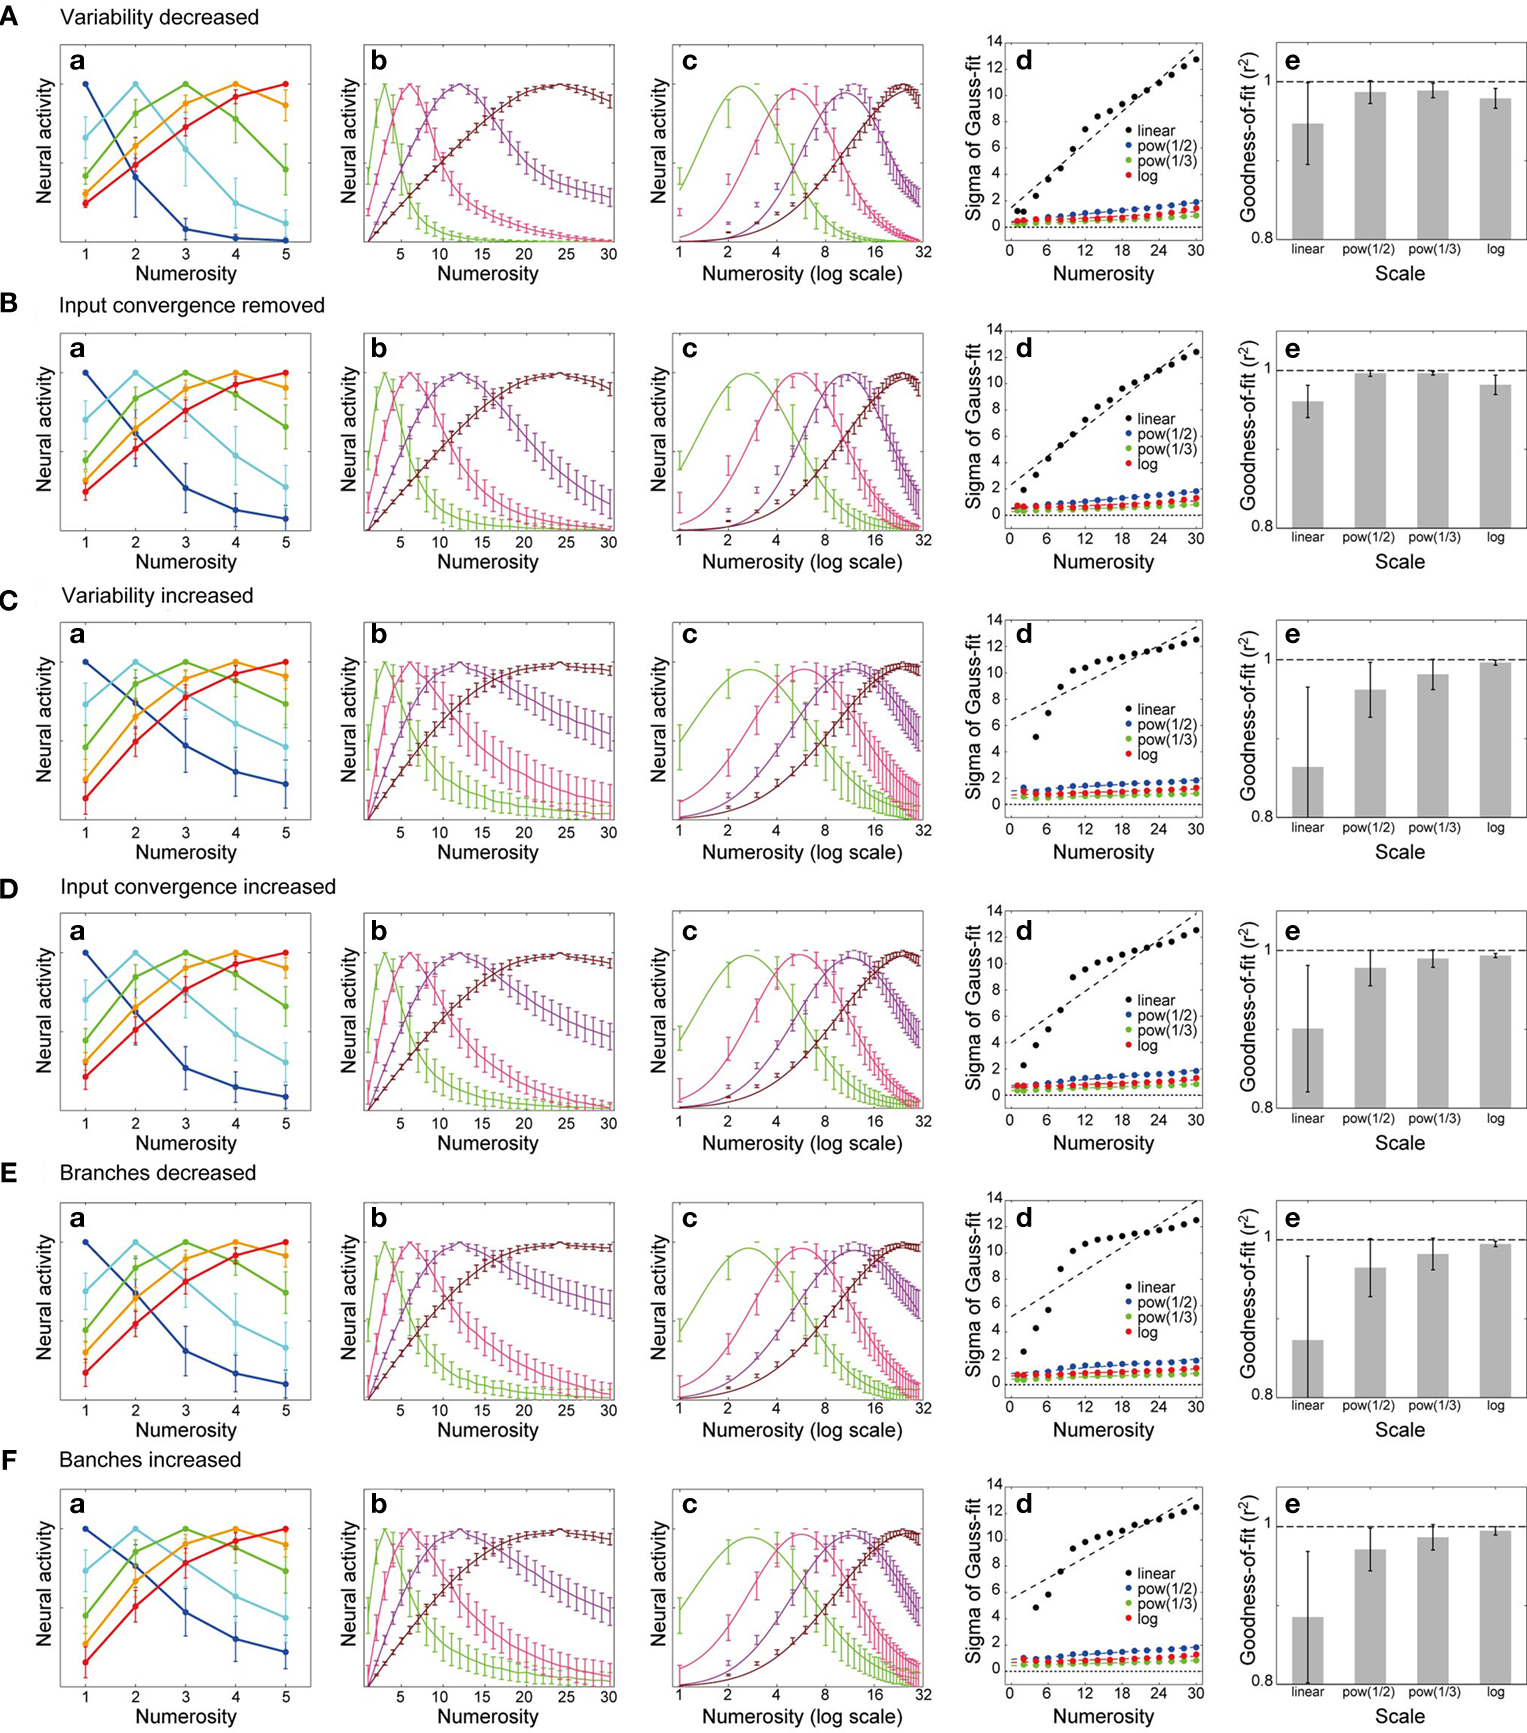
Figure 5. Determinants of the tuning curve shape. (A,C) Simulation results when the variability in the input magnitude and in the dendritic threshold was decreased [(A); standard deviation per mean 0.2 for both, compared with the original 0.3 in Figures 4
D–F] or increased [(C); 0.4]. As the variability was decreased or increased, the right tail of the tuning curve was reduced or thickened [most apparent in (b)], respectively, as can be expected from the mechanism mentioned before (Figure 4
B, top and middle). (B,D) Results when the degree of convergence of the inputs from different portions of the location map was decreased [(B); each branch receives input only from a single portion] or increased [(D); each branch receives input from up to 5, compared with the original 3 in Figures 4
D–F, different portions]. As the input convergence was removed or increased, the right tail of the tuning curve was reduced or thickened, respectively, as can be expected from the mechanism mentioned before (Figure 4
B, bottom). From these results (A–D), it is suggested that the model can well reproduce the experimental observation that the tuning curve becomes most symmetric in the logarithmic scale, provided there exist sufficient variability in the input magnitude and the dendritic threshold and/or a certain degree of input convergence. (E,F) Results when the number of dendritic branches was decreased [(E); 30 branches, compared with the original 50 branches in Figures 4
D–F] or increased [(F); 100 branches]. The variability in the input magnitude and the dendritic threshold was the same as the original (0.3) in (E), and increased (0.4) in (F). The degree of input convergence was assumed to the same as the original (up to three different portions of the location map). The main features of the model behavior were preserved in those cases. (a,b) Numerosity tunings in the cases of the preferred numerosity around 1 ∼ 5 (a) or 3, 6, 12, and 24 (b). (c) The same tuning curves in (b) were plotted on the logarithmic scale, with the Gaussian fitting curves. (d) Dependence of the tuning width (the standard deviation of the Gaussian fittings) on the preferred numerosity in four different scales. (e) Goodness of the Gaussian fit in the different scales.
In the simulations so far presented, it was assumed that the summation of the localized activities in the location map, or equivalently, the summation of the inputs to all the dendritic branches of individual numerosity detector neurons, was normalized to be around a constant level (except for the presumed input variability) regardless of the numerosity of visual stimuli. Such a normalization of the linear summation, however, may not be the case in reality, as mentioned before [in the assumption (I)]. Therefore, I also examined the case in which the level of each localized activity, or input to each branch, again decreases with the numerosity but to a lesser extent than the previous case so that the total activity in the location map (i.e., the linear summation of the inputs to the branches) sublinearly increases with the numerosity. Specifically, I examined, as an example, the case where the sum of the squares of the localized activities is assumed to be constant (except for the variability), which is the same assumption as considered in a previous network-based model (Verguts and Fias, 2004
). Figure 6
shows the results of the simulations, in which the variability (standard deviation per mean) in the input magnitude and the dendritic threshold (Figure 4
B, top and middle) was set to 0.25 and the convergence of multiple inputs corresponding to different portions of the location map onto the same branch (Figure 4
B, bottom) was not considered [as originally assumed in the assumption (II)]. As shown in Figure 6
, the main features of the model behavior, namely, formation of the unimodal numerosity selectivity, broadening of the tuning curve roughly in proportion to the preferred numerosity (explaining the Weber-Fechner law) better symmetry in the nonlinear scales than in the linear scale, and better symmetry in the log scale than in the scales with the power functions, were preserved under this assumption. Given that recurrent inhibition is prevalent in the neocortex ( Kapfer et al., 2007
; Shu et al., 2003
; Silberberg and Markram, 2007
), normalization of the activity in the location map is expected to occur at least to a certain extent (c.f., Carandini and Heeger, 1994
; Hahnloser et al., 2000
). Meanwhile, there may also exist feed-forward inhibition from the location map to the numerosity detector neurons. If the total activity of the location map increases with the numerosity, such feed-forward inhibition is expected to increase accordingly, thereby effectively increasing the threshold of the numerosity neurons. This is theoretically equivalent to decreasing each localized activity in the location map while keeping the threshold of the numerosity neurons constant, thereby possibly complementing the normalization within the location map.
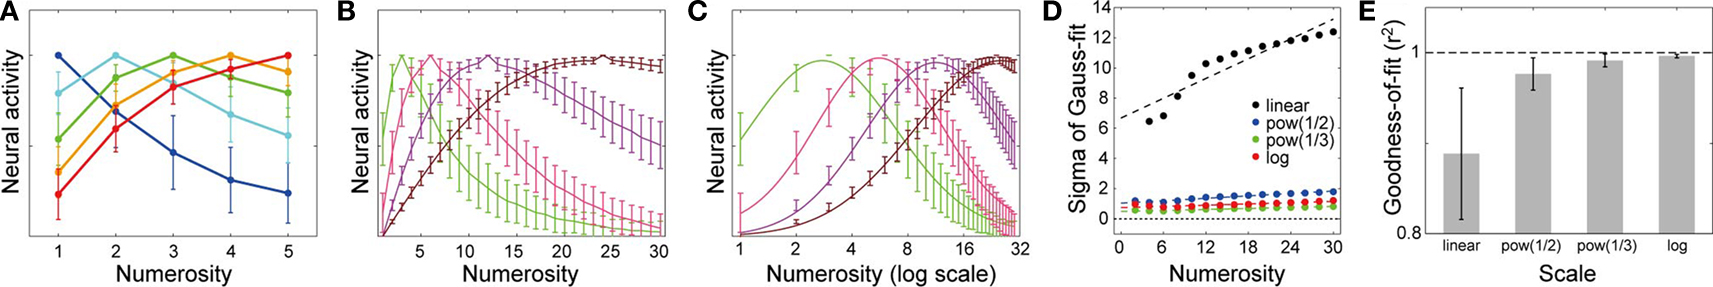
Figure 6. Simulation results with a different way of normalization of the activity in the location map. Simulation results when the level of each localized activity in the location map decreases with the numerosity but the summation of them sublinearly increases; specifically, the sum of the squares of the localized activities was assumed to be constant. The main features of the model behavior were preserved under this assumption. Variability in the input magnitude and in the dendritic threshold was set to 0.25 (standard deviation per mean), and the convergence of multiple inputs corresponding to different portions of the location map onto the same branch was not considered. (A,B) Numerosity tunings in the cases of the preferred numerosity around 1 ∼ 5 (A) or 3, 6, 12, and 24 (B). (C) The same tuning curves in (B) was plotted on the logarithmic scale, with the Gaussian fitting curves. (D) Dependence of the tuning width (the standard deviation of the Gaussian fittings) on the preferred numerosity in four different scales. (E) Goodness of the Gaussian fit in the different scales.
As shown above, I have examined whether and how the model behavior changes according to the parameter values and the way the level of each localized activity decreases with the numerosity [as mentioned in the assumption (I)], showing that considerable flexibility is permitted for the main features to hold. It would be tempting to explore biologically detailed implementation of the proposed hypothetical mechanism. Examining whether and how single neuronal properties could implement branch-specific nonlinearity [assumption (III)] by using detailed neuron models has been an active research topic (Mel, 1993
; Poirazi et al., 2003a
,b
; Rhodes, 2006
), and the hypothesis that individual dendritic branches can operate as an independent functional unit has been extensively validated (Mel, 2007
). Some of the important natures, such as the effect of inhibition applied onto branches ( Jadi and Mel, 2007
; Cosyne abstract) or the possibility of the existence of multiple functional compartments within a single branch (Major et al., 2008
), however, are continuing to be actively studied. As for the branch-specific plasticity [assumption (II)], there are pioneering modeling studies (Mel, 1993
; Poirazi and Mel, 2001
). However, recent findings and indications such as the involvement of spatially restricted availability of the plasticity-related proteins (Govindarajan et al., 2006
; Harvey and Svoboda, 2007
; Harvey et al., 2008
), branch-specific activity-dependent regulation of potassium channels (Losonczy et al., 2008
), and activity-dependent local BDNF secretion (Tanaka et al., 2008
), have not yet been considered in the model. Before that, whether cooperative plasticity induction among nearby dendritic sites actually occurs in the neocortical regions where numerosity detector neurons exist is expected to be clarified; so far cooperative plasticity induction has been demonstrated in the hippocampus and currently there is no evidence for or against in the neocortex. Effects of homeostatic plasticity (Ibata et al., 2008
; Rabinowitch and Segev, 2006a
,b
, 2008
; Turrigiano and Nelson, 2004
) would also need to be considered. Construction of a realistic detailed model, incorporating all of these, is desired to be addressed in the future, although it is beyond the scope of the present paper. Nevertheless, a previous study using a multicompartment model of pyramidal cell may support the plausibility of the mechanism proposed in this paper. Specifically, it was shown (Mel, 1993
), in a different context from the number selectivity, that the firing activity of the pyramidal cell model was maximized when synaptic inputs are grouped into a certain size of (and thus a certain number of) spatially localized “clusters”, and the “preferred number” (of clusters) varied according to conditions such as the type or the level of dendritic active conductance (see Fig. 7 of Mel, 1993
).
Relationship with the Previously Proposed Hierarchical Circuitry for Numerosity Tuning
I have proposed a hypothetical mechanism of how unimodal tuning for numerosity (Nieder and Merten, 2007
; Nieder and Miller, 2004
; Nieder et al., 2002
) can be shaped through cooperative plasticity induction and nonlinear input integration at nearby dendritic sites, on the basis of the existing proposal (Dehaene and Changeux, 1993
) that individual visual stimuli are represented as similar level of localized activities in a cortical area in the dorsal visual pathway. A previous modeling study (Verguts and Fias, 2004
) demonstrated by simulation that the appropriate connection strengths between the summation clusters and the numerosity detector neurons (Figure 1
A) in the hypothesized hierarchical circuitry (Dehaene and Changeux, 1993
; Verguts and Fias, 2004
) can be acquired by a biologically plausible unsupervised learning algorithm, if the summation clusters exist from the beginning of the simulation. However, they have not demonstrated that the connections from the location map to the summation clusters can also be formed via unsupervised learning; instead, they have shown (Verguts and Fias, 2004
) that the summation clusters can be formed via supervised learning (backpropagation algorithm) if the numerosity detector neurons exist from the beginning. Therefore, so far it has remained unknown whether and how the unimodal tuning of the numerosity detector neurons is developed through plasticity mechanisms from the very beginning (i.e., without assuming that the summation clusters have already been shaped); for which the present study proposed a possible solution. Moreover, as shown above, the proposed model can explain a prominent feature of the numerosity detector neurons, namely, broadening of the tuning curve in proportion to the preferred numerosity (further discussed below). However, tuning curves obtained in the proposed model (Figure 4
D, top, Figures 5
A–Fa and 6
A) were less sharp around the peaks than the reality (Nieder and Miller, 2004
; Nieder et al., 2002
), and thus the proposed mechanism may not operate by itself but rather cooperate with the previously proposed network-based mechanisms (Dehaene and Changeux, 1993
; Verguts and Fias, 2004
). Specifically, it seems possible that initially rough numerosity preference is shaped through the proposed mechanism, and the existence of such numerosity detector “precursor” neurons then facilitate subsequent network-level learning, resulting in generation of neurons having monotonic numerosity tuning (the summation clusters) and sharp unimodal tuning. So far, neurons showing unimodal numerosity tuning (Nieder and Merten, 2007
; Nieder and Miller, 2003
, 2004
; Nieder et al., 2002
) and those showing monotonic numerosity tuning (Roitman et al., 2007
) were observed in different animals doing different tasks. It would be insightful if these two types of neurons are found in a single animal in the future.
Possible Dendritic Contribution to the Weber–Fechner Law in Numerosity Comparison
In the proposed mechanism, broadening of the tuning curve along with the preferred numerosity, which was experimentally observed and proposed to underlie the Weber–Fechner law-dependent accuracy in numerosity estimation and comparison, is naturally accompanied. Specifically, since the tuning curve width is exactly proportional to the preferred numerosity in the extreme case without variability in the input and the threshold (Figure 4
A), the proportionality is expected to still roughly hold after incorporating the variability, as actually confirmed (Figure 4
E). Therefore, the proposed model provides a possible mechanistic explanation of the Weber–Fechner law in numerical comparison. So far two psychological models have been proposed for the Weber–Fechner law, namely, logarithmically compressed representation of number (Dehaene and Changeux, 1993
) and scale-free variability on the linear representation (Brannon et al., 2001
; Gallistel and Gelman, 1992
). They are rather similar, however, in their behavioral predictions (Dehaene, 2001
), and distinguishable almost solely by the shape of the tuning curve; specifically, the shape should be symmetric on the log scale, i.e., asymmetric on the linear scale in the former but symmetric in the linear scale in the latter (Dehaene, 2003
). The experimental results that the tuning curve of the numerosity detector neurons appeared most symmetric in the log scale (Nieder and Merten, 2007
; Nieder and Miller, 2003
) has been proposed to imply the logarithmic representation. Recent behavioral studies in humans (Dehaene et al., 2008
) as well as in monkeys (Merten and Nieder, 2008
) also support the compressed scaling. In the model presented in this paper, the tuning curve becomes most symmetric in the log scale, compared with the linear and power function scales (Figures 4
D,F and 6
B,C,E), if sufficient variability in the input and the threshold or the input convergence from different locations are incorporated (Figures 4
B and 5
). It is therefore suggested that such a variability or input convergence could be a biological substrate of the compressed scaling of the mental number line, although whether and how they can be optimized so that a particular scaling, such as the logarithmic, gives the best symmetry is unclear.
Numerosity-Tuned Persistent Activity
Another important issue regarding the neural basis of numerical cognition is how the activity of some number-selective neurons can sustain after the disappearance of the stimuli with graded preferences to numerosities (Nieder and Miller, 2004
; Nieder et al., 2002
). Although it is very likely that excitatory reverberation plays a crucial role in the neuronal delay activity (Wang, 2001
), sustaining a graded activity is not straightforward, since it corresponds to keeping a state at a neutrally, rather than an asymptotically, stable equilibrium (Brody et al., 2003
; Machens et al., 2005
; Miller et al., 2003
). Interestingly, a previous modeling study (Goldman et al., 2003
) has shown that if each dendritic branch of individual neurons in the network possesses bistability, i.e., capability of remaining at two different levels of activation (Loewenstein and Sompolinsky, 2003
; Wang and Major, 2003
), each neuron can show graded persistent activity depending on how many branches are in the activated state. It would be intriguing to construct a network model incorporating multiple dendritic branches of each neuron (Goldman et al., 2003
; Morita, 2008
) to see if such a model can explain numerosity-tuned transient as well as sustained neuronal activity, and moreover, computation utilizing such activity (Dehaene and Changeux, 1993
).
Experimentally Testable Predictions
In order to experimentally clarify if the mechanism proposed in this paper operates in the actual brain, possibly in combination with the previously proposed network-based mechanisms (Dehaene and Changeux, 1993
; Verguts and Fias, 2004
) as discussed above, it would be useful to examine whether the unimodal numerosity tuning is lost in the absence of inhibition by blocking GABAergic transmission in vivo, because inhibition onto the numerosity detector neurons seems essential in the network-based models (Dehaene and Changeux, 1993
; Verguts and Fias, 2004
) but it is not explicitly required in the proposed dendritic model. It would be probable, however, that the dendritic threshold considered in the proposed model is partly determined by the level of inhibition. In this case, the proposed model would predict that if inhibition is strengthened by applying GABA agonists and thus the threshold is increased, the peak of the tuning curve shifts downward, i.e., the neurons become to prefer smaller numerosities (c.f., Figure 3
). In contrast, if only the network-based mechanism (Dehaene and Changeux, 1993
; Verguts and Fias, 2004
) operates, strengthening inhibition would reduce overall activity of the number-selective neurons but would not shift the peak position of the tuning curve (c.f., Figure 1
A). Another existing model for unimodal numerosity tuning based on oscillations (Miller and Kenyon, 2007
) assumes winner-take-all competition at the final stage, which could be implemented by lateral inhibition similar to what is considered in the network-based models (Dehaene and Changeux, 1993
; Verguts and Fias, 2004
), so that strengthening inhibition is expected not to shift the tuning curve; thus this is also expected to be distinguishable from the proposed model. In order to test the contribution of the proposed model, it would also be interesting to examine whether and how single neuronal properties such as the dendritic morphology or the spike width correlates with the numerosity preference in vivo. Examining the membrane property and the gene expression profile, as well as testing whether disturbing them affects the number selectivity, by in vivo patch-clamp experiments would also be desired.
General Discussion
The notion that individual dendritic branches of neurons can operate as independent compartments in terms of both the function and the plasticity (Govindarajan et al., 2006
; Koch et al., 1982
; Mel, 1993
; Poirazi and Mel, 2001
; Poirazi et al., 2003b
), developed in the theoretical research stream exploring the functional significance of dendrite (Ascoli, 2002
; Koch, 1998
; Koch and Segev, 2000
; Koch et al., 1983
; London and Häusser, 2005
; Mainen and Sejnowski, 1996
; Mel, 1994
, 2007
; Rall, 1964
; Rinzel, 1975
; Segev, 1995
; Segev et al., 1995
; Shepherd, 2003
; Shepherd et al., 1985
), has now acquired a lot of experimental supports (Gasparini et al., 2004
; Harvey and Svoboda, 2007
; Harvey et al., 2008
; Larkum and Nevian, 2008
; Losonczy and Magee, 2006
; Losonczy et al., 2008
; Milojkovic et al., 2005
; Morita, 2009
; Nevian et al., 2007
; Polsky et al., 2004
; Schiller et al., 2000
; Wei et al., 2001
). Not only suggested as a possible source of rich general computational power, dendritic compartmentalization of pyramidal cell has been proposed to play specific roles in particular cortical functions, such as translation-invariant orientation tuning (Mel et al., 1998
) or binocular disparity (Archie and Mel, 2000
). In the light of these latter works, the present study proposes a novel role of the compartmentalized dendrite in numerical cognition with novel insights into the issues raised therein, so as to postulate that single neuron property can directly contribute to abstract cognitive processes. The possibility that the same function can potentially be implemented either by a single neuron or by a network through similar self-organizing principles at two different scales (Morita, 2009
) sounds redundant, and this may reflect evolutional processes that must have endowed biological systems with robustness. I would like to propose a more specific relationship between these two scales. Lower animals typically have a relatively small number of neurons each of which has a highly specialized function and thus is wired in a very specific way whereas higher animals possess much more neurons that would be less specialized and wired in a less specific manner. Given that ontogeny recapitulates phylogeny (Haeckel, 1866
), however, it is conceivable that even in higher animals, individual neurons originally acquire highly specialized functions through single neuronal dendritic plasticity mechanisms in early stages of development, and such an individuality of single neurons will then facilitate the formation of functional circuits, which might otherwise be unrealistically difficult to be organized.
Model Details
The basic architecture of the model is described in the Section “Model”, Figures 1
B and 3
. Neurons were assumed to have 50 dendritic branches in most simulations unless otherwise described. This value was chosen because it is in line with a study using a detailed model with a real morphology of the pyramidal cell (Poirazi et al., 2003b
), which indicated that several dozen long thin terminal branches comprise independent nonlinear input integration subunits. I have confirmed that the main features of the model remain unchanged when 30 or 100 branches are assumed (see Figures 5
E,F, respectively). In the simulations other than those for Figure 6
, the magnitude of the input from a single localized activity in the location map to a single dendritic branch of the numerosity neuron was assumed to be distributed according to a normal distribution with the mean μ = 1/N, where N represents the numerosity of visual stimuli, and thus the summation of the inputs from all the localized activities was constant except for the variability. In the case of Figure 6
, I assumed  , whereby the sum of the squares of the localized activities was constant except for the variability. The standard deviation per mean was set to 0 (i.e., no variation; Figures 3
, 4
A and 5
B middle and bottom), 0.2 (Figure 5
A), 0.25 (Figure 6
), 0.4 (Figure 4
B top and Figure 5
C), or otherwise, 0.3. The dendritic threshold of individual neuron was assumed to be distributed according to a normal distribution. The standard deviation per mean was assumed to be 0 (i.e., no variation; Figures 3 and 4
A,B top and bottom), 0.2 (Figure 5
A), 0.25 (Figure 6
), 0.4 (Figure 5
C), or otherwise, 0.3. The mean of the dendritic thresholds of individual neurons over branches was set to 0.3 (Figure 3
A); 0.6 (Figure 3
B); 0.36 (light blue), 0.24 (green), and 0.15 (red) in Figures 4
A,B. Regarding the large scale simulations (Figures 4
D–F, 5 and 6
), the mean was determined so that the number of neurons maximally tuned for each numerosity becomes roughly comparable. Specifically, approximate levels of the threshold to make a neuron tuned to the numerosities 1 ∼ 30 were at first estimated by a preparatory small-scale simulation. Then the relationship between the preferred numerosity and the threshold was fitted by a smooth function, as shown in black lines in Figures 7
A,B for the cases where the summation of the localized activities, or the sum of their squares, was normalized, respectively. Thereafter, evenly spaced 3,000 points from 0.51 to 30.50 (i.e., 100 points centered at each of the tested numerosities 1 ∼ 30) were transformed by those functions, and the resulting values were used as an expected mean threshold value of 3,000 neurons, i.e., deviation obeying independent normal distribution was added to generate actual threshold value for each branch (see above). Red points and error-bars in Figures 7
A,B indicate means and standard deviations of the individual neuron’s mean threshold value (over branches) over neurons tuned for each numerosity in the simulations shown in Figures 4
D–F and 6
, respectively. Number of neurons maximally tuned for each numerosity is shown in Figures 7
C,D; the number was comparable for any numerosity, as expected from the above procedure. Note that the relationship between the dendritic threshold and the preferred numerosity is rather steep for small numerosities [and it is steeper in the case where the summation of the localized activities was normalized (Figure 7
A) than in the case where the sum of squares was normalized (Figure 7
B)]. Therefore, if the threshold were assumed to be uniformly distributed over the same range, there must have emerged a gradient in the number of neurons tuned for each numerosity, i.e., there were expected to exist more neurons tuned for small numerosities than those tuned for large numerosities. It would be intriguing if this could be related to the experimental observation that there was an overrepresentation of neurons preferring small numerosities (Nieder and Merten, 2007
), although there is little biological reason to assume that the dendritic threshold is uniformly distributed. In the analysis of the goodness of fit for the tuning curves (see below), average was first taken for each numerosity, before being averaged over numerosities, and thus, the number of neurons tuned for each numerosity does not have a direct effect. Input corresponding to each localized activity in the location map was randomly assigned onto a single dendritic branch without convergence (in Figures 3 and 4
A,B top and middle, Figures 5
B and 6
) or with convergence of up to 3 times (Figures 4
B bottom, D–F and 5
A,C,E,F) or up to 5 times (Figure 5
D).
, whereby the sum of the squares of the localized activities was constant except for the variability. The standard deviation per mean was set to 0 (i.e., no variation; Figures 3
, 4
A and 5
B middle and bottom), 0.2 (Figure 5
A), 0.25 (Figure 6
), 0.4 (Figure 4
B top and Figure 5
C), or otherwise, 0.3. The dendritic threshold of individual neuron was assumed to be distributed according to a normal distribution. The standard deviation per mean was assumed to be 0 (i.e., no variation; Figures 3 and 4
A,B top and bottom), 0.2 (Figure 5
A), 0.25 (Figure 6
), 0.4 (Figure 5
C), or otherwise, 0.3. The mean of the dendritic thresholds of individual neurons over branches was set to 0.3 (Figure 3
A); 0.6 (Figure 3
B); 0.36 (light blue), 0.24 (green), and 0.15 (red) in Figures 4
A,B. Regarding the large scale simulations (Figures 4
D–F, 5 and 6
), the mean was determined so that the number of neurons maximally tuned for each numerosity becomes roughly comparable. Specifically, approximate levels of the threshold to make a neuron tuned to the numerosities 1 ∼ 30 were at first estimated by a preparatory small-scale simulation. Then the relationship between the preferred numerosity and the threshold was fitted by a smooth function, as shown in black lines in Figures 7
A,B for the cases where the summation of the localized activities, or the sum of their squares, was normalized, respectively. Thereafter, evenly spaced 3,000 points from 0.51 to 30.50 (i.e., 100 points centered at each of the tested numerosities 1 ∼ 30) were transformed by those functions, and the resulting values were used as an expected mean threshold value of 3,000 neurons, i.e., deviation obeying independent normal distribution was added to generate actual threshold value for each branch (see above). Red points and error-bars in Figures 7
A,B indicate means and standard deviations of the individual neuron’s mean threshold value (over branches) over neurons tuned for each numerosity in the simulations shown in Figures 4
D–F and 6
, respectively. Number of neurons maximally tuned for each numerosity is shown in Figures 7
C,D; the number was comparable for any numerosity, as expected from the above procedure. Note that the relationship between the dendritic threshold and the preferred numerosity is rather steep for small numerosities [and it is steeper in the case where the summation of the localized activities was normalized (Figure 7
A) than in the case where the sum of squares was normalized (Figure 7
B)]. Therefore, if the threshold were assumed to be uniformly distributed over the same range, there must have emerged a gradient in the number of neurons tuned for each numerosity, i.e., there were expected to exist more neurons tuned for small numerosities than those tuned for large numerosities. It would be intriguing if this could be related to the experimental observation that there was an overrepresentation of neurons preferring small numerosities (Nieder and Merten, 2007
), although there is little biological reason to assume that the dendritic threshold is uniformly distributed. In the analysis of the goodness of fit for the tuning curves (see below), average was first taken for each numerosity, before being averaged over numerosities, and thus, the number of neurons tuned for each numerosity does not have a direct effect. Input corresponding to each localized activity in the location map was randomly assigned onto a single dendritic branch without convergence (in Figures 3 and 4
A,B top and middle, Figures 5
B and 6
) or with convergence of up to 3 times (Figures 4
B bottom, D–F and 5
A,C,E,F) or up to 5 times (Figure 5
D).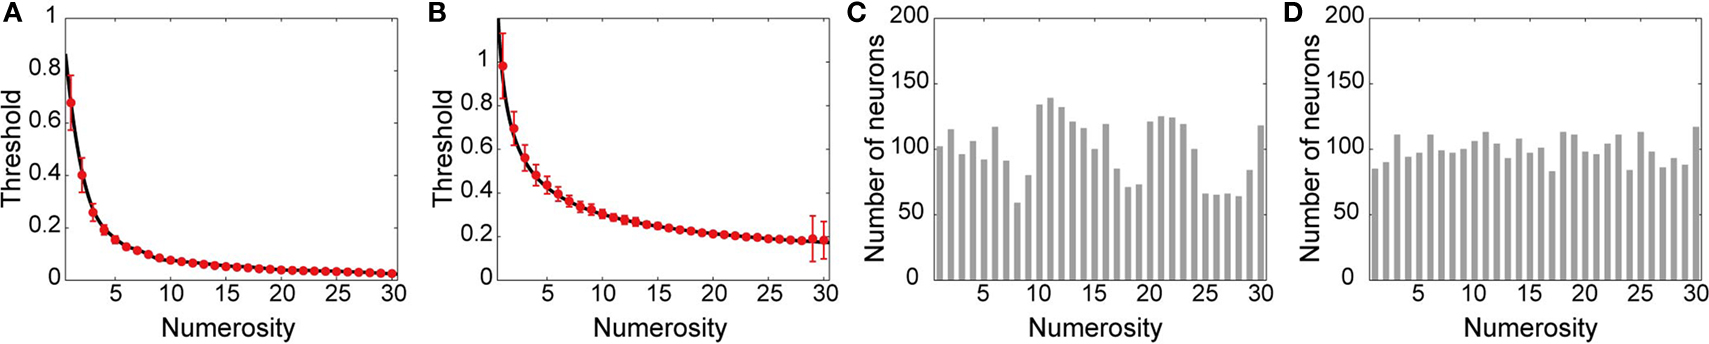
Figure 7. Dendritic threshold and number of neurons tuned for each numerosity. (A,B) Dendritic threshold of neurons maximally tuned for each numerosity in the cases where the summation of the localized activities in the location map (A), or the sum of their squares (B), was normalized, respectively. Black lines indicate functions to fit the relationship between the preferred numerosities and the thresholds obtained from a preparatory small scale simulation. Evenly spaced 3,000 points from 0.51 to 30.50 were transformed by those functions, and the resulting values were used as an expected mean threshold value of 3,000 neurons (deviation obeying independent normal distribution was added to generate actual threshold value for each branch; see Model details). Red points and error-bars in (A) and (B) indicate means and standard deviations (over neurons) of the average threshold value (over branches) for neurons maximally tuned for each numerosity used in the simulations shown in Figures 4
D–F and in Figure 6
, respectively. (C,D) Number of neurons maximally tuned for each numerosity in the simulations shown in Figures 4
D–F (C) and in Figure 6
(D).
Simulations and Analyses
Numerical simulations were performed by MATLAB (The Mathworks, Natick, MA, USA), using the built-in pseudo random number generating functions (“randn” and “randperm”). For each (simulated) neuron with a particular set of dendritic thresholds, 100 different sets of the input magnitudes for each of the numerosity 1 ∼ 30 were applied, and the mean activity of the neuron to each numerosity (over the input sets) was calculated to obtain the tuning curve. The tuning curve was then normalized, for each neuron, by setting the maximum (mean activity for the most preferred numerosity) as 100% and the minimum (mean activity for the least preferred numerosity) as 0%, in the same way as done in the experimental studies (Nieder and Merten, 2007
; Nieder and Miller, 2003
). The normalized tuning curves for neurons having the same preferred numerosity, out of the 3,000 neurons (see above), were then averaged for each numerosity (1 ∼ 30); this “population average tuning curve” was plotted, with the standard deviation, in the figures (Figures 4
D, 5
A–Fa–c and 6
A–C). Gaussian functions were fitted to the population average tuning curves plotted in four different scales, namely, a linear scale, a power function with exponent of 1/2, a power function with exponent of 1/3, and a logarithmic scale, by minimizing the mean squared error according to the Nelder–Mead method by using “fminsearch” function of MATLAB. The goodness of fit was defined as 1 – SSE/SST, where SST was the sum of squares total and SSE was the sum of squared errors. Since the fitting procedure was not appropriately converged for the numerosity 1, or for 1 and 2, in some cases, these date were not plotted in the figures nor used to calculate the linear regressions in Figure 4
E top, Figures 5
A–Fd and 6
D (dashed lines) and the goodness of fit in Figures 4
F, 5
A–Fe and 6
E. Specifically, data for the numerosity 2 ∼ 30 were plotted and used in the case of the linear scale in Figures 4
E,F and 5
B,D,E and the case of the nonlinear scales in Figures 5
C,F and 6
; data for 3 ∼ 30 were plotted and used in the case of the linear scale in Figures 5
C,F and 6
; otherwise, all the data for 1 ∼ 30 were plotted and used.
The author declares that the research was conducted in the absence of any commercial or financial relationships that could be construed as a potential conflict of interest.
This work was supported by Grant-in-Aid for Young Scientists (B) 19700310 from Ministry of Education, Culture, Sports, Science and Technology, Japan.