 Rui Zhang1
 Shengyou Yang
- 1Jinan-Qingdao High-speed Railway, Jinan, China
- 2School of Qilu Transportation, Shandong University, Jinan, China
- 3School of Civil Engineering, Shandong University, Jinan, China
In recent years, the continuous increase in the speed of high-speed trains has led to growing concern about noise generated by train operations. Currently, three types of sound barriers are commonly used: fully enclosed, semi-enclosed, and vertical. The effectiveness of noise reduction due to complex aerodynamics in higher-speed trains remains unclear and requires further research. This article employs ANSYS Fluent fluid software to establish a full-scale three-dimensional numerical model that simulates the wind tunnel test of a train traveling at a speed of 350 km/h. The noise distribution in the section with the largest noise source is analyzed in COMSOL using the method of line sound source comparison. Additionally, we investigate the noise reduction efficiency of various types and sealing degrees of sound barriers concerning aerodynamic noise. The results indicate that the fully enclosed sound barrier provides the best noise reduction across all frequency ranges, followed by the vertical sound barrier, which offers the second-best noise reduction effect. For high-frequency noise, a higher sealing degree of the sound barrier correlates with improved noise reduction. In highly sensitive areas, priority should be given to fully enclosed sound barriers, followed by vertical sound barriers.
1 Introduction
With the large-scale expansion of the global high-speed railway network and significant advancements in train system dynamics performance, the continuous acceleration of modern high-speed trains has become an important trend in the field of rail transit. As a result, research has increasingly focused on the mechanisms and control of noise pollution at speeds above 300 km/h. Research indicates that when a train’s operating speed exceeds the critical threshold of 300 km/h, its noise contribution undergoes a substantial change: aerodynamic noise becomes more prominent in the overall sound profile, accounting for over 50% of the total sound pressure level, ultimately surpassing wheel-rail noise as the dominant source of noise with a noticeable difference 5.76% (Ding, 2024). This broadband noise, caused by aerodynamic effects, exhibits significant characteristics of long propagation distance and wide spectral coverage. When the train reaches a speed of 350 km/h, the sound pressure level at a distance of 12 m from the track can reach 82 dB (A) or more (Lu et al., 2017). It not only creates resonance in the train carriage’s interior, significantly reducing passenger comfort but also leads to continuous sound pollution within 200 m of the railway. Prolonged exposure to noise levels above acceptable limits can result in negative effects on human health problems (Kumar and Lee, 2019). To tackle this issue, sound barriers are extensively utilized as the primary method for reducing noise, with ongoing research related to their effectiveness deepening (Lichtneger and Ruck, 2015; Carassale and Brunenghi, 2013; Quinn et al., 2001; Zheng and Wang, 2009; Zhou et al., 2013; Zhao et al., 2015; Li and Tian, 2012; Xiang et al., 2015).
As a key facility for controlling noise propagation in rail transit, sound barriers primarily reduce noise by blocking the path of sound waves. Their design must comprehensively consider acoustic performance, structural strength, and economy (Chen et al., 2024). The current engineering applications primarily use three structural forms: vertical, semi-enclosed (inverted L-shaped), and fully enclosed. Among these, the fully enclosed type offers the best noise reduction efficiency, but it also has the highest construction cost and needs to be selected and optimized based on the level of noise sensitivity in the areas.
Regarding the distribution of aerodynamic noise sources specific to high-speed trains, research has revealed that they mainly occur in the bogie area (turbulent separation effect), the nose tip of the train (airflow impact zone), and the train’s wake area (vortex shedding) phenomenon) (Zhang et al., 2022). The distribution characteristics of this noise source impose specific requirements for the geometric design of sound barriers, particularly emphasizing the need to concentrate on the bottom absorption structure of the sound barrier for near-field noise control in the bogie area.
Notable advancements have been made in traditional wind tunnel testing and acoustic array technology, with Nagakura pinpointing major sources of aerodynamic noise, including pantographs and vehicle body connectors, using Lighthill’s acoustic analogy theory (Zhang, 2012; Nagakura, 2006; Kitagawa and Nagakura, 2000; Zheng and Li, 2011; Gao et al., 2013). Nonetheless, there are limitations to real vehicle testing due to high costs and lengthy duration, which can be effectively mitigated by numerical simulation methods that develop detailed models. Yuan and Li (Yuan and Li, 2013) demonstrate that a computational model incorporating both head and tail trains provides a more precise characterization of the vehicle’s surface sound power distribution, achieving nearly a 12% reduction in error compared to models that feature only the head train. Additional research (Yang and Yang, 2012) introduced the concept of the intermediate vehicle unit, revealing that a multi-vehicle coupling model considerably enhances the predictive accuracy of vortex-induced noise at the vehicle body connections. These findings lay a strong methodological groundwork for the numerical simulation of aerodynamic noise. However, most current studies have concentrated on speeds below 350 km/h, and there is a lack of systematic investigations into the coupled effects of various sound barrier structures- like fully enclosed and inverted L-shaped barriers- on high-speed aerodynamic noise. This gap highlights the central focus of this study.
Currently, research on aerodynamic noise primarily focuses on speed levels below 350 km/h and examines the types of models for the noise reduction efficiency of sound barriers. There is relatively little research on the aerodynamic noise characteristics of noise sources in various sound barriers for high-speed trains traveling at 350 km/h. To explore the noise reduction mechanisms of different types of sound barriers for high-speed trains and compare their noise reduction efficiency, this paper employs numerical simulation methods to study the aerodynamic noise characteristics of high-speed trains operating at 350 km/h.
2 Noise attenuation mechanism of noise barriers
A sound barrier is an engineering structure designed to diminish noise by controlling how sound waves travel. Typically, its main framework consists of composite materials that serve both sound insulation and absorption purposes. As sound waves interact with sound barriers, three key physical phenomena take place: diffraction, transmission, and reflection, illustrated in Figure 1. This interaction significantly attenuates sound energy, ultimately resulting in a reduced sound pressure level at the receiving point. Notably, high-frequency sound waves tend to diffract around the barrier’s edge due to their shorter wavelength, causing their energy to diminish geometrically as the distance of propagation increases.
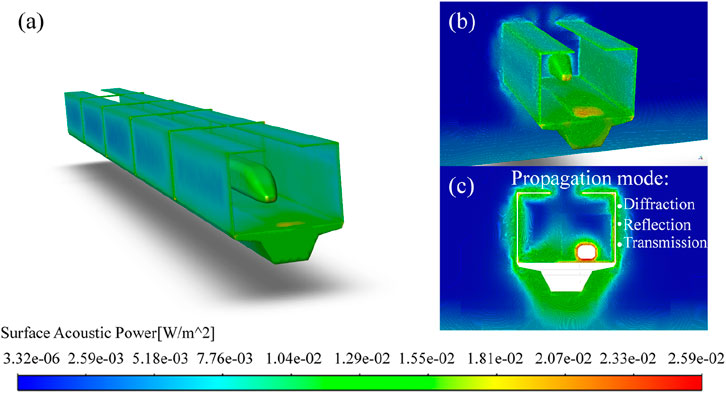
Figure 1. Schematic diagram of acoustic propagation: (a) A three-dimensional view of the surface acoustic power distribution when a train passes through a sound barrier. (b) A three-dimensional view of the surface acoustic power distribution for a selected local cross-section. (c) A front view of the surface acoustic power distribution for a chosen cross-section. The acoustic propagation modes can be categorized into three types: diffraction, reflection, and transmission.
The sound insulation capabilities of barrier materials effectively limit the transmission of sound waves. Meanwhile, a sound-absorbing surface layer transforms incoming sound energy into thermal energy via a porous design, which helps diminish the cumulative impact of secondary sound reflections. This mechanism results in two distinct areas in the sound field behind the barrier: the sound brightness area, situated outside the barrier’s geometric shielding range, where sound pressure reduction is primarily influenced by air absorption. Conversely, the sound shadow area, located on the noise-back side of the barrier, is crucial for protecting noise-sensitive targets due to the combined effects of diffraction attenuation and transmission suppression. This differentiation in the sound field forms a theoretical foundation for refining the geometric parameters and selecting materials for sound barriers.
3 Numerical methods
The curved wall surface of the train introduces some distortion in the calculations when using the standard k-ε turbulence model for flow on curved walls. This paper employs the Realizable k-ε turbulence model, which is accurate, efficient, and highly applicable, to numerically simulate the aerodynamic noise and vibration noise generated by fluctuating wind pressure loads acting on the train surface within the flow field. The equation for the Realizable k-ε turbulence model is as follows (Wang, 2022):
The Realizable k-ε model shown in (Equations 1, 2) introduces constraint terms into the equation to prevent negative positive pressure caused by excessive time-averaged strain rates, ensuring that the solution adheres to the flow law. Additionally, incorporating quantities related to rotation and curvature into the equation is more appropriate for addressing flow models such as rotational flow and mixed flow.
The Broadband Noise Source Model serves to forecast and assess the noise radiation features of various engineering and environmental noise sources. Broadband noise consists of sound exhibiting a consistent spectral distribution over a specific frequency range. This model is founded on the Lighthill acoustic analogy theory from aeroacoustics and employs the statistical attributes of turbulence to characterize the vortex motion and acoustic radiation traits of the noise source by correlating the turbulent flow field with the acoustic field. Frequently utilized for preliminary noise predictions, the broadband noise source model offers the benefits of high efficiency and rapid computation.
In simulating high-speed train operations, it's essential to use broadband noise source models under conditions of uniform isotropic turbulence, a high Reynolds number, and a low Mach number. The calculation models used in this article are shown in (Equations 3, 4)
where
To enhance computational efficiency, a comparative method was implemented: a train wind tunnel simulation was performed in ANSYS Fluent to obtain the surface acoustic power of the train. This equivalent sound power was used to establish a linear sound source, calculate the noise intensity at monitoring points in COMSOL Multiphysics, compare experimental data to assess the accuracy of the simulation, and research the noise reduction efficiency of sound barriers. This calculation model can characterize the noise distribution created when moving through areas with high surface acoustic power, specifically at the train head and its surroundings.
The formula for calculating the sound power of a train is:
The formula for calculating the power of a linear sound source is:
The formula for calculating the total sound pressure level is:
where
4 Computational model and accuracy verification
4.1 Model establishment and boundary conditions
4.1.1 Fluent boundary setting
This article employs the commercial software ANSYS Fluent to simulate wind tunnel tests on trains and capture the surface sound power distribution of the train. According to Liu et al.'s research (Liu et al., 2023), the noise spectrum generated in the bogie area of the train closely resembles the spectrum produced by the entire vehicle model; thus, the whole vehicle model is used for calculation.
It is generally recommended that outdoor high-speed trains use a proportional model to capture the airflow around the train accurately. This article establishes a full-scale computational domain for train wind tunnel test simulation, as shown in Figure 2. The computational domain size of this study exceeds the requirements specified in the CEN European Standard (EN14067-6, 2010).
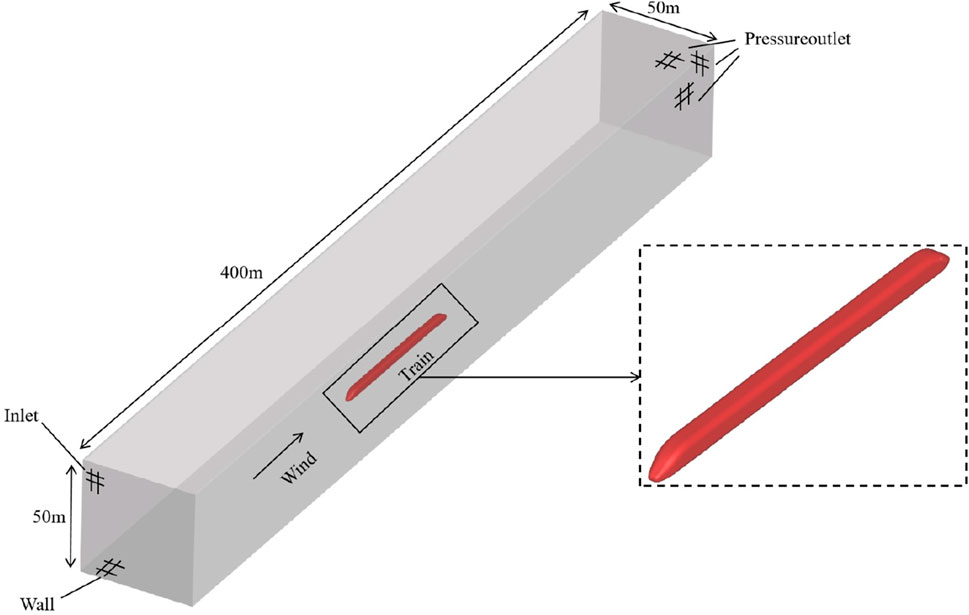
Figure 2. Computational domain and boundary conditions.
To enhance computational efficiency in CFD numerical simulation, we simplified the high-speed train structure: the surface of the high-speed train is treated as completely smooth, disregarding structural details such as windows, doors, and bogies. We streamlined the connections between the trains while maintaining representative aerodynamic shapes. The train model is developed based on the surface parameters of CRH380A, with dimensions set to 3.38 m wide, 3.70 m high, and a total length of 74.28 m (Li et al., 2009).
To verify the accuracy of numerical simulations and establish a numerical model consistent with wind tunnel tests, tests were conducted in the 5.5 m × 4.0 m acoustic wind tunnel 3/4 opening test section at the Low Speed Aerodynamics Research Institute of the China Aerodynamics Research and Development Center in Mianyang City, Sichuan Province, with a maximum wind speed of 100 m/s. The test section was surrounded by a fully anechoic chamber (Jia et al., 2021). The experimental section utilizes a bottom-mounted floor to simulate the ground, and the model is a 1:8 scaled representation of a high-speed train comprising three cars. The test wind speed is 83.33 m/s.
Boundary conditions: All surrounding walls and the upper surface function as pressure outlets, the ground acts as a non-slip wall, and symmetrical constraints are applied along the perimeter. The wind input velocity is 83.33 m/s, aligning with the experimental conditions.
4.1.2 COMSOL model settings
In COMSOL, it is assumed that the train acts as a line sound source with a length of 74.28. Since the sound power is primarily concentrated at the front of the train, and the height of the point is situated at the windbreak of the front of the train, this problem can be simplified to a two-dimensional issue. The modeling diagram is shown in Figure 3. Point A serves as the noise source, while point B is the monitoring point, which corresponds to the monitoring point’s location at the front of the vehicle as referenced in the data source. The surrounding boundaries are perfectly matched to simulate an infinite field. The sound power of the point source is provided by Fluent results, with the phase set to 0°.
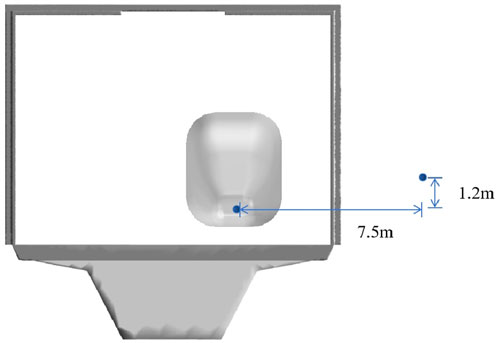
Figure 3. COMSOL computational model.
4.2 Mesh
4.2.1 Fluent mesh
The purpose of Fluent calculation is to determine the sound power level on the vehicle body surface and to refine the grid of the vehicle body surface, with a maximum size of 0.1 m and a minimum size of 0.05 m. The meshing diagram is shown in Figure 4.
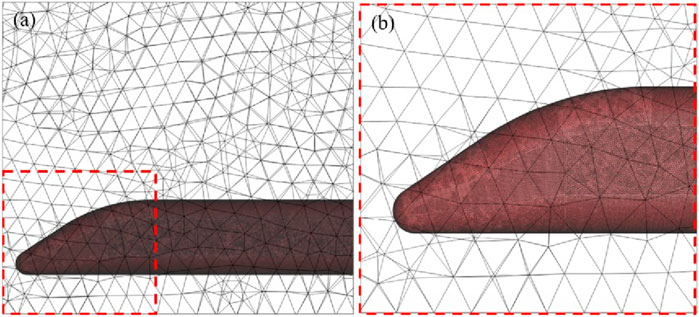
Figure 4. Mesh diagram: (a) Mesh diagram depicting half of the computational domain. The section enclosed by the red dashed line illustrates the local area. (b) Mesh division status of the local area.
4.2.2 COMSOL grid partitioning
Utilize the COMSOL physical field to manage grid division, with a minimum size of 0.001 m. Refer to the meshing diagram of the COMSOL validation model, illustrated in Figure 5.
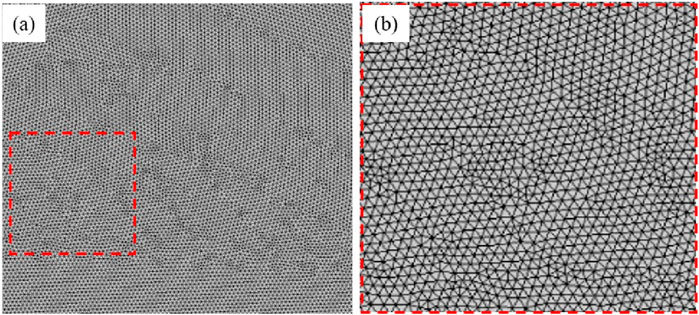
Figure 5. COMSOL validation model mesh partition diagram: (a) Mesh diagram of the computational domain. (b) Local area mesh division situation.
4.3 Solver settings
A fluent solution is established using a steady-state analysis based on an implicit solution method that relies on a pressure basis. The realizable k-ε turbulence model is combined with a wideband noise model for numerical simulation. Given that the train speed exceeds 0.3 Ma, compressibility must be considered; therefore, compressible gas is selected for the analysis. The simple algorithm is utilized for pressure-velocity coupling. A standard discrete format is applied for pressure, while a second-order upwind discrete format is used for convection and dissipation terms. COMSOL calculation is configured for frequency domain research, with a sampling frequency ranging from 0 to 1000 Hz and sampling points at {1, 2, 4, 8, 16, 31.5, 63, 125, 500, 1,000}.
4.4 Simulation accuracy verification
The diagram of the surface sound power level of the train is shown in Figure 6.
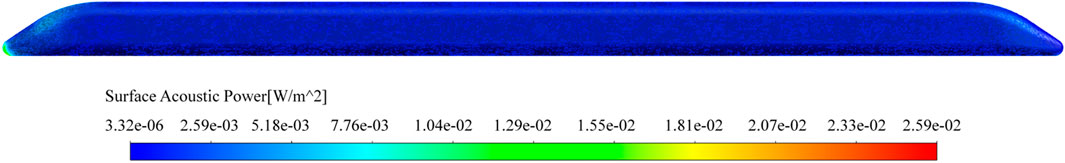
Figure 6. Fluent simulated surface sound power level distributions.
Figure 6 illustrates that the surface sound power level peaks at the front of the train, primarily due to wind turbulence occurring there. This allows for a reasonable simplification of the line noise source at the front. By substituting the calculation results of Fluent into (Equations 5–7), we can obtain that the sound power level derived from integration is 0.53295 W, while the line noise source intensity in COMSOL is 0.0071W/m.
In Figure 7, the sound pressure level at the monitoring point is recorded at 91.27 dB from simulation and 89.83 dB from test data, resulting in a 1.4 dB error which falls within the acceptable range of 2 dB (Liu et al., 2024). The model effectively simulates the noise distribution across the section where the highest surface sound power is measured.
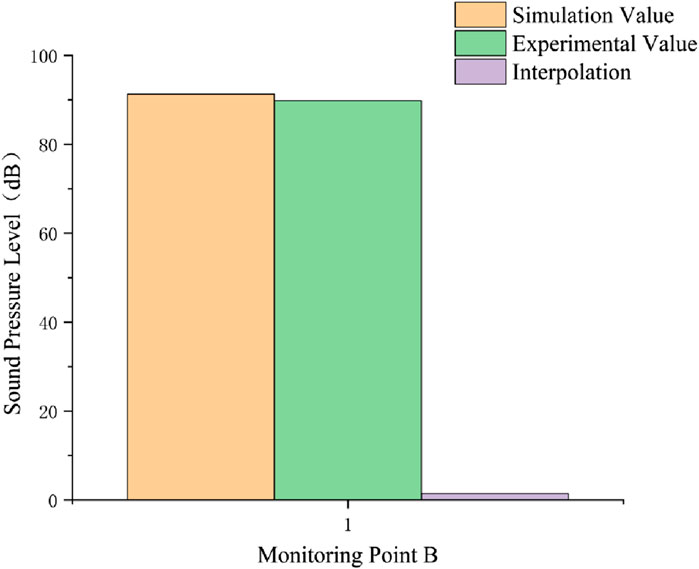
Figure 7. Comparison of simulation results with test results.
4.5 Computational model optimization
In the CFD stage, we extract only the key noise-source distribution generated by the train’s geometry and aerodynamic parameters. This source data is then imported into COMSOL, where a coarser acoustic mesh is utilized for sound-field calculations, avoiding the high cost of employing a very fine acoustic mesh directly in Fluent. During the CFD stage, we apply a fine mesh only in the critical aerodynamic regions surrounding the train while using progressively coarser meshes in far-field areas to reduce the total mesh count without sacrificing aerodynamic fidelity. In COMSOL, we use a high-density mesh only near the sound barrier and in the observation zones; all other regions employ a sparse mesh, which enables faster solution times.
5 Sound barrier noise reduction efficiency study
The surface of the sound barrier was assumed to be flat, neglecting the effects of the complex sound absorption design. Additionally, we simplified the overall track layout by omitting elements such as tracks and track panels. The track section near the sound barrier is regarded as a straight section, without taking into account any track gradient or the train’s interaction with the sound barrier.
The Fluent boundary condition wind speed is 97.2 m/s, and the sound power is measured at 1.2525 W. Without accounting for the interaction between the aerodynamic characteristics of the train and the sound barrier, the power of the COMSOL line source is 0.0167 W/m. The sound barrier material is selected as built-in aluminum. The boundary dimensions of the computational domain of the COMSOL model are 100 m by 40 m.
5.1 Sound barrier modeling and meshing
Types of noise barriers typically include vertical, semi-enclosed, and fully enclosed structures. This study examines six scenarios: no barrier, low-height vertical barrier, high-height vertical barrier, semi-enclosed barrier with two-thirds opening, semi-enclosed barrier with one-third opening, and a fully enclosed barrier. The aim is to evaluate how varying enclosures affect noise distribution. Modeling for these scenarios is depicted in Figure 8, and the layout of monitoring points is displayed in Figure 9. For instance, in the case of the semi-enclosed barrier with one-third opening, the meshing is illustrated in Figure 10. The mesh is created in COMSOL with physics-controlled settings for accuracy and computational efficiency.
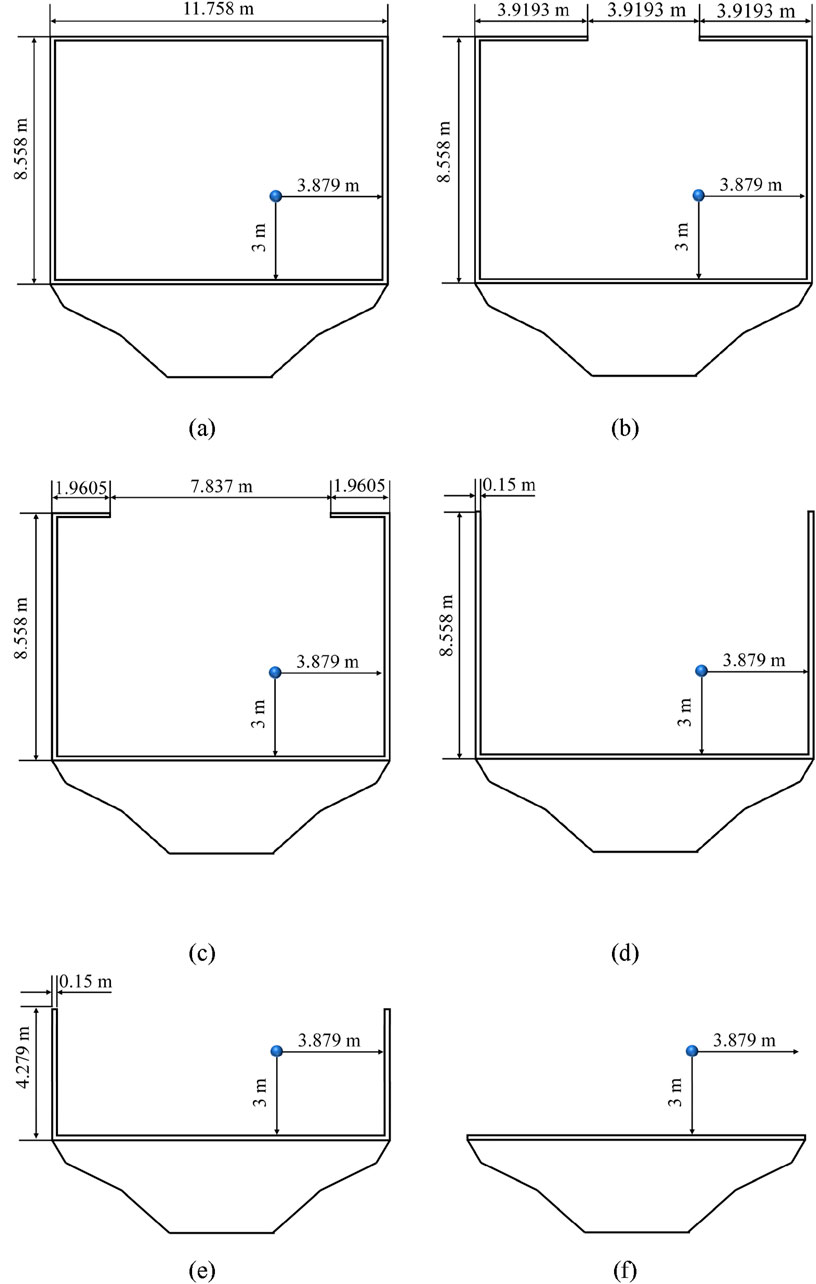
Figure 8. Modeling diagrams of various types of sound barriers: (a) fully enclosed sound barrier; (b) semi-enclosed sound barrier with a 1/3 opening; (c) semi-enclosed sound barrier with a 2/3 opening; (d) vertical sound barrier; (e) vertical sound barrier with a 1/2 height; (f) no sound barrier.
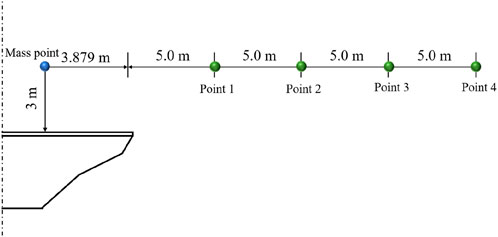
Figure 9. Map of monitoring points.
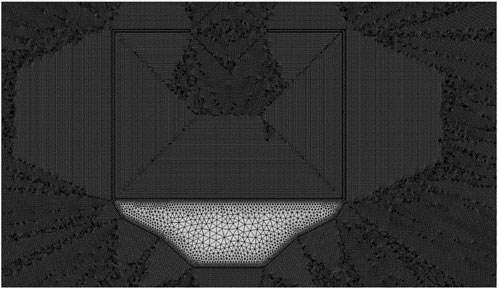
Figure 10. Model meshing diagram (as an example of semi-closed).
5.2 Analysis of results
As shown in Figure 11, the fully enclosed sound barrier exhibits the lowest sound pressure level and the most effective noise reduction at various testing points, achieving a noise reduction of 4.5–6 dB, while the vertical sound barrier follows closely with a reduction of about 4 dB. The six conditions can be categorized into two groups: Group A includes four conditions- no sound barrier, two types of vertical sound barriers, and a fully enclosed sound barrier; Group B consists of two conditions- 2/3-opening semi-enclosed sound barriers and 1/3-opening semi-enclosed sound barriers.
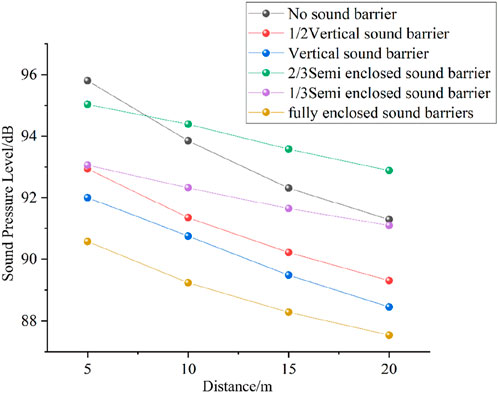
Figure 11. Sound pressure levels at different sound barrier monitoring points.
Comparisons within the two groups demonstrate the following characteristics: 1. Sound pressure level decreases with increasing distance, and this decreasing trend is consistent for all conditions within each group. 2. The noise reduction effect of the barriers improves as the airtightness of the sound barriers increases. A key difference between the two groups is that, as distance grows, the rate of sound pressure level decay varies; specifically, Group A decays faster than Group B, and the noise reduction effect of the barriers also increases with distance.
At distances greater than 10 m, the noise intensity at the monitoring point with 2/3 openings in the sound barrier surpasses the intensity recorded without any barrier. Refer to the curve of sound pressure level versus frequency at monitoring point 2, as illustrated in Figure 12.
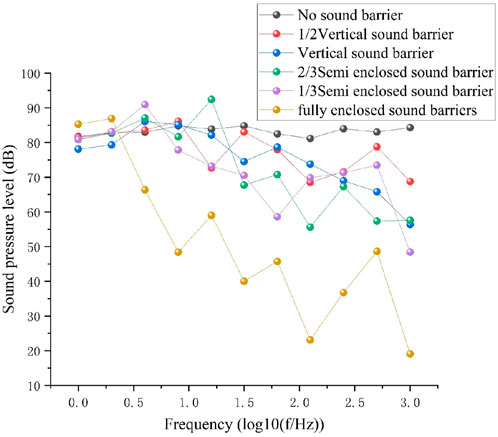
Figure 12. Sound pressure level-frequency diagram for monitoring point 2.
Figure 12 shows that once the frequency surpasses 31 Hz, the sound pressure level for the no sound barrier condition remains the highest across all frequencies. In contrast, the fully enclosed sound barrier condition has the lowest sound pressure level at all frequencies, while the other tested conditions exhibit fluctuations within each frequency range. Notably, in the high-frequency band, the 2/3-opening sound barrier demonstrates better noise reduction than the vertical sound barrier, ranking just after the fully enclosed sound barrier. However, its noise reduction performance in the low-frequency range is less effective, with a recorded level of 91 dB at 16 Hz, resulting in an overall SPL that exceeds those of the other conditions. As frequency increases, the effectiveness of noise reduction shows a positive correlation with the amount of sound barrier confinement, with the ranking of noise reduction at 1,000 Hz aligning with the level of sound barrier confinement.
When examining Figures 13a–f, it is evident that increasing the opening at the top of the sound barrier leads to a significant rise in the distribution of total sound pressure levels. As the degree of noise diffraction grows, the size of the sound shadow area gradually decreases. Noise intensity within this shadow area continues to rise, which is reflected in the cloud map by the warming color of the region to the right of the sound barrier. A fully enclosed sound barrier effectively blocks both direct and top-diffracted sound, resulting in the largest sound shadow area, the lowest total sound pressure level, and the most effective noise reduction. In a semi-closed structure, the top opening allows some noise to escape behind the barrier through diffraction paths, thereby increasing the noise intensity in the sound shadow area and diminishing the shielding effect. This leakage effect becomes particularly pronounced when the opening is large. If the top of the sound barrier is fully open, diffraction at the top emerges as the primary route for noise propagation, significantly reducing the size of the sound shadow area and dramatically increasing the total sound pressure level at the receiving end. To conclude, sealing the top of the sound barrier is crucial for effective noise control. Greater sealing enhances the shielding effect on mid to high-frequency noise, while increased openness results in greater sound wave leakage and weakened noise reduction by the barrier.
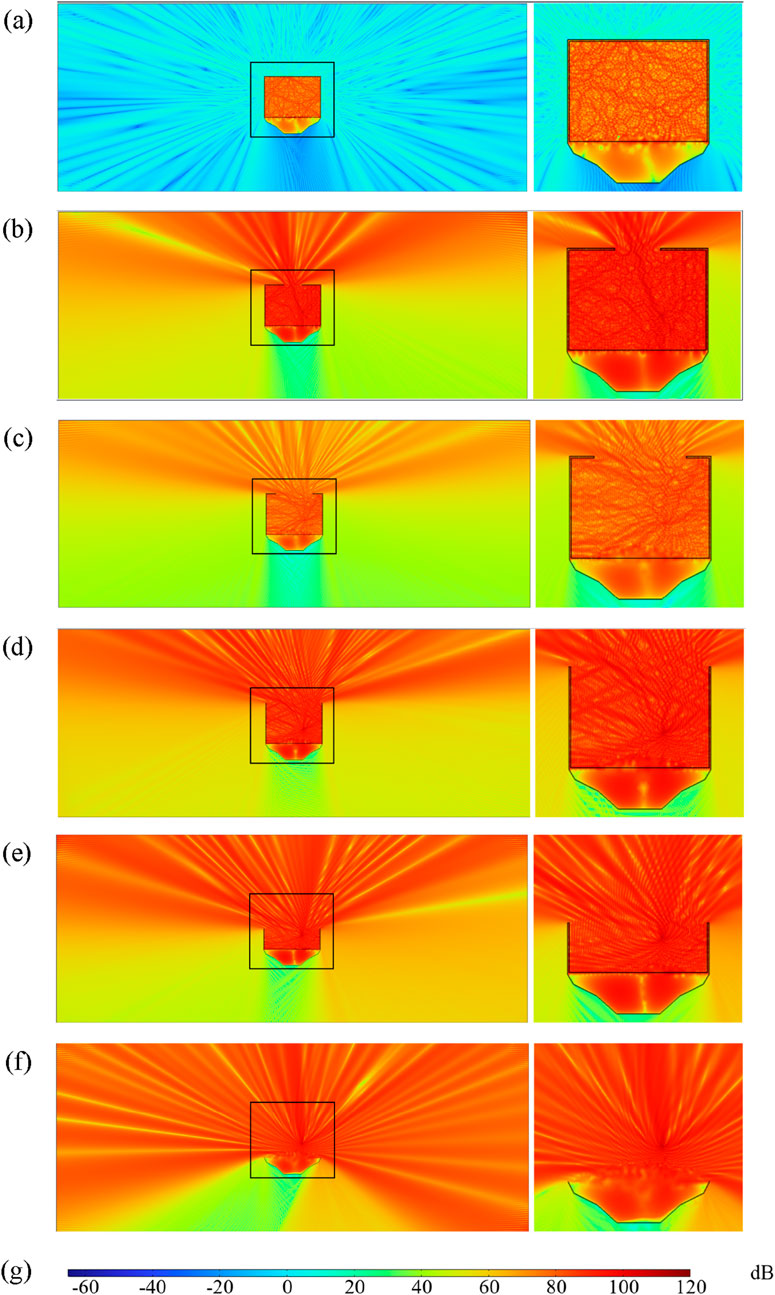
Figure 13. Distribution diagram of sound pressure level at a frequency of 1000 Hz: (a) fully enclosed sound barrier; (b) semi-enclosed sound barrier with 1/3 opening; (c) semi-enclosed sound barrier with 2/3 opening; (d) vertical sound barrier; (e) vertical sound barrier with 1/2 height; (f) no sound barrier; (g) color bar.
6 Conclusion
This article uses ANSYS Fluent to create a detailed 3D numerical model simulating a wind tunnel test for a train at 350 km/h. We analyze noise distribution at the highest source using line sound source comparison in COMSOL and evaluate the noise reduction effect of different sound barriers and seals on aerodynamic noise. Findings indicate:
1. The sound power simulation technique used in this paper effectively models noise distribution in areas where train noise is most intense, significantly enhancing computational efficiency.
2. Among the various models, the fully enclosed sound barrier achieves the highest noise reduction, exceeding 4.5 dB up to 20 m away, followed closely by the vertical sound barrier.
3. In terms of high-frequency noise, a more air-tight noise barrier yields improved noise reduction.
The simulations indicate that the fully enclosed sound barrier provides the highest level of noise reduction, followed by the vertical barrier. However, due to low-frequency noise, greater confinement does not enhance the reduction. Analyzing frequency distribution is crucial when utilizing vertical or semi-enclosed barriers. For trains traveling at 350 km/h, fully enclosed sound barriers with greater noise reduction efficiency are the optimal choice in noise-sensitive areas, even if they are more expensive. In regions where noise is relatively less concerning, it is advisable to use lower-cost vertical sound barriers.
Data availability statement
The original contributions presented in the study are included in the article/supplementary material, further inquiries can be directed to the corresponding author.
Author contributions
RZ: Writing – original draft, Software, Data curation. HL: Conceptualization, Investigation, Writing – review and editing. JY: Writing – original draft, Software. XC: Writing – original draft, Investigation, Data curation. SY: Writing – review and editing, Methodology, Conceptualization.
Funding
The author(s) declare that financial support was received for the research and/or publication of this article. This research was funded by the 2023 Yellow River Basin Collaborative Science and Technology Innovation Project (No. YDZX2023025) and the Taishan Industrial Experts Program (No. tscy20230660).
Conflict of interest
Author RZ, JY, XC was employed by Jinan-Qingdao High Speed Railway.
The remaining authors declare that the research was conducted in the absence of any commercial or financial relationships that could be construed as a potential conflict of interest.
Generative AI statement
The author(s) declare that no Generative AI was used in the creation of this manuscript.
Publisher’s note
All claims expressed in this article are solely those of the authors and do not necessarily represent those of their affiliated organizations, or those of the publisher, the editors and the reviewers. Any product that may be evaluated in this article, or claim that may be made by its manufacturer, is not guaranteed or endorsed by the publisher.
References
Carassale, L., and Brunenghi, M. (2013). Dynamic response of trackside structures due to the aerodynamic effects produced by passing trains. J. Wind Eng. Industrial Aerodynamics 123, 317–324. doi:10.1016/j.jweia.2013.09.005
Chen, X., Pan, Y., Zhou, T., Wu, X., and Liu, L. (2024). Study on dynamic performance testing and evaluation methods of noise barriers for high-speed railways. J. Railw. Sci. Eng. 21 (11), 4395–4404. doi:10.19713/j.cnki.43-1423/u.T20240071
Curle, N. (1995). The influence of solid boundaries upon aerodynamic sound. Proc. R. Soc. Lond. Ser. A. Math. Phys. Sci. 231 (1187), 505–514. doi:10.1098/rspa.1955.0191
Ding, Y. (2024). Study on noise reduction effect and safety of vertical noise barriers for 400 km/h high-speed railways. China Railw. 02, 31–37. doi:10.19549/j.issn.1001-683x.2023.05.23.005
EN14067-6 (2010). Railway applications-aerodynamics. Part 6: requirements and test procedures for cross wind assessment. Brussels: European Committee for Standardization CEN.
Gao, Y., Wang, Y., Wang, J., Shen, Z., and Yang, Z. (2013). Testing study of aerodynamic noise for high-speed train model in aero-acoustic wind tunnel. Tech. Acoust. 32 (6), 506–510. doi:10.3969/j.issn1000-3630.2013.06.013
Jia, S., Zhang, W., Han, T., and Peng, L. (2021). Aerodynamic noise test and simulation analysis of high speed EMU. Appl. Acoust. 40 (04), 611–618. doi:10.11684/j.issn.1000-310X.2021.04.016
Kitagawa, T., and Nagakura, K. (2000). Aerodynamic noise generated by shinkansen trains. J. Sound Vib. 231 (5), 913–924. doi:10.1006/jsvi.1999.2639
Kumar, S., and Lee, H. (2019). The present and future role of acoustic metamaterials for architectural and urban noise mitigations. Acoustics 1, 590–607. doi:10.3390/acoustics1030035
Li, X., Yang, Z., Zhang, J., and Zhang, W. (2009). Aerodynamic performance of high-speed trains in strong winds. J. Transp. Eng. 9 (02): 66–73.
Li, Y., and Tian, H. (2012). Lateral aerodynamic performance and speed limits of double-deck container vehicles with different structures. J. Central South Univ. 19 (7), 2061–2066. doi:10.1007/s11771-012-1245-5
Lichtneger, P., and Ruck, B. (2015). Full scale experiments on vehicle induced transient loads on roadside plates. J. Wind Eng. Industrial Aerodynamics 136, 73–81. doi:10.1016/j.jweia.2014.10.010
Liu, H., Yang, Z., Wu, Y., Gao, J., and Tan, X. (2023). Simulation study on aerodynamic acoustic performance of high-speed trains at 250–400 km/h. J. Railw. Sci. Eng. 20 (09), 3242–3250. doi:10.19713/j.cnki.43-1423/u.T20221924
Liu, R., Li, Z., Wu, X., and Pan, y. (2024). Simulation analysis of flow field structure and aerodynamic noise characteristics in key areas of high-speed trains. China Railw. (06), 1–6. doi:10.19549/j.issn.1001-683x.2024.04.03.007
Lu, W., Yan, W., and Zhang, C. (2017). Numerical simulation of aerodynamic noises in the far field of the high-speed train with considering bogies and connection windshields. J. Vibroengineering 19 (3), 2262–2279. doi:10.21595/jve.2017.18097
Nagakura, K. (2006). Localization of aerodynamic noise sources of Shinkansen train. J. Sound Vib. 292 (3), 547–556. doi:10.1016/j.jsv.2005.08.043
Quinn, A., Baker, C., and Wright, N. (2001). Wind and vehicle induced forces on flat plates—Part 2: vehicle induced force. J. Wind Eng. Industrial Aerodynamics 89 (9), 831–847. doi:10.1016/s0167-6105(01)00071-x
Shih, T., Liou, W., Shabbir, A., Yang, Z., and Zhu, J. (1995). A new k-ϵ eddy viscosity model for high Reynolds number turbulent flows. Comput. fluids 24 (3), 227–238. doi:10.1016/0045-7930(94)00032-t
Wang, Z. (2022). Research on the optimization design of dynamic and acoustic performance of fully enclosed noise barriers. Central South University. MA thesis.
Xiang, H., Li, Y., Wang, B., and Liao, H. (2015). Numerical simulation of the protective effect of railway wind barriers under crosswinds. Int. J. Rail Transp. 3 (3), 151–163. doi:10.1080/23248378.2015.1054906
Yang, Y., and Yang, G. (2012). A numerical study on aerodynamic noise sources of high-speed train. Proc. 1st IWHIR 2, 107–116. doi:10.1007/978-3-642-27963-8_11
Yuan, L., and Li, R. (2013). Aerodynamic noise of high-speed train and its impact. Mech. Eng. Automation 180 (5), 31–35. doi:10.3969/j.issn.1672-6413.2013.05.013
Zhang, J., Wu, Y., Gao, J., Gao, G., and Yang, Z. (2022). Numerical simulation study on aerodynamic acoustic characteristics of high-speed maglev trains. J. Central South Univ. Sci. Technol. 53 (10), 4185–4196. doi:10.11817/j.issn.1672-7207.2022.10.037
Zhang, W. (2012). Study on top-level design specifications of high-speed train. J. China Railw. Soc. 34 (9), 15–19. doi:10.3969/j.issn.1001-8360.2012.09.003
Zhao, H., Zhai, W., and Chen, Z. (2015). Effect of noise barrier on aerodynamic performance of high-speed train in crosswind. Wind Struct. 20 (4), 509–525. doi:10.12989/was.2015.20.4.509
Zheng, S., and Wang, L. (2009). Study on the wind load shape coefficients of railway noise barriers. China Railw. Sci. 30 (4), 46–50. doi:10.3321/j.issn:1001-4632.2009.04.009
Zheng, Z., and Li, R. (2011). Numerical analysis of aerodynamic dipole source on high-speed train surface. J. Southwest Jiaot. Univ. 46 (6), 996–1002. doi:10.3969/j.issn.0258-2724.2011.06.018
Keywords: high-speed railroad, sound barrier, computational fluid dynamics, frequency domain characterization, aerodynamic noise
Citation: Zhang R, Li H, Yang J, Chen X and Yang S (2025) Study on the noise reduction effect of sound barriers on the aerodynamic noise of high-speed trains. Front. Acoust. 3:1616806. doi: 10.3389/facou.2025.1616806
Received: 23 April 2025; Accepted: 11 June 2025;
Published: 07 July 2025.
Edited by:
Yuan He, University of Southampton, United KingdomReviewed by:
Weiguang Yu, East China Jiaotong University, ChinaCheng Gong, East China Jiaotong University, China
Copyright © 2025 Zhang, Li, Yang, Chen and Yang. This is an open-access article distributed under the terms of the Creative Commons Attribution License (CC BY). The use, distribution or reproduction in other forums is permitted, provided the original author(s) and the copyright owner(s) are credited and that the original publication in this journal is cited, in accordance with accepted academic practice. No use, distribution or reproduction is permitted which does not comply with these terms.
*Correspondence: Shengyou Yang, c3lhbmdfbWVjaGFuaWNzQHNkdS5lZHUuY24=