 Marius W. Schäfer
 Giovanni Del Galdo2,3†
- 1Research Center for Sensor Materials and Sensor Systems, Fraunhofer institute for nondestructive testing IZFP, Saarbruecken, Germany
- 2Electronic Measurements and Signal Processing Group, Technische Universität Ilmenau, Ilmenau, Germany
- 3Department for Electronic Measurements and Signal Processing, Fraunhofer institute for integrated circuits IIS, Erlangen, Germany
Introduction: The use of multi-transducer methods and equipment is common in non- destructive testing. These systems and methods provide increased accuracy or even enable test cases that cannot be carried out with single transducer testing. On the downside, these systems significantly increase execution time when the evaluation of a single channel or evaluation of crosstalk to other channels is performed sequentially. As the number of individual channels increases, so does the execution time and the amount of data. This paper presents the theoretical integration and experimental validation of orthogonal spread code sequences for multi-transducer ultrasonic testing.
Methods: The custom-built, two-channel ultrasonic test system and the measurement setup using a 60 mm-wide rectangular specimen are shown. The cross-correlation properties of random binary, random Gaussian and Gold codes, known from GPS, are compared for the code selection.
Results: The Gold codes, the most promising set of codes, are experimentally investigated for suitability. Based on the results, upscaling potential of the method is presented based on a simulation using 9 code sequences summed with a random offset to a single array to replicate a 9-transducer setup. After compensating for the transfer function of the ultrasonic testing system, a localisation accuracy of less than 4 ns is achieved using a polynomial fit and a sampling interval of 8 ns.
Discussion: By incorporating this method into ultrasonic testing, measurement speed can be increased while stability and accuracy are improved.While codes with an amplitude close to the cross-correlation ratio will be difficult to detect, this method can be extended beyond 9 transducers for higher amplitudes, as long as the total amplitude does not exceed the maximum voltage limit of the electronic system.
1 Introduction
Ultrasonic testing is an established technique with a wide range of applications from medical diagnostics to industrial quality control (Honarvar et al., 2013; Yang et al., 2021). In the field of non-destructive evaluation (NDE), many ultrasonic techniques are based on time-of-flight measurements in contact mode. An ultrasonic transducer is coupled to a test object, a stimulation sequence is generated, and one or more backwall echoes are measured. Depending on the application, the time-of-flight provides information on material properties (Periyannan and Balasubramaniam, 2014), material thickness (Zhou et al., 2018), defects (Mitsui et al., 2010), or stress states (Kim and Hong, 2009) in the material. For more complex test cases, the use of multi-transducer methods and equipment becomes more prevalent and important (Teng and Zhou, 2022; Drinkwater and Wilcox, 2006). These systems and methods provide increased accuracy or even enable test cases that cannot be carried out by single-transducer testing (Drinkwater and Wilcox, 2006; Yen and Smith, 2004). On the other hand, if the channels are excited and evaluated sequentially, as presented in Drinkwater and Wilcox (2006), Yen and Smith (2004), Sutcliffe et al. (2012), Laroche et al. (2020), the execution time and the amount of data increase more than linearly with the number of individual channels.
One approach to overcome this shortcoming is to enable parallel processing of the transducer channels, which is possible by implementing excitation signals based on orthogonal codes. This yields the possibility to measure all channels in parallel and yet separate the signals in post-processing.
In communications technology, several approaches have been established to implement orthogonal codes. Some have already been used in ultrasonic testing and will be summarised in the following paragraph. Time division multiple access (TDMA) implements orthogonality based on time slots waiting for the previous ultrasonic signal to fade out, which takes a lot of time as the number of channels increases (Medina et al., 2012; Chen et al., 2019). Frequency Division Multiple Access (FDMA) divides the different channels used in parallel into separate frequency bands (Chen et al., 2019). This can be accomplished by using multiple narrowband or wideband ultrasonic transducers. When using narrowband transducers, channel-to-channel transmission is difficult to achieve, and when using wideband transducers, depending on the number of channels, only a small frequency band per channel is available. Another method used to achieve orthogonality is Code Division Multiple Access (CDMA), where orthogonality is achieved by using different code sequences per channel (Park et al., 2022). There are several ways to embed the code into the ultrasonic signal. In phase shift keying (PSK), frequency shift keying (FSK), and amplitude shift keying (ASK), the code sequence is modulated into the signal by changing the associated attribute in relation to the code value. A change in the code results in a phase shift, a frequency shift, or an amplitude shift. On-Off Keying (OOK) is also a version of ASK used for binary coding where the carrier is either activated or deactivated. As shown in Park et al. (2022), orthogonality is given for single transmissions, but for overlapping signals the evaluation is worse or even impossible.
Direct Sequence Spread Spectrum (DSSS) is a form of CDMA (Kaufman, 2010; Vogt, 2010; Torrieri, 2005), well known from digital communications, in which the code spreading sequence is modulated directly onto the data. Orthogonality is achieved by modulating orthogonal codes on different channels or symbols within a channel using the same frequency band, allowing the decorrelation within the cross-correlation ratio (Torrieri, 2005). In summary, CDMA is best suited to achieve a short transmission time and maintain good accuracy using a large bandwidth in ultrasonic testing. The use of a spreading code expands the transmitted signal in the time and frequency domain depending on the code type and code length. Also, when used for multiple channels, all signals interact with each other, creating crosstalk and reducing noise immunity.
A review of spreading sequences and a classification was presented in Garcia et al. (2015). The advantages of orthogonal sequences in ultrasound diagnostics using Golay codes were discussed in Tasinkevych et al. (2021), Trots et al. (2022), showing improvement in signal-to-noise ratio (SNR), side lobe level and parallel use of at least two transmitters simultaneously, reducing the amount of data and acquisition time by half. Recent studies have tested coded excitation frameworks for multi-transducer ultrasonic testing. Hadamar, chirp and Golay schemes using phase modulation were tested by Tamraoui et al. (2023). Challinor et al. (2024) presented the use of high length TOP-CS sequences introducing orthogonality including matched filtering.
In this paper we present the use of orthogonal spread code sequences for multi-transducer ultrasonic testing. In contrast to previous research, the codes are scaled to a length where the bandwidth of the transducers allows the different pulses to be transmitted and not excite the transients at the edges of the sequences or modulate the code, for example, by phase modulation. When using this approach to transmit the codes in ultrasonic testing, the bandwidth of the ultrasonic transducers is important, because a wide band is required to transmit the digital spread codes. We have previously shown that using the inverse or compensated stimulation of a digital code works well for a maximum length sequence and allows the potential of the auto-correlation function (ACF) of the code sequence to be exploited in the ultrasonic echoes themselves (Schäfer and Fischer, 2024a). In this approach the gain and phase difference across the system bandwith is compensated by the linear transfer function of the testing system.
In the present work, each channel of an ultrasonic system is stimulated using a different spread code, orthogonal to all other channels. The ultrasonic testing system used operates in a fully linear manner as described in Schäfer and Fischer (2024a) and therefore enables high fidelity of the resulting echoes compared to the intended codes.
In total, three different sets of orthogonal codes are compared and the most promising set, the Gold codes, which are commonly used for GPS, are further investigated. A two-channel ultrasonic system is used to test the suitability of the codes, starting with theoretical calculations followed by experimental validation. Based on the results, the extension to more channels is presented in a simulation representing the parallel use of 9 transducers by superposing 9 code sequences with random time offset and amplitude scaling to a single array. Post-processing shows the ability of the codes to be discerned, and demonstrates the potential of this method to be extended to even more parallel channels under certain technical conditions.
2 Materials and methods
2.1 Testing system and measurement setup
The ultrasonic testing system consists of custom designed electronics and two ultrasonic transducers, as shown in Figure 1. This ultrasonic testing system exhibits linear behavior, which is achieved by building the output stage using operational amplifiers to drive the transducers in differential mode, as shown in Schäfer and Fischer (2024a). The system includes an arbitrary signal generator based on two 2048-element look-up tables and a data acquisition section for recording the ultrasonic echoes.
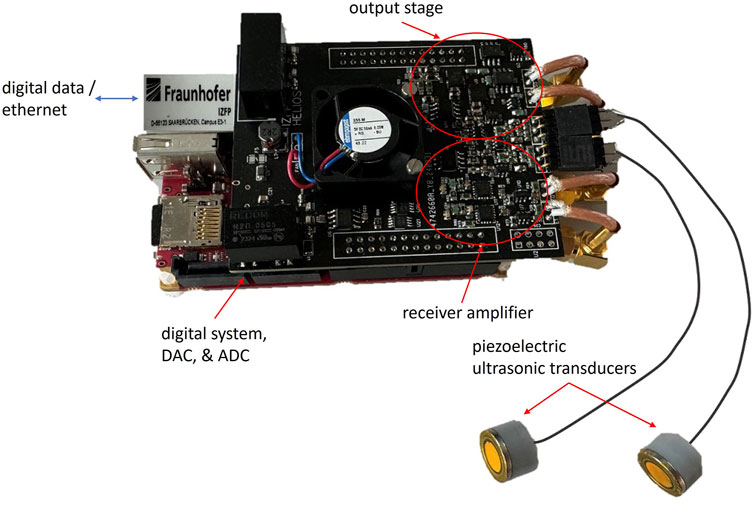
Figure 1. Custom-built ultrasonic testing system at the IZFP with two ultrasonic transducers. The length of the cables is adjusted schematically to improve the clarity of the figure.
The ultrasonic transducers are made of the 3:1 piezoelectric composite of PZ29 (ferroperiopiesoceramics) and araldite (araldite, Aradur HY 956) with a damping layer of AL2O3 (10
The transducers are connected in a fully differential manner to the output stage and to the receiver amplifier. The measurements were made in pulse-echo mode, where the transducers emit an acoustic wave that propagates through the test object. The wave is reflected at the back wall of the object and travels back to the transducers (Schäfer et al., 2021; Krautkrämer and Krautkrämer, 1983). The transducers are switched to receiver mode and the ultrasonic signals are amplified and digitized. This is followed by data processing and spectral analysis of the ultrasonic signals in relation to the stimulation sequences.
For the different experimental evaluations, a steel block with a thickness of 60 mm was equipped with two transducers with an orientation of 180
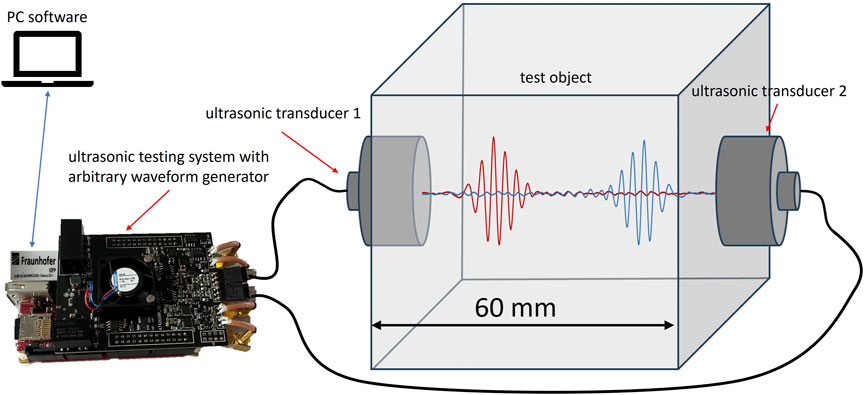
Figure 2. Schematic display of the test setup. The transducers are placed in a 180
2.2 Code selection
Several sets of codes with orthogonal characteristics are mentioned in the literature, e.g., pseudo-noise sequences, Gold sequences, Kasami sequences, Kerdock codes and Walsh sequences (Yang et al., 2000; Mollah and Islam, 2012; Ziani and Medouri, 2012). The Gold codes are sets of sequences generated by combining two maximum length sequences (or pseudo-random bit sequence) with different seeds using shift registers. The number of sequences and the normalised cross-correlation between the sequences depends on the length of the maximum length sequence. The correlation properties of the resulting Gold codes also depend on the properties of the two sequences. To generate the best performing set of sequences, the preferred pairs are chosen as mentioned in the literature (Mollah and Islam, 2012).
To generate the Gold codes in this work, sequences with 6 linear-feedback shift register (LFSR) elements are used, resulting in a set of 63 Gold codes. Combined with the two initial sequences, 65 orthogonal sequences are available. The number of channels that can be used in parallel depends on the set of codes chosen. With 65 orthogonal codes in the set, 65 potential parallel channels could be used. Increasing the code length also increases the number of codes in the set. Using 11 LFSR elements would result in 2049 orthogonal sequences and a code length of 2047.
As an alternative to the Gold codes, and to compare the correlation properties, two other sets of codes are also generated and compared. These are random binary sequences and random Gaussian sequences. For both sets, the orthogonality of the sequences comes from the natural property of randomness. They are generated with random numbers that follow an equal distribution and a normal distribution for random binary sequences and random Gaussian sequences, respectively.
The cross-correlation performance of the Gold codes and the random binary sequences is shown in Figure 3 and the summary of the results for all three sequences is given in Table 1. The random Gaussian sequences show similar behavior to the random binary sequences and are therefore not shown in the figure. The Gold codes show less deviation in the correlation matrix compared to the random binary sequences. The average cross-correlation maximum is comparable for all three sets at around 25%–26%. However, the absolute maximum of the CC indicates that for random binary and random Gaussian some sequences have a much higher similarity than 50%, while for Gold codes any cross-correlation is about 15% less.
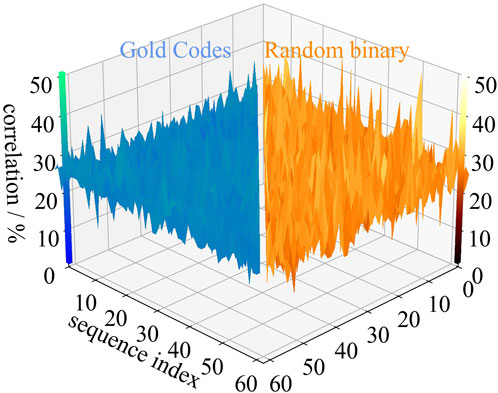
Figure 3. Maximum of the cross-correlation of the generated code sets for Gold codes (left) and random binary (right). The average cross-correlation is almost the same, while the maximum and the deviation are higher for the random binary sequences. For better visibility, the maximum of the auto-correlation of the codes (always 100%) in the diagonal is not shown.
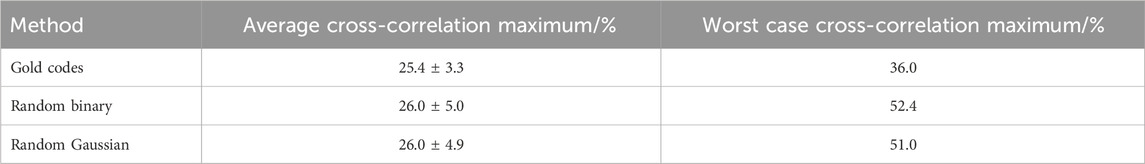
Table 1. Maximum evaluation of the cross-correlation (CC) for the different code sets. The average cross-correlation maximum is given including the standard deviation. While the average cross-correlation is almost the same for all three methods, the standard deviation for the Gold codes is smaller, as is the maximum correlation between the codes in the set.
Based on the comparison, the Gold codes offer the most promising properties and this set of codes will be further explored in the following work.
In Section 3.3, different codes from the Gold code set are selected and summed to an array, applying a random shift between 0 and 8000 ns and multiplying by a random amplitude factor between 0.5 and 1. The used parameters are shown in Table 2. The digital system operates at a frequency of 125 MHz, so the time slot between each sample is 8 ns. To account for fractional delays (as a time difference is in a real system), the offset can be shifted in 1 ns steps, and the evaluation includes a polynomial fit that allows the shifts to be calculated as a function of the sample rate.
Table 2. Parameters for simulated channel extension. The markers and colors are used in the following figures to highlight the actual and evaluated code center location.
3 Results and discussion
3.1 Orthogonal codes in ultrasonic testing
In this section, the properties of two individual orthogonal codes from the Gold code Set are tested using the ultrasonic testing system using only one transducer from the setup shown in Figure 2 in pulse-echo configuration. Two codes from the Gold codes set are generated and measured independently of each other to analyse them in terms of their auto- and cross-correlation properties with different processing steps.

Figure 4. Evaluation of codes and ultrasonic echoes. (A–D) Auto- and cross-correlation for Gold code 0 and 1 using the digital codes. Both codes show a clear auto-correlation function and a maximum of the cross-correlation function of 28%. (E–H) Auto- and cross-correlation for the ultrasonic signals of Gold codes 0 and 1 used for direct stimulation of the ultrasonic testing system. The maximum distance of the auto-correlation functions decreases to 30% and the maximum of the cross-correlation function is at 75%.
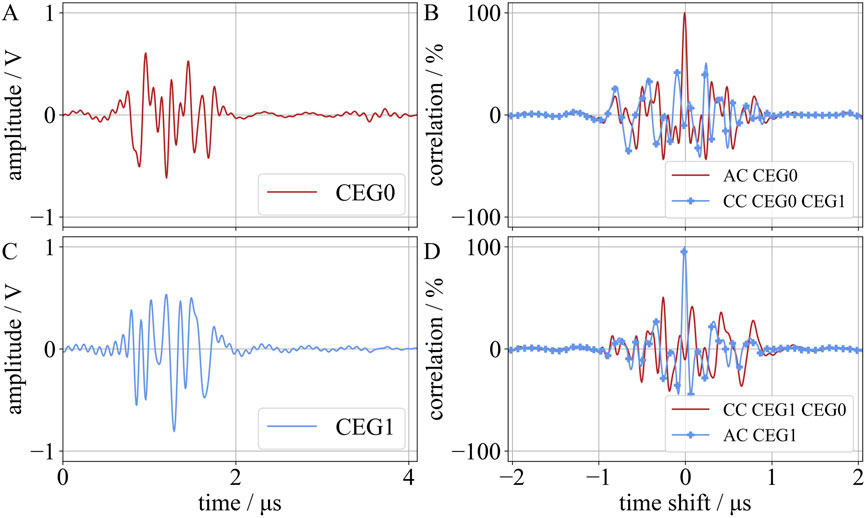
Figure 5. Evaluation of the compensated ultrasonic echoes. (A, C) show the compensated ultrasonic signals of Gold codes 0 and 1, while (B, D) show the auto- and cross-correlation functions. The maximum distance of the auto-correlation functions are 60% and 70%, respectively, while the maximum of the cross-correlation function is 50%.
Both code waveforms have a sharp maximum and a cross-correlation distance of 72%. When converted to ultrasonic signals in the present test system, the auto-correlation distance decreases to 30% and the distance to the cross-correlation maximum drops to 25%. After compensation for the test system, the distance for the auto-correlation function increases to 60% and 70%. The side lobe distance of the cross-correlation is 50%. Based on these results, direct evaluation of the ultrasonic signals is not suitable for determining the individual time-of-flight due to ambiguous cross-correlation values. After compensation, the signals are easier to discern and this approach is promising for application.
3.2 Experimental validation of orthogonality
In the following section, the two codes above are evaluated simultaneously using the ultrasonic testing system shown in Figure 2 to evaluate whether they can be separated when they do not overlap in the time signal. The two transducers are stimulated directly by the digital code sequence Gold code 0 and Gold code 1 respectively and the ultrasound signals are recorded. Only the signals received by the first transducer are shown in this section. The signals from the second transducer can be found in the Supplementary Material.
Note that the ultrasonic signals are inverted at the boundaries of the specimen. Therefore, the ultrasonic signal caused by the opposite channel is inverted and so is the maximum of the correlation function used for identification.
The time-of-flight corresponding to one sample thickness is about 10 µs. From the beginning of the recording there is an offset of 2 µs before the excitation starts. In Figures 6, 7, the first echo is the first echo from the opposing transducer (Gold code 1, time-of-flight between 12 and 16 µs), the second echo is the backwall echo originating from the recording transducer (Gold code 0, time-of-flight between 22 and 26 µs) and the third echo is the reflected echo from opposing transducer (Gold code 1, time-of-flight between 32 and 36 µs).
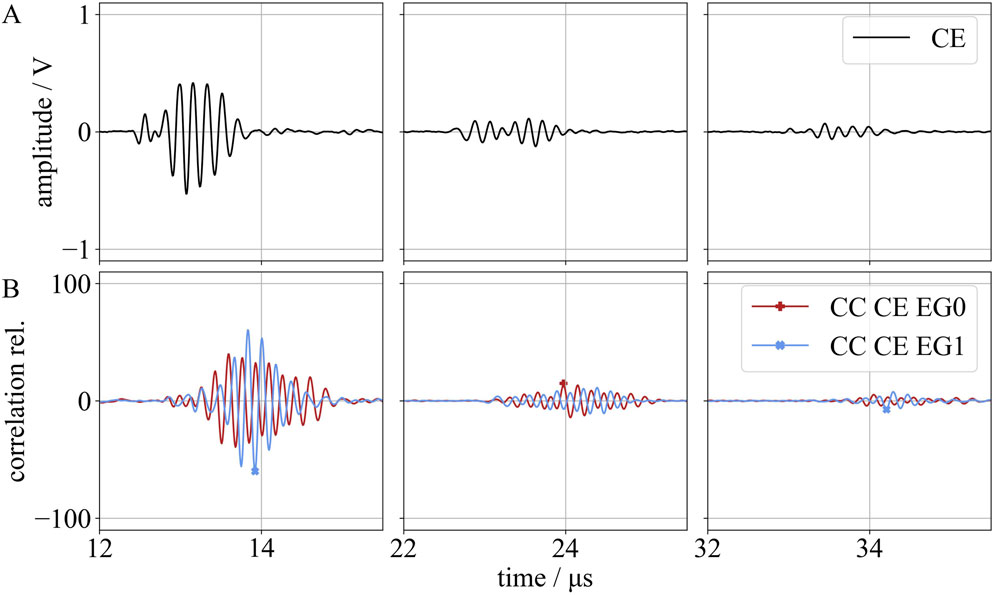
Figure 6. Results for the experimental setup for one channel. (A) Directly recorded ultrasonic signals and (B) the correlation function for the signal and the coded echoes. The maximum of the correlation function with the highest result is marked for the three signals.

Figure 7. Experimental results for a single transducer with compensated coded echoes. (A) Compensated ultrasonic data for channel 0, (B) the corresponding correlation functions using the compensated ultrasonic echoes and (C) the correlation functions using the digital codes. The correlation evaluation for the signals shows an obvious maximum at a high side lobe distance as indicated by the markers.
Figure 6A shows the recorded ultrasonic signal from one channel after stimulation of the ultrasonic echoes of Gold code 0 and Gold code 1. In addition, the correlation of this signal with both individual Gold code excitation echoes (Figures 5A,C) is shown in Figure 6B. Based on the maximum of the cross-correlation functions, Gold code 1 was correctly detected in windows 1 and 3 and Gold code 0 was correctly detected in window 2. Although the codes are correctly detected, the height difference between the side lobe maxima is small and therefore a correct localisation is ambiguous. Therefore, in a next step, the ultrasonic echoes are compensated using the system transfer function, yielding echoes which better resemble the digital codes (Figure 7A). Compensation for the ultrasonic testing system increases the distance between the maxima and improves the unambiguity. As before, based on the maximum of the crosscorrelation functions, Gold code 1 was correctly detected in window 1 and 3 and Gold code 0 was correctly detected in window 2. When correlating with the digital codes, the whole correlation function shrinks, but the intensity relationship of the maxima is similar, and therefore a successful code decision can be made, and in addition, a stable and robust localisation is possible. In all evaluations, the first signal is inverted and correlates best with the code opposite to the one used to excite the channel.
In the final step, shown in Figure 7C, the digital code is used for correlation instead of the compensated echoes. In all three windows, the correct codes and their positions were identified. This demonstrates that single-echo computation is not required to identify the codes in the compensated ultrasonic signals.
3.3 Simulated extension to 9 channels
After verification on a two-channel ultrasonic testing system, the use in a multi-channel ultrasonic system with coded echoes overlapping in the time signal is evaluated by simulated extension to 9 channels. The parameters presented in Table 2 in Section 2.2 are used to scale the individual codes and create a combined signal. This approach is used to recreate multiple propagation paths in a complex test object, resulting in overlapping echoes of different amplitudes arriving at a receiver. The aim of the experiment is to determine the individual arrival times of the codes at the receiver. The delayed and rescaled codes are summed into a continuous signal and correlated with the original code sequences to determine the location of the code.
Figure 8A shows the code position. The time signal for the compound digital codes is shown in Figure 8B and the correlation functions of the individual digital codes with the respective centers of the codes in Figure 8C. For the evaluation of all digital codes in Figure 8C, a clear maximum is visible. For the compensated ultrasonic signal in Figure 8D, the markers highlight the original code position. All position determinations show good agreement with the original position of the code sequences. For code 5 the side lobe distance of the CC is small and therefore close to the error. The maximum of the correlation function for code 30 is also small compared to the maxima of the other functions, but so is the whole function and the relative maximum distance is comparable to the other functions. The evaluation for the direct ultrasound signal mostly fails, as expected from the results in Section 3.1. The corresponding figure can be found in the supplementary material.
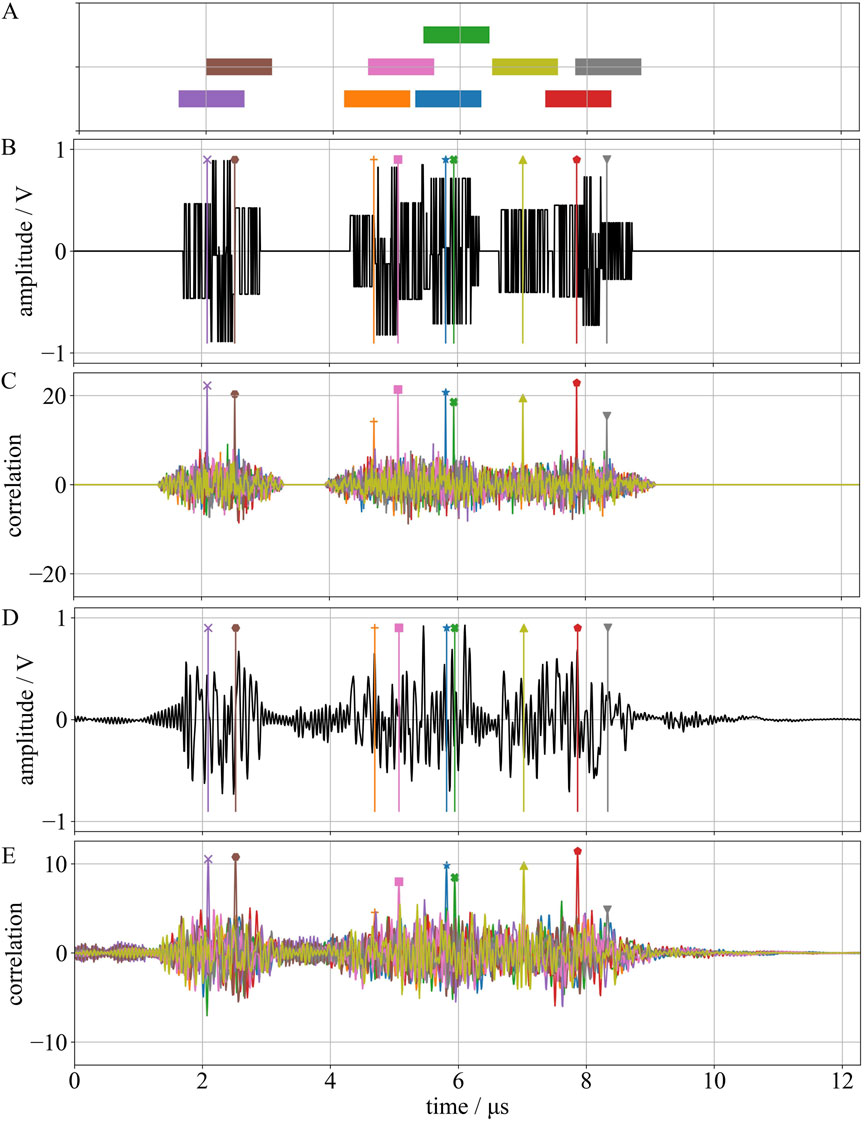
Figure 8. Simulated extension to 9 channels. (A) Location and length for the different codes. (B) Signal containing the 9 codes with different locations and amplitudes. The center position of the codes is marked in the time signal with the markers and in the colors as assigned in Table 2. (C) Correlation functions of the signal with the individual code sequences and localisation. (D) Compensated ultrasonic signal. The markers highlight the center of the code sequence. (E) Correlation functions and localisation for the compensated ultrasonic signals.
The nominal location error and the maximum distance for the evaluation of the sequences is summarised in Table 3. The localisation works perfectly for the digital codes, but errors occur for the ultrasonic signal and the compensated ultrasonic signal. For the compensated ultrasonic signal the maxima for localisation are above the cross-correlation level. The location accuracy is 4 ns and below, half the sampling distance of the system. All side lobe distances are reduced, compared to the digital codes, but only for code 5 the distance is close to the cross-correlation level.

Table 3. Location error for correlation based evaluation. For the digital codes there is no location error, for the direct ultrasonic signal the evaluation shows many errors and for the compensated signal the location error is always less than 8 ns (sampling time).
3.4 Discussion
When codes are converted to ultrasonic signals, the characteristics of the code sequences are not preserved and the correlation properties are not sufficient for clear detection in a signal containing a sum of several coded echoes. Including the code compensation of the ultrasonic testing system restores some of the characteristics, which also improves the correlation function and leads to successful localisation. While the localisation for the codes still shows a clear maximum, this distance is reduced after the conversion. The resulting distance between the maximum of the correlation function to the cross-correlation level is the range where an ampitude scaling still results in a stable localisation.
There are several factors that negatively affect the detectability of the coded signals. Looking at Figure 8E for code 5, the maximum of the correlation function is close to the cross-correlation ratio. The lower scaling of the amplitude has a negative effect on the detectability of the codes. Comparing code 10 to 5, the amplitude factor is almost equal and 10 shows a higher maximum distance. Going back to the digital codes in Figure 8C and Table 3 and 30 show a smaller amplitude, but the distance of the main maximum to the cross-correlation level is about 50%. This leads to the conclusion that the conversion to the ultrasonic signal, combined with an unfortunate overlap of the codes, results in a difficult correlation of the summed signal to the individual code. Changing the delay of code 5 in both directions gives comparable results to the other coded echoes.
Figure 9 shows the correlation properties of the ultrasonic signals and the compensated ultrasonic signals. Table 4 summarises the cross-correlation performance of the two sets of signals. Compared to Figure 4 and Table 1 showing the results for ideal codes, the mean, maximum, and standard deviation of the codes after conversion to ultrasonic signals are more than doubled. Uncompensated ultrasonic signals can exhibit ambiguous results as showcased by the absolute maximum of the cross-correlation maximum of near 100%. The compensation of the ultrasonic testing system restores some of the code properties and improves the correlation characteristics. While the mean is reduced to below 50%, the deviation and the maximum are still about twice the original values of the codes with 36% and 80%, respectively.
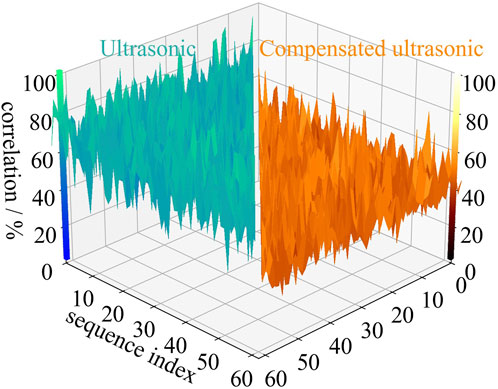
Figure 9. Maximum cross-correlation for the Gold code set as ultrasonic signals (left) and compensated ultrasonic signals (right). The average cross-correlation for the ultrasonic signals is high. By applying the compensation, the mean cross-correlation is noticeably reduced, while the deviation is also reduced. For better visibility, the maximum of the auto-correlation of the codes (always 100%) in the diagonal is not shown.
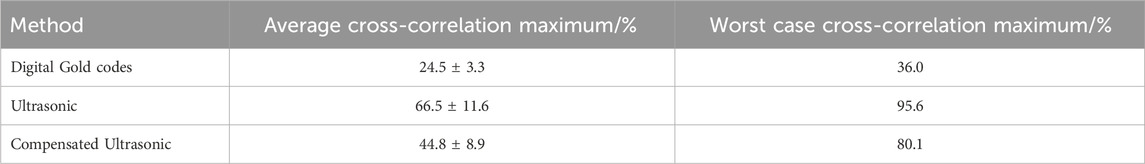
Table 4. Maximum evaluation of the cross-correlation performance for the Gold codes, the coded ultrasonic signals and the compensated signals. The average cross-correlation maximum is given including the standard deviation. While both are worse than the original code, the compensation improves the values.
As described in Schäfer and Fischer (2024a), there is a loss in compensation based on the bandwidth and noise of the system. Depending on the center frequency, the available and the required bandwidth for the transmission, some parts of the signal are not sufficiently reconstructed. Due to the inversion of the transfer function of the system, the noise is also amplified and has a negative influence on the compensation. Rather than the transfer function of the entire ultrasonic testing system being recorded (including the electronics, transducers, and reference specimen), it is also possible for only the impulse response or transfer function of the ultrasonic transducers to be considered for compensation during the decoding. Although compensating for the other components of the testing system would improve the results further, the main source of signal deviation is the transmission and reception of acoustic waves by the transducers Schäfer and Fischer (2024b).
In addition to code transferability, there are several other issues to consider when using a multichannel testing system in full parallel operation. Compensation of the ultrasonic testing system only works for linear acoustics (Morse and Ingard, 1961). When using multiple channels, the sound pressure in the material is also summed. Depending on the intensity and the amount of constructive overlap, the acoustic linear elastic range of the material may be exceeded and nonlinear effects may occur. Such effects are not covered by the linear system transfer function.
A related effect is that constructive overlap in a receive channel also increases the voltage across the receiver electronics. If the receiver gain is set to the optimum value for a single-channel measurement, the sum of multiple signals will result in overdriving the amplifiers or the ADC, causing distortion and possibly damage to the components. Assuming a maximum interaction of all channels on a receiver, the maximum voltage increases with the number of channels. To deal with this effect, the receiver gain could be reduced, negatively affecting the SNR of the measurement, or code selection and delay could help to solve this problem. Due to the structure of the codes, the area of positive overlay is quite small and varies with the relative location of the codes. Changing the codes of the channels or delaying the transmission of certain channels also changes the area of interaction in the receiver. Even a delay less than the code duration can produce the desired effect. The measurement can still be done in one cycle and the duration is only increased by a fraction of the previous measurement time.
Table 5 shows a comparison between selected recent publications and the work presented here. Compared to related work, the advantages of this work are that the code duration is short, and 65 codes with orthogonal properties are usable within the set. Due to the short transmission time, specimens with small geometry and high sonic velocity can be evaluated without interaction between echoes reflected by the test object and ongoing code excitation.
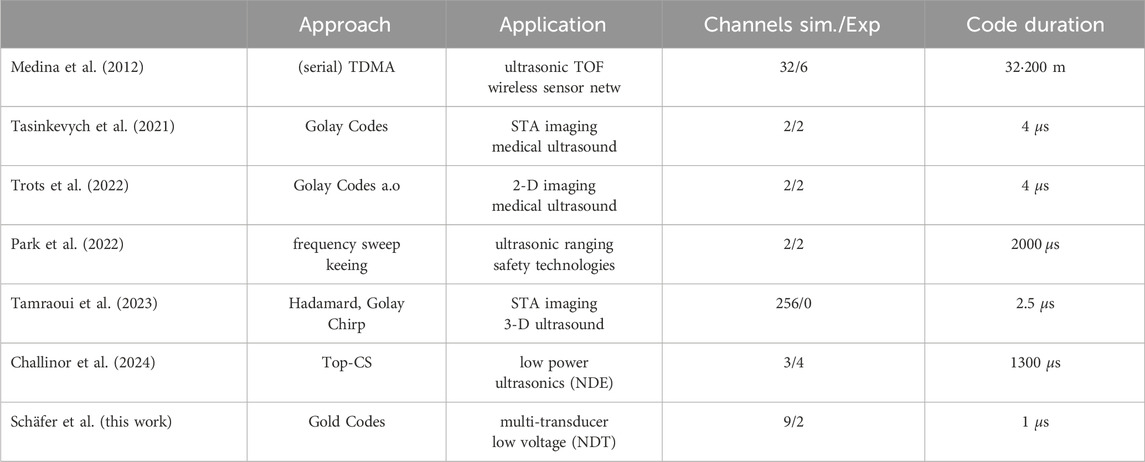
Table 5. Comparison of this work with selected recent publications.
For this study, all computations were performed using a CPU only. The ADC provides a resolution of 16 bits. In order to perform accurate calculations, a processing system should provide at least 32-bit processing, i.e., twice the amount. There are no further requirements for successfully and comparably performing the evaluation. Depending on the hardware resources, the amount of time required may vary. However, an implementation in a multichannel ultrasonic testing system could make use of the on-board FPGA to instantly compute and separate or localise the superimposed coded echoes. Of course, other options for parallel processing, such as multithreading or GPU computing, could also improve the speed of reconstruction and deconvolution algorithms.
4 Conclusion and outlook
The most important findings of this paper are:
There are some important limitations to be considered and the selection of the set of codes must be done carefully, taking into account the available frequency band and the resulting loss in transmission and reconstruction. The signal duration and energy consumption per channel increases, which also increases the energy cost of the measurement and the acoustic load on the specimen. As the number of parallel channels increases, crosstalk also increases and noise immunity decreases, partly compensated by the individual code characteristics.
Techniques such as full matrix capture (Grager et al., 2016), where multiple transducers are used sequentially, can profit a lot from the reduced execution time. Even when only using a fraction of the channels in parallel, the execution time is reduced by the number of channels sending at the same time. Simultaneously the usage of coded sequences improves the sharpness of the maxima and therefore also the sharpness in imaging techniques (Xie et al., 2022).
For some applications, execution time is very important, for example, to reduce the impact of a harmful environment on personnel (Herbert, 1982; Enkvist et al., 1999). Trading execution time for stability is not an option in this area, so the use of coded sequences would allow multiple channels to be used in parallel, speeding up the process at the expense of SNR, but at the same time there is a gain in SNR because the coded sequences compensate for the loss (Vienneau and Byram, 2023; Fan et al., 2019; Ding and Payne, 1990). In addition, CDMA modulation performs well in multipath environments, provides robustness against small-band interferers, and reduces channel crosstalk (Vogt, 2010; Park et al., 2022).
In conclusion, we have shown that the use of orthogonal coded sequences is possible and allows the fully parallel use of a multi-transducer test system, resulting in a significant acceleration of the measurement. As discussed, several methods and applications can benefit from the results. The next steps in application will be to port the methods to a state of the art test system or to build an expert system optimised for the application and methods.
Data availability statement
The raw data supporting the conclusions of this article will be made available by the authors, without undue reservation.
Author contributions
MS: Methodology, Software, Investigation, Conceptualization, Writing – original draft, Data curation, Visualization, Resources, Formal Analysis, Validation. GD: Conceptualization, Writing – review and editing. SF: Project administration, Writing – review and editing, Methodology, Funding acquisition, Supervision.
Funding
The author(s) declare that financial support was received for the research and/or publication of this article. This research was supported by Fraunhofer Internal Programs under Grant No. Attract 025-601314.
Conflict of interest
The authors declare that the research was conducted in the absence of any commercial or financial relationships that could be construed as a potential conflict of interest.
Generative AI statement
The author(s) declare that no Generative AI was used in the creation of this manuscript.
Publisher’s note
All claims expressed in this article are solely those of the authors and do not necessarily represent those of their affiliated organizations, or those of the publisher, the editors and the reviewers. Any product that may be evaluated in this article, or claim that may be made by its manufacturer, is not guaranteed or endorsed by the publisher.
Supplementary material
The Supplementary Material for this article can be found online at: https://www.frontiersin.org/articles/10.3389/facou.2025.1620233/full#supplementary-material
References
Challinor, C., Pearson, N., and Cegla, F. (2024). Coded excitation using top-cs sequences for multi-channel low-power ultrasonics. Mech. Syst. Signal Process. 213, 111339. doi:10.1016/j.ymssp.2024.111339
Chen, X., Chen, Y., Cao, S., Zhang, L., Zhang, X., and Chen, X. (2019). Acoustic indoor localization system integrating tdma+fdma transmission scheme and positioning correction technique. Sensors 19, 2353. doi:10.3390/s19102353
Ding, Z., and Payne, P. (1990). A new golay code system for ultrasonic pulse echo measurements. Meas. Sci. Technol. 1, 158–165. doi:10.1088/0957-0233/1/2/010
Drinkwater, B. W., and Wilcox, P. D. (2006). Ultrasonic arrays for non-destructive evaluation: a review. NDT and E Int. 39, 525–541. doi:10.1016/j.ndteint.2006.03.006
Enkvist, J., Edland, A., and Svenson, O. (1999). Human factors aspects of non-destructive testing in the nuclear power context. A review of research in the field
Fan, Z., Rudlin, J., Asfis, G., and Meng, H. (2019). Convolution of barker and golay codes for low voltage ultrasonic testing. Technologies 7, 72. doi:10.3390/technologies7040072
Garcia, E., Paredes, J. A., Álvarez, F. J., Pérez, M. C., and García, J. J. (2015). Spreading sequences in active sensing: a review. Signal Process. 106, 88–105. doi:10.1016/j.sigpro.2014.07.002
Grager, J.-C., Schrapp, M., Mooshofer, H., Sause, M. G., Zelenyak, A.-M., and Grosse, C. U. (2016). Ultrasonic imaging of carbon fiber-reinforced plastics using the full matrix capture data acquisition technique doi:10.1784/insi.2012.55.9.477
Herbert, E. (1982). Finding the flaws in nuclear power plants. IEEE Spectr. 19, 56–61. doi:10.1109/mspec.1982.6367001
Honarvar, F., Salehi, F., Safavi, V., Mokhtari, A., and Sinclair, A. N. (2013). Ultrasonic monitoring of erosion/corrosion thinning rates in industrial piping systems. Ultrasonics 53, 1251–1258. doi:10.1016/j.ultras.2013.03.007
Kaufman, D. (2010). “Chapter 20 - industrial wireless technology and planning,” in Instrumentation reference book. Fourth edition edn. (Boston: Butterworth-Heinemann), 253–265. doi:10.1016/B978-0-7506-8308-1.00020-6
Kim, N., and Hong, M. (2009). Measurement of axial stress using mode-converted ultrasound. Ndt and E Int. 42, 164–169. doi:10.1016/j.ndteint.2008.09.005
Krautkrämer, J., and Krautkrämer, H. (1983). Pulse-echo method. Berlin, Heidelberg: Springer Berlin Heidelberg, 193–264. doi:10.1007/978-3-662-02357-0_11
Laroche, N., Bourguignon, S., Carcreff, E., Idier, J., and Duclos, A. (2020). An inverse approach for ultrasonic imaging from full matrix capture data: application to resolution enhancement in ndt. IEEE Trans. Ultrasonics, Ferroelectr. Freq. Control 67, 1877–1887. doi:10.1109/TUFFC.2020.2990430
Medina, C., Segura, J. C., and de la Torre, Á. (2012). A synchronous tdma ultrasonic tof measurement system for low-power wireless sensor networks. IEEE Trans. Instrum. Meas. 62, 599–611. doi:10.1109/tim.2012.2218056
Mitsui, H., Mizutani, K., and Wakatsuki, N. (2010). Defect detection in square billet using time-of-flight of longitudinal waves. Jpn. J. Appl. Phys. 49, 07HC13. doi:10.1143/JJAP.49.07HC13
Mollah, M. B., and Islam, M. R. (2012). “Comparative analysis of gold codes with pn codes using correlation property in cdma technology,” in 2012 international conference on computer communication and informatics, 1–6. doi:10.1109/ICCCI.2012.6158894
Morse, P. M., and Ingard, K. U. (1961). “Linear acoustic theory,” in Akustik I/Acoustics I (Springer), 1–128. doi:10.1007/978-3-642-45956-6_1
Park, G.-R., Park, S.-H., and Baek, K.-R. (2022). Frequency sweep keying cdma for reducing ultrasonic crosstalk. Sensors 22, 4462. doi:10.3390/s22124462
Periyannan, S., and Balasubramaniam, K. (2014). “Temperature gradients and material properties measurements using ultrasonic guided waves,” in European conference on non-destructive testing (Prague, Czech Republic), 6–10.
Schäfer, M. W., and Fischer, S. C. (2024a). Inverse stimulation enables ultrasonic binary coding for nde using a custom linear testing system. Ultrasonics 141, 107341. doi:10.1016/j.ultras.2024.107341
Schäfer, M. W., and Fischer, S. C. (2024b). Modular, physically motivated simulation model of an ultrasonic testing system. ndt 2, 330–346. doi:10.3390/ndt2030020
Schäfer, M., Theado, H., Becker, M. M., and Fischer, S. C. L. (2021). Optimization of the unambiguity of cross-correlated ultrasonic signals through coded excitation sequences for robust time-of-flight measurements. Signals 2, 366–377. doi:10.3390/signals2020023
Sutcliffe, M., Weston, M., Dutton, B., Charlton, P., and Donne, K. (2012). Real-time full matrix capture for ultrasonic non-destructive testing with acceleration of post-processing through graphic hardware. NDT and E Int. 51, 16–23. doi:10.1016/j.ndteint.2012.06.005
Tamraoui, M., Liebgott, H., and Roux, E. (2023). Complete complementary coded excitation scheme for snr improvement of 2d sparse array ultrasound imaging. IEEE Trans. Biomed. Eng. 71, 1043–1055. doi:10.1109/tbme.2023.3325657
Tasinkevych, Y., Trots, I., and Nowicki, A. (2021). Mutually orthogonal golay complementary sequences in the simultaneous synthetic aperture method for medical ultrasound diagnostics. An experimental study. Ultrasonics 115, 106434. doi:10.1016/j.ultras.2021.106434
Teng, L., and Zhou, Z. (2022). A novel non-destructive testing method for turbine disks using dual array ultrasonic transducer. Sci. Rep. 12, 9427. doi:10.1038/s41598-022-12622-6
Torrieri, D. (2005). “Principles of spread-spectrum communication systems,”, 1. Springer. doi:10.1007/b99535
Trots, I., Żołek, N., Tasinkevych, Y., and Wójcik, J. (2022). Mutually orthogonal golay complementary sequences in medical ultrasound diagnostics. Experimental study. Archives Acoust., 399–405doi. doi:10.24425/aoa.2022.142013
Vienneau, E. P., and Byram, B. C. (2023). A coded excitation framework for high snr transcranial ultrasound imaging. IEEE Trans. Med. Imaging 42, 2886–2898. doi:10.1109/tmi.2023.3269022
Vogt, M. (2010). “Evaluation of direct-sequence spread-spectrum modulation technique for digital data transmission with ultrasound,” in 2010 IEEE international ultrasonics symposium, 129–132. doi:10.1109/ULTSYM.2010.5935899
Xie, H.-W., Guo, H., Zhou, G.-Q., Nguyen, N. Q., and Prager, R. W. (2022). Improved ultrasound image quality with pixel-based beamforming using a wiener-filter and a snr-dependent coherence factor. Ultrasonics 119, 106594. doi:10.1016/j.ultras.2021.106594
Yang, K., Kim, Y.-K., and Vijay Kumar, P. (2000). Quasi-orthogonal sequences for code-division multiple-access systems. IEEE Trans. Inf. Theory 46, 982–993. doi:10.1109/18.841175
Yang, S., Zhang, L., and Fan, J. (2021). “Measurement of axial force of bolted structures based on ultrasonic testing and metal magnetic memory testing,” in Advances in condition monitoring and structural health monitoring (singapore: springer Singapore and imprint: springer), lecture notes in mechanical engineering, 625–635. doi:10.1007/978-981-15-9199-0_60
Yen, J., and Smith, S. (2004). Real-time rectilinear 3-d ultrasound using receive mode multiplexing. IEEE Trans. Ultrasonics, Ferroelectr. Freq. Control 51, 216–226. doi:10.1109/TUFFC.2004.1320770
Zhou, L., Liu, H., Lian, M., Ying, Y., Li, T., and Wang, Y. (2018). Highly accurate adaptive tof determination method for ultrasonic thickness measurement. Meas. Sci. Technol. 29, 045002. doi:10.1088/1361-6501/aa9acf
Keywords: binary coding, coded excitation, ultrasound, orthogonal coding, linear acoustics
Citation: Schäfer MW, Del Galdo G and Fischer SCL (2025) Compensated orthogonal spread codes for full parallel usage of multi-transducer ultrasonic testing systems in NDE. Front. Acoust. 3:1620233. doi: 10.3389/facou.2025.1620233
Received: 29 April 2025; Accepted: 29 July 2025;
Published: 29 August 2025.
Edited by:
Chengzhi Shi, University of Michigan, United StatesReviewed by:
Kun Wang, Chinese Academy of Sciences (CAS), ChinaGuangyin Zhang, University of Pittsburgh - Swanson School of Engineering Office of Administration, United States
Copyright © 2025 Schäfer, Del Galdo and Fischer. This is an open-access article distributed under the terms of the Creative Commons Attribution License (CC BY). The use, distribution or reproduction in other forums is permitted, provided the original author(s) and the copyright owner(s) are credited and that the original publication in this journal is cited, in accordance with accepted academic practice. No use, distribution or reproduction is permitted which does not comply with these terms.
*Correspondence: Marius W. Schäfer , bWFyaXVzLnNjaGFlZmVyQGl6ZnAuZnJhdW5ob2Zlci5kZQ==; Sarah C. L. Fischer, c2FyYWguZmlzY2hlckBpemZwLmZyYXVuaG9mZXIuZGU=
†ORCID: Marius W. Schäfer, orcid.org/0000-0001-6764-7990; Giovanni Del Galdo, orcid.org/0000-0002-7195-4253; Sarah C. L. Fischer, orcid.org/0000-0003-1569-276X