 Nicholas S. Kron
 Michael C. Schmale
 Lynne A. Fieber
- Department of Marine Biology and Ecology, Rosenstiel School of Marine and Atmospheric Science, University of Miami, Miami, FL, United States
Aging is associated with cognitive declines that originate in impairments of function in the neurons that make up the nervous system. The marine mollusk Aplysia californica (Aplysia) is a premier model for the nervous system uniquely suited to investigation of neuronal aging due to uniquely identifiable neurons and molecular techniques available in this model. This study describes the molecular processes associated with aging in two populations of sensory neurons in Aplysia by applying RNA sequencing technology across the aging process (age 6–12 months). Differentially expressed genes clustered into four to five coherent expression patterns across the aging time series in the two neuron populations. Enrichment analysis of functional annotations in these neuron clusters revealed decreased expression of pathways involved in energy metabolism and neuronal signaling, suggesting that metabolic and signaling pathways are intertwined. Furthermore, increased expression of pathways involved in protein processing and translation suggests that proteostatic stress also occurs in aging. Temporal overlap of enrichment for energy metabolism, proteostasis, and neuronal function suggests that cognitive impairments observed in advanced age result from the ramifications of broad declines in energy metabolism.
Introduction
Aging can be summarized as a progressive decline in the physiological function and increased vulnerability to death of an organism over the course of the lifespan (Lopez-Otin et al., 2013; Dodig et al., 2019). Aging is a prime risk factor for many of the most common and deadly diseases, including heart disease, diabetes, and cancer (Franceschi et al., 2018). Several of the most prevalent neurological diseases, such as Alzheimer’s disease and Parkinson’s disease, have age-associated onset (Hou et al., 2019). Even non-pathological aging is associated with a slew of metabolic and cognitive changes that have broad impacts on public health. The nervous system is profoundly affected with age, resulting in cognitive impairments and susceptibility to neurodegenerative disorders (Reuter-Lorenz, 2002; Yankner et al., 2008; Anderson and Craik, 2017; Bettio et al., 2017). The long-lived, post-mitotic, and energetically expensive nature of neurons results in a suite of age-associated changes that underpin cognitive changes observed at the whole organism level (Grimm and Eckert, 2017).
Metabolic drift and broad scale decreases in aerobic glycolysis, the tricarboxylic acid cycle, and oxidative phosphorylation are a common feature of brain aging (Pandya et al., 2015, 2016; Ivanisevic et al., 2016; Pollard et al., 2016; Goyal et al., 2017; Mattson and Arumugam, 2018; Watts et al., 2018; Guo et al., 2020). Metabolic impairments are associated with dysfunctional mitochondria and increasing levels of reactive oxygen species (ROS), which damage proteins and membranes (Di Domenico et al., 2010; Paradies et al., 2011; Diot et al., 2016; Islam, 2017). Increased iron toxicity and the accumulation of ectopic fat deposits in neurons are common indicators of an increasingly oxidative state in aging (Ward et al., 2014; Palikaras et al., 2017; Jin et al., 2018). These changes are believed to contribute to decreased protein homeostasis and chronic inflammation (Hohn et al., 2013; Barrientos et al., 2015; Currais, 2015; Hohn et al., 2017; Martinez et al., 2017; Garaschuk et al., 2018; Mattson and Arumugam, 2018; Yang et al., 2019).
Dysfunction of the endoplasmic reticulum and mitochondria results in disrupted calcium dynamics and various signaling pathways crucial to neuronal function (Krebs et al., 2015; Pandya et al., 2015; Marchi et al., 2018). Disruptions of synaptic plasticity as a result of impaired signaling drive cognitive declines typical of brain aging (Magnusson et al., 2010; Haxaire et al., 2012; Morrison and Baxter, 2012). While these neuronal signatures are known to occur even in non-pathological aging, they are also typical of major neurodegenerative disorders such as Parkinson’s disease and Alzheimer’s disease (Silvestri and Camaschella, 2008; Thomsen et al., 2015; Foster et al., 2017; Grimm and Eckert, 2017; Kimura et al., 2017).
Among the most popular models for the study of aging in the nervous system are mammalian models such as the lab mouse Mus musculus and the lab rat Rattus norvegicus, invertebrate models such as the nematode worm Caenorhabditis elegans and fruit fly Drosophila melanogaster, as well as the budding yeast Saccharomyces cerevisiae (Mayer and Baker, 1985; Weindruch and Masoro, 1991; Olsen et al., 2006; Terzibasi et al., 2007; Sundberg et al., 2011; Lippuner et al., 2014). Comparisons among these diverse models and with humans have elucidated many of the common processes of aging among metazoans, including those in the nervous system. Discoveries in invertebrate models C. elegans and D. melanogaster in particular have contributed significantly to furthering the understanding of aging at a molecular level (Stegeman and Weake, 2017). However, these popular invertebrate aging models represent only the ecdysozoan clade of invertebrates.
As a representative of the lophotrochozoan phylum Mollusca, the marine gastropod model, the California sea hare Aplysia californica (Aplysia) broadens understanding of aging in metazoans. Due to a relatively simple nervous system made up of gigantic neurons, Aplysia is a well-studied model for the nervous system (Moroz, 2011). This, in addition to a 1-year lifespan, makes Aplysia an ideal model for studying the effects of age on the nervous system (Rattan and Peretz, 1981; Bailey et al., 1983; Peretz et al., 1984; Peretz and Srivatsan, 1992; Kempsell and Fieber, 2014). Furthermore, phylogenetic analysis has demonstrated that Aplysia represents an evolutionarily closer model to vertebrates than currently used ecdysozoan models, suggesting that Aplysia may offer a more effective model for human neuronal aging than do ecdysozoans (Moroz et al., 2006). As with Drosophila and C. elegans, a reference genome and transcriptome are available for Aplysia (GCF_000002075.1), which has allowed for investigation of transcriptional changes in aging Aplysia neurons; however, there is a distinct absence of transcriptional profiling across the aging process as has been done in other models (Moroz and Kohn, 2010; Kadakkuzha et al., 2013; Moroz and Kohn, 2013; Greer et al., 2018). Sampling of multiple time points is imperative for a full understanding of the transcriptional dynamics of aging and addressing which phenomena may be drivers of age-related dysfunctions.
To fill this gap and better understand the behavioral and physiological changes known to occur in this species with age, we performed a transcriptional time series experiment in Aplysia sensory neurons (SN). Specifically, we selected the buccal S (BSC) and pleural ventral caudal (PVC) SN, which comprise a small number of mostly homogeneous neurons (roughly 150 and 200, respectively) that can be reliably identified and sampled between individuals (Walters et al., 2004; Fieber et al., 2013). Age-associated declines in excitability of BSC are suggested to contribute to impairments of the biting reflex, likely reflecting the role of BSC in slowed feeding and declines in mass in Aplysia of advanced age (Fieber et al., 2010; Kempsell and Fieber, 2014). Similar physiological changes in PVC contribute to decreased sensitization of the sensory-motor synapse of the tail withdrawal reflex (TWR), which, like the biting reflex, is also compromised in aging (Kempsell and Fieber, 2014, 2015b). This degree of precision and the vertical integration that is possible throughout the aging process using behavioral, physiological, and now molecular data involving these discrete groups of neurons is perhaps unique to this animal model.
Materials and Methods
Animal Rearing
Two hundred individuals from a single egg mass (cohort) of A. californica were reared at the University of Miami National Resource for Aplysia under standard hatchery conditions as described previously (Gerdes and Fieber, 2006). Animals were fed an ad libitum diet of Aghardiella subulata and stocked at a density of two to seven animals per 16-L cage. Half of all individuals in cages were weighed monthly to assess cohort growth. The natural mortality of 53 individuals was recorded to monitor the aging rate of the cohort. To estimate the aging rate of the cohort, the Gompertz survivorship function was fit to the mortality data, where A is the initial mortality rate and G is the actuarial aging rate, as done previously (Wilson, 1994; Kempsell and Fieber, 2014).
Behavior Assessment and Sampling
Immediately prior to sexual maturity (approximately 6 months of age) and monthly thereafter, a minimum of 12 individuals were selected for behavioral assessment using a random number generator (Table 1). Animals were weighed and then placed in solo cages to acclimate overnight. The next morning, reflex performance was assessed in each individual based on time to right (TTR) behavior and time to relax the tail following tail pinch, called the tail withdrawal reflex (TWR), as described previously (Greer et al., 2018). Each reflex behavior was assessed in triplicate, with a minimum of 5 min rest between replicates and 15 min rest between TTR and TWR. Reflex data were analyzed with a Kruskal–Wallis and pairwise Wilcoxon post hoc test with Benjamini–Hochberg false discovery rate correction. Animals were then housed in solo cages and fasted for 2 days after behavioral assessment before sacrifice and sampling to prevent behavioral assessment from biasing expression in target neurons as described previously (Greer et al., 2018).
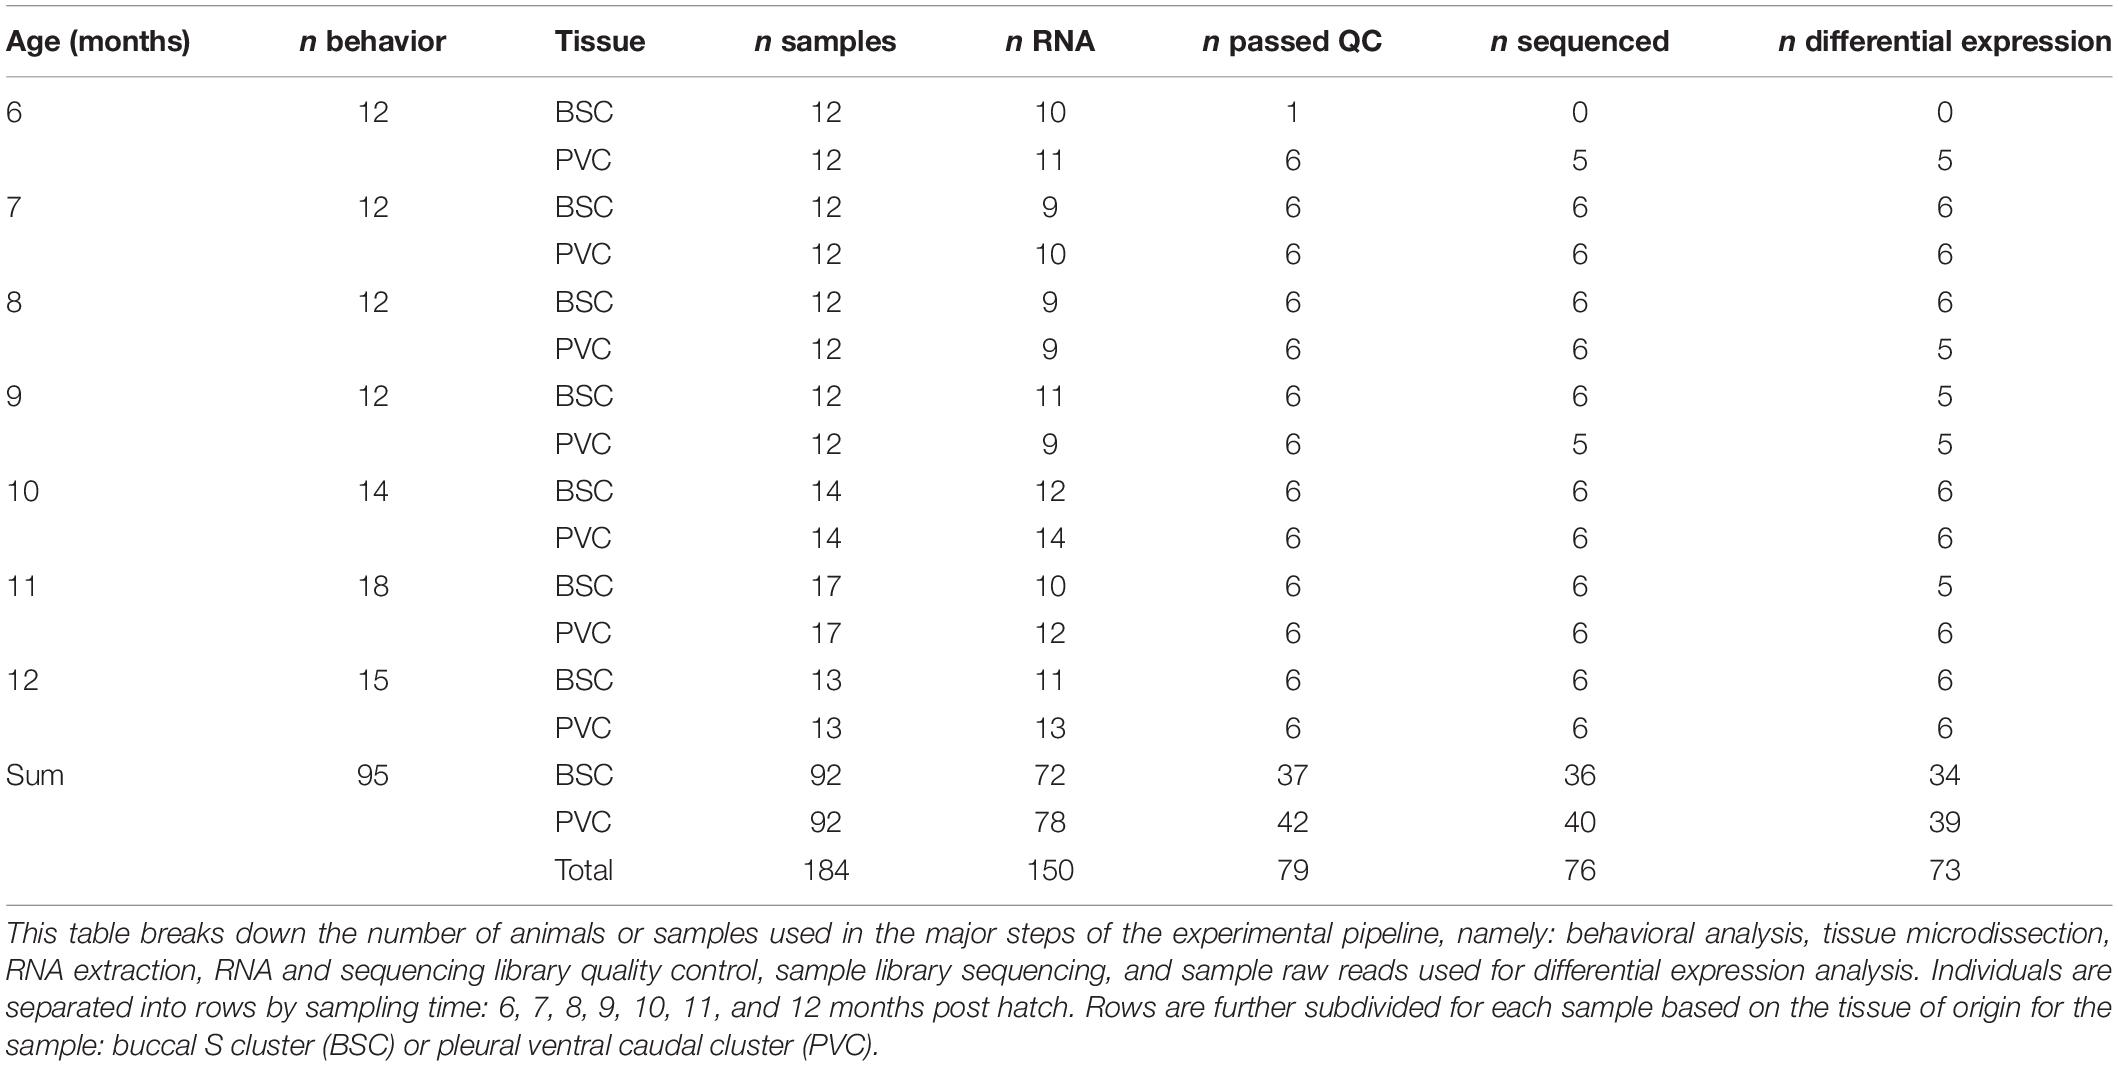
Table 1. Number of individuals used for each step of the experimental process.
Animals were prepared for sacrifice by injecting 1/6 bodyweight of cool, isosmotic MgCl2, with a wait of 5 min for anesthetic to take effect, as evidenced by lack of response to painful stimuli. The whole nervous system was then dissected out, euthanizing the animal. Each ganglion was washed in two separate baths of sterile artificial seawater. Target neuron clusters were microdissected from their respective hemi-ganglia after pinning in a sylgarded dish as described previously (Fieber, 2000). Samples from the same paired hemi-ganglia were pooled and stored in 0.3 ml of RNA Protect Cell Reagent (Qiagen) at −80°C.
RNA Extraction
Total RNA was extracted from target neuron clusters using the Qiagen RNeasy Micro Kit according to manufacturer protocol. Residual genomic DNA was eliminated with a 15-min DNase incubation. RNA purity was measured using a NanoDrop 1000 spectrophotometer (Thermo-Fisher), integrity was measured with an Agilent RNA 6000 Nano kit on an Agilent 2100 Bioanalyzer, and quantity was measured with a Qubit 3.0 fluorometer using the Qubit RNA HS assay kit (Thermo-Fisher). The six highest-quality samples in terms of RNA integrity and purity were selected for further processing (Table 1).
Library Preparation and Sequencing
Total RNA from samples was used to generate sequencing libraries with the Illumina TruSeq Stranded mRNA High-Throughput kit (150–250 ng) following manufacturer protocol. RNA was poly-A selected using poly-T oligo attached magnetic beads, after which RNA was heat fragmented for 6 min to achieve desired fragment size of between 200 and 300 base pairs. Agilent DNA 1000 kit was used to verify library fragment size on an Agilent bioanalyzer 2100. First-strand cDNA synthesis was random primed. Library concentrations were quantified using the Qubit dsDNA HS Assay kit on a Qubit 3.0 and sent to the University of California Irvine Genomics High-Throughput Facility (UCI GHTF) for further quality control and sequencing. At UCI GHTF, libraries were quantified using KAPA Library Quantification Kit (KAPA Biosystems), multiplexed, and sequenced across eight lanes of an Illumina HiSeq 2500 high-throughput sequencer as 100 base pair paired-end reads. Raw reads were deposited in the NCBI SRA and can be found under the following BioProject ID: PRJNA639857.
Read Quality Control and Mapping
Raw read quality was assessed using the FastQC software tool1. The BBDuk software tool from the BBtools package was used for adapter removal, quality trimming, and length and quality filtering (Bushnell, 2014). Trimmed and filtered reads were then reassessed with FastQC before mapping to the A. californica reference transcriptome (AplCal3.0 GCF 000002075.12) and quantification using the Salmon software tool (Patro et al., 2017). Transcript abundances from Salmon were then imported into the R statistical environment using the tximport R package (R Core Team, 2013; Soneson et al., 2015). A list of software tools used in this analysis are listed in Supplementary Table 1.
Data Preparation and Visualization
Data were formatted and visualized in the R statistical environment using the tidyverse R package suite and the complexHeatmap R package (Gu et al., 2016; Wickham et al., 2019). A detailed list of all R packages and versions used can be found in the Supplementary Material. Transcript abundances in transcript per million (TPM) from Salmon were filtered to exclude any transcript that did not have a minimum TPM of 1 in at least one time point. Raw TPMs were log transformed by taking log base 2 of TPM + 1 for clustering and visualization. A full readout of R packages used in this study can be found in Supplementary Table 2.
Principal Component and Surrogate Variable Analysis
Transcript abundances were centered and scaled using the scale() base R function. Principal component analysis (PCA) was performed on the top 1000 most variable transcripts with the prcomp() function from the stats R package.
Surrogate variables were identified and quantified from transcript abundances using the sva R package (Leek, 2014). Surrogate variables were corrected for using the removeBatchEffect() function from the limma R package with log-transformed TPM as input (Ritchie et al., 2015). Corrected values were only used for visualization and clustering. For differential expression analysis, surrogate variables were included as factors in the model design.
Differential Expression Analysis
Differential expression analysis was performed at the transcript level in each tissue separately using the likelihood ratio test (LRT) from the DESeq2 R package (Love et al., 2014). LRT is particularly useful in time course experiments because it analyzes all time points at once, as opposed to pairwise comparisons between time points. This allowed the detection of transcripts that change across time points while avoiding extra multiple test correction incurred by sequential pairwise comparison of time points. Specifically, the LRT identifies significantly DE transcripts by comparing difference in deviance between a fully parameterized model and a reduced model that omits the time variable. Transcripts with a false discovery rate-corrected p-value (padj) less than or equal to 0.01 were considered significantly differentially expressed.
Expression Profile Clustering
Because LRT only identifies transcripts that vary significantly with time, differentially expressed transcripts were clustered according to their expression profiles using the DIANA clustering to identify transcripts with coherent patterns of expression across time. Clustering was performed via the function degPatterns() from the DEGreport R package (Pantano, 2017). The log2 expression of biological replicates within each month was averaged and then the maximum and minimum were subtracted, yielding the maximal log2 fold difference for each transcript. Only transcripts with a maximal log2 fold differences of 0.58 or more used as input for clustering.
Gene Ontology and KEGG Analysis
The A. californica reference transcriptome was annotated by using the blastx function from the BLAST + software package against a local blast databased built from the UniProt human proteome (UP000005640), selecting only the top hit with a minimum e-value of 10–3 (Camacho et al., 2009). Aplysia proteins were mapped to human orthologs to leverage the resources available for the comparatively much better annotated and studied human proteome.
For Kyoto Encyclopedia of Genes and Genomes annotation, the Aplysia proteome was downloaded from the NCBI ftp site and annotated for KEGG Ortholog (KO) terms using the ghostKOALA tool from the KEGG Automatic Annotation and KEGG Mapping Service (Kanehisa et al., 2016). We chose to map to KO as opposed to the Homo sapiens annotation KEGG database to be able to leverage annotations of evolutionarily more proximate invertebrates, particularly mollusks. KEGG pathway enrichment was visualized with the pathview R package (Luo and Brouwer, 2013).
UNIPROT identifiers were used in Gene Ontology (GO) enrichment analysis for Biological Process, Cellular Compartment, and Molecular Function ontologies with the clusterProfiler R package (Yu et al., 2012). GO terms with hyper-geometric test adjusted p ≤ 0.05 for each cluster were considered significantly enriched. To aid in interpretation, GO enrichment was limited to the 4th level of the GO hierarchy. A second GO analysis was performed using the topGO R package due to its robust utilization of the GO graph structure. The algorithm parameter was set to “elim” and statistic parameter set to “fisher” (Alexa and Rahnenfuhrer, 2018). Terms with an enrichment p-value ≤ 0.01 were considered significant.
KO enrichment analysis was similarly performed with clusterProfiler R package (Yu et al., 2012). KEGG Orthology Pathways for each cluster with hyper-geometric test adjusted p ≤ 0.01 were considered significantly enriched. Enriched pathways were visualized using the pathview R package (Luo and Brouwer, 2013).
All code used for data preparation and analysis in this study can be found at the following GitHub repo: https://github.com/Nicholas-Kron/Kron_Cohort77_Differential_Expression_Analysis.
Results
Cohort Weight and Survivorship
Average mass of the animals in the cohort steadily increased until reaching an inflection point during the ninth month of age, after which it decreased (Figure 1A).
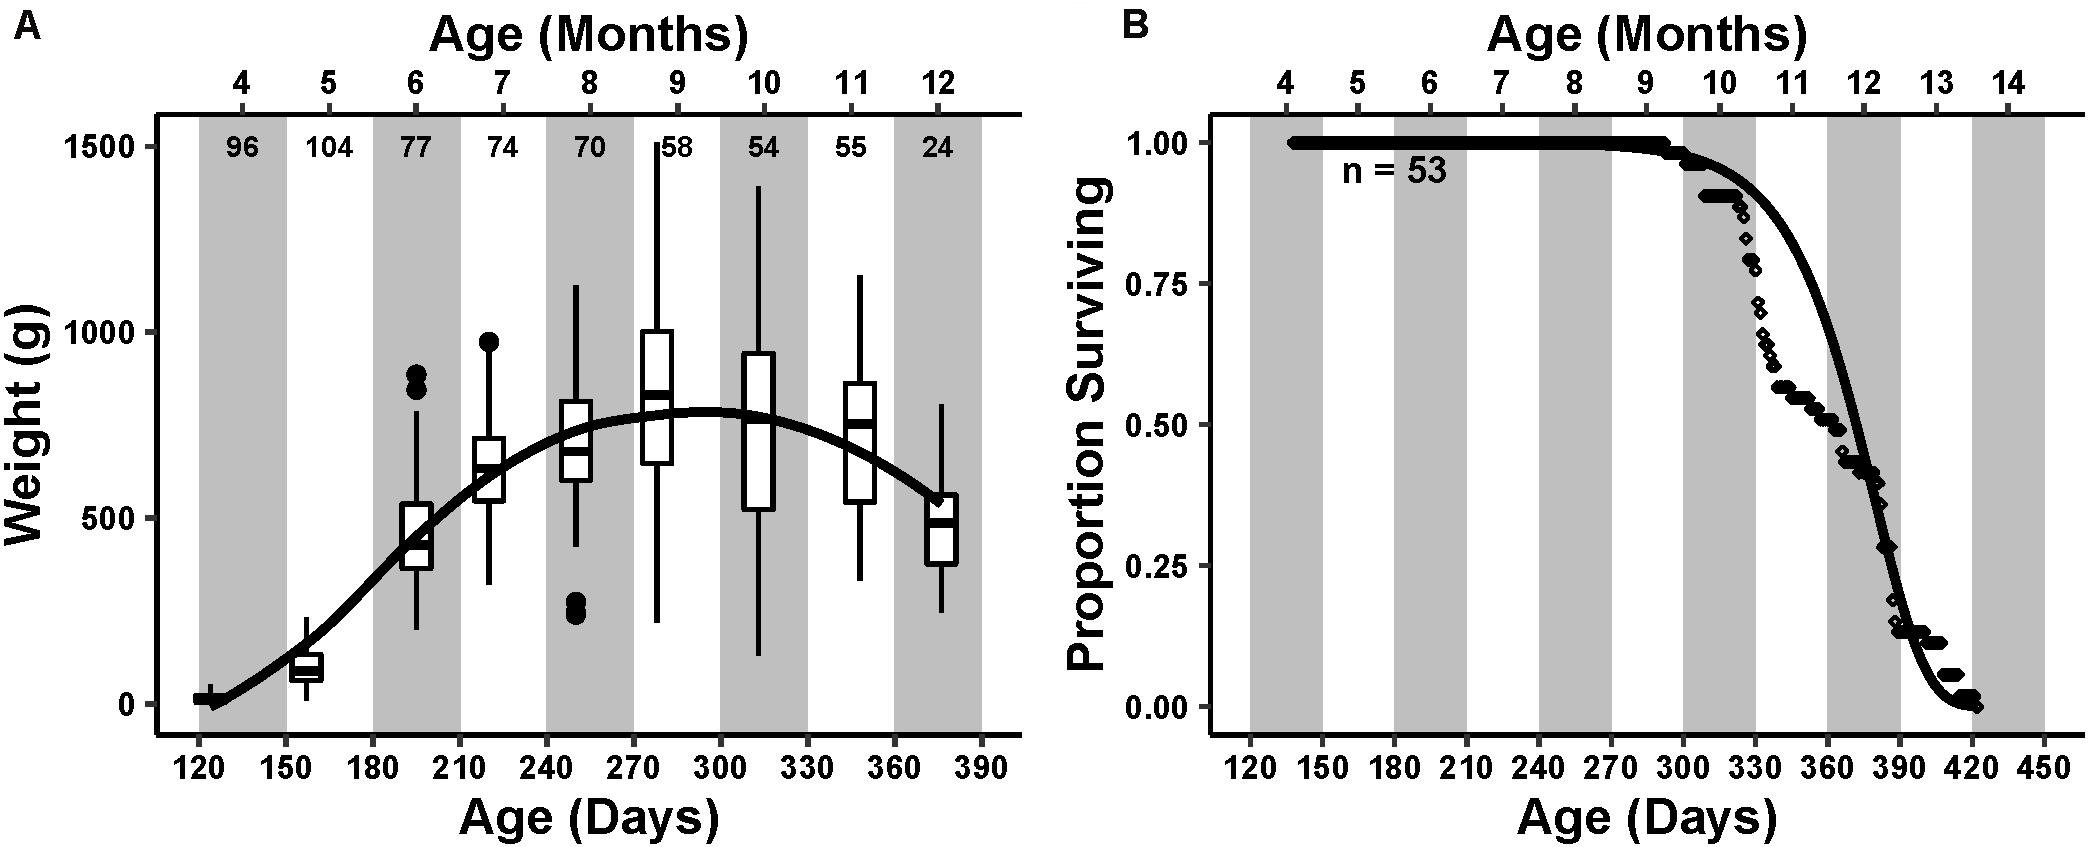
Figure 1. Cohort life history. Primary x-axis is the time in days post hatch, with the secondary x-axis at the top representing the age in months that is further emphasized by the alternating white and gray bars in the plot area. (A) Cohort weight trend. Box and whisker plots represent the interquartile range and median of weight measured at each monthly sampling point. Small numbers below the secondary axis are the number of individuals weighed that month. The curve drawn over the boxplots represents a loess smoothing of the data, showing an increasing and then decreasing weight trend peaking at age 9–10 months. (B) Survivorship of 53 individuals. Each point is the daily proportion of animals surviving. A Gompertz survival function, , was fit to the survivorship data visualized as a curve over the points. Initial mortality rate (A) and actuarial aging rate (G) were 7.4 × 10⁻¹⁰ and 0.047, respectively.
The first natural mortality occurred during the ninth month of age at 293 days post hatch. The proportion of total deaths steadily increased thereafter, reaching a maximum during the 12th month of age (Figure 1B). The final mortality occurred during the 14th month of age at 422 days post hatch. The median lifespan was 363 days. The calculated Gompertz actuarial aging rate G, which describes the change in mortality rate with change in time, was 0.047, similar to previously reported aging rates (Gerdes and Fieber, 2006).
Reflex Behaviors
Data for both reflex behaviors failed to meet assumptions of normality and thus were tested using non-parametric tests. TTR varied significantly with age (p ≤ 0.01, Kruskal–Wallis, ε2 = 0.67). Pairwise Wilcoxon test (Benjamini–Hochberg fdr-corrected p ≤ 0.05) revealed a significant increase in TTR with age (Figure 2A), conforming to an expected pattern with age defined by Kempsell and Fieber (2014).
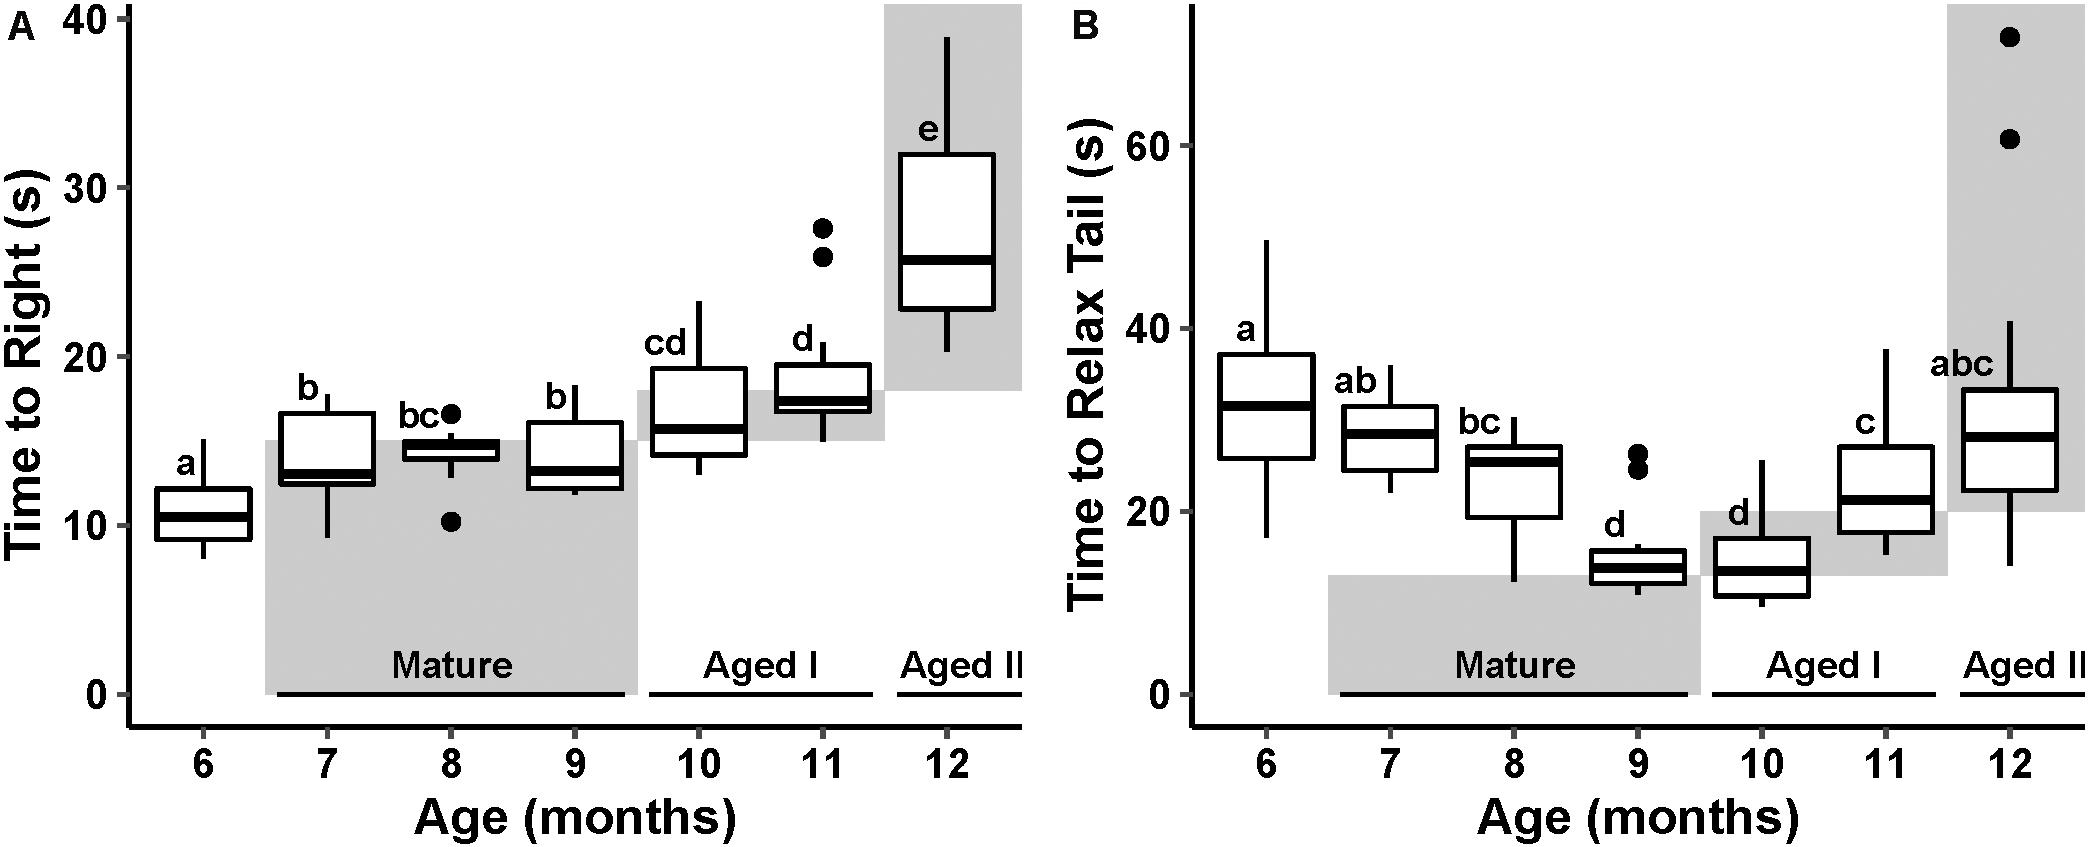
Figure 2. Cohort reflex behavior performance with age. The stages of aging behavior range defined by Kempsell and Fieber (2014) are represented as gray boxes in the plot space and labeled at the bottom of the plot. Boxes labeled with different letters are considered significantly different by pairwise Wilcoxon test (fdr-corrected p ≤ 0.05). (A) Boxplot of righting reflex behavior performance at each month of randomly selected animals. (B) Tail withdrawal reflex behavior performance at each month of randomly selected animals.
TWR also varied significantly with age (p ≤ 0.01, Kruskal–Wallis, ε2 = 0.48). Pairwise Wilcoxon test (fdr-corrected p ≤ 0.05) revealed a significant decrease in TWR through the Mature life stage followed by a significant increase in TWR in the Aged life stages. This U-shaped pattern with age is different from the pattern described in Kempsell and Fieber (2014; Figure 2B); however, the steady increase in time to execute TWR after age 10 months is consistent with earlier reports (Kempsell and Fieber, 2014; Greer et al., 2018).
Principal Component and Surrogate Variable Analysis
Transcripts with zero expression across all time points and transcripts without a minimum TPM of 1 in at least one time point in one tissue were filtered out, resulting in 12,002 analysis ready transcripts.
PCA revealed that the first three principal components (PCs) explained 53% of the total variance of samples. Samples segregated strongly according to tissue along PC1, which explained 31% of the total variance (Figure 3). Three samples clustered outside the 99.7% confidence intervals of each tissue-specific cluster and thus were considered as outliers and removed from all further analysis. Samples separated roughly according to chronological age along PC2, which explained 12% of the total variance.
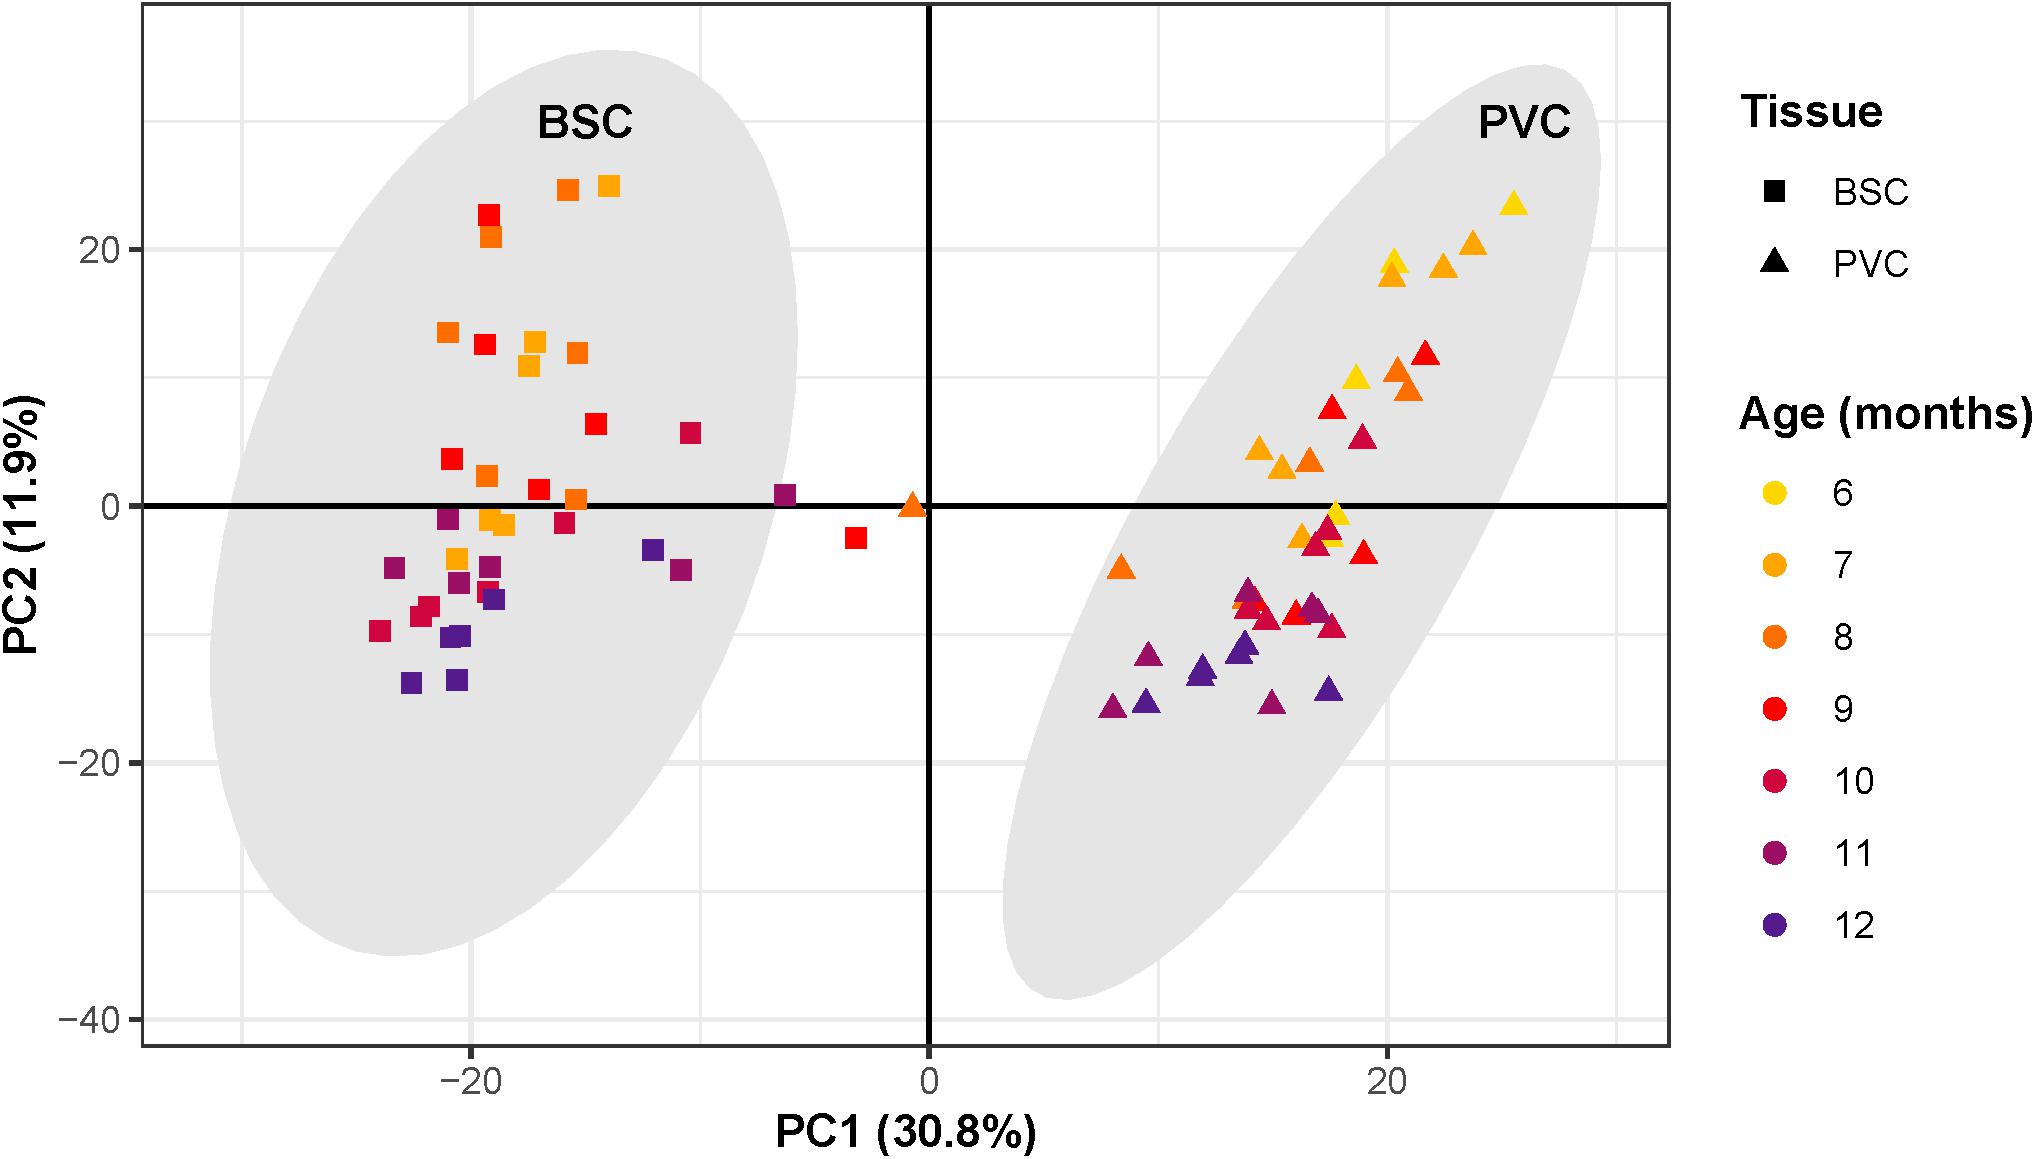
Figure 3. Principal component analysis of RNAseq samples. Scatter plot of principal component analysis with first principal component along the x-axis and second principal component along the y-axis. Each point corresponds to an individual sample. The shape of each point corresponds to sample tissue type, square for Buccal S Cluster (BCS) and triangles for Pleural Ventral Caudal cluster (PVC). Point color corresponds to age, from 6 to 12 months. Samples segregate along the first principal component according to tissue, forming two distinct clusters. Gray ovals around each cluster represent the cluster 99.7% confidence intervals. Three samples outside the tissue-cluster confidence intervals were considered outliers. Samples segregate roughly according to chronological age along the second principal component.
Surrogate variable analysis identified one surrogate variable. This surrogate variable correlated strongly with PC3, which explained 10% of the total variance. The identified surrogate variable was accounted for in downstream analysis by including it in the design model. Since variance due to PC1, a proxy for tissue type, was roughly triple that of PC2, a proxy for chronological age, differential expression analysis was performed separately on each tissue to maximize signal due to aging.
Differential Expression
LRT from the DESeq2 R package identified 1647 and 2032 differentially expressed (DE) transcripts (fdr-corrected p ≤ 0.01) for BSC and PVC, respectively, with 689 DE transcripts shared between the two tissues. A full list of differential expression results for both tissues can be found in Supplementary Tables 3, 4.
Clustering
Transcripts identified as DE were further processed for temporal profile clustering, resulting in 1319 and 1620 clustering ready transcripts for BSC and PVC, respectively. Clustering resulted in four BSC clusters and five PVC clusters (Figure 4). A full list of transcript cluster assignment results for both tissues can be found in Supplementary Tables 3, 4.
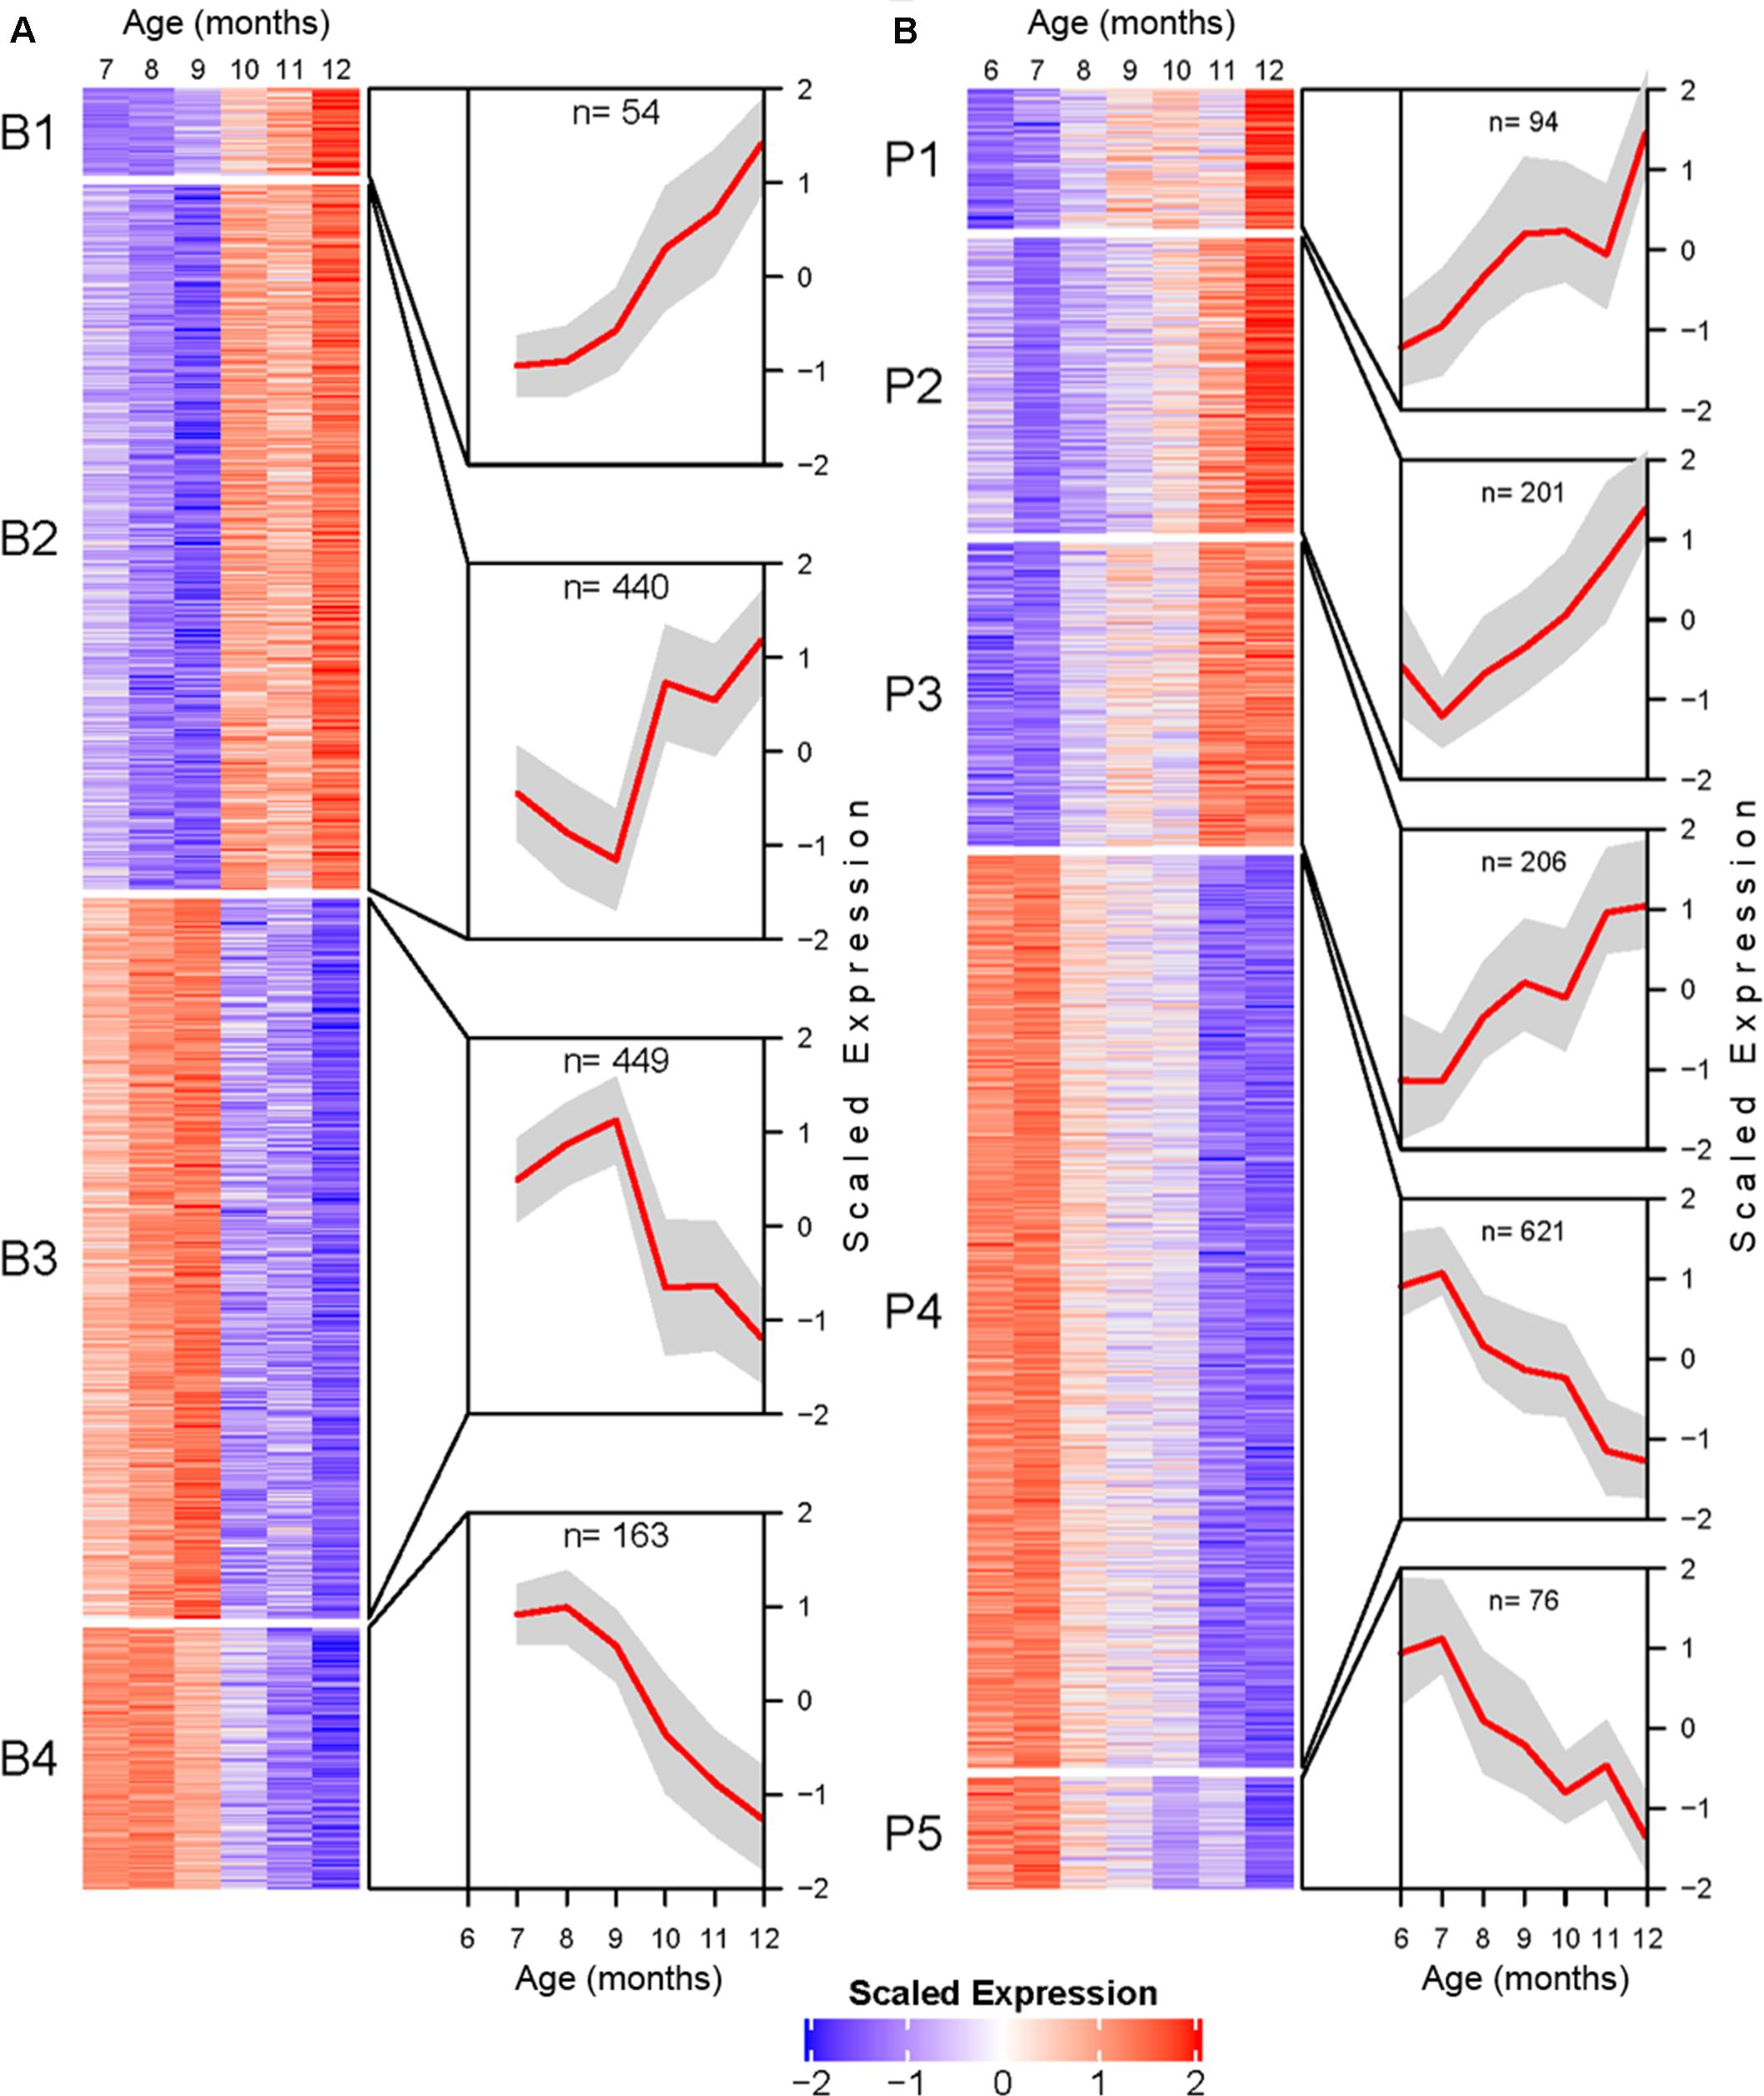
Figure 4. Transcriptional profile cluster heatmaps and trajectories for BSC (A), and PVC (B) SN. Transcripts determined to be differentially expressed by likelihood ratio test in each tissue were clustered using the DIANA clustering algorithm. Each heatmap corresponds to a cluster. Heatmap cells are mean centered and variance scaled average monthly expression for each transcript (rows) at each month (columns). Cutouts illustrate the cluster average scaled expression (y-axis) at each month (x-axis) as a red line with standard deviation as a gray polygon. Total number of genes per cluster are listed at the top of each cutout.
BSC clusters exhibit either increasing expression with age (B1 and B2) or decreasing expression with age (B3 and B4). The transcriptional trajectories of the two largest clusters (B2 and B3) form a mirrored pair. Cluster B2 decreases in average expression until reaching a minimum at 9 months, after which the expression trend sharply inflects and rapidly increases. Cluster B3 exhibits an inverse pattern to B2, increasing to a maximum at 9 months followed by rapidly decreasing average expression. The smaller clusters B1 and B4 are roughly monotonic in profile (Figure 4A).
PVC clusters exhibit similar general increasing or decreasing trends (Figure 4B). Roughly monotonically increasing (P2 and P3) or decreasing (P4 and P5) clusters represent the majority of DE PVC transcripts. Finally, cluster P1 shows a roughly logistic trajectory until approximately age 12 months, at which point the profile spikes.
Transcript Annotation Rates
BLAST annotation of Aplysia transcripts to the UNIPROT human proteome resulted in roughly 70% of all Aplysia transcripts mapping to a human ortholog (Table 2). The annotation rate for KEGG was much less, approximately 45%. However, KEGG and UNIPROT annotation rates were much higher for significantly DE transcripts, roughly 60% for KEGG and 80% for UNIPROT. For transcriptional profile clusters, the KEGG annotation rate geometric mean was approximately 53%, and that of UNIPROT was approximately 75%. A full list of BLAST annotation results can be found in Supplementary Table 5. A full list of KEGG annotation results can be found in Supplementary Tables 6, 7, Supplementary Figure 1, and Supplementary Data Sheets 1, 2.
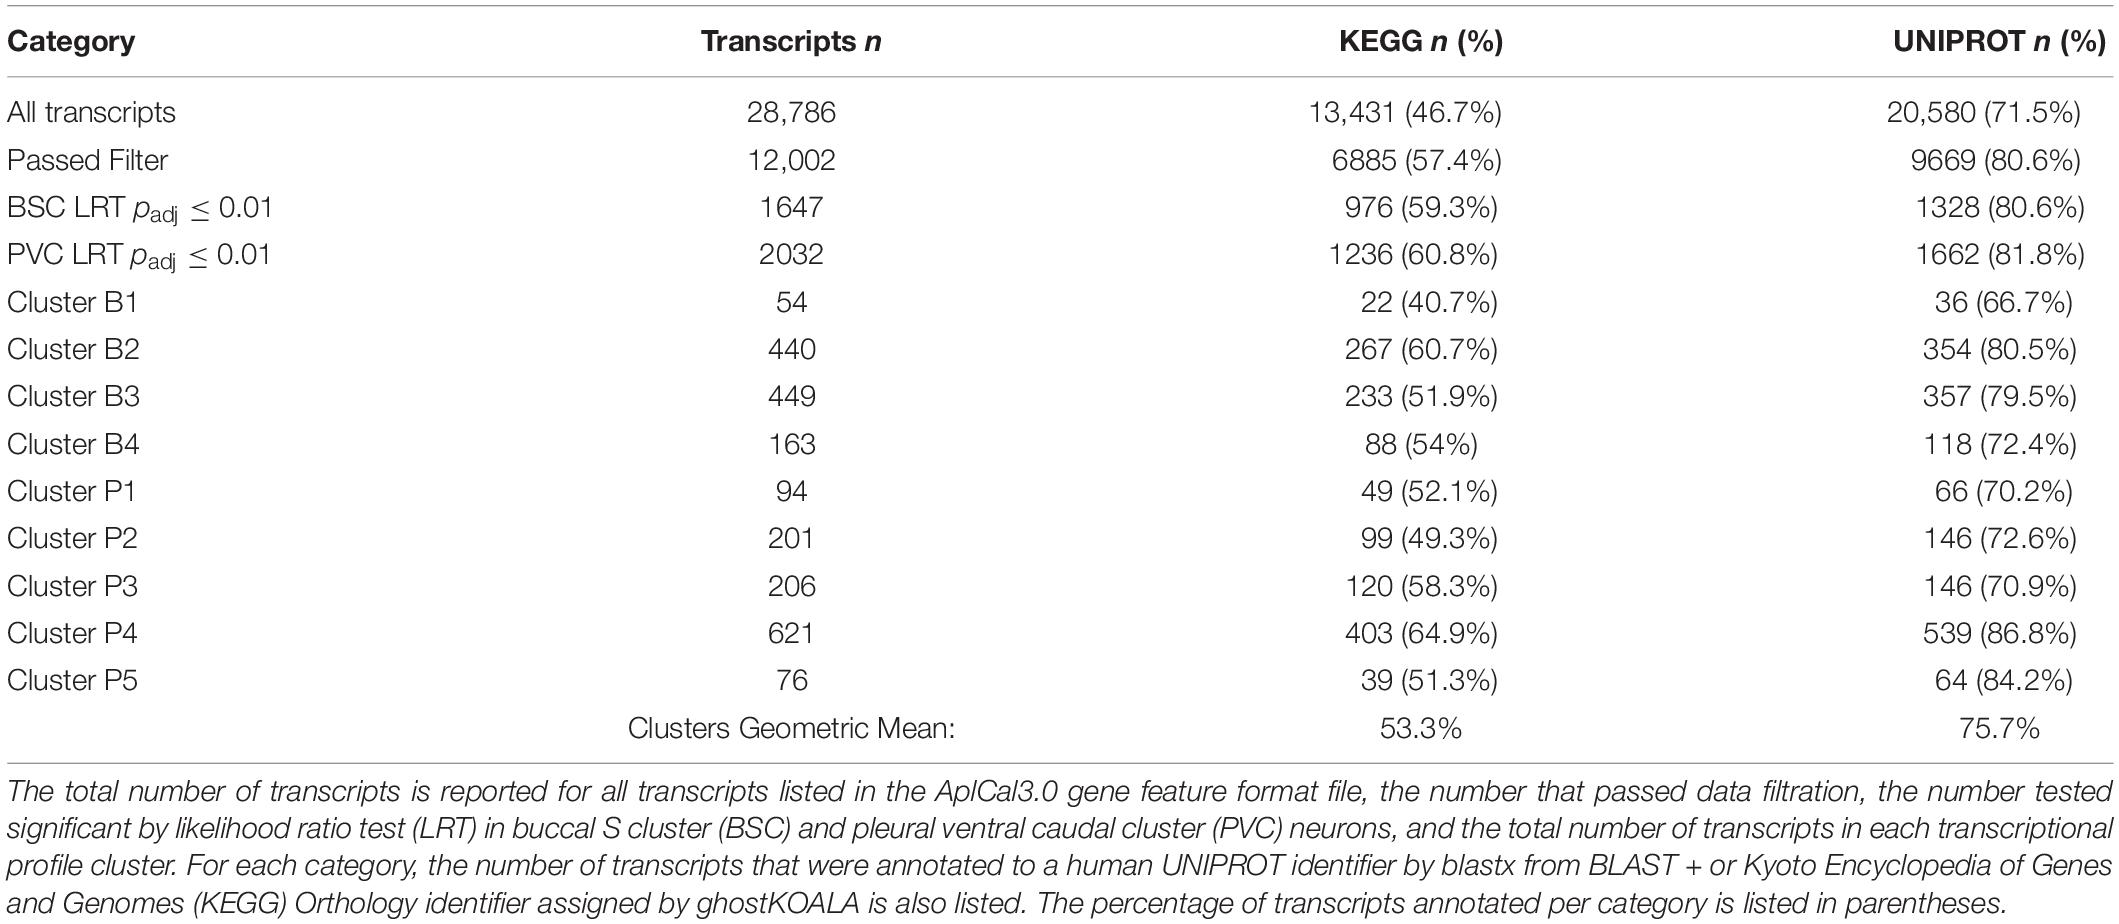
Table 2. Transcript annotation rates.
Cluster Enrichment Analysis
A summary of major discussed enrichment categories can be found in Table 3. A full set of GO enrichment results can be found in Supplementary Data Sheets 3, 4, while a full set of KEGG enrichment results can be found in Supplementary Data Sheet 5.
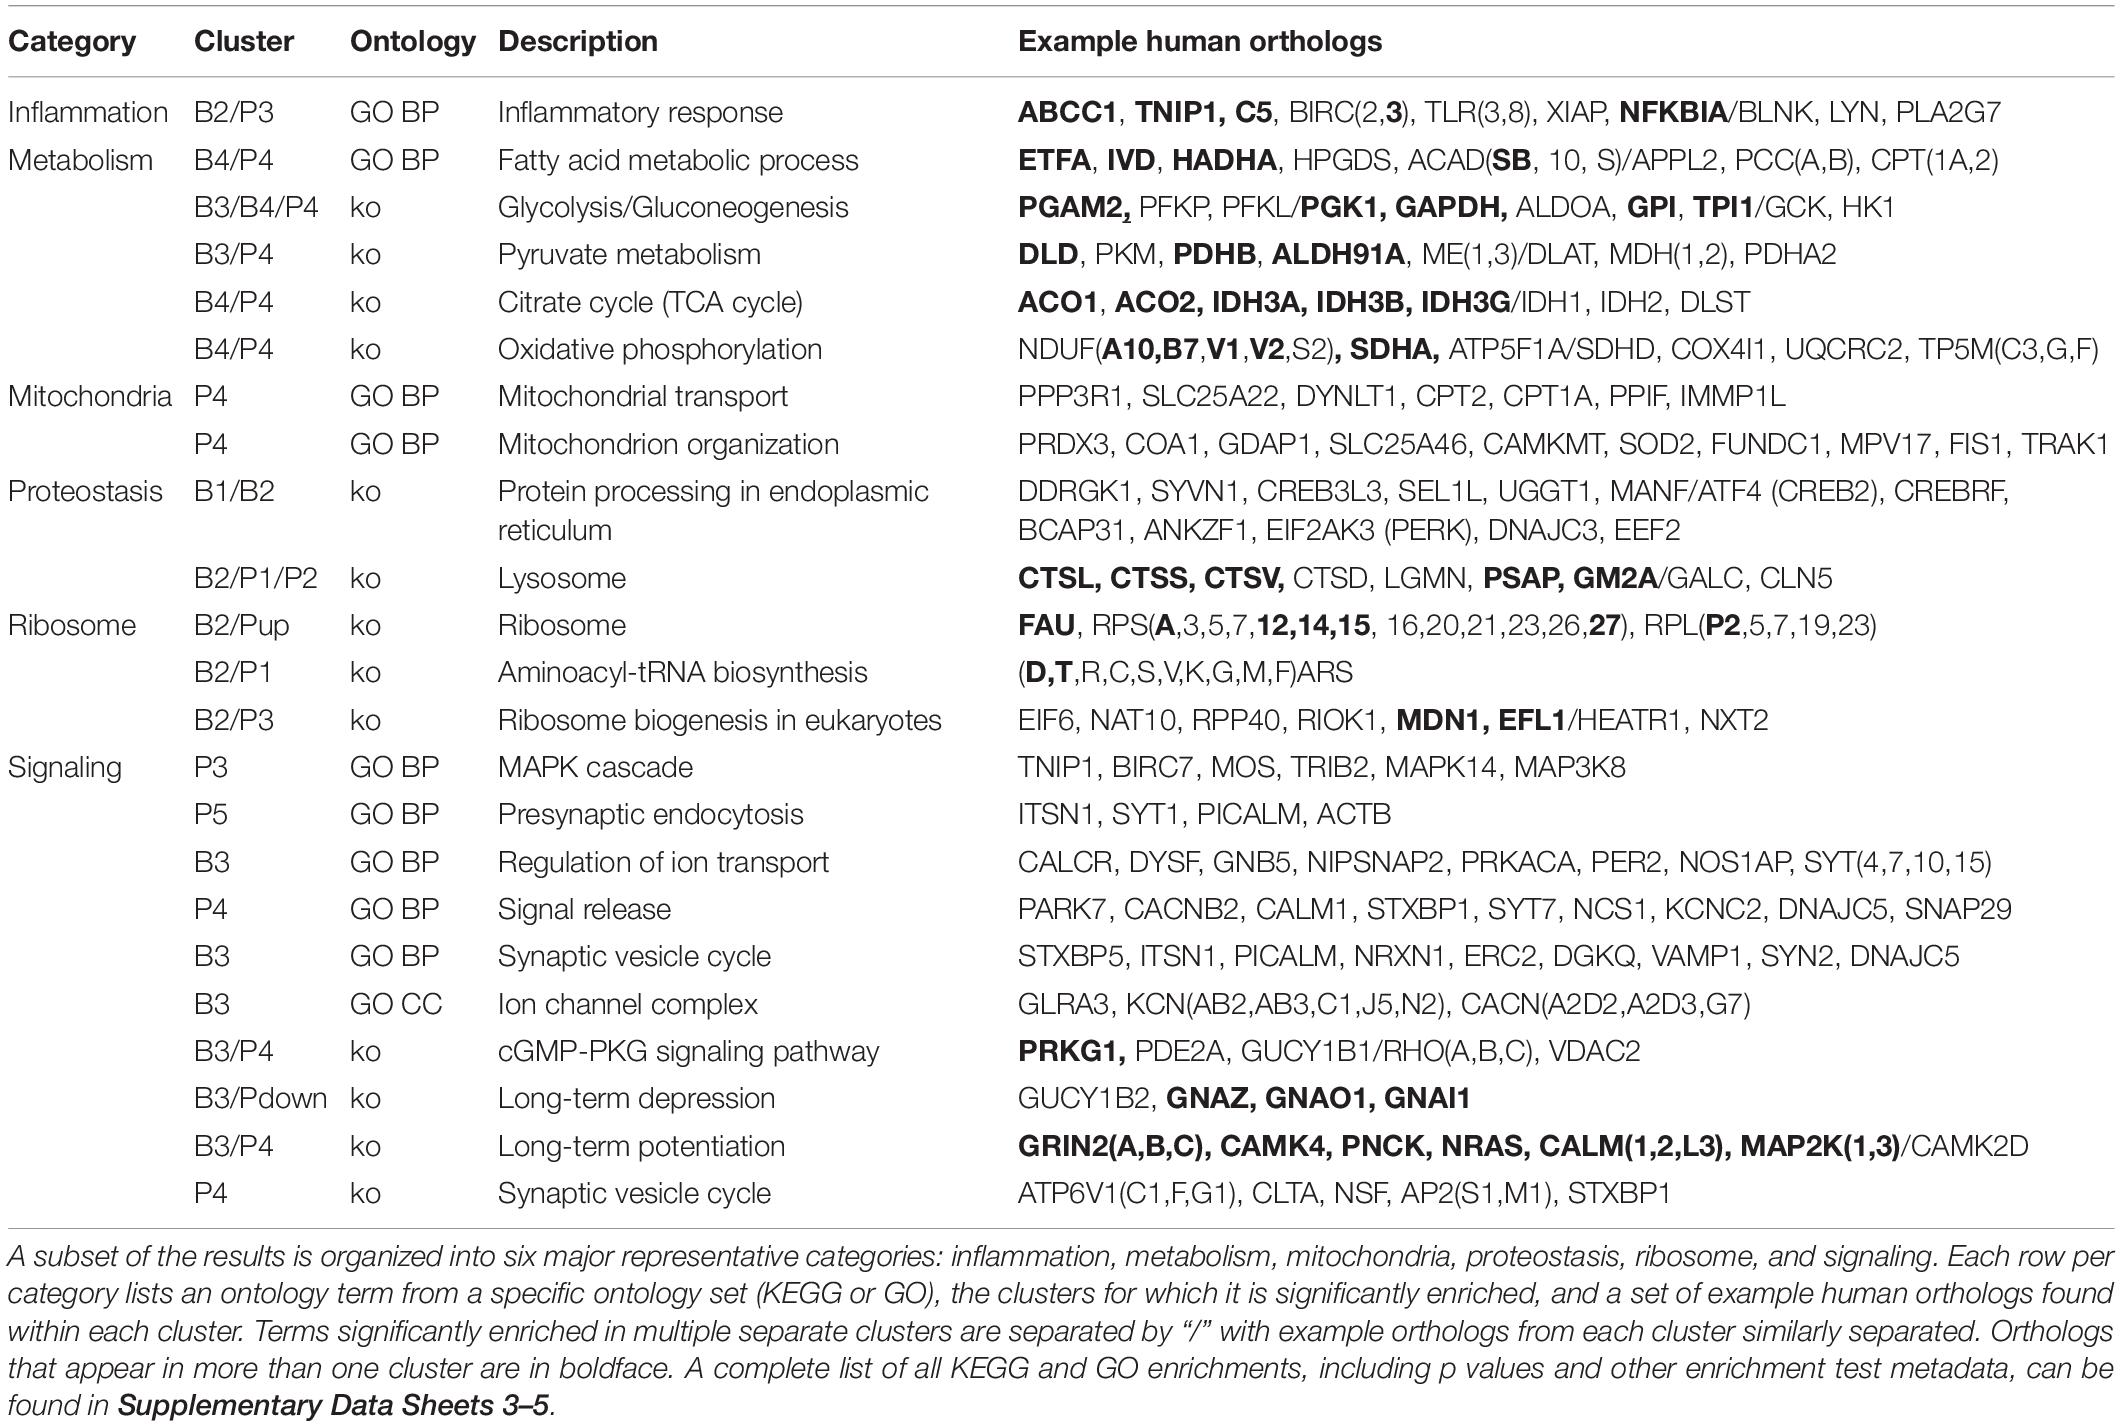
Table 3. Transcriptional profile cluster enrichment analysis results.
Enrichment analyses for increasing with age BSC cluster B1 suggest a response to disrupted proteostasis, with significant terms from clusterProfiler such as protein processing in endoplasmic reticulum (ko04141, Figure 5) and response to endoplasmic reticulum stress (GO:0034976). Enrichment from topGO further suggests perturbations in proteostasis with terms such as endoplasmic reticulum quality control compartment (GO:0044322), as well as some suggestion of inflammation with terms like regulation of acute inflammatory response (GO:0002673, Supplementary Data Sheet 3).
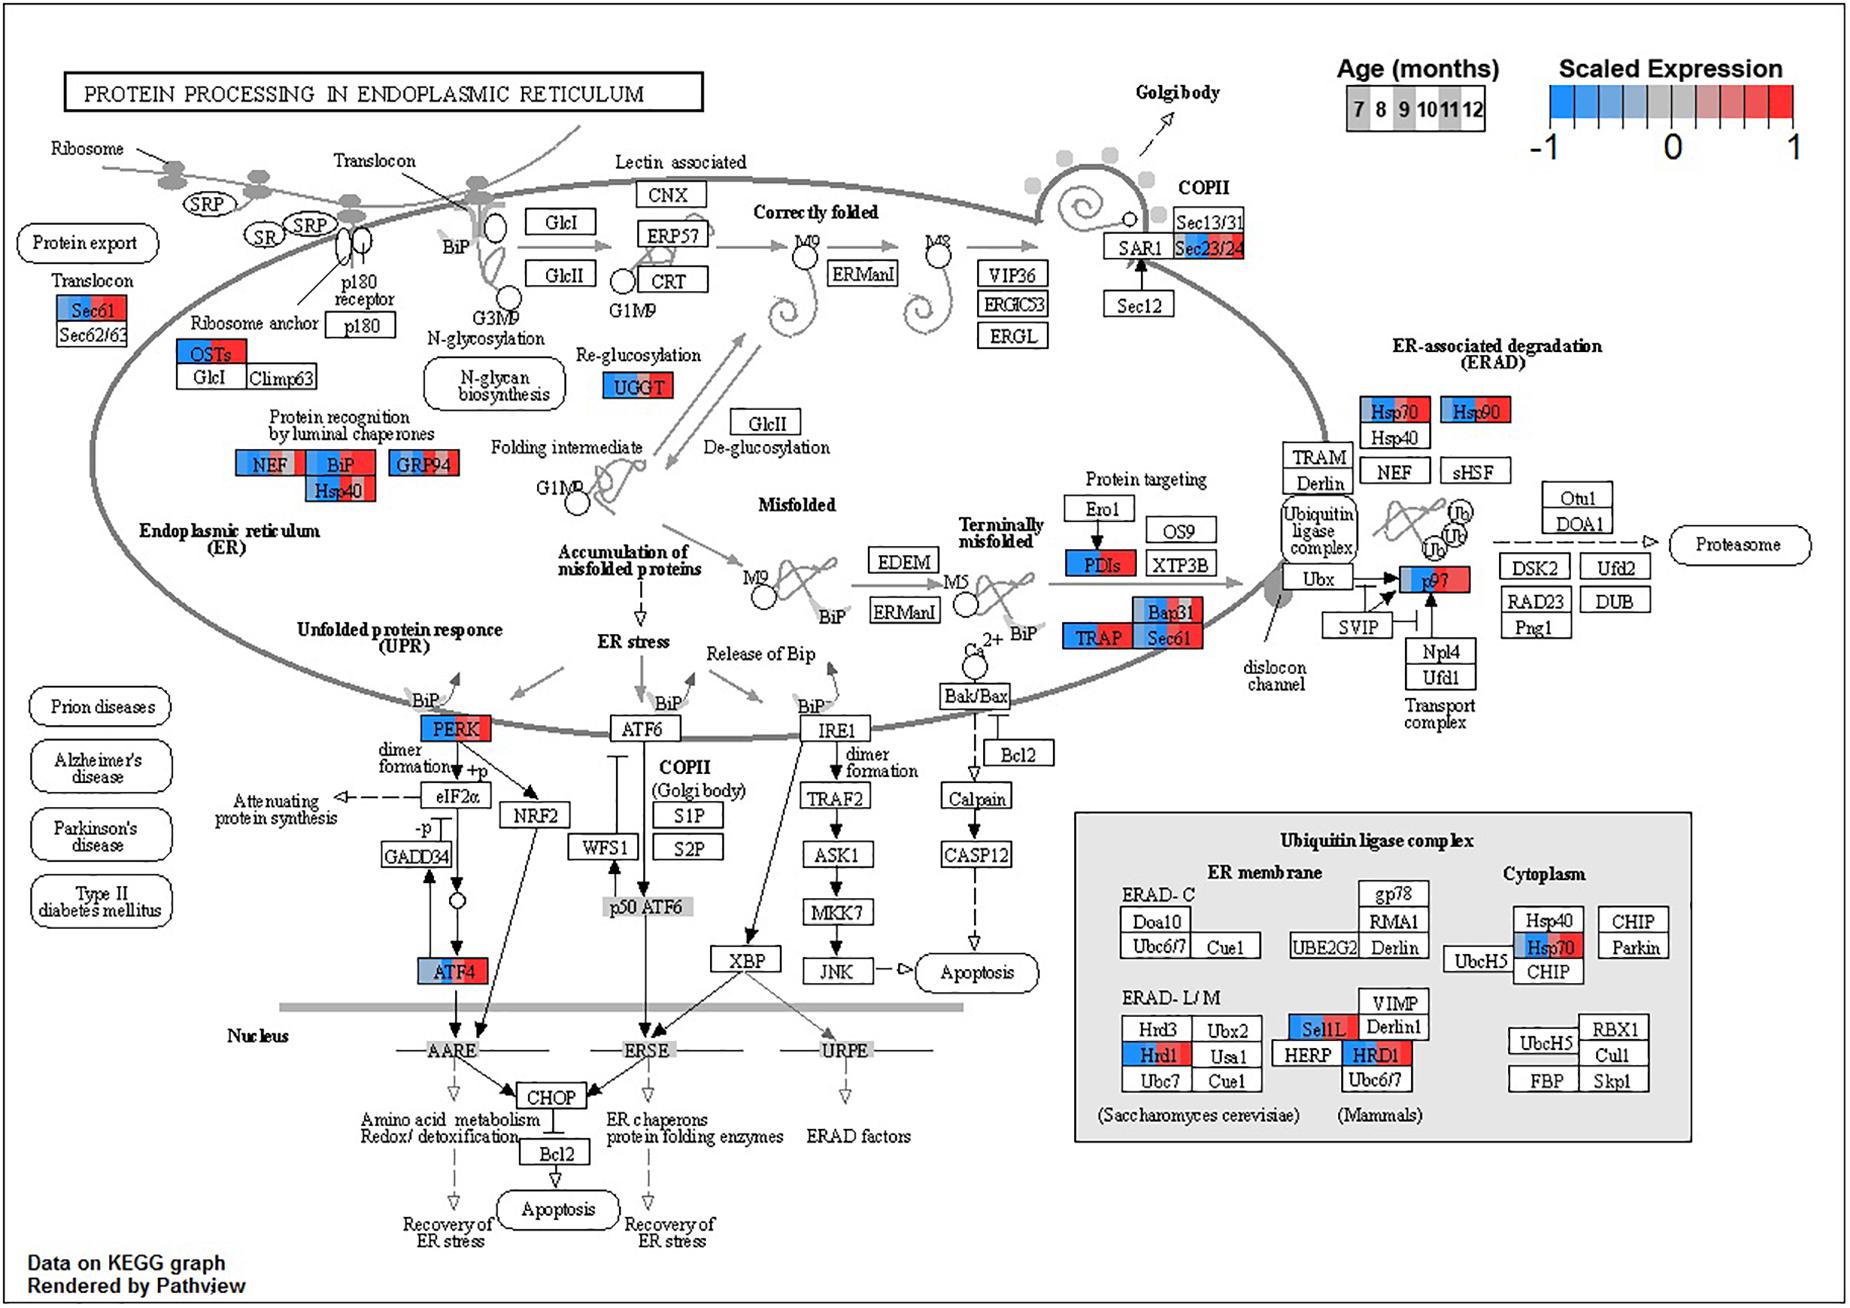
Figure 5. Expression of orthologs annotated for the Kyoto Encyclopedia of Genes and Genomes (KEGG) protein processing in Endoplasmic Reticulum (ko04141) pathway present in buccal S sensory neuron (BSC) expression clusters with increasing trend (B1 and B2). Each node of the pathway diagram represents an ortholog assigned to an Aplysia californica transcript. Nodes are divided into six colored sections, from left to right, ages 7 to 12 months. Node sections are colored according to their mean centered- and variance scaled-expression, together representing the expression trends of each node across the aging process. Nodes that are not colored were absent from the gene sets of expression clusters B1 and B2. Pathway enrichment demonstrates broad upregulation of proteostatic processes in the endoplasmic reticulum with age.
Similarly to cluster B1, BSC increasing cluster B2 is enriched for inflammation- and proteostasis-related ontologies with significant terms like inflammatory response (GO:0006954) and lysosome (ko04142, Table 3). In addition, B2 is enriched for terms relating to ribosomes and protein translation, for example, ribosome (ko03010) and aminoacyl-tRNA biosynthesis (ko00970, Table 3). Additionally, terms related to the storage of reactive metabolites such as lipid localization (GO:0010876) and iron ion binding (GO:0005506) are notable (Supplementary Data Sheet 3).
The larger decreasing BSC cluster, B3, exhibits a large number of enrichments, primarily related to neuronal processes. These include structural components like ion channel complex (GO:0034702), synaptic processes such as synaptic vesicle cycle (GO:0099504), signaling cascades like cGMP-PKG signaling pathway (ko04022), and learning processes including Long-term potentiation (ko04720) and depression (ko04730, Figure 6 and Table 3).
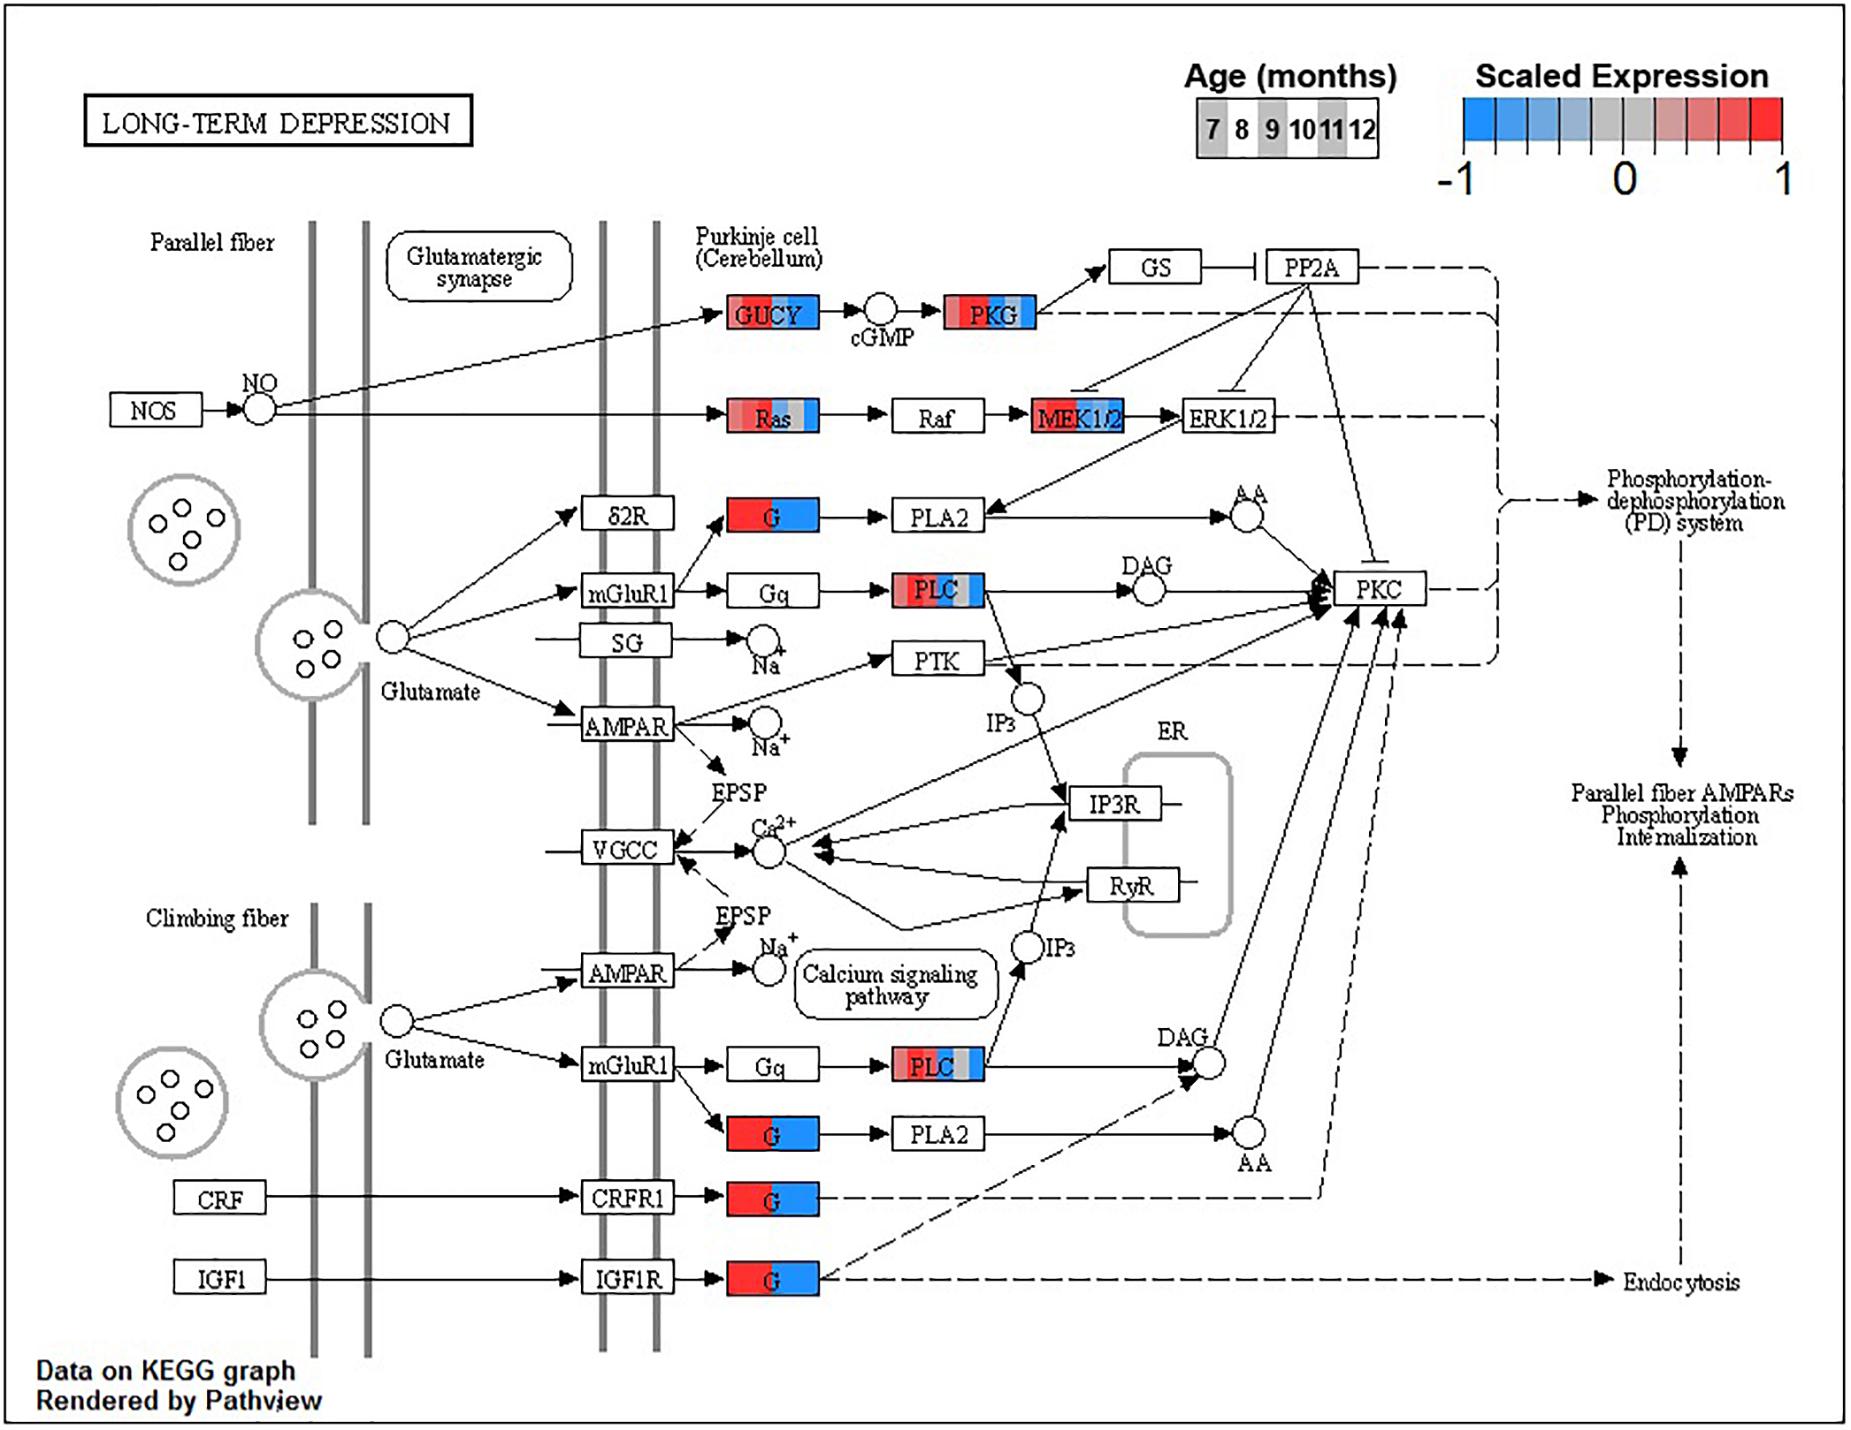
Figure 6. Expression of orthologs annotated for the Kyoto Encyclopedia of Genes and Genomes (KEGG) long-term depression (ko04730) pathway present in buccal S sensory neuron (BSC) expression clusters with decreasing trend (B3 and B4). Each node of the pathway diagram represents an ortholog assigned to an Aplysia californica transcript. Nodes are divided into six colored sections, from left to right, ages 7 to 12 months. Node sections are colored according to their mean centered and variance scaled expression, together representing the expression trends of each node across the aging process. Nodes that are not colored were absent from the gene sets of expression clusters B3 and B4. Pathway enrichment demonstrates broad downregulation of key signaling cascades in aging.
Finally, monotonically decreasing BSC cluster B4 is enriched primarily for major metabolic processes. These include the major pathways involved in the oxidative metabolism of glucose: glycolysis/gluconeogenesis (ko00010), TCA cycle (ko00020), and oxidative phosphorylation (ko00190, Table 3). Enrichment of terms related to ROS detoxification processes such as glutathione metabolic process (GO:0006749) and ROS metabolic process (GO:0072593) is also noteworthy (Supplementary Data Sheet 3).
Cluster enrichment of PVC clusters generally reflect similar major categories observed in BSC cluster enrichment (Table 3). The increasing PVC clusters P1, P2, and P3 resemble increasing cluster B2 in their enrichment.
PVC cluster P1 is enriched for proteostatic terms such as lysosome (ko04142) aminoacyl-tRNA biosynthesis (ko00970, Table 3). In addition, terms related to apoptosis such as cysteine-type endopeptidase inhibitor activity involved in apoptotic process (GO:0043027) are of note (Supplementary Data Sheet 3).
PVC cluster P2 is enriched for terms relating to proteostasis and ribosome such as lysosome (ko04142, Table 3) and ribosomal small subunit biogenesis (GO:0042274, Supplementary Data Sheet 3). Furthermore, like B2, P2 exhibits enrichment in terms related to volatile metabolite storage such as lipid storage (GO:0019915, Supplementary Data Sheet 3) and mineral absorption (ko04978, Supplementary Data Sheet 5).
The largest of the three increasing PVC clusters, P3, is similar to cluster B2 in enrichment for ribosome- and inflammation-related terms, such as ribosome biogenesis in eukaryotes (ko03008) and inflammatory response (GO:0006954, Table 3). Interestingly, MAPK cascade (GO:0000165) is enriched in cluster P3, with many representative orthologs involved in pro-inflammatory signaling, such as MAPK14 (Table 3).
Conversely, enrichment of terms in decreasing PVC cluster P4 resembles an amalgamation of decreasing BSC clusters B3 and B4. P4 is enriched for many of the same terms in cluster B3 associated with neuronal function such as cGMP-PKG signaling pathway (ko04022) and long-term potentiation (ko04720, Figure 7) or analogous terms like signal release (GO:0023061, Table 3). However, P4 is most significantly enriched for the same major metabolic pathways as B4, such as glycolysis and gluconeogenesis (ko00010, Figure 8), TCA cycle (ko00020, Figure 9), and oxidative phosphorylation (ko00190, Figure 10 and Table 3). Interestingly, P4 is further enriched for several processes associated with mitochondrial health, such as mitochondrion organization (GO:0007005, Table 3), and antioxidant defense, such as glutathione metabolism (ko00480, Supplementary Data Sheet 5). The enrichment of these categories in downregulated cluster P4 together suggests general mitochondrial dysfunction with age.
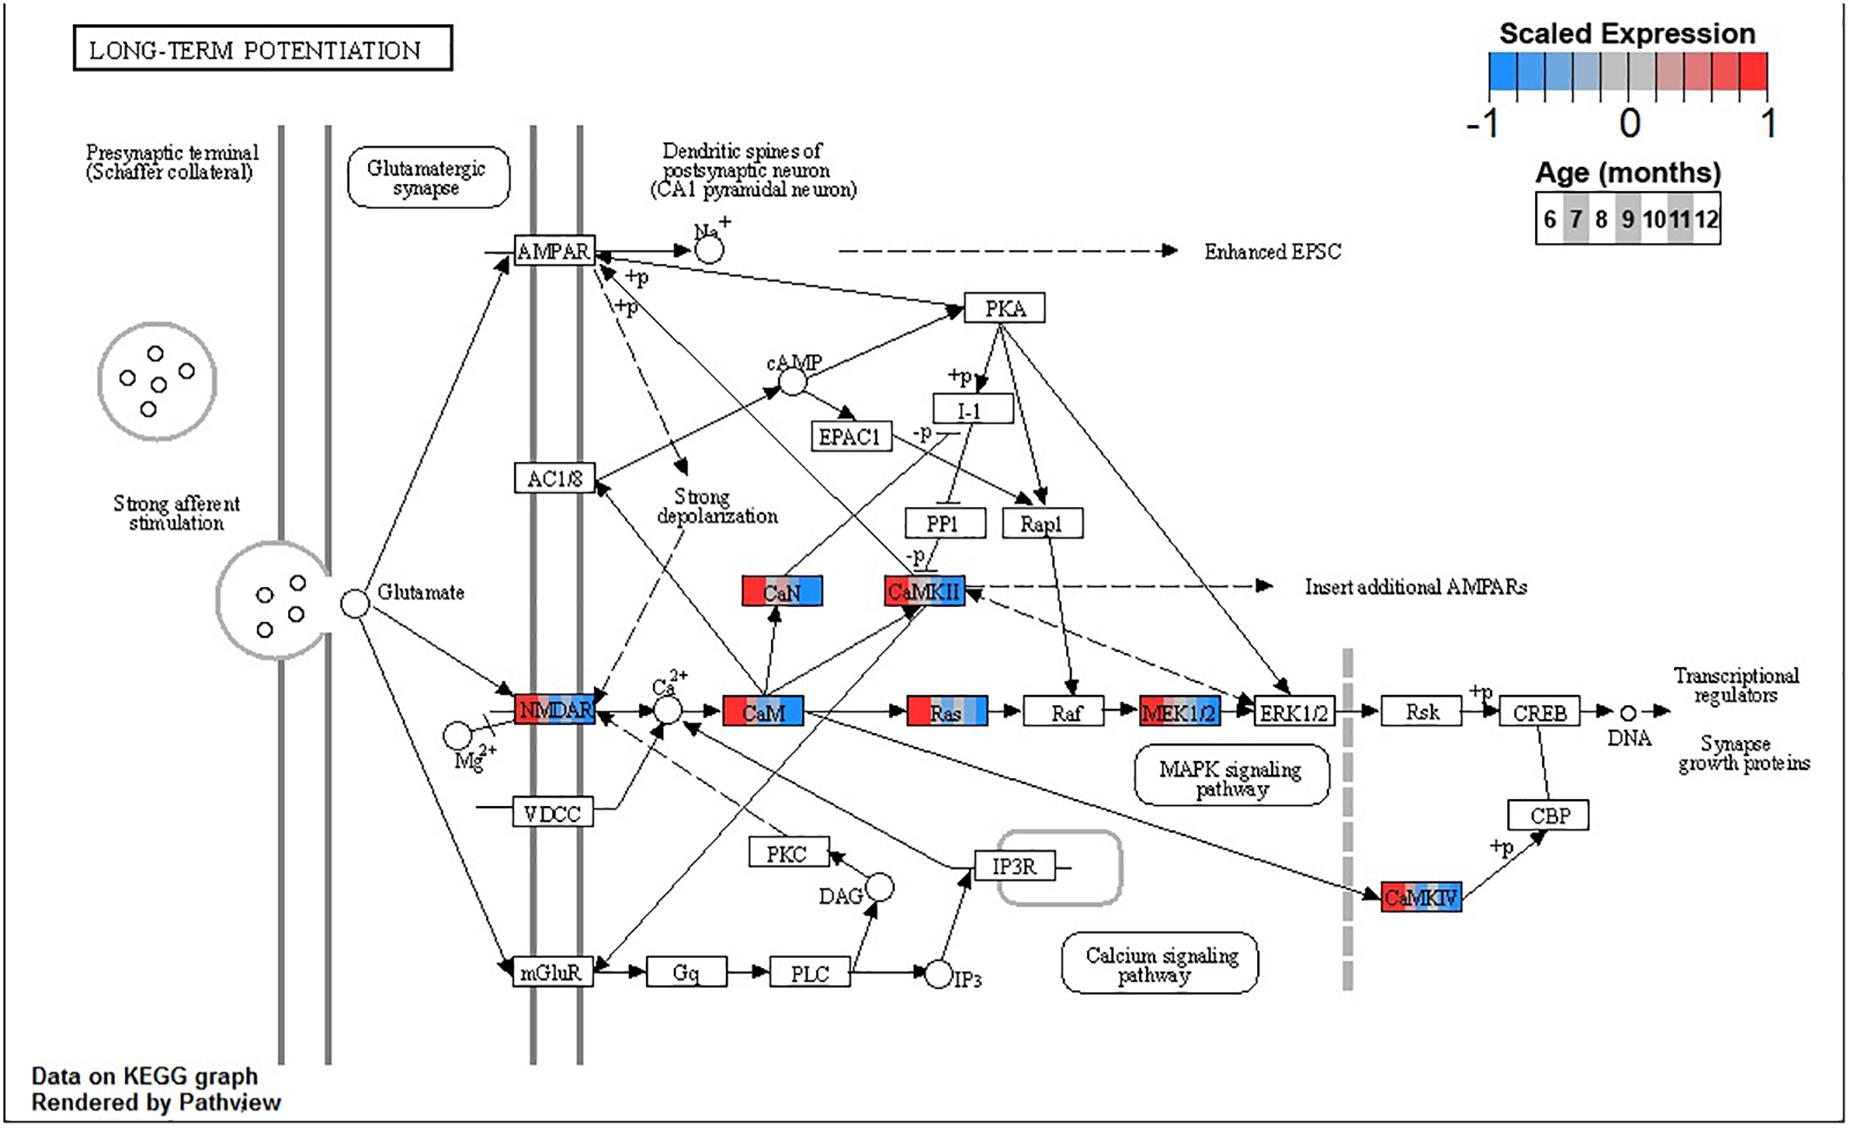
Figure 7. Expression of orthologs annotated for the Kyoto Encyclopedia of Genes and Genomes (KEGG) long-term potentiation (ko04720) pathway present in pleural ventral caudal sensory neuron (PVC) expression clusters with decreasing trend (P4 and P5). Each node of the pathway diagram represents an ortholog assigned to an Aplysia californica transcript. Nodes are divided into seven colored sections, from left to right, ages 6 to 12 months. Node sections are colored according to their mean centered and variance scaled expression, together representing the expression trends of each node across the aging process. Nodes that are not colored were absent from the gene sets of expression clusters P4 and P5. Pathway enrichment demonstrates broad downregulation of key signaling cascades in aging.
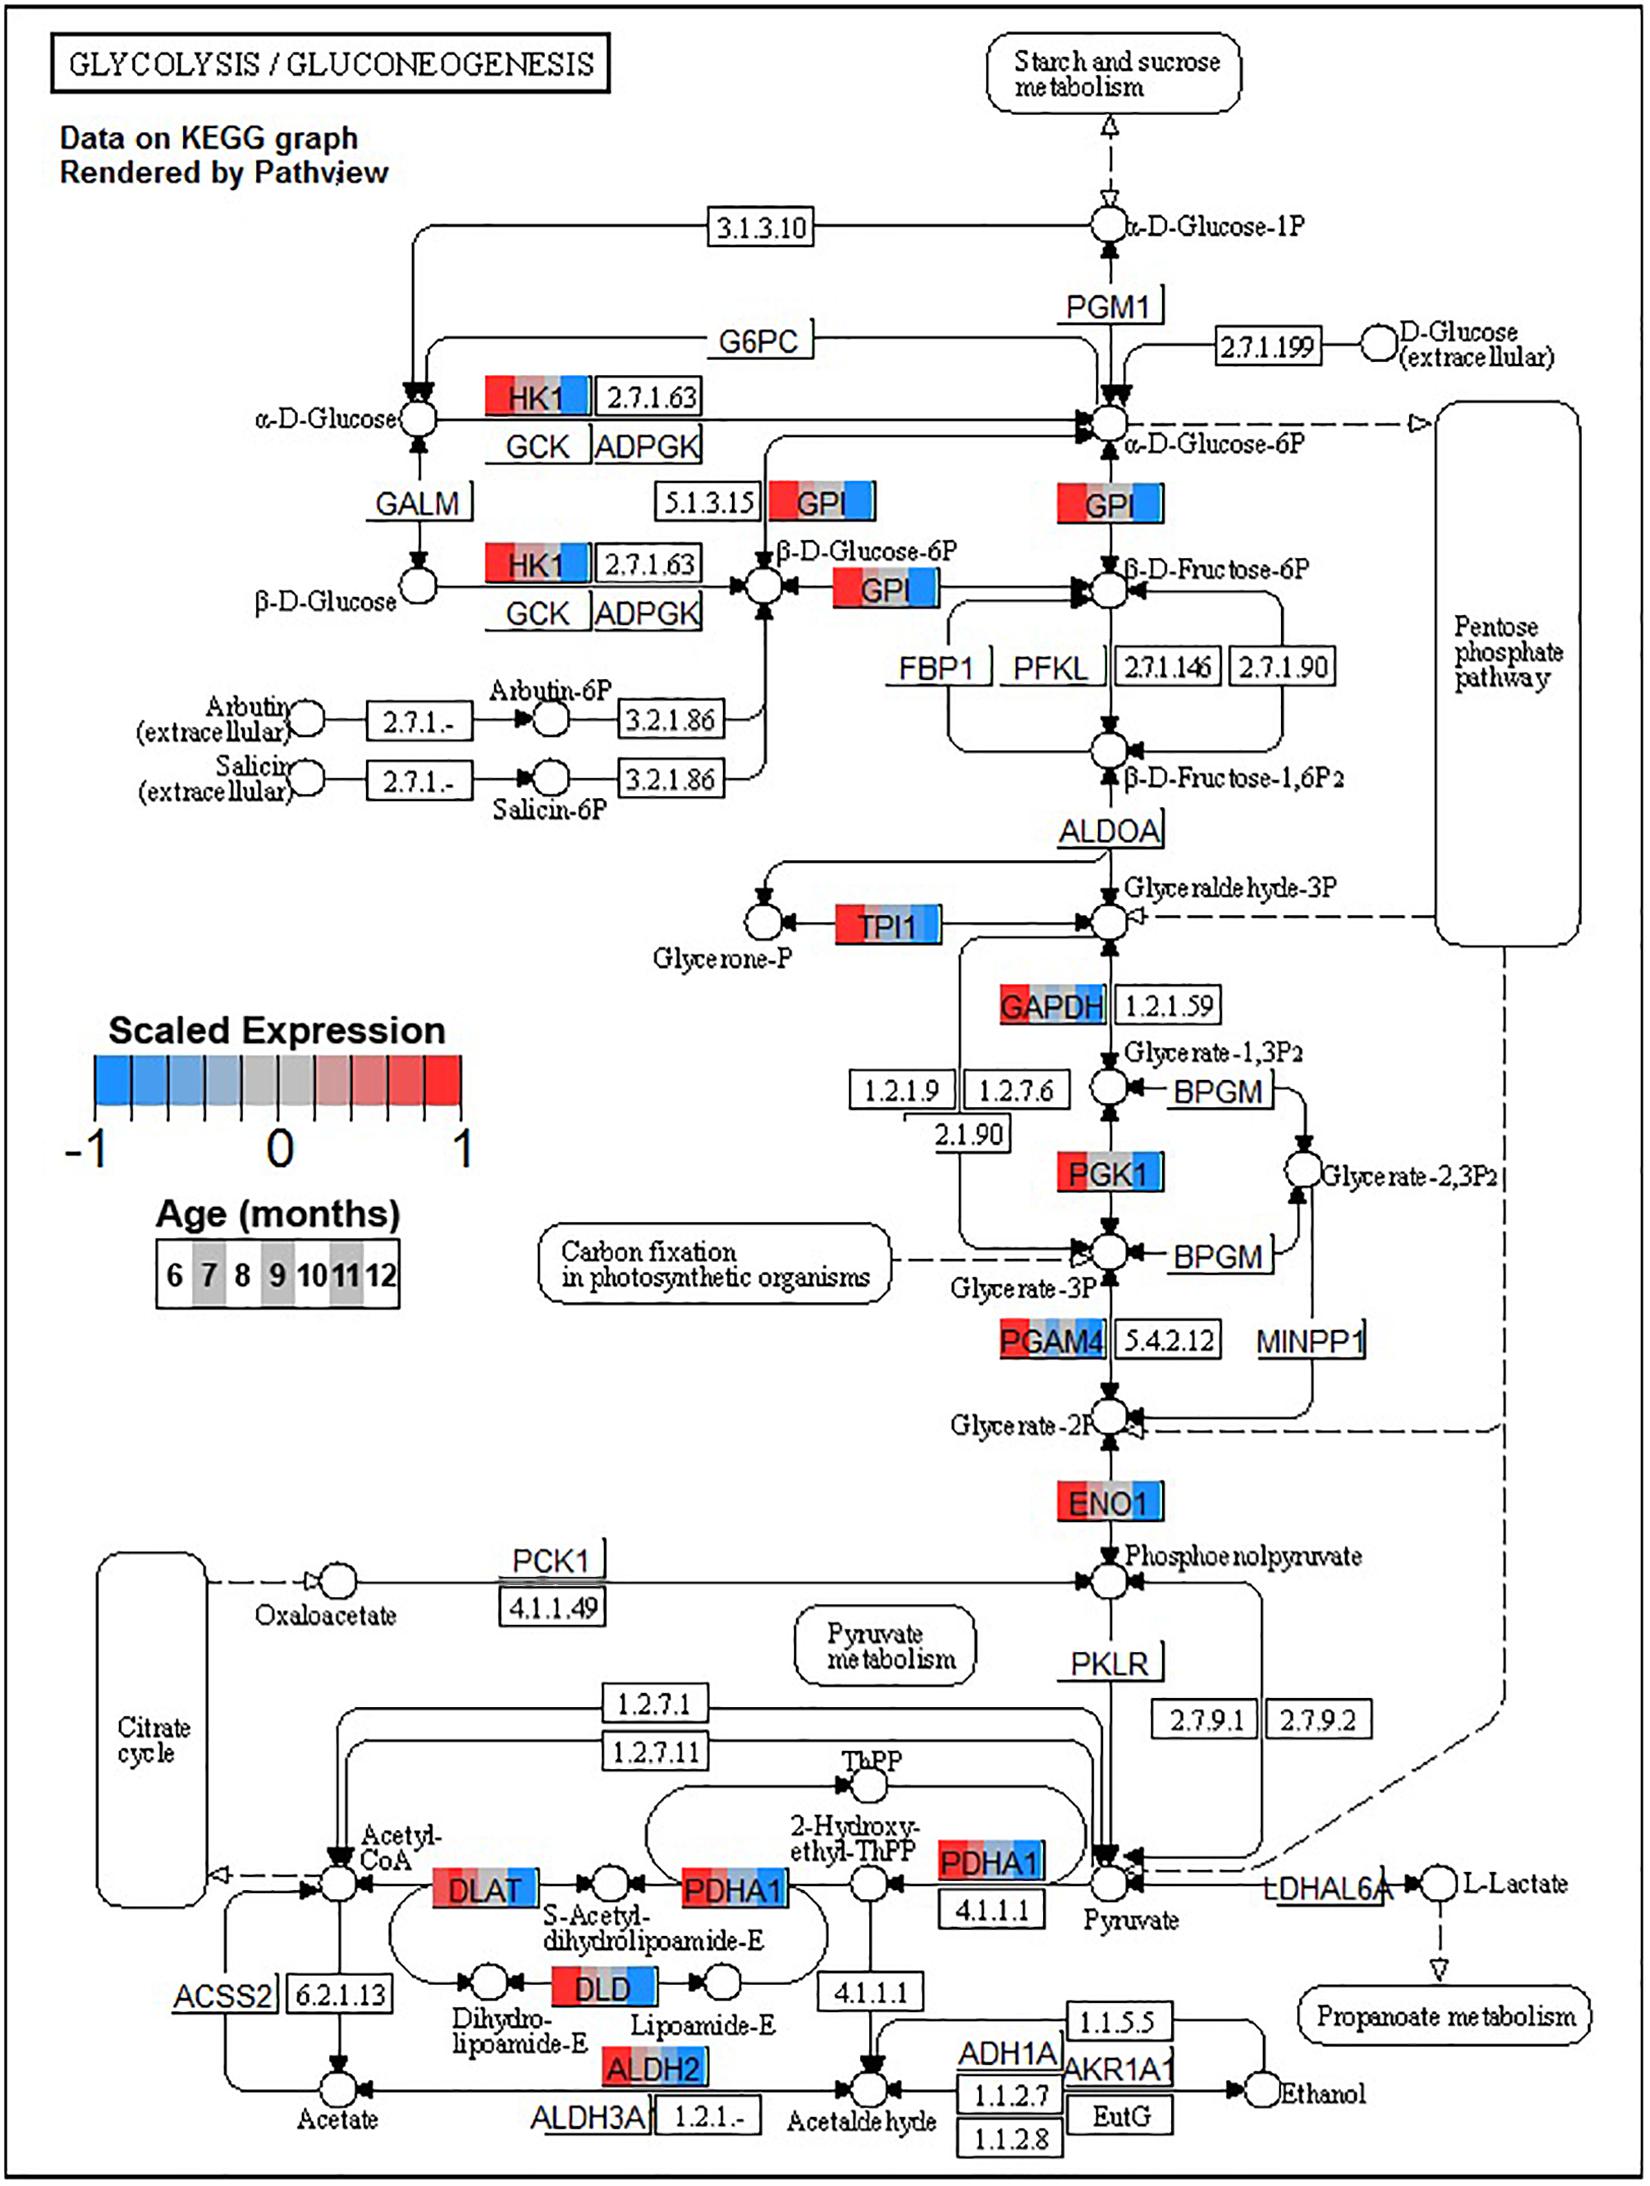
Figure 8. Expression of orthologs annotated for the Kyoto Encyclopedia of Genes and Genomes (KEGG) glycolysis and gluconeogenesis (ko00010) pathway present in pleural ventral caudal sensory neuron (PVC) expression clusters with decreasing trend (P4 and P5). Each node of the pathway diagram represents an ortholog assigned to an Aplysia californica transcript. Nodes are divided into seven colored sections, from left to right, ages 6 to 12 months. Node sections are colored according to their mean centered and variance scaled expression, together representing the expression trends of each node across the aging process. Nodes that are not colored were absent from the gene sets of expression clusters P4 and P5. Pathway enrichment demonstrates broad downregulation in glucose metabolism with age including pathways involved in synthesis of acetyl-CoA from pyruvate, which feeds into the TCA cycle.
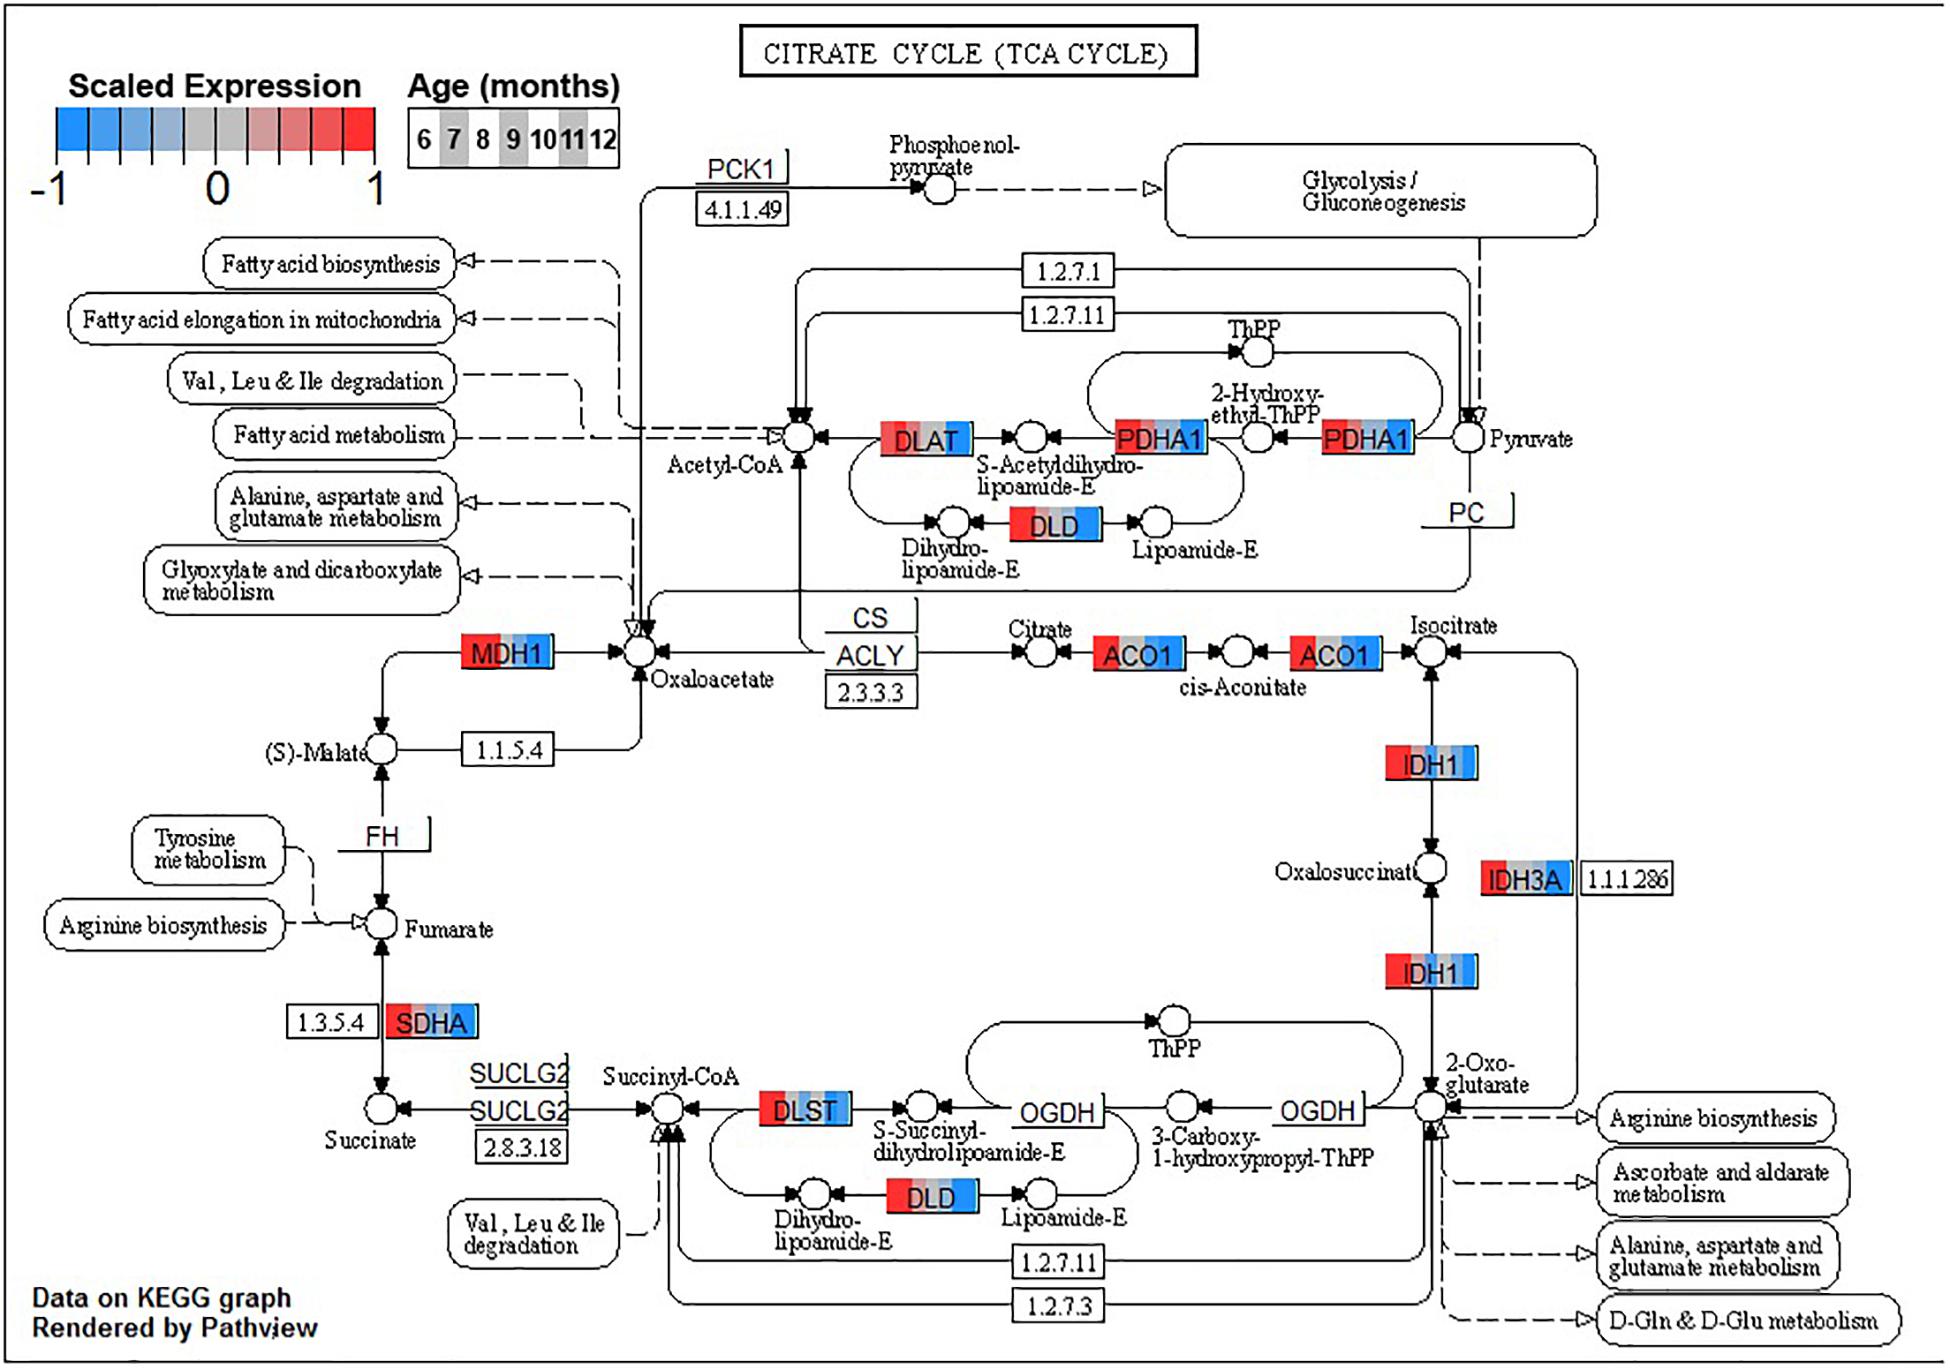
Figure 9. Expression of orthologs annotated for the Kyoto Encyclopedia of Genes and Genomes (KEGG) tricarboxylic acid cycle (ko00020) pathway present in pleural ventral caudal sensory neuron (PVC) expression clusters with decreasing trend (P4 and P5). Each node of the pathway diagram represents an ortholog assigned to an Aplysia californica transcript. Nodes are divided into seven colored sections, from left to right, ages 6 to 12 months. Node sections are colored according to their mean centered and variance scaled expression, together representing the expression trends of each node across the aging process. Nodes that are not colored were absent from the gene sets of expression clusters P4 and P5. Pathway enrichment suggests decreased oxidation of acetyl-CoA in these neurons with increasing age.
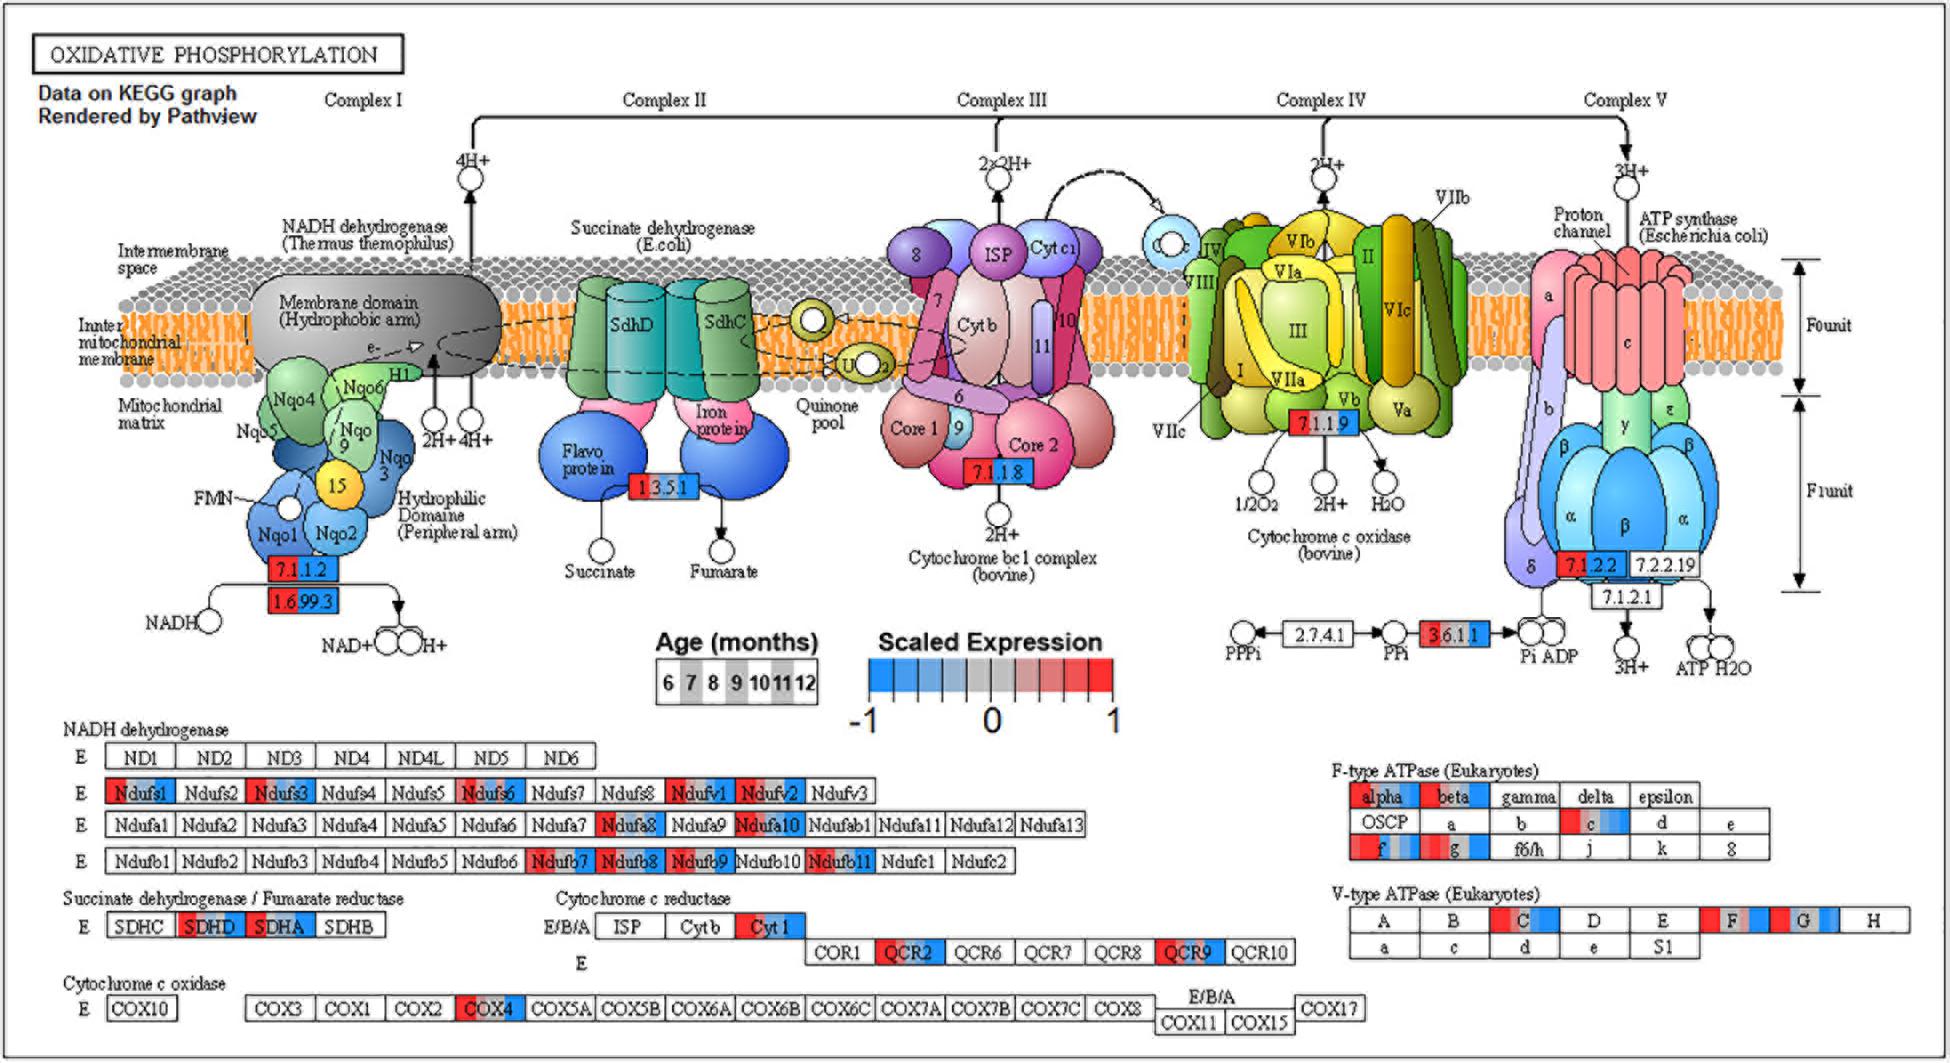
Figure 10. Expression of orthologs annotated for the Kyoto Encyclopedia of Genes and Genomes (KEGG) oxidative phosphorylation (ko00190) pathway present in pleural ventral caudal sensory neuron (PVC) expression clusters with decreasing trend (P4 and P5). Each node of the pathway diagram represents an ortholog assigned to an Aplysia californica transcript. Nodes are divided into seven colored sections, from left to right, ages 6 to 12 months. Node sections are colored according to their mean centered and variance scaled expression, together representing the expression trends of each node across the aging process. Nodes that are not colored were absent from the gene sets of expression clusters P4 and P5. Pathway enrichment indicates that all components of the electron transport chain in mitochondria are inhibited with aging and thus energy production from ATP synthase is likely to be reduced with aging.
Finally, decreasing PVC cluster P5 enrichment is sparse but has a similar neuronal character to decreasing clusters B3 and P4. Specifically, P5 is enriched for terms relating to synaptic function, such as presynaptic endocytosis (GO:0140238, Table 3) or signaling cascades such as kinase regulator activity (GO:0019207, Supplementary Data Sheet 3).
Discussion
Transcriptional profile clustering of transcripts differentially expressed in aging from Aplysia SN clusters identified four and five coherent transcriptional patterns from BSC and PVC, respectively. GO and KEGG enrichment analysis of these clusters revealed enrichment for energy metabolism, mitochondrial homeostasis, and various signaling pathways in clusters with expression profiles exhibiting decreasing trajectory in aging (clusters B3, B4, P4, and P5). Meanwhile, clusters with increasing transcriptional profile trajectories in aging (clusters B1, B2, P1, P2, and P3) were enriched for pathways associated with inflammation, proteostasis, and ribosomes.
The weight distribution of this cohort was similar to those observed previously in similar rearing conditions (Gerdes and Fieber, 2006; Kempsell and Fieber, 2014). Decreases in weight starting at age 9–10 months is diagnostic of transition into the Aged I life stage. Mortality was similarly within previously reported ranges. Reflex behavior data fell within expected norms and verified that normal aging occurred during late mature and aged stages (Greer et al., 2018). TTR conformed to the Aplysia Stages of Aging model (Kempsell and Fieber, 2014), with 10-month animals representing aged stage AI and 11- to 12-month animals representing stage AII. TWR, despite exhibiting a U-shaped trajectory over the adult lifespan, increased steadily after age 10 months, with TWR times of age 10–12 months corroborating the TTR data, as reported in previous studies (Kempsell and Fieber, 2014; Greer et al., 2018).
PCA analysis and transcriptional trajectories of PVC vs BSC SN suggest that these different neuron types age somewhat differently. Similar phenomena have been described in physiological and transcriptional aging phenotypes between neuron types in Aplysia previously and may echo known brain region-specific aging patterns in humans (Moroz and Kohn, 2010; Kempsell and Fieber, 2014; Marjanska et al., 2017). However, enrichment analysis suggests that aging in these groups of neurons is broadly similar, as many cellular processes known to be affected by aging among other neural aging models are common to both PVC and BSC.
A striking commonality between BSC and PVC aging is the consistent decline in major metabolic pathways with aging as reflected in monotonically decreasing clusters B4 and P4. Age-associated decreases in glucose metabolism have been observed in the nervous systems of flies (Ma et al., 2018) and rodents (Hoyer, 1985) and in several regions of the human brain (Nugent et al., 2014; Camandola and Mattson, 2017). The key enzymes involved in glycolysis are downregulated in both BSC and PVC (Figure 8), indicating overall declines in glucose metabolism (Table 3). Glycolysis has been demonstrated to be particularly important for neurons as the primary fast energy source during metabolically demanding events such as neuronal signaling (Jang et al., 2016; Diaz-Garcia and Yellen, 2019). In mouse, decreases in glycolysis-derived ATP specifically altered synaptic transmission of presynaptic neurons (Lujan et al., 2016), raising the possibility that similar changes in transmission observed in aged PVC previously (Kempsell and Fieber, 2014) may be linked to decreased glycolysis. Clusters B4 and P4 are also enriched for pyruvate metabolism (ko00620), suggesting decreased activity of the pyruvate dehydrogenase complex (PDH) and decreased utilization of glucose for Acetyl-CoA flux into the TCA cycle with age.
Decreased activity of PDH and associated shifts toward anaerobic glycolysis has been observed in the aging rat brain (Zhou et al., 2008, 2009). Other sources of Acetyl-CoA for the TCA cycle, namely, fatty acid metabolic process (GO:0006631), showed decreases in aging in clusters B4 and P4 as well, suggesting decreased general capacity of the TCA cycle with age in these neurons. Maintenance of Acetyl-CoA levels has been demonstrated to be neuroprotective in aging mouse brains, likely due to sustained TCA cycle activity (Currais et al., 2019). In conjunction with downregulation of input pathways, the TCA cycle itself exhibited many genes with reduced expression in clusters B4 and P4, further suggesting a metabolic shift away from oxidative metabolism of glucose with age.
Decreased TCA activity has also been observed in the aging brains of rodents (Srividhya et al., 2009; Lin et al., 2014), humans (Boumezbeur et al., 2010), and C. elegans (Hastings et al., 2019) and in the aging yeast model for post-mitotic cells (Samokhvalov et al., 2004). Decreased activity of the TCA cycle decreases the amount of NADH available for the generation and maintenance of mitochondrial potential, resulting in decreased ATP production, increases in the production ROS such as H2O2, and impaired NADPH-dependent antioxidant defense (Zhou et al., 2009; Nickel et al., 2015). Decreased TCA activity would suggest decreased activity of the OXPHOS pathway, and indeed clusters B4 and P4 exhibit enrichment for OXPHOS.
The observed downregulation of mitochondrial OXPHOS complex transcripts in PVC and BSC is a phenomenon common to the aging nervous systems of rodents (Zahn et al., 2007; de Magalhaes et al., 2009), human (Glass et al., 2013; Kumar et al., 2013; Mastroeni et al., 2017), worms (McCarroll et al., 2004), flies (Davie et al., 2018), and a short-lived teleost (Baumgart et al., 2014, 2016). These transcriptional changes are known to co-occur with mitochondrial dysfunction that results in decreased ATP production, increased ROS production, and compromised Ca+2 buffering capacity (Ojaimi et al., 1999; Ferguson et al., 2005; Pandya et al., 2015, 2016). Neurons and their mitochondria are particularly at risk from the effects of ROS due to their high energy demands and long lifespans (Grimm and Eckert, 2017).
These metabolic impairments contribute to and can be driven by chronic generation of surplus ROS that overwhelm antioxidant defenses and transform otherwise hormetic ROS into drivers of metabolic failure (Grimm and Eckert, 2017; Guo et al., 2020). KEGG and GO enrichment suggests decreased activity of antioxidant systems in both these neuron types. In addition, decreased expression of key antioxidants like SOD2, Catalase, and GPX4 suggests that risk of deleterious ROS damage increases with age in these SN, as observed in other aging models (Sandhu and Kaur, 2002; Haddadi et al., 2014). The decreases in mitochondrial metabolism and antioxidant system transcripts observed suggest that PVC and BSC experience mitochondrial impairment with age, a notion further suggested by downregulation of an ortholog of mitophagy regulator FUNDC1 in both BSC and PVC (Chen et al., 2016), as well as several other mitochondrial maintenance orthologs in PVC. Because mitophagy is a key component in the process of mitochondrial maintenance and recycling, any impairment of this pathway would likely exacerbate mitochondrial dysfunction and the resultant loss of energy metabolism and ROS management in aging cells.
The aforementioned shift from aerobic to anaerobic use of glucose-derived pyruvate due to decreased PHD activity in aging rat brain is hypothesized to be in response to increased H2O2 production in NADH-depleted mitochondria (Zhou et al., 2008, 2009). Furthermore, oxidative damage has been shown to impair activity of numerous TCA enzymes, such as isocitrate dehydrogenase and aconitase, in many aging models (Das et al., 2001; Schriner et al., 2005; Di Domenico et al., 2010; Hastings et al., 2019; Guo et al., 2020). Both of these enzymes are also downregulated in PVC and BSC with age (Figure 9). Increases in brain oxidation state is a known hallmark of brain aging observed across species, and KEGG and GO enrichment results suggest that PVC and BSC exhibit an increased oxidative state in aging as well (Garaschuk et al., 2018). In this state, ROS compromises the function of not only metabolic enzymes (Di Domenico et al., 2010) but also proteins key to neuronal function such as calcium sensors and neurotransmitter receptors, contributing to age-associated cognitive impairment (Gao et al., 1998; Pieta Dias et al., 2007; Haxaire et al., 2012). Under normal conditions, protein oxidization is mitigated with antioxidant systems and oxidized proteins are efficiently removed by lysosomes and proteasomes (Hohn et al., 2013; Jackson and Hewitt, 2016). However, in aging, these antioxidant and proteolytic systems are known to become inefficient and neurons experience proteostatic stress (Chaudhari et al., 2014).
KEGG and GO enrichment analyses suggest that proteostasis is compromised in both tissues in aging. Particularly in BSC, upregulation with age in endoplasmic reticulum protein folding-related transcripts in monotonically increasing cluster B1 presages the sharp inflection in cluster B2 that is enriched for further ER-based proteostatic mechanisms. BSC cluster B2 is further enriched for the lysosome KEGG pathways, which plays a key role in proteostasis by breaking down misfolded proteins (Jackson and Hewitt, 2016). Similarly, cluster P2, which inflects at sexual maturity and then increases monotonically with age, is also enriched for the lysosome pathway. Furthermore, BSC and, to a lesser extent, PVC show upregulations for key members of the ER stress signaling pathway, namely, homologs of EIF2AK3 (PERK) and ATF4 (CREB2) with age. This suggests that disruption of proteostasis begins early and remains a persistent and mounting threat in aging, as observed in Drosophila (Yang et al., 2019).
In post-mitotic and long lived cells, such as Aplysia neurons, lysosomes accumulate aggregates of oxidized protein called lipofuscin with age (Papka et al., 1981; Terman and Brunk, 2004). This process is accelerated by mitochondrial dysfunction (Konig et al., 2017). Indigestible lipofuscin decreases lysosome efficiency and scavenges proteolytic enzymes from autophagosomes, allowing for persistence of malfunctioning mitochondria (Kurz et al., 2008). An age-associated decrease in lysosome efficiency could be particularly problematic for neurons that rely on lysosomes to facilitate synaptic remodeling (Kononenko, 2017). Accumulation of lipofuscins has been demonstrated to increase lysosome number in cultured fibroblasts (Hohn et al., 2012). A similar response may explain enrichment of lysosomal proteins in increasing clusters in both BSC and PVC. Enrichment of ribosome and protein synthesis processes in clusters upregulated in aging, a phenomenon also observed in the short-lived teleost Nothobranchius furzeri, may reflect this increasing demand for lysosomes and activated endoplasmic reticulum stress response in the face of proteostatic stress (Baumgart et al., 2014). In addition to oxidized proteins, lipofuscin is also composed of accumulated metals and oxidized lipids.
Enrichment analysis in clusters B2 and P2 suggests that both PVC and BSC also accumulate lipids and iron with age. Iron levels in the brain increase steadily with age in rodent and human (Dedman et al., 1992), causing increased expression of the iron storage proteins ferritin and neuro-melanin (Zecca et al., 2001; Bartzokis et al., 2004; Walker et al., 2016). Both BSC and PVC exhibited an age-dependent upregulation in homologs of iron storage protein and aging biomarker Ferritin Heavy Chain (FTH1). Although this process is known to occur in healthy aging, increased iron is considered a risk factor for and contributor to several age-associated neurodegenerative diseases (Ndayisaba et al., 2019).
BSC and PVC also exhibited age-dependent upregulation in a homolog for lipid storage droplet (LD) biomarker Perilipin 2 (PLIN2). Accumulation of LD in non-adipose tissues, including neurons, as a result of aging has been described in humans, worms, rodents, and Aplysia (Savage et al., 1987; Conte et al., 2016; Shimabukuro et al., 2016; Palikaras et al., 2017). Lipid sequestration into LD functions to protect oxidation susceptible lipids from ROS. Oxidative stress as a result of mitochondrial dysfunction and/or iron accumulation is known to induce this formation of LD in the brain and foreshadows the onset of age-associated neurodegenerative disease (Campos et al., 2015; Liu et al., 2015). In the pond snail Lymnaea stagnalis, a gastropod relative of Aplysia, oxidation of membrane lipids has been shown to drive age-associated decreases in neuronal excitability (Hermann et al., 2014). Therefore, the increased lipid oxidation rate suggested by increased PLIN2 expression may be responsible for similar decreases in neuronal excitability and conduction velocity in aging observed in Aplysia previously (Kempsell and Fieber, 2014, 2016).
In both BSC and PVC, increases in lysosome-related transcripts as well as lipid and iron storage biomarkers co-occurred in the same cluster, suggesting a response to a common underlying driver. In PVC, this mirrors the linear decrease of mitochondrial metabolism cluster P4. In BSC, meanwhile, this occurs in cluster B2, which exhibits a strong negative inflection that lags behind the decrease of mitochondrial metabolism cluster B4. Overall, these patterns suggest a common response to declines in neuronal metabolism. Lipofuscin formation, iron sequestration, and LD formation all occur as a result of and contribute to ROS accumulation, which is known to be a result of mitochondrial dysfunction. These data suggest that metabolic impairment may be the driver of these aging hallmarks, as suggested in the Energy Maintenance Theory of Aging (Chaudhari and Kipreos, 2018) and the Free-Radical-Induced Energetic and Neural Decline in Senescence (FRIENDS) theory of aging (Raz and Daugherty, 2018).
Decreases in metabolic activity in aging may also compromise the energetically expensive signaling functions of these SN. Indeed, pathways and processes crucial to normal neuronal signaling, such as synaptic release of neurotransmitter and synaptic remodeling during potentiation and depression, were downregulated in aging along with major metabolic pathways. In BSC, decreased expression in major metabolic pathways in cluster B4 temporally preceded the strong negative inflection in cluster B3, which is enriched primarily in neuronal signaling pathways. This may suggest that, in BSC, not only are metabolic and signaling pathways related, as in PVC, but that it is the decline in energy metabolism that drives decreases in normal neuronal function. Decreased glycolysis in particular, as suggested by enrichment of decreasing clusters, may adversely affect the ability of these SN to transmit incoming sensory input across the synapse (Jang et al., 2016; Lujan et al., 2016; Diaz-Garcia and Yellen, 2019). Furthermore, knock-on effects of compromised TCA and OXPHOS activity, namely, compromised Ca+2 signaling due to impaired mitochondria and ER stress, as well as compromised functioning of signaling pathways and neurotransmitter receptors due to ROS damage, likely also contribute to impaired neuronal function.
Decreasing expression of genes associated with long-term potentiation in clusters B3 and P4 suggests that the chemical mechanisms underpinning simple learning are impaired with age in these SN, specifically through decreases in plasma membrane receptors, calcium sensing via calmodulin, and the MAPK signaling cascade. During strong stimulation to elicit long-term facilitation (LTF), such as five pulses of 5HT, protein kinase A (PKA) stimulates secretion of autocrine peptide sensorin, which, in turn, activates and translocates MAPK to the nucleus (Hu et al., 2004). There, MAPK removes CREB2 transcriptional repression and phosphorylates CREB1 and C/EBP, thus mediating transcriptional events necessary for LTF (Martin et al., 1997; Michael et al., 1998). Inhibition of MAPK or its activator MAPK/ERK kinase (MAP2K1, MEK) blocks LTF. Both MEK and its upstream activator and calmodulin target Ras are downregulated in BSC and PVC, suggesting impairment of the MAPK signaling cascade needed for induction of long-term memory in aging. This may contribute to previously observed decreases in 5-HT induced facilitation in PVC with age (Kempsell and Fieber, 2015a). Interestingly, while the MAPK cascade is downregulated in both BSC and PVC, CREB2 (ATF4) is upregulated, likely due to proteostatic stress, suggesting that the response to disruptions in proteostasis may be connected to observed impairment in learning with age.
In addition to PKA, protein kinase G (PKG) may also play an important role in compromised learning in aging observed in BSC and PVC. In mammals, noxious stimulation of nociceptive neurons activates PKG that promotes MAPK translocation to the nucleus and induces long-term hyperexcitability (LTH) (Komatsu et al., 2009). Similarly, pinch stimulus to SN in Aplysia activates the PKG signaling pathway and results in activation and translocation of MAPK, resulting in LTH (Lewin and Walters, 1999; Sung et al., 2004). In addition to the MAPK cascade, the cGMP-PKG signaling pathway (ko04022), including PKG specifically, is significantly decreased in clusters B3 and P4 with aging. Similarly, long-term operant memory in learning that a food item is inedible previously has been shown to depend on PKG-mediated MAPK signaling in Aplysia, raising the possibility that the age-related memory impairments observed in BSC and PVC may be due to decreased PKG expression (Michel et al., 2011; Kempsell and Fieber, 2015b). Given the role of NO-derived PKG signaling in the feeding behavior of Aplysia (Susswein and Chiel, 2012), observed downregulation of PKG with age may also contribute to observed decreased feeding and resultant weight loss observed in aged Alysia (Fieber et al., 2010).
Together, these data suggest that decreases in oxidative metabolism precede later hallmarks of neuronal aging. Initial declines in glucose metabolism result in decreased energy available for homeostatic functions, such as protein folding and ROS detoxification. A feedback loop ensues, in which increased mitochondrial dysfunction induces more oxidative stress. Further impaired metabolism continues until a threshold is reached and the native antioxidant and proteostatic defenses are no longer sufficient. In response, neurons transition from antioxidant defense to damage control by sequestering volatile iron with ferritins, packaging ROS susceptible lipids into LD with perilipins, and accumulating lipofuscins in lysosomes. Metabolic impairment and increasing resource expenditure on sequestration and repair diverts limited energy reserves away from neuronal functions such as restoration of resting membrane potential and other facets of synaptic transmission, which disrupts normal signaling. Impaired signaling results in cognitive impairment at the whole organism level. Thus, age-associated cognitive impairment ultimately arises from metabolic declines in relevant neurons.
Although these age-associated changes in Aplysia SN were studied in the context of non-pathological aging, aging and age-associated disease exist on a continuum (Franceschi et al., 2018). Indeed, many of the described changes are common underlying symptoms of both aging and age-associated neurodegenerative disease. Metabolic compromise, particularly of OXPHOS, and associated mitochondrial dysfunction are classical hallmarks of Alzheimer’s and Parkinson’s disease. Similarly, oxidative stress as a result of mitochondrial compromise-derived ROS is common to the etiologies of many neurodegenerative diseases, including Alzheimer’s, Parkinson’s, and beyond (Kim et al., 2015; Islam, 2017). Impaired proteostasis defines many neurodegenerative diseases, with accumulation of aggregates of malformed proteins being defining diagnostic features for many, such as α-synuclein for Parkinson’s and amyloid-β and tau for Alzheimer’s (Hetz and Mollereau, 2014; Kurtishi et al., 2019). Furthermore, as mentioned earlier, the accumulation of iron and LD in neurons is a risk factor and an early indicator of the onset of neurodegenerative disease (Bartzokis et al., 2004; Silvestri and Camaschella, 2008; Liu and Connor, 2012; Ward et al., 2014; Liu et al., 2015; Han et al., 2018). These data suggest that Aplysia SN exhibit transcriptional signatures of these same processes. Effective investigation of age-associated neurodegenerative disease requires study in the context in which they arise: the aging nervous system (Johnson, 2015; Wallace and Howlett, 2016). These results demonstrate that Aplysia SN present an excellent model system for doing just that.
Data Availability Statement
The datasets presented in this study can be found in online repositories. The names of the repository/repositories and accession number(s) can be found below: https://www.ncbi.nlm.nih.gov/, PRJNA639857.
Author Contributions
NK and LF designed this study with input from MS. NK collected data, executed the experiment, and analyzed the data with input from LF and MS. NK wrote the manuscript with input from LF and MS. All authors read and approved the final manuscript.
Funding
This work was funded by the National Institutes of Health Grant (P40OD010952). The funders had no role in study design, data collection and analysis, decision to publish, or preparation of the manuscript.
Conflict of Interest
The authors declare that the research was conducted in the absence of any commercial or financial relationships that could be construed as a potential conflict of interest.
Acknowledgments
We gratefully acknowledge the University of Miami Aplysia Resource staff for their assistance. We are indebted to Drs. Douglas Crawford and Marjorie Oleksiak for use of their Nanodrop and Bioanalyzer. We thank Dr. Justin Greer for his assistance in RNA extraction and invaluable advice. This work was made possible, in part, through access to the Genomics High Throughput Facility Shared Resource of the Cancer Center Support Grant (P30CA-062203) at the University of California, Irvine and NIH shared instrumentation grants 1S10RR025496-01, 1S10OD010794-01, and 1S10OD021718-01.
Supplementary Material
The Supplementary Material for this article can be found online at: https://www.frontiersin.org/articles/10.3389/fnagi.2020.573764/full#supplementary-material
Footnotes
- ^ http://www.bioinformatics.bbsrc.ac.uk/projects/fastqc
- ^ https://ftp.ncbi.nlm.nih.gov/genomes/all/annotation_releases/6500/101/GCF_000002075.1_AplCal3.0/
References
Alexa, A., and Rahnenfuhrer, J. (2018). topGO: Enrichment Analysis for Gene Ontology Version 2.34.0.
Anderson, N. D., and Craik, F. I. (2017). 50 years of cognitive aging theory. J. Gerontol. B Psychol. Sci. Soc. Sci. 72, 1–6. doi: 10.1093/geronb/gbw108
Bailey, C. H., Castellucci, V. F., Koester, J., and Chen, M. (1983). Behavioral changes in aging Aplysia: a model system for studying the cellular basis of age-impaired learning, memory, and arousal. Behav. Neural Biol. 38, 70–81. doi: 10.1016/s0163-1047(83)90399-0
Barrientos, R. M., Kitt, M. M., Watkins, L. R., and Maier, S. F. (2015). Neuroinflammation in the normal aging hippocampus. Neuroscience 309, 84–99. doi: 10.1016/j.neuroscience.2015.03.007
Bartzokis, G., Tishler, T. A., Shin, I. S., Lu, P. H., and Cummings, J. L. (2004). Brain ferritin iron as a risk factor for age at onset in neurodegenerative diseases. Redox Active Metals Neurol. Disord. 1012, 224–236. doi: 10.1196/annals.1306.019
Baumgart, M., Groth, M., Priebe, S., Savino, A., Testa, G., Dix, A., et al. (2014). RNA-seq of the aging brain in the short-lived fish N-furzeri - conserved pathways and novel genes associated with neurogenesis. Aging Cell 13, 965–974. doi: 10.1111/acel.12257
Baumgart, M., Priebe, S., Groth, M., Hartmann, N., Menzel, U., Pandolfini, L., et al. (2016). Longitudinal RNA-Seq analysis of vertebrate aging identifies mitochondrial complex I as a small-molecule-sensitive modifier of lifespan. Cell Syst. 2, 122–132. doi: 10.1016/j.cels.2016.01.014
Bettio, L. E. B., Rajendran, L., and Gil-Mohapel, J. (2017). The effects of aging in the hippocampus and cognitive decline. Neurosci. Biobehav. Rev. 79, 66–86. doi: 10.1016/j.neubiorev.2017.04.030
Boumezbeur, F., Mason, G. F., de Graaf, R. A., Behar, K. L., Cline, G. W., Shulman, G. I., et al. (2010). Altered brain mitochondrial metabolism in healthy aging as assessed by in vivo magnetic resonance spectroscopy. J. Cereb. Blood Flow Metab. 30, 211–221. doi: 10.1038/jcbfm.2009.197
Camacho, C., Coulouris, G., Avagyan, V., Ma, N., Papadopoulos, J., Bealer, K., et al. (2009). BLAST plus : architecture and applications. BMC Bioinformatics 10:421. doi: 10.1186/1471-2105-10-421
Camandola, S., and Mattson, M. P. (2017). Brain metabolism in health, aging, and neurodegeneration. EMBO J. 36, 1474–1492. doi: 10.15252/embj.201695810
Campos, S. S., Diez, G. R., Oresti, G. M., and Salvador, G. A. (2015). Dopaminergic neurons respond to iron-induced oxidative stress by modulating lipid acylation and deacylation cycles. PLoS One 10:e0130726. doi: 10.1371/journal.pone.0130726
Chaudhari, N., Talwar, P., Parimisetty, A., d’Hellencourt, C. L., and Ravanan, P. (2014). A molecular web: endoplasmic reticulum stress, inflammation, and oxidative stress. Front. Cell. Neurosci. 8:213. doi: 10.3389/fncel.2014.00213
Chaudhari, S. N., and Kipreos, E. T. (2018). The energy maintenance theory of aging: maintaining energy metabolism to allow longevity. Bioessays 40:1800005. doi: 10.1002/bies.201800005
Chen, M., Chen, Z. H., Wang, Y. Y., Tan, Z., Zhu, C. Z., Li, Y. J., et al. (2016). Mitophagy receptor FUNDC1 regulates mitochondrial dynamics and mitophagy. Autophagy 12, 689–702. doi: 10.1080/15548627.2016.1151580
Conte, M., Franceschi, C., Sandri, M., and Salvioli, S. (2016). Perilipin 2 and age-related metabolic diseases: a new perspective. Trends Endocrinol. Metab. 27, 893–903. doi: 10.1016/j.tem.2016.09.001
Currais, A. (2015). Ageing and inflammation - A central role for mitochondria in brain health and disease. Ageing Res. Rev. 21, 30–42. doi: 10.1016/j.arr.2015.02.001
Currais, A., Huang, L., Goldberg, J., Petrascheck, M., Ates, G., Pinto-Duarte, A., et al. (2019). Elevating acetyl-CoA levels reduces aspects of brain aging. eLife 8:e47866. doi: 10.7554/eLife.47866
Das, N., Levine, R. L., Orr, W. C., and Sohal, R. S. (2001). Selectivity of protein oxidative damage during aging in Drosophila melanogaster. Biochem. J. 360, 209–216. doi: 10.1042/0264-6021:3600209
Davie, K., Janssens, J., Koldere, D., De Waegeneer, M., Pech, U., Kreft, L., et al. (2018). A single-cell transcriptome atlas of the aging Drosophila brain. Cell 174, 982.e20–998.e20. doi: 10.1016/j.cell.2018.05.057
de Magalhaes, J. P., Curado, J., and Church, G. M. (2009). Meta-analysis of age-related gene expression profiles identifies common signatures of aging. Bioinformatics 25, 875–881. doi: 10.1093/bioinformatics/btp073
Dedman, D. J., Treffry, A., Candy, J. M., Taylor, G. A. A., Morris, C. M., Bloxham, C. A., et al. (1992). Iron and aluminum in relation to brain ferritin in normal individuals and Alzheimers-disease and chronic renal-dialysis patients. Biochem. J. 287, 509–514. doi: 10.1042/bj2870509
Di Domenico, F., Perluigi, M., Butterfield, D. A., Cornelius, C., and Calabrese, V. (2010). Oxidative damage in rat brain during aging: interplay between energy and metabolic key target proteins. Neurochem. Res. 35, 2184–2192. doi: 10.1007/s11064-010-0295-z
Diaz-Garcia, C. M., and Yellen, G. (2019). Neurons rely on glucose rather than astrocytic lactate during stimulation. J. Neurosci. Res. 97, 883–889. doi: 10.1002/jnr.24374
Diot, A., Morten, K., and Poulton, J. (2016). Mitophagy plays a central role in mitochondrial ageing. Mamm. Genome 27, 381–395. doi: 10.1007/s00335-016-9651-x
Dodig, S., Cepelak, I., and Pavic, I. (2019). Hallmarks of senescence and aging. Biochem. Med. 29:030501. doi: 10.11613/BM.2019.030501
Ferguson, M., Mockett, R. J., Shen, Y., Orr, W. C., and Sohal, R. S. (2005). Age-associated decline in mitochondrial respiration and electron transport in Drosophila melanogaster. Biochem. J. 390, 501–511. doi: 10.1042/Bj20042130
Fieber, L. A. (2000). The development of excitatory capability in Aplysia californica bag cells observed in cohorts. Dev. Brain Res. 122, 47–58. doi: 10.1016/S0165-3806(00)00053-5
Fieber, L. A., Carlson, S. L., Capo, T. R., and Schmale, M. C. (2010). Changes in D-aspartate ion currents in the Aplysia nervous system with aging. Brain Res. 1343, 28–36. doi: 10.1016/j.brainres.2010.05.001
Fieber, L. A., Carlson, S. L., Kempsell, A. T., Greer, J. B., and Schmale, M. C. (2013). Isolation of sensory neurons of Aplysia californica for patch clamp recordings of glutamatergic currents. JOVE J. Vis. Exp. 77:e50543. doi: 10.3791/50543
Foster, T. C., Kyritsopoulos, C., and Kumar, A. (2017). Central role for NMDA receptors in redox mediated impairment of synaptic function during aging and Alzheimer’s disease. Behav. Brain Res. 322(Pt B), 223–232. doi: 10.1016/j.bbr.2016.05.012
Franceschi, C., Garagnani, P., Morsiani, C., Conte, M., Santoro, A., Grignolio, A., et al. (2018). The continuum of aging and age-related diseases: common mechanisms but different rates. Front. Med. 5:61. doi: 10.3389/fmed.2018.00061
Gao, J., Yin, D., Yao, Y. H., Williams, T. D., and Squier, T. C. (1998). Progressive decline in the ability of calmodulin isolated from aged brain to activate the plasma membrane Ca-ATPase. Biochemistry 37, 9536–9548. doi: 10.1021/bi9803877
Garaschuk, O., Semchyshyn, H. M., and Lushchak, V. I. (2018). Healthy brain aging: Interplay between reactive species, inflammation and energy supply. Ageing Res. Rev. 43, 26–45. doi: 10.1016/j.arr.2018.02.003
Gerdes, R., and Fieber, L. A. (2006). Life history and aging of captive-reared California sea hares (Aplysia californica). J. Am. Assoc. Lab. Anim. Sci. 45, 40–47.
Glass, D., Vinuela, A., Davies, M. N., Ramasamy, A., Parts, L., Knowles, D., et al. (2013). Gene expression changes with age in skin, adipose tissue, blood and brain. Genome Biol. 14:R75. doi: 10.1186/gb-2013-14-7-r75
Goyal, M. S., Vlassenko, A. G., Blazey, T. M., Su, Y., Couture, L. E., Durbin, T. J., et al. (2017). Loss of brain aerobic glycolysis in normal human aging. Cell Metab. 26, 353–356. doi: 10.1016/j.cmet.2017.07.010
Greer, J. B., Schmale, M. C., and Fieber, L. A. (2018). Whole-transcriptome changes in gene expression accompany aging of sensory neurons in Aplysia californica. BMC Genomics 19:529. doi: 10.1186/s12864-018-4909-1
Grimm, A., and Eckert, A. (2017). Brain aging and neurodegeneration: from a mitochondrial point of view. J. Neurochem. 143, 418–431. doi: 10.1111/jnc.14037
Gu, Z., Eils, R., and Schlesner, M. (2016). Complex heatmaps reveal patterns and correlations in multidimensional genomic data. Bioinformatics 32, 2847–2849. doi: 10.1093/bioinformatics/btw313
Guo, X., Park, J. E., Gallart-Palau, X., and Sze, S. K. (2020). Oxidative damage to the TCA cycle enzyme MDH1 dysregulates bioenergetic enzymatic activity in the aged murine brain. J. Proteome Res. 19, 1706–1717. doi: 10.1021/acs.jproteome.9b00861
Haddadi, M., Jahromi, S. R., Sagar, B. K., Patil, R. K., Shivanandappa, T., and Ramesh, S. R. (2014). Brain aging, memory impairment and oxidative stress: a study in Drosophila melanogaster. Behav. Brain Res. 259, 60–69. doi: 10.1016/j.bbr.2013.10.036
Han, X. J., Zhu, J. L., Zhang, X. L., Song, Q. Q., Ding, J. H., Lu, M., et al. (2018). Plin4-dependent lipid droplets hamper neuronal mitophagy in the MPTP/p-induced mouse model of Parkinson’s disease. Front. Neurosci. 12:397. doi: 10.3389/fnins.2018.00397
Hastings, J., Mains, A., Virk, B., Rodriguez, N., Murdoch, S., Pearce, J., et al. (2019). Multi-omics and genome-scale modeling reveal a metabolic shift during C. elegans aging. Front. Mol. Biosci. 6:2. doi: 10.3389/fmolb.2019.00002
Haxaire, C., Turpin, F. R., Potier, B., Kervern, M., Sinet, P. M., Barbanel, G., et al. (2012). Reversal of age-related oxidative stress prevents hippocampal synaptic plasticity deficits by protecting d-serine-dependent NMDA receptor activation. Aging Cell 11, 336–344. doi: 10.1111/j.1474-9726.2012.00792.x
Hermann, P. M., Watson, S. N., and Wildering, W. C. (2014). Phospholipase A2 - nexus of aging, oxidative stress, neuronal excitability, and functional decline of the aging nervous system? Insights from a snail model system of neuronal aging and age-associated memory impairment. Front. Genet. 5:419. doi: 10.3389/fgene.2014.00419
Hetz, C., and Mollereau, B. (2014). Disturbance of endoplasmic reticulum proteostasis in neurodegenerative diseases. Nat. Rev. Neurosci. 15, 233–249. doi: 10.1038/nrn3689
Hohn, A., Konig, J., and Grune, T. (2013). Protein oxidation in aging and the removal of oxidized proteins. J. Proteomics 92, 132–159. doi: 10.1016/j.jprot.2013.01.004
Hohn, A., Sittig, A., Jung, T., Grimm, S., and Grune, T. (2012). Lipofuscin is formed independently of macroautophagy and lysosomal activity in stress-induced prematurely senescent human fibroblasts. Free Radic. Biol. Med. 53, 1760–1769. doi: 10.1016/j.freeradbiomed.2012.08.591
Hohn, A., Weber, D., Jung, T., Ott, C., Hugo, M., Kochlik, B., et al. (2017). Happily (n)ever after: Aging in the context of oxidative stress, proteostasis loss and cellular senescence. Redox Biol. 11, 482–501. doi: 10.1016/j.redox.2016.12.001
Hou, Y., Dan, X., Babbar, M., Wei, Y., Hasselbalch, S. G., Croteau, D. L., et al. (2019). Ageing as a risk factor for neurodegenerative disease. Nat. Rev. Neurol. 15, 565–581. doi: 10.1038/s41582-019-0244-7
Hoyer, S. (1985). The effect of age on glucose and energy metabolism in brain cortex of rats. Arch. Gerontol. Geriatr. 4, 193–203. doi: 10.1016/0167-4943(85)90001-9
Hu, J. Y., Glickman, L., Wu, F., and Schacher, S. (2004). Serotonin regulates the secretion and autocrine action of a neuropeptide to activate MAPK required for long-term facilitation in Aplysia. Neuron 43, 373–385. doi: 10.1016/j.neuron.2004.07.011
Islam, M. T. (2017). Oxidative stress and mitochondrial dysfunction-linked neurodegenerative disorders. Neurol. Res. 39, 73–82. doi: 10.1080/01616412.2016.1251711
Ivanisevic, J., Stauch, K. L., Petrascheck, M., Benton, H. P., Epstein, A. A., Fang, M., et al. (2016). Metabolic drift in the aging brain. Aging 8, 1000–1020. doi: 10.18632/aging.100961
Jackson, M. P., and Hewitt, E. W. (2016). Cellular proteostasis: degradation of misfolded proteins by lysosomes. Essays Biochem. 60, 173–180. doi: 10.1042/EBC20160005
Jang, S., Nelson, J. C., Bend, E. G., Rodriguez-Laureano, L., Tueros, F. G., Cartagenova, L., et al. (2016). Glycolytic enzymes localize to synapses under energy stress to support synaptic function. Neuron 90, 278–291. doi: 10.1016/j.neuron.2016.03.011
Jin, Y., Tan, Y. J., Chen, L. P., Liu, Y., and Ren, Z. Q. (2018). Reactive oxygen species induces lipid droplet accumulation in HepG2 cells by increasing perilipin 2 expression. Int. J. Mol. Sci. 19:3445. doi: 10.3390/ijms19113445
Johnson, I. P. (2015). Age-related neurodegenerative disease research needs aging models. Front. Aging Neurosci. 7:168. doi: 10.3389/fnagi.2015.00168
Kadakkuzha, B. M., Akhmedov, K., Capo, T. R., Carvalloza, A. C., Fallahi, M., and Puthanveettil, S. V. (2013). Age-associated bidirectional modulation of gene expression in single identified R15 neuron of Aplysia. BMC Genomics 14:880. doi: 10.1186/1471-2164-14-880
Kanehisa, M., Sato, Y., and Morishima, K. (2016). BlastKOALA and GhostKOALA: KEGG tools for functional characterization of genome and metagenome sequences. J. Mol. Biol. 428, 726–731. doi: 10.1016/j.jmb.2015.11.006
Kempsell, A. T., and Fieber, L. A. (2014). Behavioral aging is associated with reduced sensory neuron excitability in Aplysia californica. Front. Aging Neurosci. 6:84. doi: 10.3389/fnagi.2014.00084
Kempsell, A. T., and Fieber, L. A. (2015a). Age-related deficits in synaptic plasticity rescued by activating PKA or PKC in sensory neurons of Aplysia californica. Front. Aging Neurosci. 7:173. doi: 10.3389/fnagi.2015.00173
Kempsell, A. T., and Fieber, L. A. (2015b). Aging in sensory and motor neurons results in learning failure in Aplysia californica. PLoS One 10:e0127056. doi: 10.1371/journal.pone.0127056
Kempsell, A. T., and Fieber, L. A. (2016). Habituation in the tail withdrawal reflex circuit is impaired during aging in Aplysia californica. Front. Aging Neurosci. 8:24. doi: 10.3389/fnagi.2010.00024
Kim, G. H., Kim, J. E., Rhie, S. J., and Yoon, S. (2015). The role of oxidative stress in neurodegenerative diseases. Exp. Neurobiol. 24, 325–340. doi: 10.5607/en.2015.24.4.325
Kimura, T., Suzuki, M., and Akagi, T. (2017). Age-dependent changes in synaptic plasticity enhance tau oligomerization in the mouse hippocampus. Acta Neuropathol. Commun. 5:67. doi: 10.1186/s40478-017-0469-x
Komatsu, T., Sakurada, S., Kohno, K., Shiohira, H., Katsuyama, S., Sakurada, C., et al. (2009). Spinal ERK activation via NO-cGMP pathway contributes to nociceptive behavior induced by morphine-3-glucuronide. Biochem. Pharmacol. 78, 1026–1034. doi: 10.1016/j.bcp.2009.06.106
Konig, J., Ott, C., Hugo, M., Jung, T., Bulteau, A. L., Grune, T., et al. (2017). Mitochondrial contribution to lipofuscin formation. Redox Biol. 11, 673–681. doi: 10.1016/j.redox.2017.01.017
Kononenko, N. L. (2017). Lysosomes convene to keep the synapse clean. J. Cell Biol. 216, 2251–2253. doi: 10.1083/jcb.201707070
Krebs, J., Agellon, L. B., and Michalak, M. (2015). Ca2+ homeostasis and endoplasmic reticulum (ER) stress: An integrated view of calcium signaling. Biochem. Biophys. Res. Commun. 460, 114–121. doi: 10.1016/j.bbrc.2015.02.004
Kumar, A., Gibbs, J. R., Beilina, A., Dillman, A., Kumaran, R., Trabzuni, D., et al. (2013). Age-associated changes in gene expression in human brain and isolated neurons. Neurobiol. Aging 34, 1199–1209. doi: 10.1016/j.neurobiolaging.2012.10.021
Kurtishi, A., Rosen, B., Patil, K. S., Alves, G. W., and Moller, S. G. (2019). Cellular proteostasis in neurodegeneration. Mol. Neurobiol. 56, 3676–3689. doi: 10.1007/s12035-018-1334-z
Kurz, T., Terman, A., Gustafsson, B., and Brunk, U. T. (2008). Lysosomes in iron metabolism, ageing and apoptosis. Histochem. Cell Biol. 129, 389–406. doi: 10.1007/s00418-008-0394-y
Leek, J. T. (2014). svaseq: removing batch effects and other unwanted noise from sequencing data. Nucleic Acids Res. 42:e161. doi: 10.1093/nar/gku864
Lewin, M. R., and Walters, E. T. (1999). Cyclic GMP pathway is critical for inducing long-term sensitization of nociceptive sensory neurons. Nat. Neurosci. 2, 18–23. doi: 10.1038/4520
Lin, A. L., Coman, D., Jiang, L. H., Rothman, D. L., and Hyder, F. (2014). Caloric restriction impedes age-related decline of mitochondrial function and neuronal activity. J. Cereb. Blood Flow Metab. 34, 1440–1443. doi: 10.1038/jcbfm.2014.114
Lippuner, A. D., Julou, T., and Barral, Y. (2014). Budding yeast as a model organism to study the effects of age. FEMS Microbiol. Rev. 38, 300–325. doi: 10.1111/1574-6976.12060
Liu, L., Zhang, K., Sandoval, H., Yamamoto, S., Jaiswal, M., Sanz, E., et al. (2015). Glial lipid droplets and ROS induced by mitochondrial defects promote neurodegeneration. Cell 160, 177–190. doi: 10.1016/j.cell.2014.12.019
Liu, Y. T., and Connor, J. R. (2012). Iron and ER stress in neurodegenerative disease. Biometals 25, 837–845. doi: 10.1007/s10534-012-9544-8
Lopez-Otin, C., Blasco, M. A., Partridge, L., Serrano, M., and Kroemer, G. (2013). The hallmarks of aging. Cell 153, 1194–1217. doi: 10.1016/j.cell.2013.05.039
Love, M. I., Huber, W., and Anders, S. (2014). Moderated estimation of fold change and dispersion for RNA-seq data with DESeq2. Genome Biol. 15:550. doi: 10.1186/s13059-014-0550-8
Lujan, B., Kushmerick, C., Das Banerjee, T., Dagda, R. K., and Renden, R. (2016). Glycolysis selectively shapes the presynaptic action potential waveform. J. Neurophysiol. 116, 2523–2540. doi: 10.1152/jn.00629.2016
Luo, W., and Brouwer, C. (2013). Pathview: an R/Bioconductor package for pathway-based data integration and visualization. Bioinformatics 29, 1830–1831. doi: 10.1093/bioinformatics/btt285
Ma, Z. J., Wang, H., Cai, Y. P., Wang, H., Niu, K. Y., Wu, X. F., et al. (2018). Epigenetic drift of H3K27me3 in aging links glycolysis to healthy longevity in Drosophila. eLife 7:e35368. doi: 10.7554/elife.35368
Magnusson, K. R., Brim, B. L., and Das, S. R. (2010). Selective vulnerabilities of N-methyl-D-aspartate (n.d.) receptors during brain aging. Front. Aging Neurosci. 2:11. doi: 10.3389/fnagi.2010.00011
Marchi, S., Patergnani, S., Missiroli, S., Morciano, G., Rimessi, A., Wieckowski, M. R., et al. (2018). Mitochondrial and endoplasmic reticulum calcium homeostasis and cell death. Cell Calcium 69, 62–72. doi: 10.1016/j.ceca.2017.05.003
Marjanska, M., McCarten, J. R., Hodges, J., Hemmy, L. S., Grant, A., Deelchand, D. K., et al. (2017). Region-specific aging of the human brain as evidenced by neurochemical profiles measured noninvasively in the posterior cingulate cortex and the occipital lobe using (1)H magnetic resonance spectroscopy at 7 T. Neuroscience 354, 168–177. doi: 10.1016/j.neuroscience.2017.04.035
Martin, K. C., Michael, D., Rose, J. C., Barad, M., Casadio, A., Zhu, H. X., et al. (1997). MAP kinase translocates into the nucleus of the presynaptic cell and is required for long-term facilitation in Aplysia. Neuron 18, 899–912. doi: 10.1016/S0896-6273(00)80330-X
Martinez, G., Duran-Aniotz, C., Cabral-Miranda, F., Vivar, J. P., and Hetz, C. (2017). Endoplasmic reticulum proteostasis impairment in aging. Aging Cell 16, 615–623. doi: 10.1111/acel.12599
Mastroeni, D., Khdour, O. M., Delvaux, E., Nolz, J., Olsen, G., Berchtold, N., et al. (2017). Nuclear but not mitochondrial-encoded oxidative phosphorylation genes are altered in aging, mild cognitive impairment, and Alzheimer’s disease. Alzheimers Dement. 13, 510–519. doi: 10.1016/j.jalz.2016.09.003
Mattson, M. P., and Arumugam, T. V. (2018). Hallmarks of brain aging: adaptive and pathological modification by metabolic states. Cell Metab. 27, 1176–1199. doi: 10.1016/j.cmet.2018.05.011
Mayer, P. J., and Baker, G. T. (1985). Genetic-aspects of Drosophila as a model system of eukaryotic aging. Int. Rev. Cytol. Surv. Cell Biol. 95, 61–102. doi: 10.1016/S0074-7696(08)60579-3
McCarroll, S. A., Murphy, C. T., Zou, S. G., Pletcher, S. D., Chin, C. S., Jan, Y. N., et al. (2004). Comparing genomic expression patterns across species identifies shared transcriptional profile in aging. Nat. Genet. 36, 197–204. doi: 10.1038/ng1291
Michael, D., Martin, K. C., Seger, R., Ning, M.-M., Baston, R., and Kandel, E. R. (1998). Repeated pulses of serotonin required for?long-term facilitation activate mitogen-activated protein kinase in sensory neurons?of? Aplysia. Proc. Natl. Acad. Sci. U.S.A. 95, 1864–1869. doi: 10.1073/pnas.95.4.1864
Michel, M., Green, C. L., Eskin, A., and Lyons, L. C. (2011). PKG-mediated MAPK signaling is necessary for long-term operant memory in Aplysia. Learn. Mem. 18, 108–117. doi: 10.1101/lm.2063611
Moroz, L. L., Edwards, J. R., Puthanveettil, S. V., Kohn, A. B., Ha, T., Heyland, A., et al. (2006). Neuronal transcriptome of Aplysia: neuronal compartments and circuitry. Cell 127, 1453–1467. doi: 10.1016/j.cell.2006.09.052
Moroz, L. L., and Kohn, A. B. (2010). Do different neurons age differently? Direct genome-wide analysis of aging in single identified cholinergic neurons. Front. Aging Neurosci. 2:2010. doi: 10.3389/neuro.24.006.2010
Moroz, L. L., and Kohn, A. B. (2013). Single-neuron transcriptome and methylome sequencing for epigenomic analysis of aging. Methods Mol. Biol. 1048, 323–352. doi: 10.1007/978-1-62703-556-9_21
Morrison, J. H., and Baxter, M. G. (2012). The ageing cortical synapse: hallmarks and implications for cognitive decline. Nat. Rev. Neurosci. 13, 240–250. doi: 10.1038/nrn3200
Ndayisaba, A., Kaindlstorfer, C., and Wenning, G. K. (2019). Iron in neurodegeneration - cause or consequence? Frontiers in Neuroscience 13:180. doi: 10.3389/fnins.2019.00180
Nickel, A. G., von Hardenberg, A., Hohl, M., Loffler, J. R., Kohlhaas, M., Becker, J., et al. (2015). Reversal of mitochondrial transhydrogenase causes oxidative stress in heart failure. Cell Metab. 22, 472–484. doi: 10.1016/j.cmet.2015.07.008
Nugent, S., Tremblay, S., Chen, K. W., Ayutyanont, N., Roontiva, A., Castellano, C. A., et al. (2014). Brain glucose and acetoacetate metabolism: a comparison of young and older adults. Neurobiol. Aging 35, 1386–1395. doi: 10.1016/j.neurobiolaging.2013.11.027
Ojaimi, J., Masters, C. L., Opeskin, K., McKelvie, P., and Byrne, E. (1999). Mitochondrial respiratory chain activity in the human brain as a function of age. Mech. Ageing Dev. 111, 39–47. doi: 10.1016/S0047-6374(99)00071-8
Olsen, A., Vantipalli, M. C., and Lithgow, G. J. (2006). Using Caenorhabditis elegans as a model for aging and age-related diseases. Understand. Modul. Aging 1067, 120–128. doi: 10.1196/annals.1354.015
Palikaras, K., Mari, M., Petanidou, B., Pasparaki, A., Filippidis, G., and Tavernarakis, N. (2017). Ectopic fat deposition contributes to age-associated pathology in Caenorhabditis elegans. J. Lipid Res. 58, 72–80. doi: 10.1194/jlr.M069385
Pandya, J. D., Grondin, R., Yonutas, H. M., Haghnazar, H., Gash, D. M., Zhang, Z. M., et al. (2015). Decreased mitochondrial bioenergetics and calcium buffering capacity in the basal ganglia correlates with motor deficits in a nonhuman primate model of aging. Neurobiol. Aging 36, 1903–1913. doi: 10.1016/j.neurobiolaging.2015.01.018
Pandya, J. D., Royland, J. E., MacPhail, R. C., Sullivan, P. G., and Kodavanti, P. R. S. (2016). Age- and brain region-specific differences in mitochondrial bioenergetics in Brown Norway rats. Neurobiol. Aging 42, 25–34. doi: 10.1016/j.neurobiolaging.2016.02.027
Papka, R., Peretz, B., Tudor, J., and Becker, J. (1981). Age-dependent anatomical changes in an identified neuron in the Cns of Aplysia-californica. J. Neurobiol. 12, 455–468. doi: 10.1002/neu.480120505
Paradies, G., Petrosillo, G., Paradies, V., and Ruggiero, F. M. (2011). Mitochondrial dysfunction in brain aging: role of oxidative stress and cardiolipin. Neurochem. Int. 58, 447–457. doi: 10.1016/j.neuint.2010.12.016
Patro, R., Duggal, G., Love, M. I., Irizarry, R. A., and Kingsford, C. (2017). Salmon provides fast and bias-aware quantification of transcript expression. Nat. Methods 14, 417–419. doi: 10.1038/nmeth.4197
Peretz, B., Romanenko, A., and Merkesbery, W. (1984). Functional history of two motor neurons and the morphometry of their neuromuscular junctions in the gill of Aplysia: evidence for differential aging. PNAS 81, 4232–4236. doi: 10.1073/pnas.81.13.4232
Peretz, B., and Srivatsan, M. (1992). Differences in aging in two neural pathways: proposed explanations from the nervous system of Aplysia. Exp. Gerontol. 27, 83–97. doi: 10.1016/0531-5565(92)90031-t
Pieta Dias, C., Martins de Lima, M. N., Presti-Torres, J., Dornelles, A., Garcia, V. A., Siciliani Scalco, F., et al. (2007). Memantine reduces oxidative damage and enhances long-term recognition memory in aged rats. Neuroscience 146, 1719–1725. doi: 10.1016/j.neuroscience.2007.03.018
Pollard, A. K., Craig, E. L., and Chakrabarti, L. (2016). Mitochondrial complex 1 activity measured by spectrophotometry is reduced across all brain regions in ageing and more specifically in neurodegeneration. PLoS One 11:e0157405. doi: 10.1371/journal.pone.0157405
R Core Team (2013). R: A Language and Environment for Statistical Computing. Vienna: R Foundation for Statistical Computing.
Rattan, K. S., and Peretz, B. (1981). Age-dependent behavioral changes and physiological changes in identified neurons in Aplysia californica. J. Neurobiol. 12, 469–478. doi: 10.1002/neu.480120506
Raz, N., and Daugherty, A. M. (2018). Pathways to brain aging and their modifiers: free-radical-induced energetic and neural decline in senescence (FRIENDS) model - a mini-review. Gerontology 64, 49–57. doi: 10.1159/000479508
Reuter-Lorenz, P. (2002). New visions of the aging mind and brain. Trends Cogn. Sci. 6:394. doi: 10.1016/s1364-6613(02)01957-5
Ritchie, M. E., Phipson, B., Wu, D., Hu, Y. F., Law, C. W., Shi, W., et al. (2015). limma powers differential expression analyses for RNA-sequencing and microarray studies. Nucleic Acids Res. 43:e47. doi: 10.1093/nar/gkv007
Samokhvalov, V., Ignatov, V., and Kondrashova, M. (2004). Inhibition of Krebs cycle and activation of glyoxylate cycle in the course of chronological aging of Saccharomyces cerevisiae. Compensatory role of succinate oxidation. Biochimie 86, 39–46. doi: 10.1016/j.biochi.2003.10.019
Sandhu, S. K., and Kaur, G. (2002). Alterations in oxidative stress scavenger system in aging rat brain and lymphocytes. Biogerontology 3, 161–173. doi: 10.1023/a:1015643107449
Savage, M. J., Goldberg, D. J., and Schacher, S. (1987). Absolute specificity for retrograde fast axonal transport displayed by lipid droplets originating in the axon of an identified Aplysia neuron in vitro. Brain Res. 406, 215–223. doi: 10.1016/0006-8993(87)90785-2
Schriner, S. E., Linford, N. J., Martin, G. M., Treuting, P., Ogburn, C. E., Emond, M., et al. (2005). Extension of murine life span by overexpression of catalase targeted to mitochondria. Science 308, 1909–1911. doi: 10.1126/science.1106653
Shimabukuro, M. K., Langhi, L. G. P., Cordeiro, I., Brito, J. M., Batista, C. M. D., Mattson, M. P., et al. (2016). Lipid-laden cells differentially distributed in the aging brain are functionally active and correspond to distinct phenotypes. Sci. Rep. 6:23795. doi: 10.1038/srep23795
Silvestri, L., and Camaschella, C. (2008). A potential pathogenetic role of iron in Alzheimer’s disease. J. Cell Mol. Med. 12, 1548–1550. doi: 10.1111/j.1582-4934.2008.00356.x
Soneson, C., Love, M. I., and Robinson, M. D. (2015). Differential analyses for RNA-seq: transcript-level estimates improve gene-level inferences. F1000research 4:1521. doi: 10.12688/f1000research.7563.2
Srividhya, R., Zarkovic, K., Stroser, M., Waeg, G., Zarkovic, N., and Kalaiselvi, P. (2009). Mitochondrial alterations in aging rat brain: effective role of (-)-epigallo catechin gallate. Int. J. Dev. Neurosci. 27, 223–231. doi: 10.1016/j.ijdevneu.2009.01.003
Stegeman, R., and Weake, V. M. (2017). Transcriptional signatures of aging. J. Mol. Biol. 429, 2427–2437. doi: 10.1016/j.jmb.2017.06.019
Sundberg, J. P., Berndt, A., Sundberg, B. A., Silva, K. A., Kennedy, V., Bronson, R., et al. (2011). The mouse as a model for understanding chronic diseases of aging: the histopathologic basis of aging in inbred mice. Pathobiol. Aging Age Relat. Dis. 1:7179. doi: 10.3402/pba.v1i0.7179
Sung, Y. J., Walters, E. T., and Ambron, R. T. (2004). A neuronal isoform of protein kinase G couples mitogen-activated protein kinase nuclear import to axotomy-induced long-term hyperexcitability in Aplysia sensory neurons. J. Neurosci. 24, 7583–7595. doi: 10.1523/Jneurosci.1445-04.2004
Susswein, A. J., and Chiel, H. J. (2012). Nitric oxide as a regulator of behavior: new ideas from Aplysia feeding. Prog. Neurobiol. 97, 304–317. doi: 10.1016/j.pneurobio.2012.03.004
Terman, A., and Brunk, U. T. (2004). Lipofuscin. Int. J. Biochem. Cell Biol. 36, 1400–1404. doi: 10.1016/j.biocel.2003.08.009
Terzibasi, E., Valenzano, D. R., and Cellerino, A. (2007). The short-lived fish Nothobranchius furzeri as a new model system for aging studies. Exp. Gerontol. 42, 81–89. doi: 10.1016/j.exger.2006.06.039
Thomsen, M. S., Andersen, M. V., Christoffersen, P. R., Jensen, M. D., Lichota, J., and Moos, T. (2015). Neurodegeneration with inflammation is accompanied by accumulation of iron and ferritin in microglia and neurons. Neurobiol. Dis. 81, 108–118. doi: 10.1016/j.nbd.2015.03.013
Walker, T., Michaelides, C., Ekonomou, A., Geraki, K., Parkes, H. G., Suessmilch, M., et al. (2016). Dissociation between iron accumulation and ferritin upregulation in the aged substantia nigra: attenuation by dietary restriction. Aging 8, 2488–2489. doi: 10.18632/aging.101069
Wallace, L. M., and Howlett, S. E. (2016). Commentary: Age-related neurodegenerative disease research needs aging models. Front. Aging Neurosci. 8:9. doi: 10.3389/fnagi.2016.00009
Walters, E. T., Bodnarova, M., Billy, A. J., Dulin, M. F., Diaz-Rios, M., Miller, M. W., et al. (2004). Somatotopic organization and functional properties of mechanosensory neurons expressing sensorin-A mRNA in Aplysia californica. J. Comp. Neurol. 471, 219–240. doi: 10.1002/cne.20042
Ward, R., Zucca, F. A., Duyn, J. H., Crichton, R. R., and Zecca, L. (2014). The role of iron in brain ageing and neurodegenerative disorders. Lancet Neurol. 13, 1045–1060. doi: 10.1016/S1474-4422(14)70117-6
Watts, M. E., Pocock, R., and Claudianos, C. (2018). Brain energy and oxygen metabolism: emerging role in normal function and disease. Front. Mol. Neurosci. 11:216. doi: 10.3389/fnmol.2018.00216
Weindruch, R., and Masoro, E. J. (1991). Concerns about rodent models for aging research. J. Gerontol. 46, B87–B88. doi: 10.1093/geronj/46.3.B87
Wickham, H., Averick, M., Bryan, J., Chang, W., McGowan, L., François, R., et al. (2019). Welcome to the tidyverse. J. Open Source Softw. 4:1686. doi: 10.21105/joss.01686
Wilson, D. L. (1994). The analysis of survival (mortality) data: fitting Gompertz, Weibull, and logistic functions. Mech. Ageing Dev. 74, 15–33. doi: 10.1016/0047-6374(94)90095-7
Yang, L., Cao, Y., Zhao, J., Fang, Y., Liu, N., and Zhang, Y. (2019). Multidimensional proteomics identifies declines in protein homeostasis and mitochondria as early signals for normal aging and age-associated disease in Drosophila. Mol. Cell. Proteomics 18, 2078–2088. doi: 10.1074/mcp.RA119.001621
Yankner, B. A., Lu, T., and Loerch, P. (2008). The aging brain. Annu. Rev. Pathol. 3, 41–66. doi: 10.1146/annurev.pathmechdis.2.010506.092044
Yu, G. C., Wang, L. G., Han, Y. Y., and He, Q. Y. (2012). clusterProfiler: an R package for comparing biological themes among gene clusters. OMICS J. Integr. Biol. 16, 284–287. doi: 10.1089/omi.2011.0118
Zahn, J. M., Poosala, S., Owen, A. B., Ingram, D. K., Lustig, A., Carter, A., et al. (2007). AGEMAP: A gene expression database for aging in mice. PLoS Genet. 3:e30201. doi: 10.1371/journal.pgen.0030201
Zecca, L., Gallorini, M., Schunemann, V., Trautwein, A. X., Gerlach, M., Riederer, P., et al. (2001). Iron, neuromelanin and ferritin content in the substantia nigra of normal subjects at different ages: consequences for iron storage and neurodegenerative processes. J. Neurochem. 76, 1766–1773. doi: 10.1046/j.1471-4159.2001.00186.x
Zhou, Q., Lam, P. Y., Han, D., and Cadenas, E. (2008). c-Jun N-terminal kinase regulates mitochondrial bioenergetics by modulating pyruvate dehydrogenase activity in primary cortical neurons. J. Neurochem. 104, 325–335. doi: 10.1111/j.1471-4159.2007.04957.x
Keywords: transcriptomics, time series, buccal ganglion, pleural ganglion, survival curve
Citation: Kron NS, Schmale MC and Fieber LA (2020) Changes in Metabolism and Proteostasis Drive Aging Phenotype in Aplysia californica Sensory Neurons. Front. Aging Neurosci. 12:573764. doi: 10.3389/fnagi.2020.573764
Received: 17 June 2020; Accepted: 12 August 2020;
Published: 15 September 2020.
Edited by:
Cristina Marchetti, European Brain Research Institute, ItalyReviewed by:
Ivan Arisi, European Brain Research Institute (EBRI) “Rita Levi-Montalcini”, ItalyMichele D’Angelo, University of L’Aquila, Italy
Copyright © 2020 Kron, Schmale and Fieber. This is an open-access article distributed under the terms of the Creative Commons Attribution License (CC BY). The use, distribution or reproduction in other forums is permitted, provided the original author(s) and the copyright owner(s) are credited and that the original publication in this journal is cited, in accordance with accepted academic practice. No use, distribution or reproduction is permitted which does not comply with these terms.
*Correspondence: Nicholas S. Kron, bi5rcm9uQHVtaWFtaS5lZHU=