- School of Biomedical Engineering, Shanghai Jiao Tong University, Shanghai, China
Alzheimer's disease (AD) is one of the most common neurodegenerative diseases. To identify AD-related genes from transcriptomics and help to develop new drugs to treat AD. In this study, firstly, we obtained differentially expressed genes (DEG)-enriched coexpression networks between AD and normal samples in multiple transcriptomics datasets by weighted gene co-expression network analysis (WGCNA). Then, a convergent genomic approach (CFG) integrating multiple AD-related evidence was used to prioritize potential genes from DEG-enriched modules. Subsequently, we identified candidate genes in the potential genes list. Lastly, we combined deepDTnet and SAveRUNNER to predict interaction among candidate genes, drug and AD. Experiments on five datasets show that the CFG score of GJA1 is the highest among all potential driver genes of AD. Moreover, we found GJA1 interacts with AD from target-drugs-diseases network prediction. Therefore, candidate gene GJA1 is the most likely to be target of AD. In summary, identification of AD-related genes contributes to the understanding of AD pathophysiology and the development of new drugs.
Introduction
Alzheimer's disease (AD) is one of the most common neurodegenerative diseases, accounting for the majority of dementia patients (Wood, 2018; Darby et al., 2019). AD is estimated to affect in 13.8 million individuals in the United States (US), with 7.0 million being aged 85 years or older by 2050 (Alzheimer's Association, 2018; Cummings et al., 2019). Currently, genetic factor are believed to be partially responsible for AD (Xu et al., 2018). Genome-wide association studies (GWAS) have also revealed that some single nucleotide polymorphisms (SNPs) contribute to AD disease onset (Hao et al., 2019; Andrews et al., 2020). These include common variants such as amyloid protein precursor (APP), presenilin-1 (PSEN1), presenilin-2 (PSEN2) and apolipoprotein E (APOE). PSEN1, PSEN2 and APP genes are clear pathogenic genes of early-onset AD (Lanoiselée et al., 2017). APOE, as the only identified risk gene for late-onset AD, can increase the rate of cognitive decline (Wijsman et al., 2011). Different microRNAs (miRNAs) are also involved in the pathophysiology of AD (Femminella et al., 2015). For example, miRNA-377 promotes cell proliferation and inhibits cell apoptosis by regulating the expression level of cadherin 13 (CDH13), thus participating in the occurrence and development of AD (Liu et al., 2018). Long non-coding RNAs (lncRNAs) have been widely reported to be associated with a variety of physiological and pathological processes, such as AD. Brain cytoplasmic RNA is a kind of lncRNA, and the overexpression of brain cytoplasmic may lead to synaptic/dendritic degeneration in AD (Doxtater et al., 2020). Despite the fact that remarkable advances have been made in the understanding of the genetic basis of AD, there is no disease modifying therapy for AD. Identification of AD-related genes from transcriptomics becomes an attractive strategy for finding potential targets for drug therapy.
Gene expression profiling of transcriptomic datasets of AD and normal brain samples has identified potential genes and contributed to the search for potential targets (Patel et al., 2019). Correlation networks are often used to analyze gene expression data and gather biologically-relevant information from genes with similar co-expression patterns. At present, the two most commonly used gene co-expression network algorithms are SWItchMiner (SWIM) (Falcone et al., 2019) and Weighted Gene Correlation Network Analysis (WGCNA) (Nangraj et al., 2020; Ren et al., 2020). SWIM constructs an unweighted correlation network using local and global graph attributes to mine genes, known as switch genes, that have been shown to be associated with drastic changes in cell phenotypes, such as cancer development. WGCNA builds a correlation network that can be weighted or unweighted, and identifies related genes by measuring the centrality of a gene in the network. However, SWIM does not consider scale-free networks. The most notable characteristic of a scale-free network is the relative commonness of vertices with a degree that greatly exceeds the average. The highest-degree nodes are often referred to as "hubs" and are considered to have a specific purpose in their network. WGCNA is based solely on a scale-free network that is used to determine the relationships between genes, thereby enabling the identification of modules (clusters) of highly correlated genes, and the hub gene in each module. WGCNA is ideal for the identification of gene modules and key genes that contribute to phenotypic traits. Here, we used WGCNA to mine AD-specific modules from DEGs of AD and normal samples and identified candidate genes of from AD-specific modules.
Studying target-drug-disease network has contributed to the search for candidate genes of AD. In recent years, deep learning has been applied in biomedical and artificial intelligence fields, and many deep learning frameworks have been used to deal with the prediction problem of drug-target interaction (DTIs) (Xia et al., 2019). Öztürk et al. (2018) proposed a convolutional neural network (CNN)-based method based on using only sequence information and performing DTIs prediction on Davis and KIBA dataset. Rayhan et al. developed the FRnet-DTI, which is using autoenconder and CNN for feature extraction and classification, respectively (Chu et al., 2021). Zeng et al. (2020a) utilized cascade deep forest and arbitrary-order neighboring algorithms to predict DTIs. Zeng et al. (2020b) developed deepDTnet, a deep learning methodology for new target identification and drug repurposing in a heterogeneous network embedding 15 types of chemical, genomic, phenotypic, and cellular network profiles. Lots of works has been proposed for drug repurposing. Zeng et al. (2019) presented deepDR (deep learning-based drug repositioning), to systematically infer new drug-disease relationships for in silico drug repurposing. Fiscon et al. (2021) proposed SAveRUNNER, which predicts drug-disease associations by quantifying the interplay between the drug targets and the disease-specific proteins in the human interactome via a novel network-based similarity measure that prioritizes associations between drugs and diseases locating in the same network neighborhoods. Here, we combined deepDTnet and SAveRUNNER to predict interaction among candidate genes, drug and AD.
In this paper, we aimed to search potential driver genes for AD from DEGs based on multiple transcriptomics dataset. We hypothesized that the DEGs might be regulated by several candidate genes in the DEG-enriched coexpression modules/networks by WGCNA. We used CFG score as a measurement of the likelihood for candidate genes to be AD targets. Further, we combined deepDTnet and SAveRUNNER to predict interaction between candidate genes and AD based on gene-drug-disease network in Figure 1.
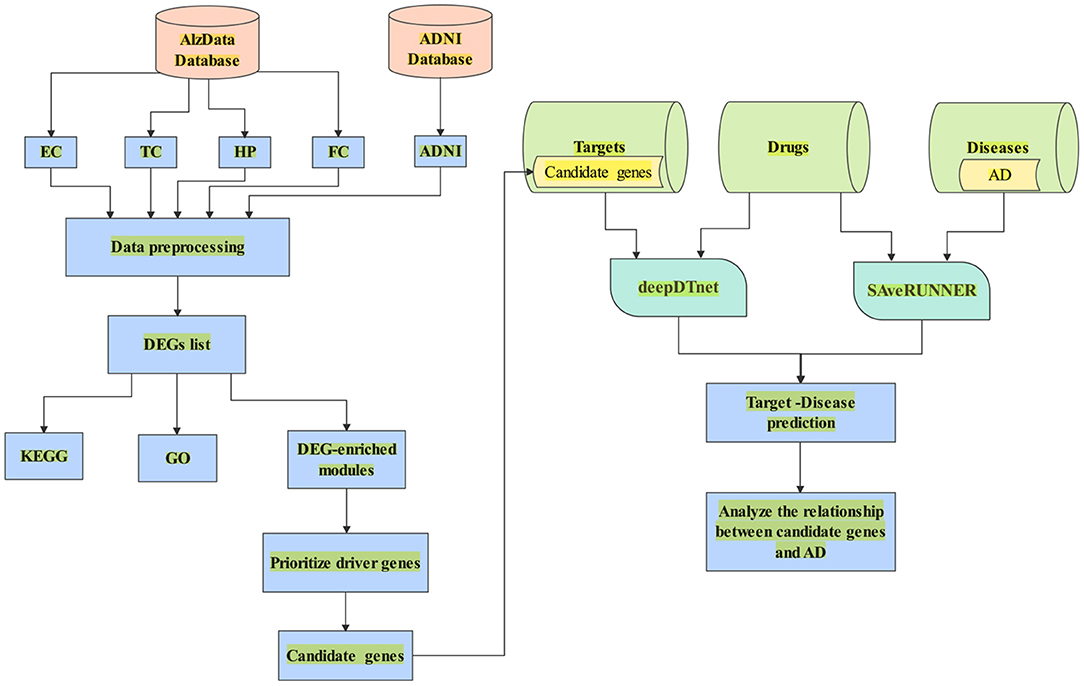
Figure 1. A flowchart of the whole study. (1) Data collection from AlzData and ADNI; (2) Data preprocessing (e.g., eliminating the samples with missing data); (3) DEGs regarded with |logFC| > 0.1 and FDR < 0.05; (4) Enrichment of biological process analyzed by DAVID 6.8; (5) Use WGCNA to find AD-specific module; (6) Prioritize driver genes of AD by CFG score; (7) candidate genes with CFG ≥ 5 are identified. (8) Collect the dataset of target, drug and disease; (9) Combine deepDTnet and SAveRUNNER to predict association between candidate genes and AD.
Materials and Methods
AD Expression Data Collection and Preprocessing
Our dataset came from the AlzData and ADNI database. For AlzData, Xu et al. constructed new database AlzData (http://www.alzdata.org/) including, hippocampus (HP), entorhinal cortex (EC), frontal cortex (FC), and temporal cortex (TC). The original four microarray data come from Gene Expression Omnibus (GEO) (https:// www.ncbi.nlm.nih.gov/geo), by searching with the keyword “Alzheimer.” Data retrieval has been performed using the following series of criteria: 1) AD-related expression profiles in the ArrayExpress database (https://www.ebi.ac.uk/arrayexpress/) were checked to avoid potential omissions; 2) Studies with no genome-wide probes or few probes were filtered; 3) For those GSE series with possibly duplicated samples or identical sample resource, we retained the one with a larger sample size and excluded another; 4) Only expression profiles of human postmortem brain tissues from HP, EC, FC, and TC, which were main regions affected by AD, were included; 5) Data retrieval and quality control were double-checked by two investigators. To ensure data quality, samples that were younger than 50 years old, or were outliers in our principal component analysis (PCA) of expression distribution, were excluded from this study.
For ADNI data (http://adni.loni.usc.edu), Gene expression profiling from peripheral blood samples collected using PAXgene tubes for RNA analysis was performed on the Affymetrix Human Genome U219 Array (www.affymetrix.com, Santa Clara, CA) for ADNI and on the Illumina Whole-Genome DASL assay (www.illumina.com, San Diego, CA) for AddNeuroMed and MCSA. All probe sets were mapped and annotated with reference to the human genome (hg19). Raw microarray expression values were pre-processed followed by standard quality control (QC) procedures on samples and probe sets. Briefly, raw expression values were pre-processed using the robust multi-chip average normalization method. We checked discrepancies between the reported sex and sex determined from sex-specific gene expression data including XIST and USP9Y and also evaluated whether SNP genotypes were matched with genotypes predicted from gene expression data.
In this study, we only consider gene expression data and binary classification problem (control vs. AD). After data processing, e.g., eliminating the samples with missing data, altogether, we have 467 controls and 309 AD from five dataset for subsequent analyses in total, including EC (39 vs. 39), HP (67 vs. 74), FC (128 vs. 104), TC (39 vs. 52) and ADNI (194 vs. 40). Detailed information of each dataset is shown in Table 1.
Statistical Analysis
Genes with log2 fold change greater than 0.1 (|logFC| > 0.1) and FDR smaller than 0.05 (FDR < 0.05) were defined as DEGs in AD patients in the each dataset. Functional enrichment of the DEGs was produced from Database for DAVID 6.8, which now provides a comprehensive set of functional annotation tools for investigators to understand biological meaning behind large list of genes. For obtained list of DEGs, DAVID 6.8 is able to identify enriched biological themes, particularly KEGG pathway and GO terms (Huang et al., 2007). Differential expression analysis was conducted by R package limma and the Benjamini-Hochberg's method was used to correct for multiple comparisons (Xu et al., 2018).
Weighted Gene Co-expression Network Analysis
We used R package WGCNA to perform the weighted correlation network analysis. For genes i and j, the correlation coefficient is rij, we define the correlation intensity : , which depends on the choice of power β (the power value ranging from 1 to 20). When the independence is more than 0.80, the scale-free network is obtained by screening the appropriate power value. Finally, the adjacency matrix was transformed into topological overlap matrix (TOM). Once the network is built through the TOM, it is converted to a distance matrix (1-TOM) to use it as the basis for clustering. A dynamic tree-cutting algorithm is then applied to the dendrogram to generate a partition of disjunct sets of genes. In addition, we extracted the corresponding gene information of each module for further analysis (Bot́ıa et al., 2017).
deepDTnet and SAveRUNNER
In this study, we combined deepDTnet and SAveRUNNER to predict interaction between candidate genes and AD. deepDTnet and SAveRUNNER were applied to predict the interactions of candidate genes/targets and drugs and relationship drugs and diseases, respectively.
Firstly, deepDTnet uses stacked denoising autoencoder (SDAE) to obtain low-dimensional embedding for both drugs and targets. A SDAE model minimizes the regularized problem and tackles reconstruction error, defined as follows:
where x is input sample x(a vector); L is the number of layers, wl is weight matrix, and bl is bias vector of layer l∈{1, ., L}. λ is a regularization parameter and ||.||F denotes the Frobenius norm. The middle layer is the key that enables SDAE to reduce dimensionality and extract effective representations of side information.
Subsequently, Positive Unlabeled-matrix completion is used to predict unknown drug-target pairs. Assume the drug-target interaction matrix is given as , where Nd is the number of drugs and Nt is the number of targets. When Pij = 1, infers drug i is linked to target j while zero indicates the relationship is unobserved. The optimization problem of our model is parameterized as:
where the set Ω∈Nd × Nt is the observed entries from the true underlying matrix that includes both positive and negative entries, such that Ω = Ω+∪Ω−, let Ω+ denotes the observed samples and Ω−denotes the missing entries chosen as negatives. Under the assumption that the matrix is modeled to be low rank, i.e., W∈Nd × k and H∈Nt × k, and these matrices share a low dimensional latent space, satisfying k ≤ Nd, Nt. For biased inductive matrix completion, the value α is the key parameter, λ is a regularization parameter. Next, we approximate the likelihood of the pairwise interaction score between drug i and target j as:
where the higher score means a higher possibility that drug i is correlated with target j.
Then, to quantify the vicinity between drug and disease modules, SAveRUNNER implements a novel network similarity measure:
Where p is the network proximity measure defined: that represents the average shortest path length between drug targets t in the drug module T and the nearest disease genes s in the disease module S; QC is the quality cluster score; m is max(p); c and d are the steepness and the midpoint of f(p), respectively.
Finally, via deepDTnet and SAveRUNNER, we identified newly the relationship among candidate genes, drug and neurodegenerative diseases, which is including AD.
More detail about deepDTnet and SAveRUNNER could be found in previous study (Zeng et al., 2020b; Fiscon et al., 2021).
Convergent Functional Genomics
The potential driver genes was prioritized from AD-specific modules by CFG method, which integrated various levels of AD-related evidence (Ayalew et al., 2012; Xu et al., 2018). The range of CFG score was from 0 to 5, with 5 indicating highest priority. There were five AD-related evidence:1) Genetic association. If a gene had at least one locus being significantly associated with AD based on the summary statistics from the International Genomics of Alzheimer's Project [IGAP], 1 point was assigned; otherwise zero point. 2) Genetic regulation of gene expression. If a gene was associated with Expression Quantitative Trait Loci (eQTLs) showing an AD-risk in IGAP data, 1 point was assigned; otherwise zero point. 3) Protein-protein interaction. If a gene was physically interacted with any AD core genes (APP, PSEN1, PSEN2, APOE, or MAPT), 1 point was assigned; otherwise zero point. 4) Expression correlation with AD pathology. If the expression level of a gene was correlated with AD pathology in AD mice, 1 point was assigned; otherwise zero point. 5) Early alteration in AD mouse brain. If a gene showed differential expression in hippocampus of 2-month-old AD mice compared with age matched wild-type mice, 1 point was assigned; otherwise zero point.
Results
DEG Detection
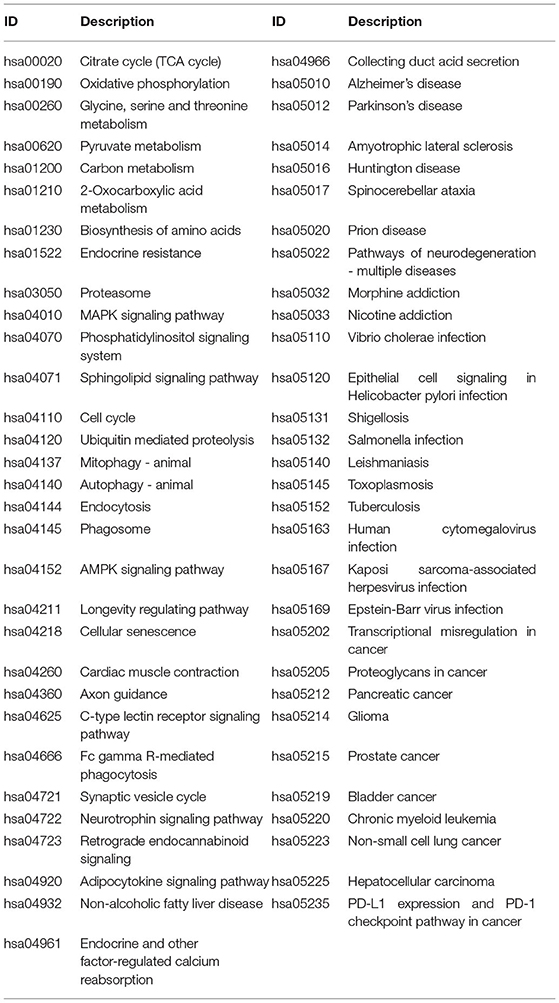
A total of 776 samples and 108,302 genes from multiple transcriptomic datasets were compiled for DEGs detection. Besides, for ADNI dataset, we randomly chose 40 samples from the control in 10 times and selected gene with frequency greater than or equal to 3. Each red node represented DEG for five datasets in Figure 2. We identified 7,567 DEG(2166 EC, 1952 HP, 949 FC, 3075 TC and 3204 ADNI) for subsequent analyses. About 6 19% of the total genes could be identified as DEGs. Among the DEG list in all five datasets, the expression patterns of well-known AD risk genes, such as APP, PSEN1, PSEN2, APOE and MAPT were only slightly altered or unchanged in AD patients. In addition, 19 genes had a consistently differential expression from EC, HP, FC, TC and ADNI (Figure 3). We investigated functional enrichment of the AD-related DEGs. The 7,567 target genes in the network were enriched in 324 KEGG pathway and 1,381 GO terms in Figure 4. We identified 61 KEGG pathway and 324 GO terms (P< 0.005), respectively. As shown in Table 2, we also found several pathways have been reported to be associated with AD, including Alzheimer's disease pathway, MAPK signaling pathway and AMPK signaling pathway. Top 20 significantly KEGG pathway selected was exhibited for each dataset in Figure 5. Besides, these GO terms are divided into ontologies based on a hierarchical relations. Specifically, DEGs related to the biological processes for synaptic-related functions were significant enriched in Table 3, such as chemical synaptic transmission, regulation of postsynaptic membrane potential, synaptic vesicle exocytosis, synaptic transmission, GABAergic, regulation of synaptic transmission, glutamatergic, synaptic vesicle endocytosis and long-term synaptic potentiation. In addition, they were associated with neuron-related processes, including neurotransmitter secretion, neuron projection morphogenesis, negative regulation of neuron apoptotic process and negative regulation of neuron projection development.
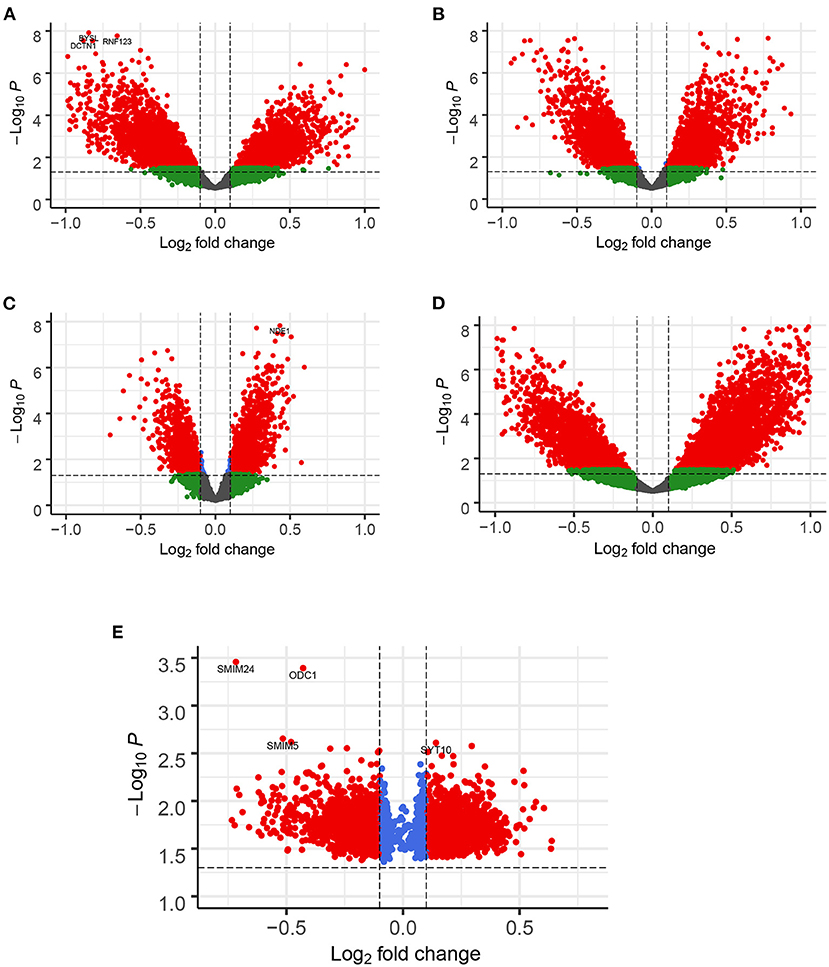
Figure 2. Enhanced Volcano for illustrating DEGs in all datasets. The gene with |logFC| > 0.1 and FDR < 0.05 as DEGs shown in red node. (A) EC, (B) HP, (C) FC, (D) TC and (E) ADNI. Note: in ADNI dataset, DEGs by counting the frequency of 3 or above out of 10 occurrences.
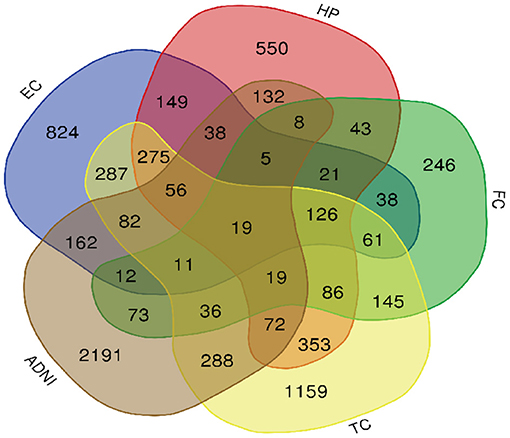
Figure 3. Venn diagram is used to represent relationships between EC (blue), HP (red), FC (green), TC (yellow) and ADNI (brown).
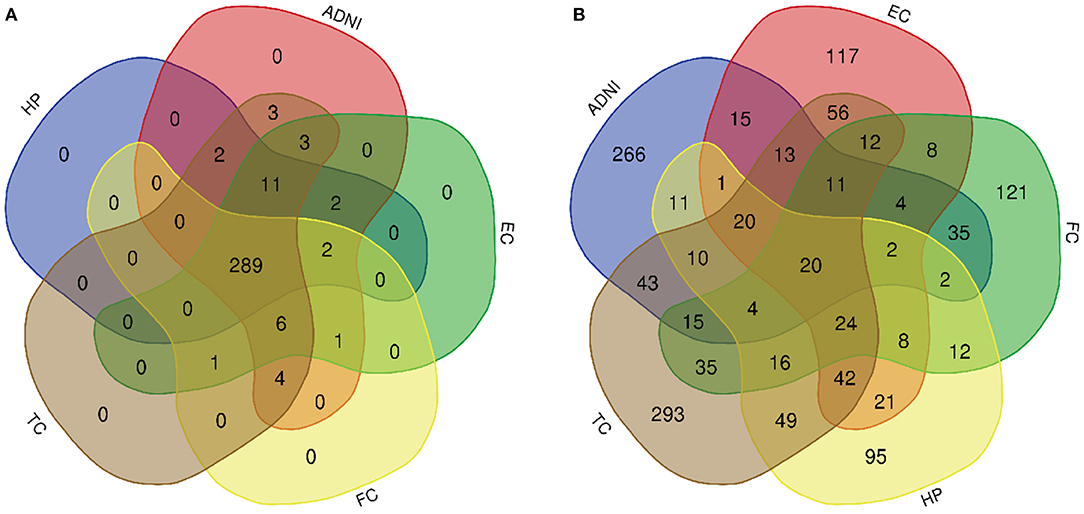
Figure 4. Venn diagram is used to represent relationships between multiple datasets. (A) KEGG pathway and (B) GO term.
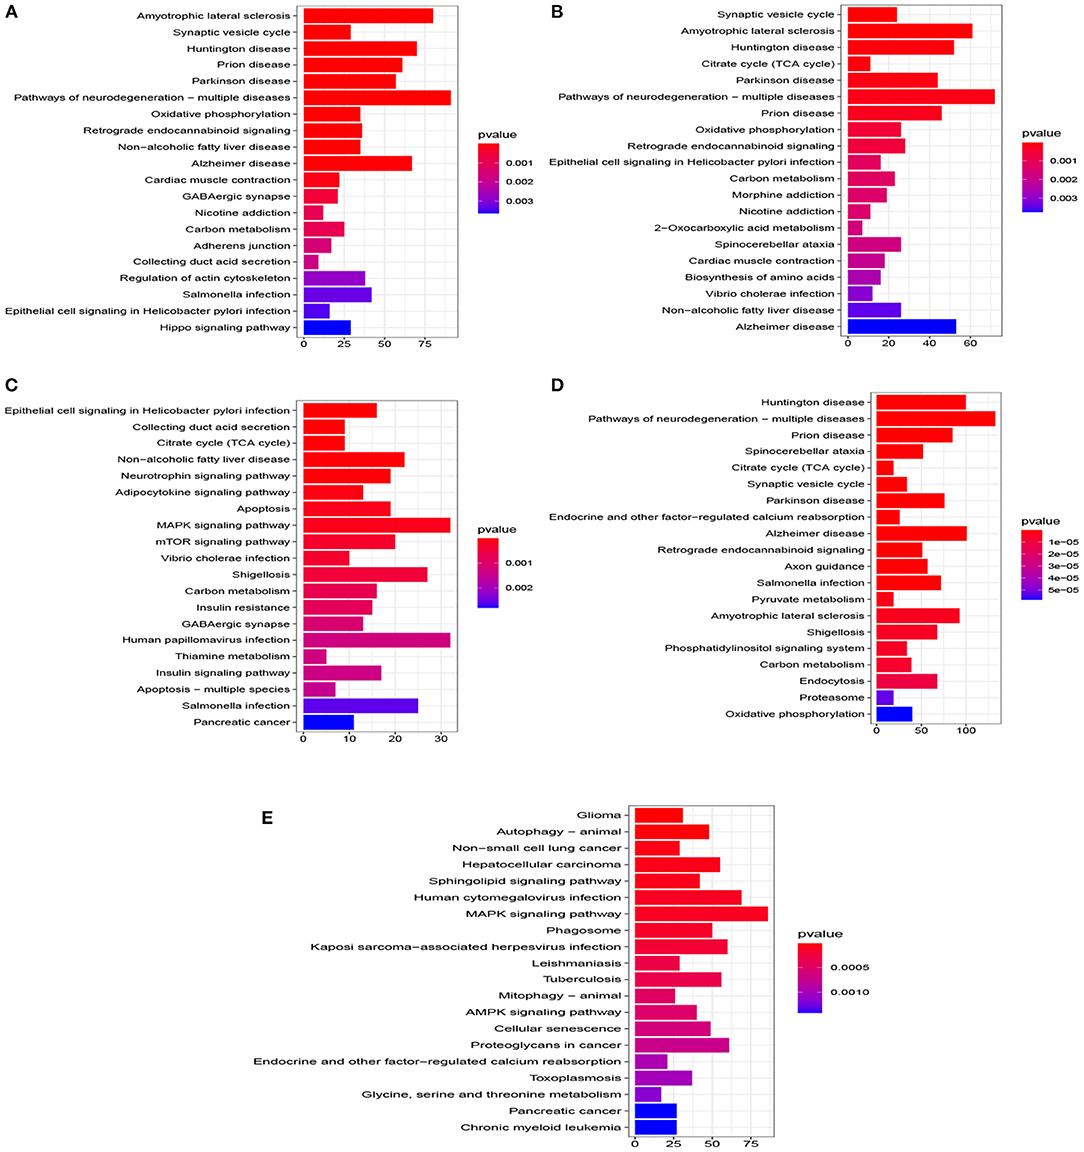
Figure 5. Top 20 pathway of KEGG for five datasets (P < 0.005). (A) EC, (B) HP, (C) FC, (D) TC, and (E) ADNI.
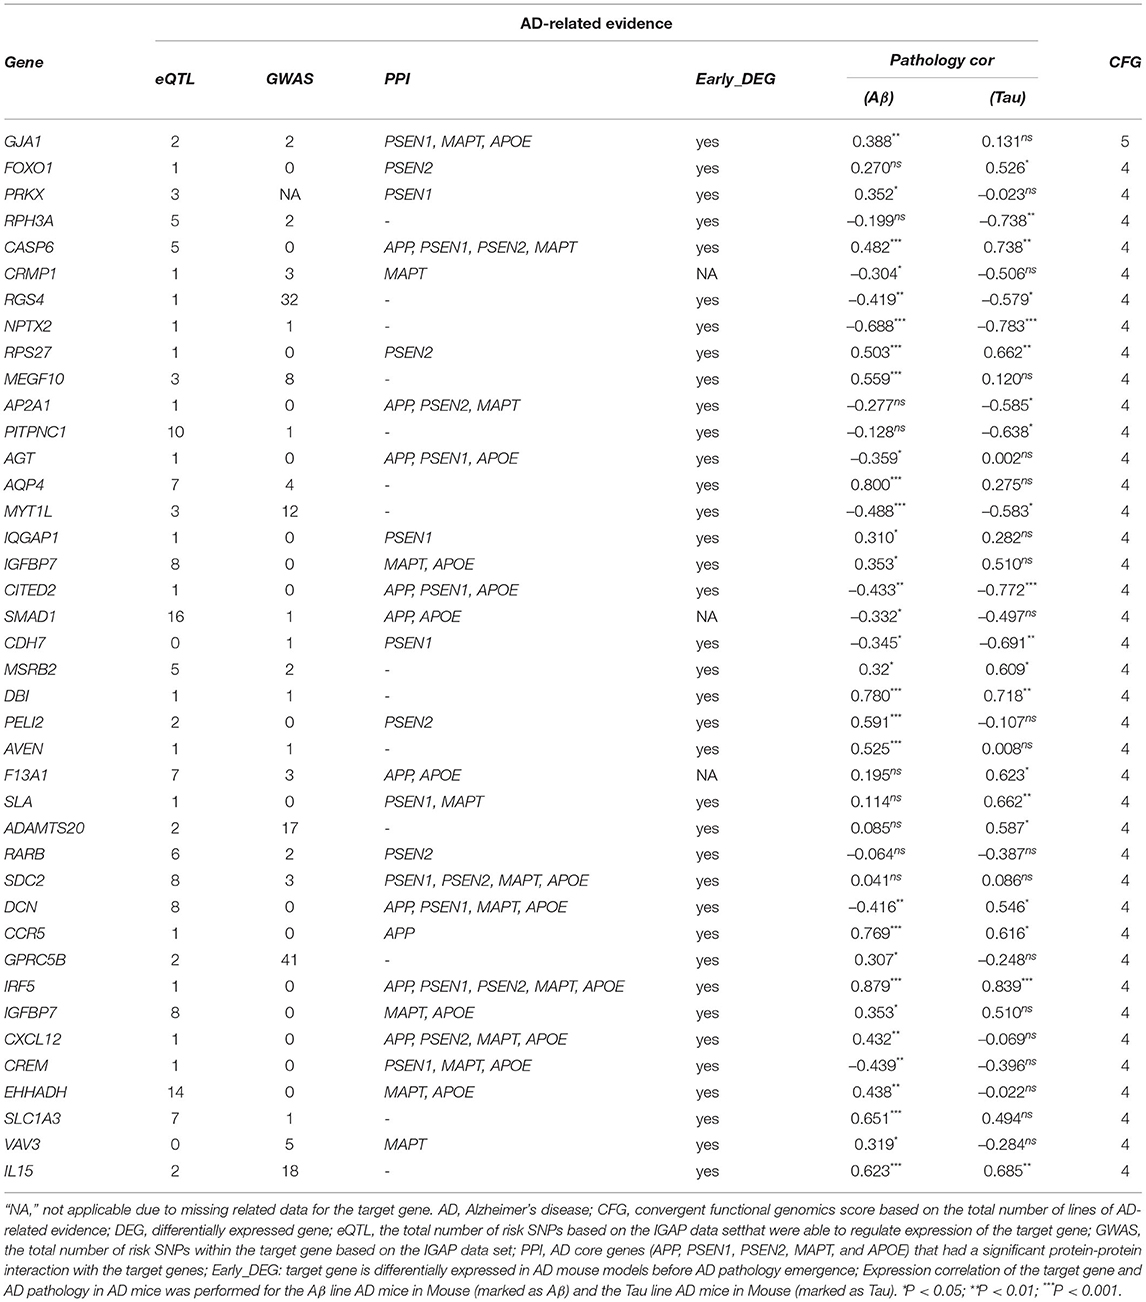
We used WGCNA to divide the DEGs into several highly related gene modules. As shown in Figure 6, a very significant positive correlation was observed between five modules and AD for five dataset. A modular size was ranged from 96 to 142 genes that might reflect the different layers and complexity of gene regulation in the AD brain. These five AD-specific modules were used for identifying potential driver genes for AD etiology and pathology. We obtained potential driver genes from each AD-specific modules for every dataset. Finally, after removing the overlap genes, we have 602 candidate genes from 5 AD-specific modules in total, including EC (107), HP(140), FC(142), TC(136) and ADNI(96). We hypothesized that the higher the CFG score is, the more likely the candidate genes are to be AD targets. We chose 40 genes with CFG≥4 for subsequent analyses.
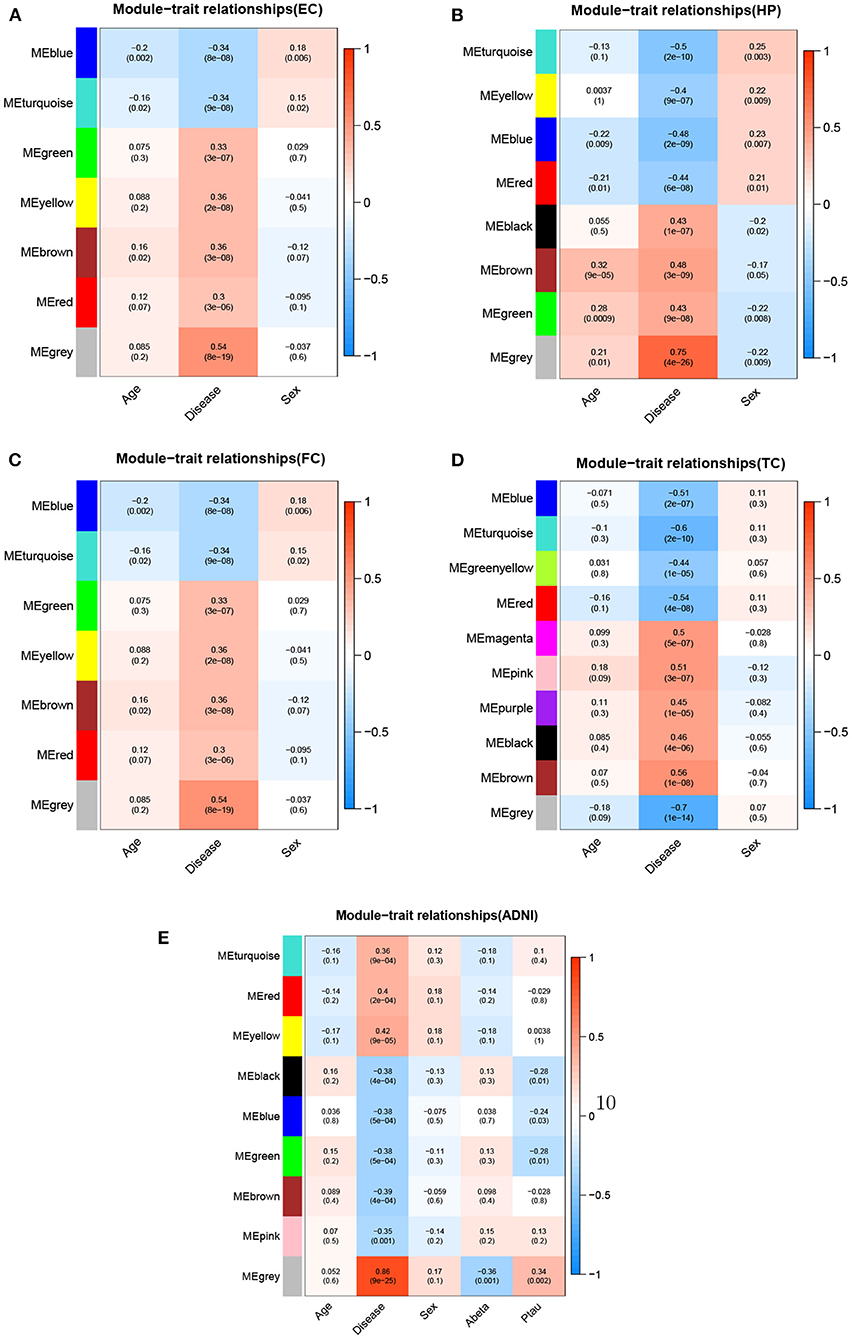
Figure 6. Module-trait relationships for five datasets.Each row represents different gene co-expression modules, and each column represents different clinical phenotypes. Number represent correlation coefficients and P-values are in parenthesis. Correlation strength is represented by continuous color, with red being positive, blue being negative. (A) EC, (B) HP, (C) FC, (D) TC, and (E) ADNI.
Identification and Prioritization of Potential Driver Genes
The 40 potential driver genes are prioritized by the CFG method based on AlzData database, which is integrated various levels of AD-related data in Table 4. For each gene, we showed the eQLT, GWAS, PPI, Early_DEG, Pathology correlation Aβ and Tau (CFG≥4), and CFG score. We found that several genes were validated by previous studies from literatures. For example, GJA1, also known as connexin 43, shows upregulated mRNA and protein levels in AD (Ren et al., 2018). Specific reductions of RPH3A immunoreactivity compared with aged controls. RPH3A loss correlated with dementia severity, cholinergic deafferentation, and increased Aβ concentrations. Furthermore, RPH3A expression is selectively downregulated in cultured neurons treated with Aβ 25–35 peptides (Tan et al., 2014). CASP6 activity is intimately associated with the pathologies that define AD, correlates well with lower cognitive performance in aged individuals, and is involved in axonal degeneration in several cellular and in vivo animal models (LeBlanc, 2013). The levels of angiotensinogen (AGT) is increased in the cerebrospinal fluid of patients with mild cognitive impairment and AD (Mateos et al., 2011). The stromal cell-derived factor 1 (SDF1), known as chemokine CXCL12, was a proinflammatory chemokine, highly expressed in the central nervous system. They may regulate synaptic transmission in excitability neurons and modulate neuroglial communication. CXCL12 was detected in plasma and hippocampus AD patients. Levels of this chemokine were considerably decreased compared to the control group (Dulewicz et al., 2020). In summary, combining WGCNA with CFG offer a useful tool to prioritize potential genes for AD.
Candidate Genes GJA1
As shown in Table 4, the CFG score of GJA1 is the highest among all potential genes and regarded as candidate gene. We combined deepDTnet and SAveRUNNER to search association between candidate genes GJA1 and AD based on target-drug-disease network. As shown in Figure 7, the network is constructed 13 drugs, a candidate genes GJA1 and neurodegenerative diseases. 11 newly drug-target interaction and 13 newly drug-disease association are identified by deepDTnet and SAveRUNNER, respectively. Especially, we found that dopamine were validated by previous studies from literatures. Dopamine, a compound of the catecholamine and phenethylamine families playing important roles in the human brain, was predicted by deepDR to be associated with AD. Such a prediction can be supported by a previous study indicating that lack of dopamine in the brain may cause some of the earliest symptoms of Alzheimer (Zeng et al., 2019). In AD, the dysfunction of dopaminergic transmission has been hypothesized as a new player in the pathophysiology of AD. Dopamine acts through five different types of receptors, generally distinct in two main subclasses: D1-like [comprising the dopamine 1 receptor (D1R) and the dopamine 5 receptor (D5R)]; and D2-like [comprising the dopamine 2 receptor (D2R), dopamine 3 receptor (D3R) and the dopamine 4 receptor (D4R)]. Pan et al. found that dopamine, D1R and D2R concentration levels were decreased in patients with AD compared with controls. Moreover, decreased levels of dopamine and D2-like receptors were linked with the pathophysiology of AD because of their strong higher rank correlations with AD (Pan et al., 2020). To conclude, candidate genes GJA1 is the most likely to be targets of AD.
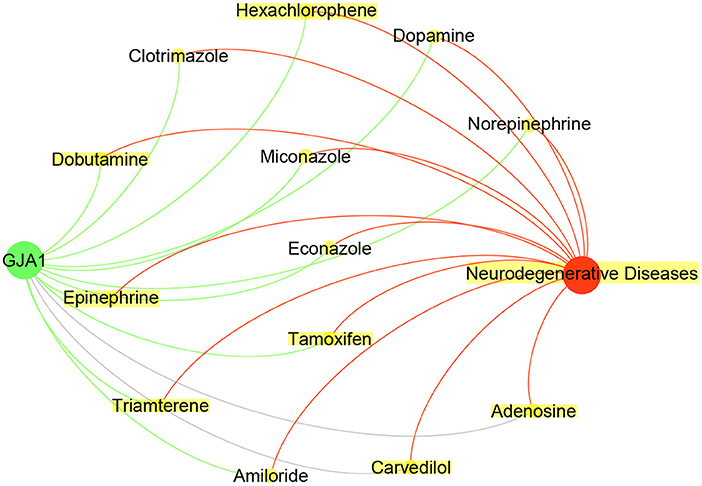
Figure 7. Drug-GJA1-disease interaction network. The network contained candidate target GJA1 (green), Neurodegenerative Diseases (red) and 13 drugs (yellow).Gray indicate known interaction. Green and red lines and newly predicted interactions using deepDTnet and SAveRUNNER, respectively.
Discussion
Pathway enrichment analysis was performed to interpret the function of these DEGs. KEGG pathway analysis for the 7,567 DEGs were significantly enriched in one KEGG pathway “MAPK signaling pathway,” which is composed of ERK, P38, and JNK. In the adult nervous system, ERK activation is necessary for synaptic plasticity and memory formation (Du et al., 2019). In the brains of AD patients, P38 is highly expressed. Aβ-induced P38 activation increases tau phosphorylation and promotes the amyloidogenic processing of APP (Giraldo et al., 2014; Gourmaud et al., 2015). In a mouse model of AD, the JNK signaling pathway is overactivated in the spine before cognitive decline (Sclip et al., 2014). These studies indicate that the overactivation of MAPK signaling pathway could cause the occurrence of AD. Therefore, preventing MAPK overactivation is effective strategy in order to reduce Aβ deposition, Tau hyperphosphorylation, neuronal apoptosis, and memory impairment. MAPKs could be potential targets for novel and effective therapeutics of AD (Yenki et al., 2013; Feld et al., 2014).
GO term analysis indicated that the 7,567 DEGs were mainly involved in chemical synaptic transmission, regulation of postsynaptic membrane potential, synaptic vesicle exocytosis, synaptic transmission, GABAergic synapses, regulation of synaptic transmission, glutamatergic, synaptic vesicle endocytosis, long-term synaptic potentiation, neurotransmitter secretion, neuron projection morphogenesis, negative regulation of neuron apoptotic process and negative regulation of neuron projection development. Damage to neuronal and synaptic function has always been considered an important pathological feature of neurodegenerative diseases, and decreased synaptic activity is also considered to be the most relevant pathological feature of AD cognitive impairment (Wu et al., 2019). For example, the downregulation of GABAergic synapses is closely related to the loss of GABAergic inhibition (Kim et al., 2020). Studies have found that GABAergic neurotransmission is closely related to various aspects of AD pathology, including Aβ toxicity and Tau hyperphosphorylation (Kadoyama et al., 2021). The level of GABA inhibitory neurotransmitter in AD patients was significantly reduced, suggesting that AD has insufficient synaptic function and neuronal transmission (Schmitz et al., 2017). In addition, In a mouse model of AD indicate that the impairment of hippocampal neurogenesis may be mediated by GABAergic signal dysfunction or the imbalance between excitatory and inhibitory synapses (Sun et al., 2009). Therefore, GABAergic synapses not only plays an important role in the function of the hippocampus, but also in the pathogenesis of AD.
Limitations
There are some limitations in this study. First, although we identified 23 potential driver genes of AD by the WGCNA and CFG method, these approachs could be used to prioritize genes rather than to identify true causal genes. Therefore, further biological validation of the identified genes are necessary in future studies. Second, 4 of 5 datasets were downloaded from AlzData, which only retained the common genes from different studies during the cross-platform normalization. Third, the sample size of EC, HP and TC available for analyze was still limited, and the larger sample size of FC and ADNI might have a greater influence on the results. Fourth, the rapid development of various omics provide new opportunities for understanding of AD. However, we only used transcriptomics dataset to identify potential driver genes of AD. Finally, more potential genes of AD were not considered. Deep learning has capacity to dig out more hidden gene in data and is a machine learning algorithm based on artificial neural network, which is a computational model inspired by the structure of human brain. The main difference between deep learning and traditional artificial neural network lies in the scale and complexity of network structure. The networks of deep learning have a larger number of hidden layers, while traditional artificial neural networks usually have only one hidden layer. This is due to the lack of big data and GPU hardware technical support in the last century. Due to the emergence of more powerful CPU and GPU hardware, deep learning with more hidden layers is proposed on the basis of artificial neural network, and more nodes can be used in each hidden layer (Esteva et al., 2019; Zou et al., 2019).
Conclusions
In this study, we identified potential driver genes from AD-specific modules using multiple transcriptomics datasets and observed that DEGs were enriched with several pathways significantly by DAVID 6.8, which are consistent with observations from previous studies. Moreover, through studying of WGCNA, CFG and drug-target-disease network prediction, candidate gene GJA1 is the most likely to be targets of AD, actually reported in previous study. In summary, identification of AD-related genes contributes to the understanding of AD pathophysiology and the development of new drugs. In summary, Our results contribute to understanding pathophysiology of AD and looking for candidates drug targets.
Data Availability Statement
The original contributions presented in the study are publicly available. This data can be found here: https://github.com/Macau-LYXia/Transcriptomics-Data-for-AD. Data used in the preparation of this article were obtained from the AlzData (http://www.alzdata.org/) and Alzheimer's Disease Neuroimaging Initiative (ADNI) database (adni.loni.usc.edu).
Author Contributions
L-YX and LT contributed to collect data sets and analyze data. L-YX, LT, HH, and JL contributed to the interpretation of the results and revised the manuscript. L-YX took the lead in writing the manuscript. All authors contributed to the article and approved the submitted version.
Funding
This work was supported by China Postdoctoral Science Foundation (2020M671125) and start-up grant of the Shanghai Jiao Tong University (WF220408213).
Conflict of Interest
The authors declare that the research was conducted in the absence of any commercial or financial relationships that could be construed as a potential conflict of interest.
Publisher's Note
All claims expressed in this article are solely those of the authors and do not necessarily represent those of their affiliated organizations, or those of the publisher, the editors and the reviewers. Any product that may be evaluated in this article, or claim that may be made by its manufacturer, is not guaranteed or endorsed by the publisher.
References
Alzheimer's Association. (2018). 2018 Alzheimer's disease facts and figures. Alzheimers Dement. 14, 367–429. doi: 10.1016/j.jalz.2018.02.001
Andrews, S. J., Fulton-Howard, B., and Goate, A. (2020). Interpretation of risk loci from genome-wide association studies of Alzheimer's disease. Lancet Neurol. 19, 326–335. doi: 10.1016/S1474-4422(19)30435-1
Ayalew, M., Le-Niculescu, H., Levey, D., Jain, N., Changala, B., Patel, S., et al. (2012). Convergent functional genomics of schizophrenia: from comprehensive understanding to genetic risk prediction. Mol. Psychiatry 17, 887–905. doi: 10.1038/mp.2012.37
Botía, J. A., Vandrovcova, J., Forabosco, P., Guelfi, S., D'Sa, K., Hardy, J., et al. (2017). An additional k-means clustering step improves the biological features of wgcna gene co-expression networks. BMC Syst. Biol. 11, 1–16. doi: 10.1186/s12918-017-0420-6
Chu, Y., Shan, X., Chen, T., Jiang, M., Wang, Y., Wang, Q., et al. (2021). Dti-mlcd: predicting drug-target interactions using multi-label learning with community detection method. Brief. Bioinformatics 22, bbaa205. doi: 10.1093/bib/bbaa205
Cummings, J., Lee, G., Ritter, A., Sabbagh, M., and Zhong, K. (2019). Alzheimer's disease drug development pipeline: 2019. Alzheimers Dementia 5, 272–293. doi: 10.1016/j.trci.2019.05.008
Darby, R. R., Joutsa, J., and Fox, M. D. (2019). Network localization of heterogeneous neuroimaging findings. Brain 142, 70–79. doi: 10.1093/brain/awy292
Doxtater, K., Tripathi, M. K., and Khan, M. M. (2020). Recent advances on the role of long non-coding rnas in Alzheimer's disease. Neural Regenerat. Res. 15, 2253. doi: 10.4103/1673-5374.284990
Du, Y., Du, Y., Zhang, Y., Huang, Z., Fu, M., Li, J., et al. (2019). Mkp-1 reduces aβ generation and alleviates cognitive impairments in Alzheimer92s disease models. Signal Transduct. Targeted Therapy 4, 1–12. doi: 10.1038/s41392-019-0091-4
Dulewicz, M., Kulczynska-Przybik, A., Borawski, B., Klimkowicz-Mrowiec, A., Pera, J., Slowik, A., et al. (2020). The cerebrospinal fluid stromal cell-derived factor 1 (cxcl12) concentration in Alzheimer's disease: biomarkers (non-neuroimaging)/novel biomarkers. Alzheimers Dementia 16, e042573. doi: 10.1002/alz.042573
Esteva, A., Robicquet, A., Ramsundar, B., Kuleshov, V., DePristo, M., Chou, K., et al. (2019). A guide to deep learning in healthcare. Nat. Med. 25, 24–29. doi: 10.1038/s41591-018-0316-z
Falcone, R., Conte, F., Fiscon, G., Pecce, V., Sponziello, M., Durante, C., et al. (2019). Braf v600e-mutant cancers display a variety of networks by swim analysis: Prediction of vemurafenib clinical response. Endocrine 64, 406–413. doi: 10.1007/s12020-019-01890-4
Feld, M., Krawczyk, M. C., Sol Fustinana, M., Blake, M. G., Baratti, C. M., Romano, A., et al. (2014). Decrease of erk/mapk overactivation in prefrontal cortex reverses early memory deficit in a mouse model of Alzheimer's disease. J. Alzheimers Dis. 40, 69–82. doi: 10.3233/JAD-131076
Femminella, G. D., Ferrara, N., and Rengo, G. (2015). The emerging role of micrornas in Alzheimer's disease. Front. Physiol. 6, 40. doi: 10.3389/fphys.2015.00040
Fiscon, G., Conte, F., Farina, L., and Paci, P. (2021). Saverunner: a network-based algorithm for drug repurposing and its application to covid-19. PLoS Comput. Biol. 17, e1008686. doi: 10.1371/journal.pcbi.1008686
Giraldo, E., Lloret, A., Fuchsberger, T., and Vi na, J. (2014). Aβ and tau toxicities in Alzheimer92s are linked via oxidative stress-induced p38 activation: protective role of vitamin e. Redox Biol. 2, 873–877. doi: 10.1016/j.redox.2014.03.002
Gourmaud, S., Paquet, C., Dumurgier, J., Pace, C., Bouras, C., Gray, F., et al. (2015). Increased levels of cerebrospinal fluid jnk3 associated with amyloid pathology: links to cognitive decline. J. Psychiatry Neurosci. 40, 151. doi: 10.1503/jpn.140062
Hao, S., Wang, R., Zhang, Y., and Zhan, H. (2019). Prediction of Alzheimer's disease-associated genes by integration of gwas summary data and expression data. Front. Genet. 9, 653. doi: 10.3389/fgene.2018.00653
Huang, D. W., Sherman, B. T., Tan, Q., Kir, J., Liu, D., Bryant, D., et al. (2007). David bioinformatics resources: expanded annotation database and novel algorithms to better extract biology from large gene lists. Nucleic Acids Res. 35(Suppl_2), W169–W175. doi: 10.1093/nar/gkm415
Kadoyama, K., Matsuura, K., Takano, M., Otani, M., Tomiyama, T., Mori, H., et al. (2021). Proteomic analysis involved with synaptic plasticity improvement by gabaa receptor blockade in hippocampus of a mouse model of Alzheimer's disease. Neurosci. Res. 165, 61–68. doi: 10.1016/j.neures.2020.04.004
Kim, S., Kim, H., Park, D., Kim, J., Hong, J., Kim, J. S., et al. (2020). Loss of iqsec3 disrupts gabaergic synapse maintenance and decreases somatostatin expression in the hippocampus. Cell Rep. 30, 1995–2005. doi: 10.1016/j.celrep.2020.01.053
Lanoiselée, H.-M., Nicolas, G., Wallon, D., Rovelet-Lecrux, A., Lacour, M., Rousseau, S., et al. (2017). App, psen1, and psen2 mutations in early-onset Alzheimer disease: a genetic screening study of familial and sporadic cases. PLoS Med. 14, e1002270. doi: 10.1371/journal.pmed.1002270
LeBlanc, A. C. (2013). Caspase-6 as a novel early target in the treatment of Alzheimer's disease. European Journal of Neuroscience 37, 2005–2018. doi: 10.1111/ejn.12250
Liu, F., Zhang, Z., Chen, W., Gu, H., and Yan, Q. (2018). Regulatory mechanism of microrna-377 on cdh13 expression in the cell model of Alzheimer's disease. Eur. Rev. Med. Pharmacol. Sci 22, 2801–2808. doi: 10.26355/eurrev_201805_14979
Mateos, L., Ismail, M.-A.-M., Gil-Bea, F.-J., Leoni, V., Winblad, B., Björkhem, I., et al. (2011). Upregulation of brain renin angiotensin system by 27-hydroxycholesterol in Alzheimer's disease. J. Alzheimers Dis. 24, 669–679. doi: 10.3233/JAD-2011-101512
Nangraj, A. S., Selvaraj, G., Kaliamurthi, S., Kaushik, A. C., Cho, W. C., and Wei, D. Q. (2020). Integrated ppi-and wgcna-retrieval of hub gene signatures shared between barrett's esophagus and esophageal adenocarcinoma. Front. Pharmacol. 11, 881. doi: 10.3389/fphar.2020.00881
Öztürk, H., Özgür, A., and Ozkirimli, E. (2018). Deepdta: deep drug-target binding affinity prediction. Bioinformatics 34, i821–i829. doi: 10.1093/bioinformatics/bty593
Pan, X., Kaminga, A. C., Jia, P., Wen, S. W., Acheampong, K., and Liu, A. (2020). Catecholamines in alzheimer's disease: a systematic review and meta-analysis. Front. Aging Neurosci. 12, 184. doi: 10.3389/fnagi.2020.00184
Patel, H., Dobson, R. J., and Newhouse, S. J. (2019). A meta-analysis of Alzheimer's disease brain transcriptomic data. J. Alzheimers Dis. 68, 1635–1656. doi: 10.3233/JAD-181085
Ren, R., Zhang, L., and Wang, M. (2018). Specific deletion connexin43 in astrocyte ameliorates cognitive dysfunction in app/ps1 mice. Life Sci. 208, 175–191. doi: 10.1016/j.lfs.2018.07.033
Ren, Z.-H., Shang, G.-P., Wu, K., Hu, C.-Y., and Ji, T. (2020). Wgcna co-expression network analysis reveals ilf3-as1 functions as a cerna to regulate ptbp1 expression by sponging mir-29a in gastric cancer. Front. Genet. 11, 39. doi: 10.3389/fgene.2020.00039
Schmitz, T. W., Correia, M. M., Ferreira, C. S., Prescot, A. P., and Anderson, M. C. (2017). Hippocampal gaba enables inhibitory control over unwanted thoughts. Nat. Commun. 8, 1–12. doi: 10.1038/s41467-017-00956-z
Sclip, A., Tozzi, A., Abaza, A., Cardinetti, D., Colombo, I., Calabresi, P., et al. (2014). c-jun n-terminal kinase has a key role in Alzheimer disease synaptic dysfunction in vivo. Cell Death Dis. 5, e1019–e1019. doi: 10.1038/cddis.2013.559
Sun, B., Halabisky, B., Zhou, Y., Palop, J. J., Yu, G., Mucke, L., et al. (2009). Imbalance between gabaergic and glutamatergic transmission impairs adult neurogenesis in an animal model of Alzheimer's disease. Cell Stem Cell 5, 624–633. doi: 10.1016/j.stem.2009.10.003
Tan, M. G., Lee, C., Lee, J. H., Francis, P. T., Williams, R. J., Ramírez, M. J., et al. (2014). Decreased rabphilin 3a immunoreactivity in Alzheimer's disease is associated with aβ burden. Neurochem. Int. 64, 29–36. doi: 10.1016/j.neuint.2013.10.013
Wijsman, E. M., Pankratz, N. D., Choi, Y., Rothstein, J. H., Faber, K. M., Cheng, R., et al. (2011). Genome-wide association of familial late-onset Alzheimer's disease replicates bin1 and clu and nominates cugbp2 in interaction with apoe. PLoS Genet 7, e1001308. doi: 10.1371/journal.pgen.1001308
Wood, I. C. (2018). The contribution and therapeutic potential of epigenetic modifications in Alzheimer's disease. Front. Neurosci. 12, 649. doi: 10.3389/fnins.2018.00649
Wu, M., Fang, K., Wang, W., Lin, W., Guo, L., and Wang, J. (2019). Identification of key genes and pathways for Alzheimer's disease via combined analysis of genome-wide expression profiling in the hippocampus. Biophysics Reports 5, 98–109. doi: 10.1007/s41048-019-0086-2
Xia, L.-Y., Yang, Z.-Y., Zhang, H., and Liang, Y. (2019). Improved prediction of drug-target interactions using self-paced learning with collaborative matrix factorization. J. Chem. Inf. Model. 59, 3340–3351. doi: 10.1021/acs.jcim.9b00408
Xu, M., Zhang, D.-F., Luo, R., Wu, Y., Zhou, H., Kong, L.-L., et al. (2018). A systematic integrated analysis of brain expression profiles reveals yap1 and other prioritized hub genes as important upstream regulators in Alzheimer's disease. Alzheimers Dementia 14, 215–229. doi: 10.1016/j.jalz.2017.08.012
Yenki, P., Khodagholi, F., and Shaerzadeh, F. (2013). Inhibition of phosphorylation of jnk suppresses aβ-induced er stress and upregulates prosurvival mitochondrial proteins in rat hippocampus. J.Mol. Neurosci. 49, 262–269. doi: 10.1007/s12031-012-9837-y
Zeng, X., Zhu, S., Hou, Y., Zhang, P., Li, L., Li, J., et al. (2020a). Network-based prediction of drug-target interactions using an arbitrary-order proximity embedded deep forest. Bioinformatics 36, 2805–2812. doi: 10.1093/bioinformatics/btaa010
Zeng, X., Zhu, S., Liu, X., Zhou, Y., Nussinov, R., and Cheng, F. (2019). deepdr: a network-based deep learning approach to in silico drug repositioning. Bioinformatics 35, 5191–5198. doi: 10.1093/bioinformatics/btz418
Zeng, X., Zhu, S., Lu, W., Liu, Z., Huang, J., Zhou, Y., et al. (2020b). Target identification among known drugs by deep learning from heterogeneous networks. Chem. Sci. 11, 1775–1797. doi: 10.1039/C9SC04336E
Keywords: Alzheimer's disease, transcriptomics, drug repurposing, deep learning, drug-target interaction
Citation: Xia L-Y, Tang L, Huang H and Luo J (2022) Identification of Potential Driver Genes and Pathways Based on Transcriptomics Data in Alzheimer's Disease. Front. Aging Neurosci. 14:752858. doi: 10.3389/fnagi.2022.752858
Received: 03 August 2021; Accepted: 21 February 2022;
Published: 18 March 2022.
Edited by:
Chih-Yu Hsu, Fujian University of Technology, ChinaReviewed by:
Lorenzo Farina, Sapienza University of Rome, ItalyChristoph Preuss, Jackson Laboratory, United States
Copyright © 2022 Xia, Tang, Huang and Luo. This is an open-access article distributed under the terms of the Creative Commons Attribution License (CC BY). The use, distribution or reproduction in other forums is permitted, provided the original author(s) and the copyright owner(s) are credited and that the original publication in this journal is cited, in accordance with accepted academic practice. No use, distribution or reproduction is permitted which does not comply with these terms.
*Correspondence: Jie Luo, amllbHVvQHNqdHUuZWR1LmNu
 Liang-Yong Xia
 Lihong Tang
 Hui Huang
 Jie Luo*
