 Yan Zhao
 Yong-Zhi Xie
 You-Shuo Liu
- 1Department of Geriatrics, The Second Xiangya Hospital, Central South University, Changsha, China
- 2Institute of Aging and Age-Related Disease Research, Central South University, Changsha, China
- 3Department of Radiology, The Third Xiangya Hospital, Central South University, Changsha, China
Alzheimer’s disease (AD) is the most common cause of dementia with no effective therapies. Aging is a dominant risk factor for AD. The neurovascular unit (NVU) plays an important role in maintaining homeostasis of the brain microenvironment. The accelerated aging of NVU cells may directly impair NVU function and contribute to AD pathogenesis. However, the expression patterns of aging-related genes (AGs) in NVU cells of AD remain unclear. In this study, we performed single-nucleus transcriptome analysis of 61,768 nuclei from prefrontal cortical samples of patients with AD and normal control (NC) subjects. Eight main cell types were identified, including astrocytes, microglia, excitatory neurons, inhibitory neurons, oligodendrocytes, oligodendrocyte precursor cells, pericytes, and endothelial cells. Transcriptomic analysis identified the expression patterns of AGs in NVU cells of AD. Gene set enrichment analysis confirmed the key aging-associated cellular pathways enriched in microglia and oligodendrocytes. These aging-related transcriptomic changes in NVU were cross-validated using bulk transcriptome data. The least absolute shrinkage and selection operator regression method was used to select the crucial AGs most associated with AD: IGF1R, MXI1, RB1, PPARA, NFE2L2, STAT5B, FOS, PRKCD, YWHAZ, HTT, MAPK9, HSPA9, SDHC, PRKDC, and PDPK1. This 15-gene model performed well in discriminating AD from NC samples. Among them, IGF1R, MXI1, PPARA, YWHAZ, and MAPK9 strongly correlated with pathologic progression in AD, were identified as critical regulators of AD. Although most AGs showed similar trends of expression changes in different types of NVU cells in AD, certain AGs were expressed in a cell-specific manner. Our comprehensive analysis of brain NVU from patients with AD reveals previously unknown molecular changes associated with aging that may underlie the functional dysregulation of NVU, providing important insights for exploring potential cell-specific therapeutic targets to restore brain homeostasis in AD.
Introduction
Alzheimer’s disease (AD) is the most common form of dementia in the elderly population. Its pathological hallmarks include amyloid-beta (Aβ) plaques, neurofibrillary tangles, neuroinflammation, and loss of neurons and synapses (Fu et al., 2019). Despite a persistent search for the etiology and pathogenesis of AD, no effective treatment has been found, which may be partly due to our incomplete understanding of the molecular mechanism of cell type-specific responses underlying AD pathogenesis. A deeper investigation into cellular heterogeneity and cell type-specific responses might provide precise molecular and cellular targets for AD treatment.
The brain neurovascular unit (NVU), which includes neurons, glial cells, vascular cells, and pericytes, is an important functional unit involved in the maintenance of brain homeostasis through regulation of neurovascular coupling (Iadecola, 2017). The structure and function of NVU are profoundly impaired in AD (Iadecola, 2004; Zlokovic, 2011). In contrast to the neurocentric view, the neurovascular concept proposes that disintegration of NVU function may be a major cause of dementia in the elderly population, and also a culprit in AD (Zlokovic, 2008b). Neurovascular uncoupling can lead to blood brain barrier (BBB) leakage, vascular inflammation, cerebral hypoperfusion, and Aβ accumulation around cerebral vessels (Zlokovic, 2008a; Wilhelm et al., 2017; Armstead and Vavilala, 2019). The aging process, a progressive decline of internal physiological function over time, is a dominant risk factor for many chronic diseases, including AD. The effects of aging on NVU function are evident. First, significant evidence has been reported that aging can induce BBB dysfunction by altering molecular and signal transduction within the NVU (Montagne et al., 2015; Nelson et al., 2016). Age-dependent endothelial impairment is a major contributor to BBB dysfunction. Aging impairs the regenerative capacity of endothelial cells (ECs) (Lähteenvuo and Rosenzweig, 2012) and the endothelium-dependent regulation of vascular tone (Hu et al., 2017). Aging also enhances the sensitivity of ECs toward apoptotic stimuli, further contributing to the decrease in cell number (Shantsila et al., 2007). Moreover, brain ECs have robust intrinsic antioxidative defenses, which can be damaged by aging (Deli et al., 2005). Second, senescent microglia tend to transform from an anti-inflammatory M2 phenotype into an proinflammatory M1 phenotype (Lourbopoulos et al., 2015). The oxidation and nitration injury from the microglial proinflammatory response leads to a vicious cycle of continued microglial activation and oxidative neural injury (Zhan et al., 2005). Third, the function of other NVU cells, including neurons, astrocytes, and oligodendrocytes are also compromised with aging (Hu et al., 2017). Senescent cells acquire the ability to secrete a variety of cytokines, such as pro-inflammatory factors, metalloproteinases, and other proteins, known as senescence-associated secretory phenotype (SAPS) (Tchkonia et al., 2013). Senescent neural cells contribute to neuroinflammation by secreting large amounts of proinflammatory mediators during aging (Campisi, 2013), whereas, inflammation is a central factor affecting NVU function during aging (Wilhelm et al., 2017). The structure and function of NVU are influenced by aging; However, the expression characteristics of aging-related genes (AGs) and possible regulatory mechanisms of NVU dysfunction in AD remain unclear.
The Human Aging Genomic Resources (HAGR) is a database specifically addressing aging-related changes that has revealed a set of AGs via systemic analysis of the biology and genetics of the human aging process (de Magalhães et al., 2005). To comprehensively investigate the aging-related transcriptomic changes and dysregulated molecular pathways in each NVU cell type in AD, we performed single-nucleus RNA-sequencing (snRNA-seq) analysis of the AD and normal control (NC) brain samples. These aging-related changes in NVU were further validated in AD brain tissue using microarray data. To identify the AGs that were most associated with AD, we fitted a least absolute shrinkage and selection operator (LASSO) regression model for feature selection. A 15-gene-based model was constructed and tested in a test set and a validation set. We next analyzed the expression levels of these selected AGs in patients with different Braak stages and plaque scores to identify critical regulators of AD. Finally, we analyzed the cell type-specific expression of these key genes. The advent of snRNA-seq techniques contributes to more comprehensive knowledge about the alterations in NVU. In-depth investigation of the cell type-specific molecular alterations in the AD brain might provide precise cellular targets for AD therapeutic development.
Materials and methods
Single-nucleus RNA sequencing data acquisition and processing
The Gene Expression Omnibus (GEO) is a public genomics dataset repository collecting chips, microarrays and high-throughput sequencing data (Edgar et al., 2002). The snRNA-seq data of a total of 61,768 cells of 11 AD samples and seven normal control samples, accession number GSE174367 (Morabito et al., 2021), were downloaded from the GEO database. The snRNA-seq data were analyzed using the “Seurat” R package (Stuart et al., 2019). To exclude potential low quality cells, nuclei with ≤200 genes, ≥6,000 genes, or ≥15% mitochondrial genes were filtered out, as described in previous snRNA-seq studies (Jäkel et al., 2019; Morabito et al., 2021). A total of 60,766 nuclei were retained after filtration. The filtered matrix was normalized using the “NormalizeData” method. Then, we identified the top 2,000 highly variable genes (HVGs) for each sample using the “FindVariableFeatures” function with the “vst” method. Genes with the highest variance were used to perform principal components analysis (PCA), and the number of principal components used in downstream analyses was chosen using the “Elbowplot.” Twenty principal components (PCs) were used for the uniform manifold approximation and projection (UMAP) analysis. Cells were clustered into 25 clusters, with resolution set at 0.5, using the functions “FindNeighbors” and “FindClusters.” Differentially expressed genes (DEGs) for each cluster were identified using the function “FindAllMarkers” with the parameters test.use = wilcox and logfc.threshold = 0.25. The identification of cell type was based on the DEGs in each cluster and classical cell markers as previously reported (Lau et al., 2020). To define the cell type-specific transcriptomic changes in AD, we compared the transcriptome profiles of each cell type between NC and AD samples using the “FindMarkers” function. Significance was set at a p-value < 0.05 and a | log2 Fold Change(FC)| > 0.1. We visualized the data using Seurat’s Doheatmap or DotPlot function where appropriate.
Bulk transcriptome data acquisition and processing
Four microarray datasets (GSE48350, GSE122063, GSE106241, and GSE29378) of AD were obtained from the GEO database of National Center for Biotechnology Information (NCBI). Data for 80 AD patients and 173 control samples from GSE48350, 56 AD patients and 44 healthy controls from GSE122063, 31 AD patients and 32 controls from GSE29378, and 60 AD cases with multiple clinical information about AD severity from GSE106241 were analyzed in this study. All datasets enrolled in the study are listed in Table 1. For microarray data processing, DEGs between AD and NC brain tissues were identified by the “limma” R package (Ritchie et al., 2015), with screening criteria of adjusted p-value < 0.05 and | log2 FC| > 0.1. DEG volcano plot was depicted using the “EnhancedVolcano” R packages.
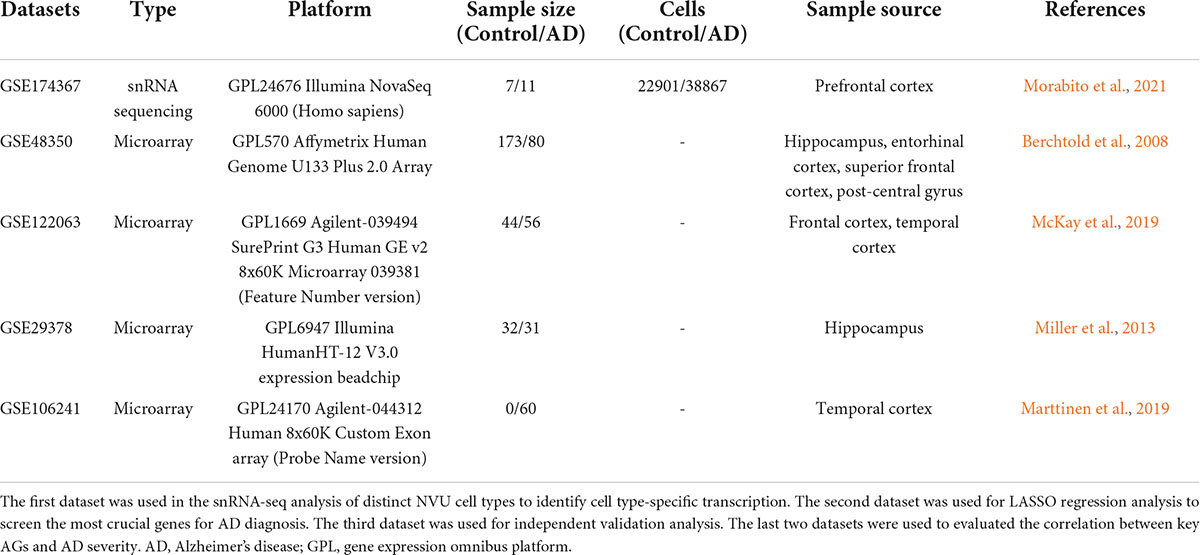
Table 1. The enrolled datasets in the study.
Pathway and functional enrichment analysis
We performed gene set enrichment analysis (GSEA) to explore the potential pathways involved in AD pathological processes, and the significant gene sets were defined as those with a normalized enrichment score (NES) > 1 and p < 0.05 (Subramanian et al., 2005). Gene Ontology (GO) and Kyoto Encyclopedia of Genes and Genomes (KEGG) enrichment analyses of DEGs were performed to analyze their overall functions, with q-value < 0.05 considered significant for screening of significant GO and KEGG pathways (Kanehisa et al., 2016; Consortium, 2019). The functional enrichment analyses were performed using R package “ReactomeRA” and “clusterProfiler” (Yu et al., 2012; Yu and He, 2016).
Cross-study validation of aging-related changes with bulk transcriptome data
Human aging genomic resources provide databases associated with the study of aging. A total of 307 human AGs were acquired from the HAGR dataset1 (Tacutu et al., 2018; Supplementary Table 1). We overlapped differentially expressed aging-related genes (DEAGs) in NVU cells (from the snRNA-seq dataset GSE174367) with those from brain tissues between AD and NC (from the microarray dataset GSE48350). The Venn diagram was used to depict the overlap between DEG transcripts.
Construction and validation of the least absolute shrinkage and selection operator cox regression model
We performed LASSO regression (Simon et al., 2011), a method designed for variable selection and shrinkage, to identify the AGs most associated with AD. The samples from GSE48350 were randomly assigned to the training set (70%) or test set (30%). The overlapped DEAGs were extracted and fit into the LASSO regression model by the “glmnet” package. To assess the ability of key AGs to differentiate between AD and NC, receiver operating characteristic (ROC) analysis was completed using the “ROCR” package in the test and external validation sets (GSE122063). Models with an area under the curve (AUC) value greater than 0.7 were considered to be good classifier models.
Correlation of aging-related genes expression levels with Alzheimer’s disease severity
We next assessed the expression levels of the important AGs in NVU cells. We validated the AG expressions in different Braak stages using the brain samples in the dataset GSE106241. We also compared the expression levels of AGs in patients with different plaque scores in the dataset GSE29378. Differences between the two groups were compared using the two-tailed unpaired t-test. The boxplots were created using the R package “ggplot2.”
Results
Single-nucleus transcriptome profiling of neurovascular unit cells in Alzheimer’s disease
To investigate the cell-specific transcriptional features in the brain of patients with AD, we analyzed the single-nucleus transcriptome data of 18 prefrontal cortex tissue samples from patients with AD (n = 11) and NC subjects (n = 7). A total of 60,766 nuclei were retained after quality control filtration, comprising 38,179 nuclei from AD patients and 22,587 from NC. The expression characteristics of each sample are shown in Figure 1A. After 2,000 HVGs were identified (Figure 1B), PCA was performed, and the top 20 PCs were used for clustering (Figure 1C). The UMAP plot was used to visualize the data in a two-dimensional subspace, identifying 25 cell clusters with highly consistent expression patterns across individuals (C0-C24) (Figure 1D). We categorized these cell clusters into eight major cell types according to their respective transcriptional signatures and cell-type markers reported in previous literature: astrocytes, microglia, oligodendrocytes, oligodendrocyte precursor cells (OPCs), excitatory neurons, inhibitory neurons, ECs, and pericytes (Figure 1E). The expression of cell-type markers is exhibited in Figure 1F. The identified marker genes of astrocytes (AQP4, SLC1A2, GFAP), microglia (C3, CSF1R, ITGAM), oligodendrocytes (PLP1, ST18, MBP), OPCs (TNR, NEU4, GPR17), excitatory neurons (CAMK2A, LDB2, NRGN), inhibitory neurons (GAD1, GAD2), ECs (VWF, CD34, PECAM1), and pericytes (DCN, ACTA2) were cell type-specific and in accordance with classic markers for each cell population (Lau et al., 2020; Srinivasan et al., 2020). The cell-type proportion is comparable to those reported in previous snRNA-seq studies of the brain (Morabito et al., 2021).
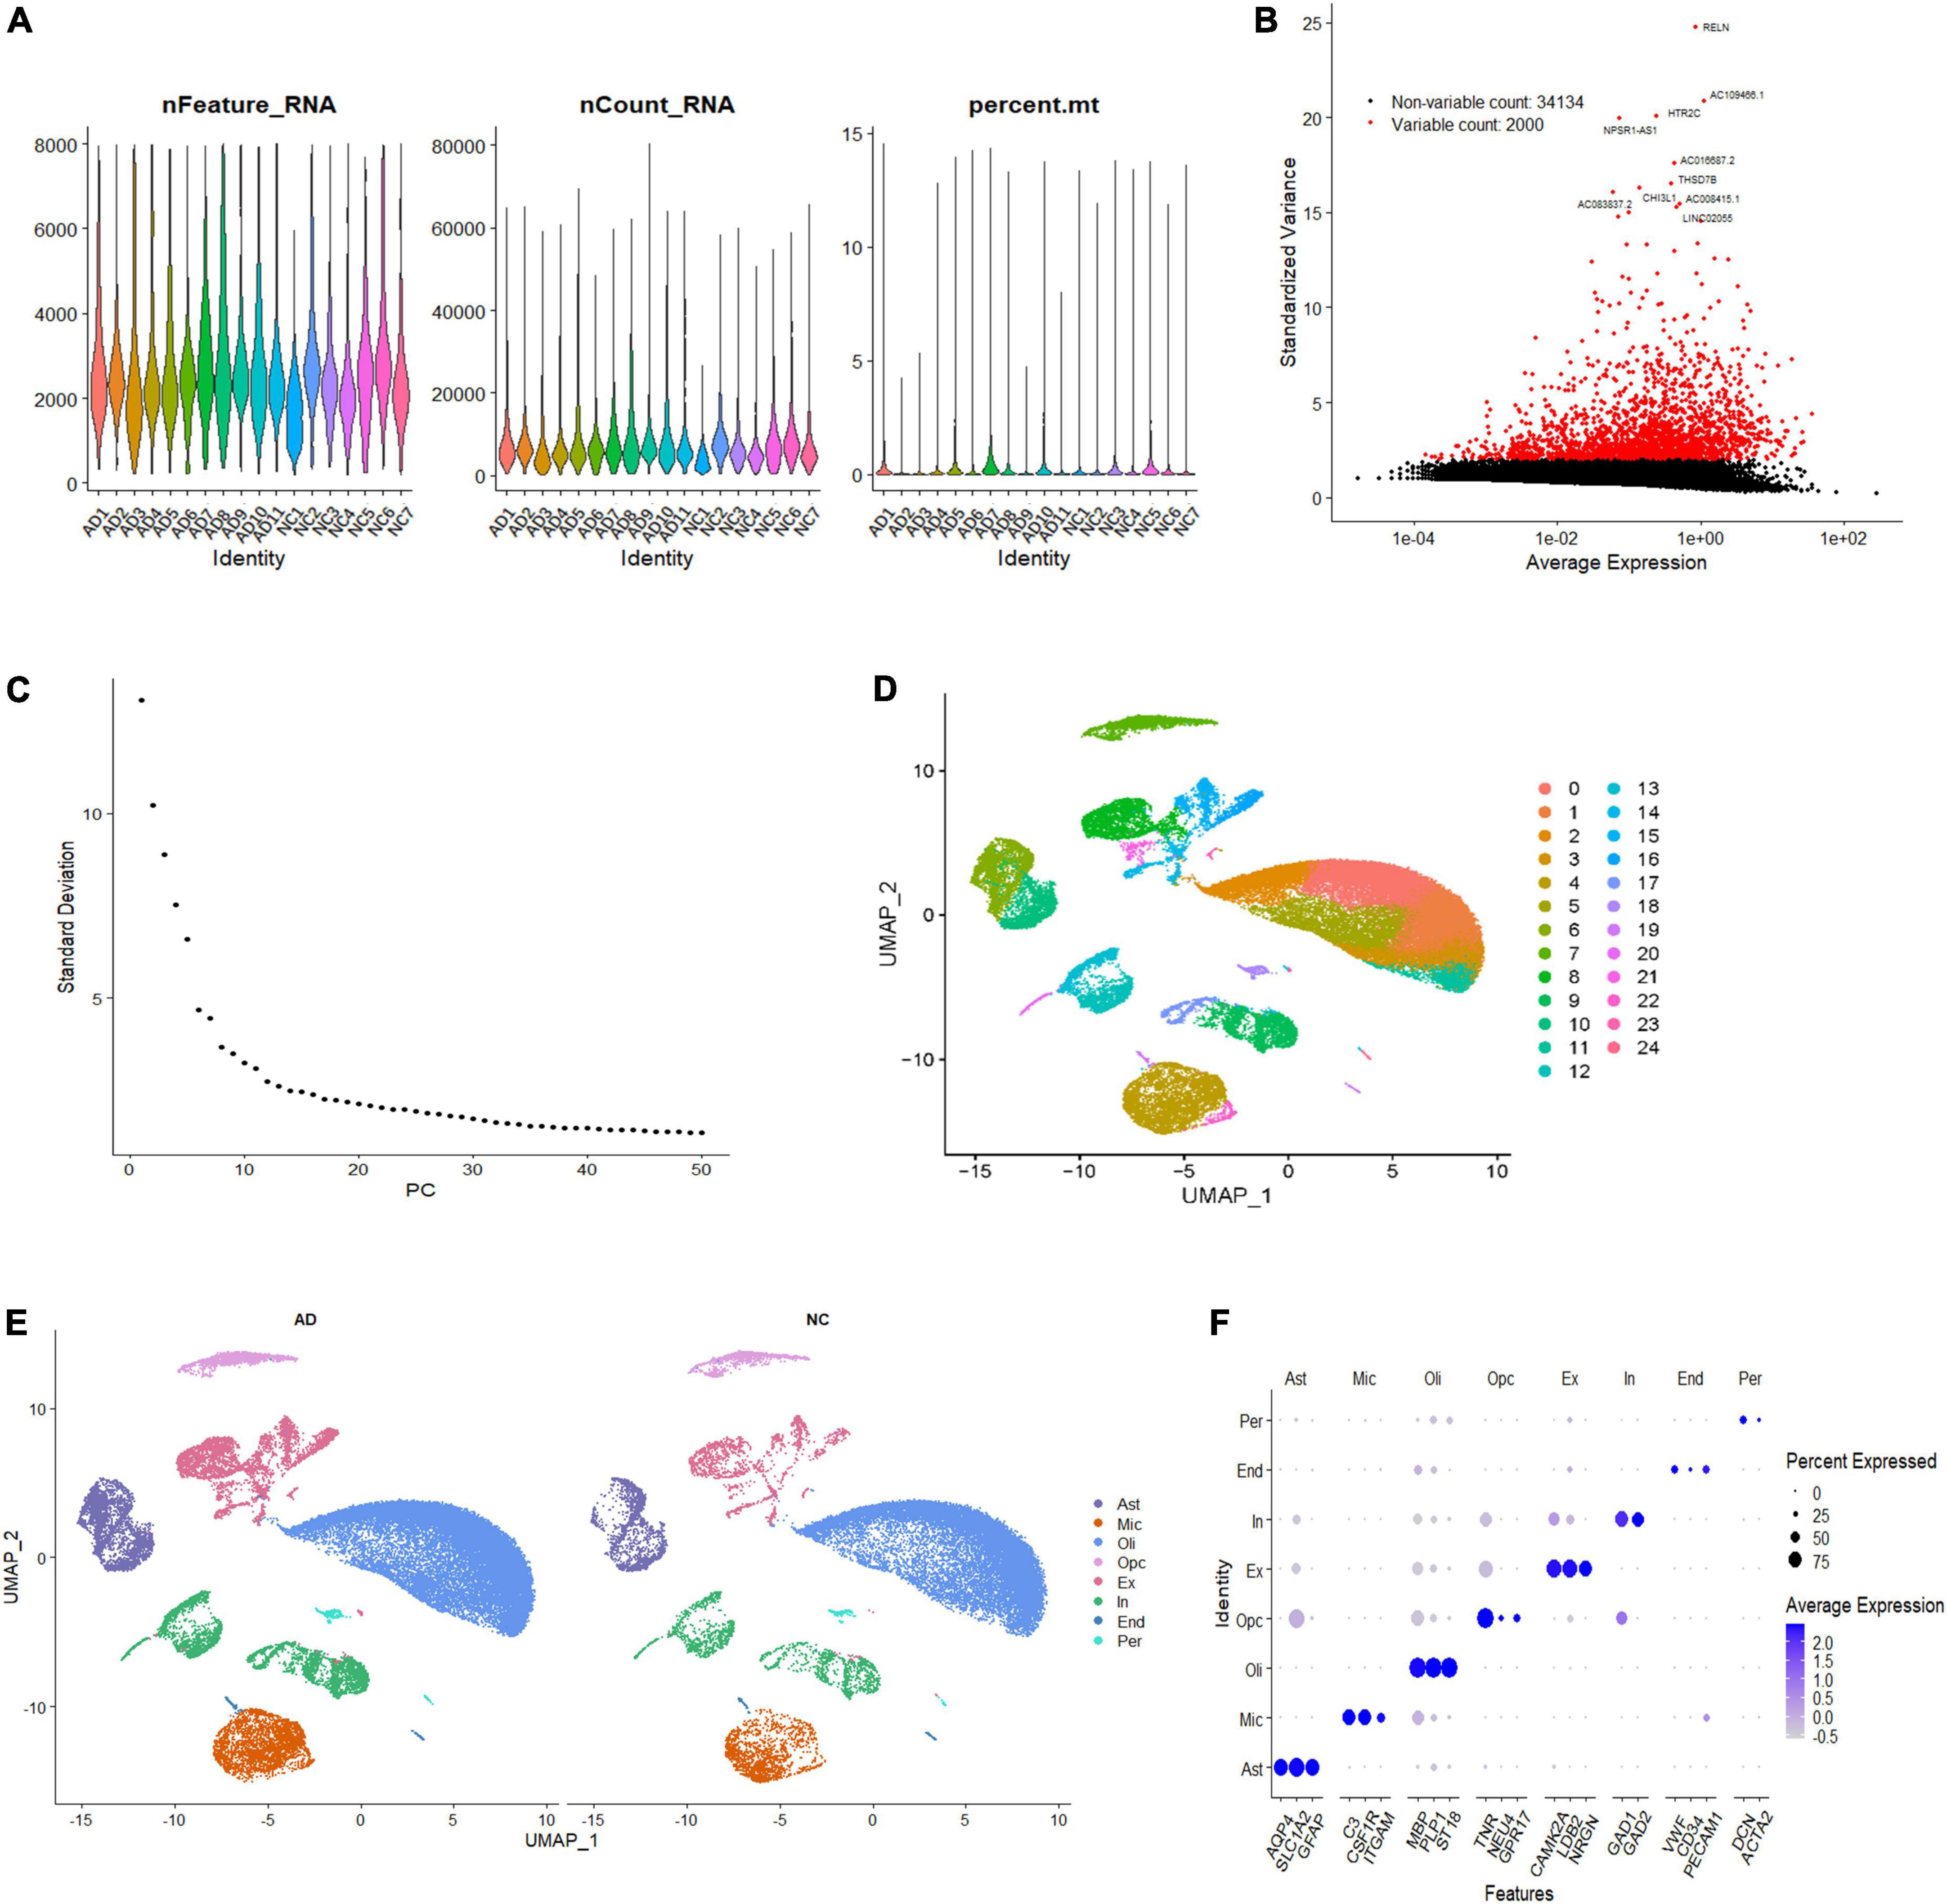
Figure 1. Single-nucleus transcriptome analysis of the human AD prefrontal cortex. (A) The gene features, counts, and mitochondrial gene percentage of each sample. (B) HVGs were identified and colored in red, and the top ten HVGs were labeled. (C) PC selection using Elbowplot function. (D) UMAP plot analysis showing 25 major cell clusters based on gene expression profile. (E) UMAP projection of overall cell types of AD and NC samples, respectively. Different cell types were colored with unique colors. (F) Dot plot of marker gene expression of each cell type. The dot size represents the percentage of cells expressing selected genes, and the dot color represents average expression. AD, Alzheimer’s disease; Ast, astrocyte; End, endothelial cell; Ex, excitatory neuron; HVGs, highly variable genes; In, inhibitory neuron; Mic, microglia; NC, normal control; Oli, oligodendrocyte; Opc, oligodendrocyte progenitor cell; PC, primary component; Per, pericyte; UMAP, uniform manifold approximation and projection.
Single-nucleus RNA-sequencing reveals the heterogeneity of the aging-associated transcriptome and dysregulated molecular pathways in Alzheimer’s disease
Following initial cell-type characterization, we compared the individual cell-type transcriptional profile between AD and NC samples separately. Between the AD and NC brain samples, we found the following number of DEGs per cell type: astrocytes (n = 1,908), microglia (n = 1,753), oligodendrocytes (n = 1,128), OPCs (n = 1,186), ECs (n = 493), excitatory neuron (n = 1,152), inhibitory neurons (n = 683), and pericytes (n = 2,110) (Figure 2A and Supplementary Table 2). The changes in molecular phenotypes might help to explain the functional alterations in individual cell types; thus, we performed GSEA analysis to investigate the potential biological roles of the DEGs in each NVU cell type. In GSEA analysis, we observed DEGs in microglia and oligodendrocytes partly enriched in cellular senescence-related pathways. Specifically, the GO gene sets analyzed by GSEA revealed that the biological processes (BP) associated with DEGs includes aging, regulation of cell aging, and cell aging processes (Figures 2B–D). For KEGG pathway analysis, dysregulated genes were mainly enriched in the cellular senescence pathway (Figure 2E). The complete results of GSEA analysis can be found in Supplementary Table 3.
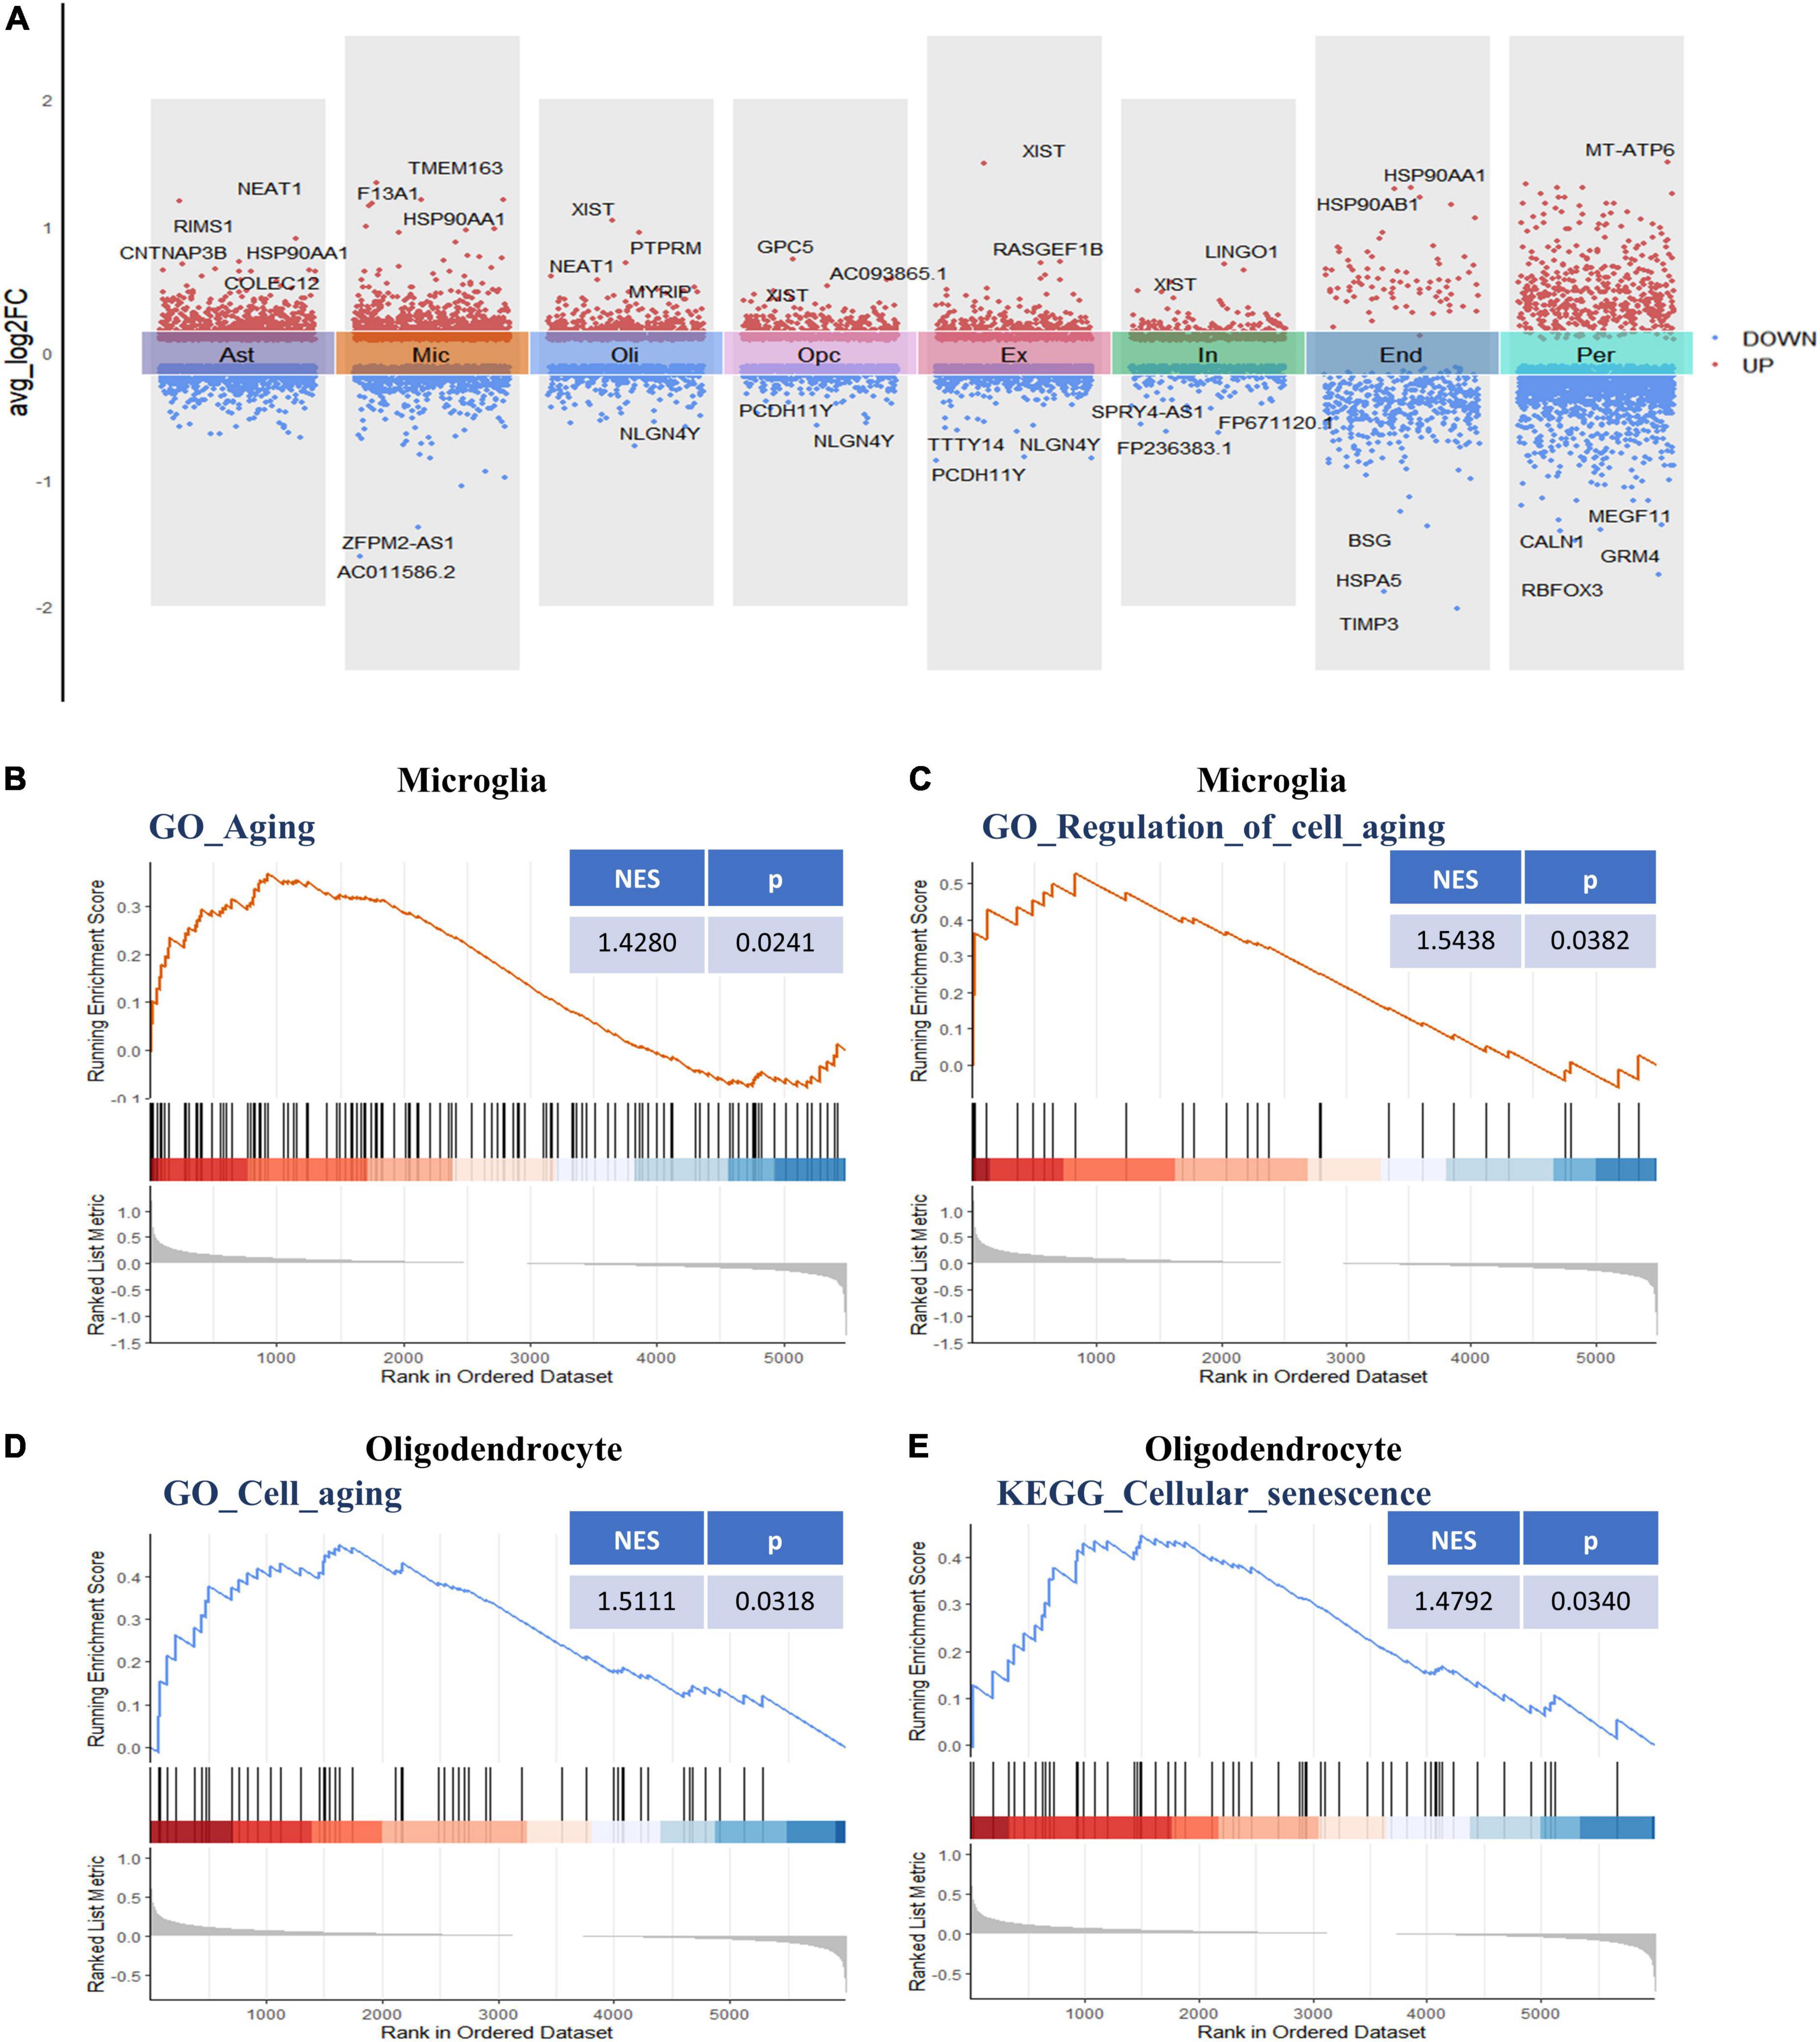
Figure 2. Differential gene expression and gene set enrichment analysis. (A) Differential gene expression analysis showing up- and downregulated genes across all the eight cell types (p < 0.05, |log2 FC| > 0.1). Red dots represent upregulated genes, and blue dots represent downregulated genes. The colored bars represent different cell types. (B) GSEA enrichment plot of the “GO-BP: Aging (GO: 0007568)” gene set in microglia. (C) GSEA enrichment plot of the “GO-BP: Regulation of cell aging (GO: 0090342)” gene set in microglia. (D) GSEA enrichment plot of the “GO-BP: Cell aging (GO: 0007569)” gene set in oligodendrocytes. (E) GSEA enrichment plot of the “KEGG: Cellular senescence (hsa04218)” gene set in oligodendrocytes. BP, biological process; GO, gene ontology; GSEA, gene set enrichment analysis; KEGG, Kyoto encyclopedia of genes and genomes.
The functional changes of NVU in AD may be in part attributable to the expression alterations in AGs. A total of 307 human AGs were obtained from HAGR (Supplementary Table 1). To acquire the DEAGs in each NVU cell type, we overlapped the DEGs in different NVU cell types with the AGs, respectively. The number of filtered DEAGs per cell type were as follows: astrocytes (n = 39), microglia (n = 46), oligodendrocytes (n = 27), OPCs (n = 27), excitatory neurons (n = 36), inhibitory neurons (n = 13), ECs (n = 16), and pericytes (n = 42) (Figures 3A,B and Supplementary Table 4). Of interest was that most DEAGs in the NVU cells were found to be simultaneously up- or downregulated. Notably, the DEAGs among different cell types varied significantly. Detailed information about the intersections of DEAGs among different NVU cell types was visualized using an UpSet plot (Figure 3C). In particular, we found that none of the DEAGs were existed in all NVU cell types, and only one common DEAG was present in seven of the eight cell types (except for ECs), indicating that different cell types are heterogeneously affected by aging. Aging-related transcriptomic changes in NVU are cell type-specific, thus it is necessary to disclose the role of AGs in AD pathogenesis at the single cell level. While the snRNA-seq analysis would enable us to identify the target cell types, we sought to additionally identify the potential target genes for AD.
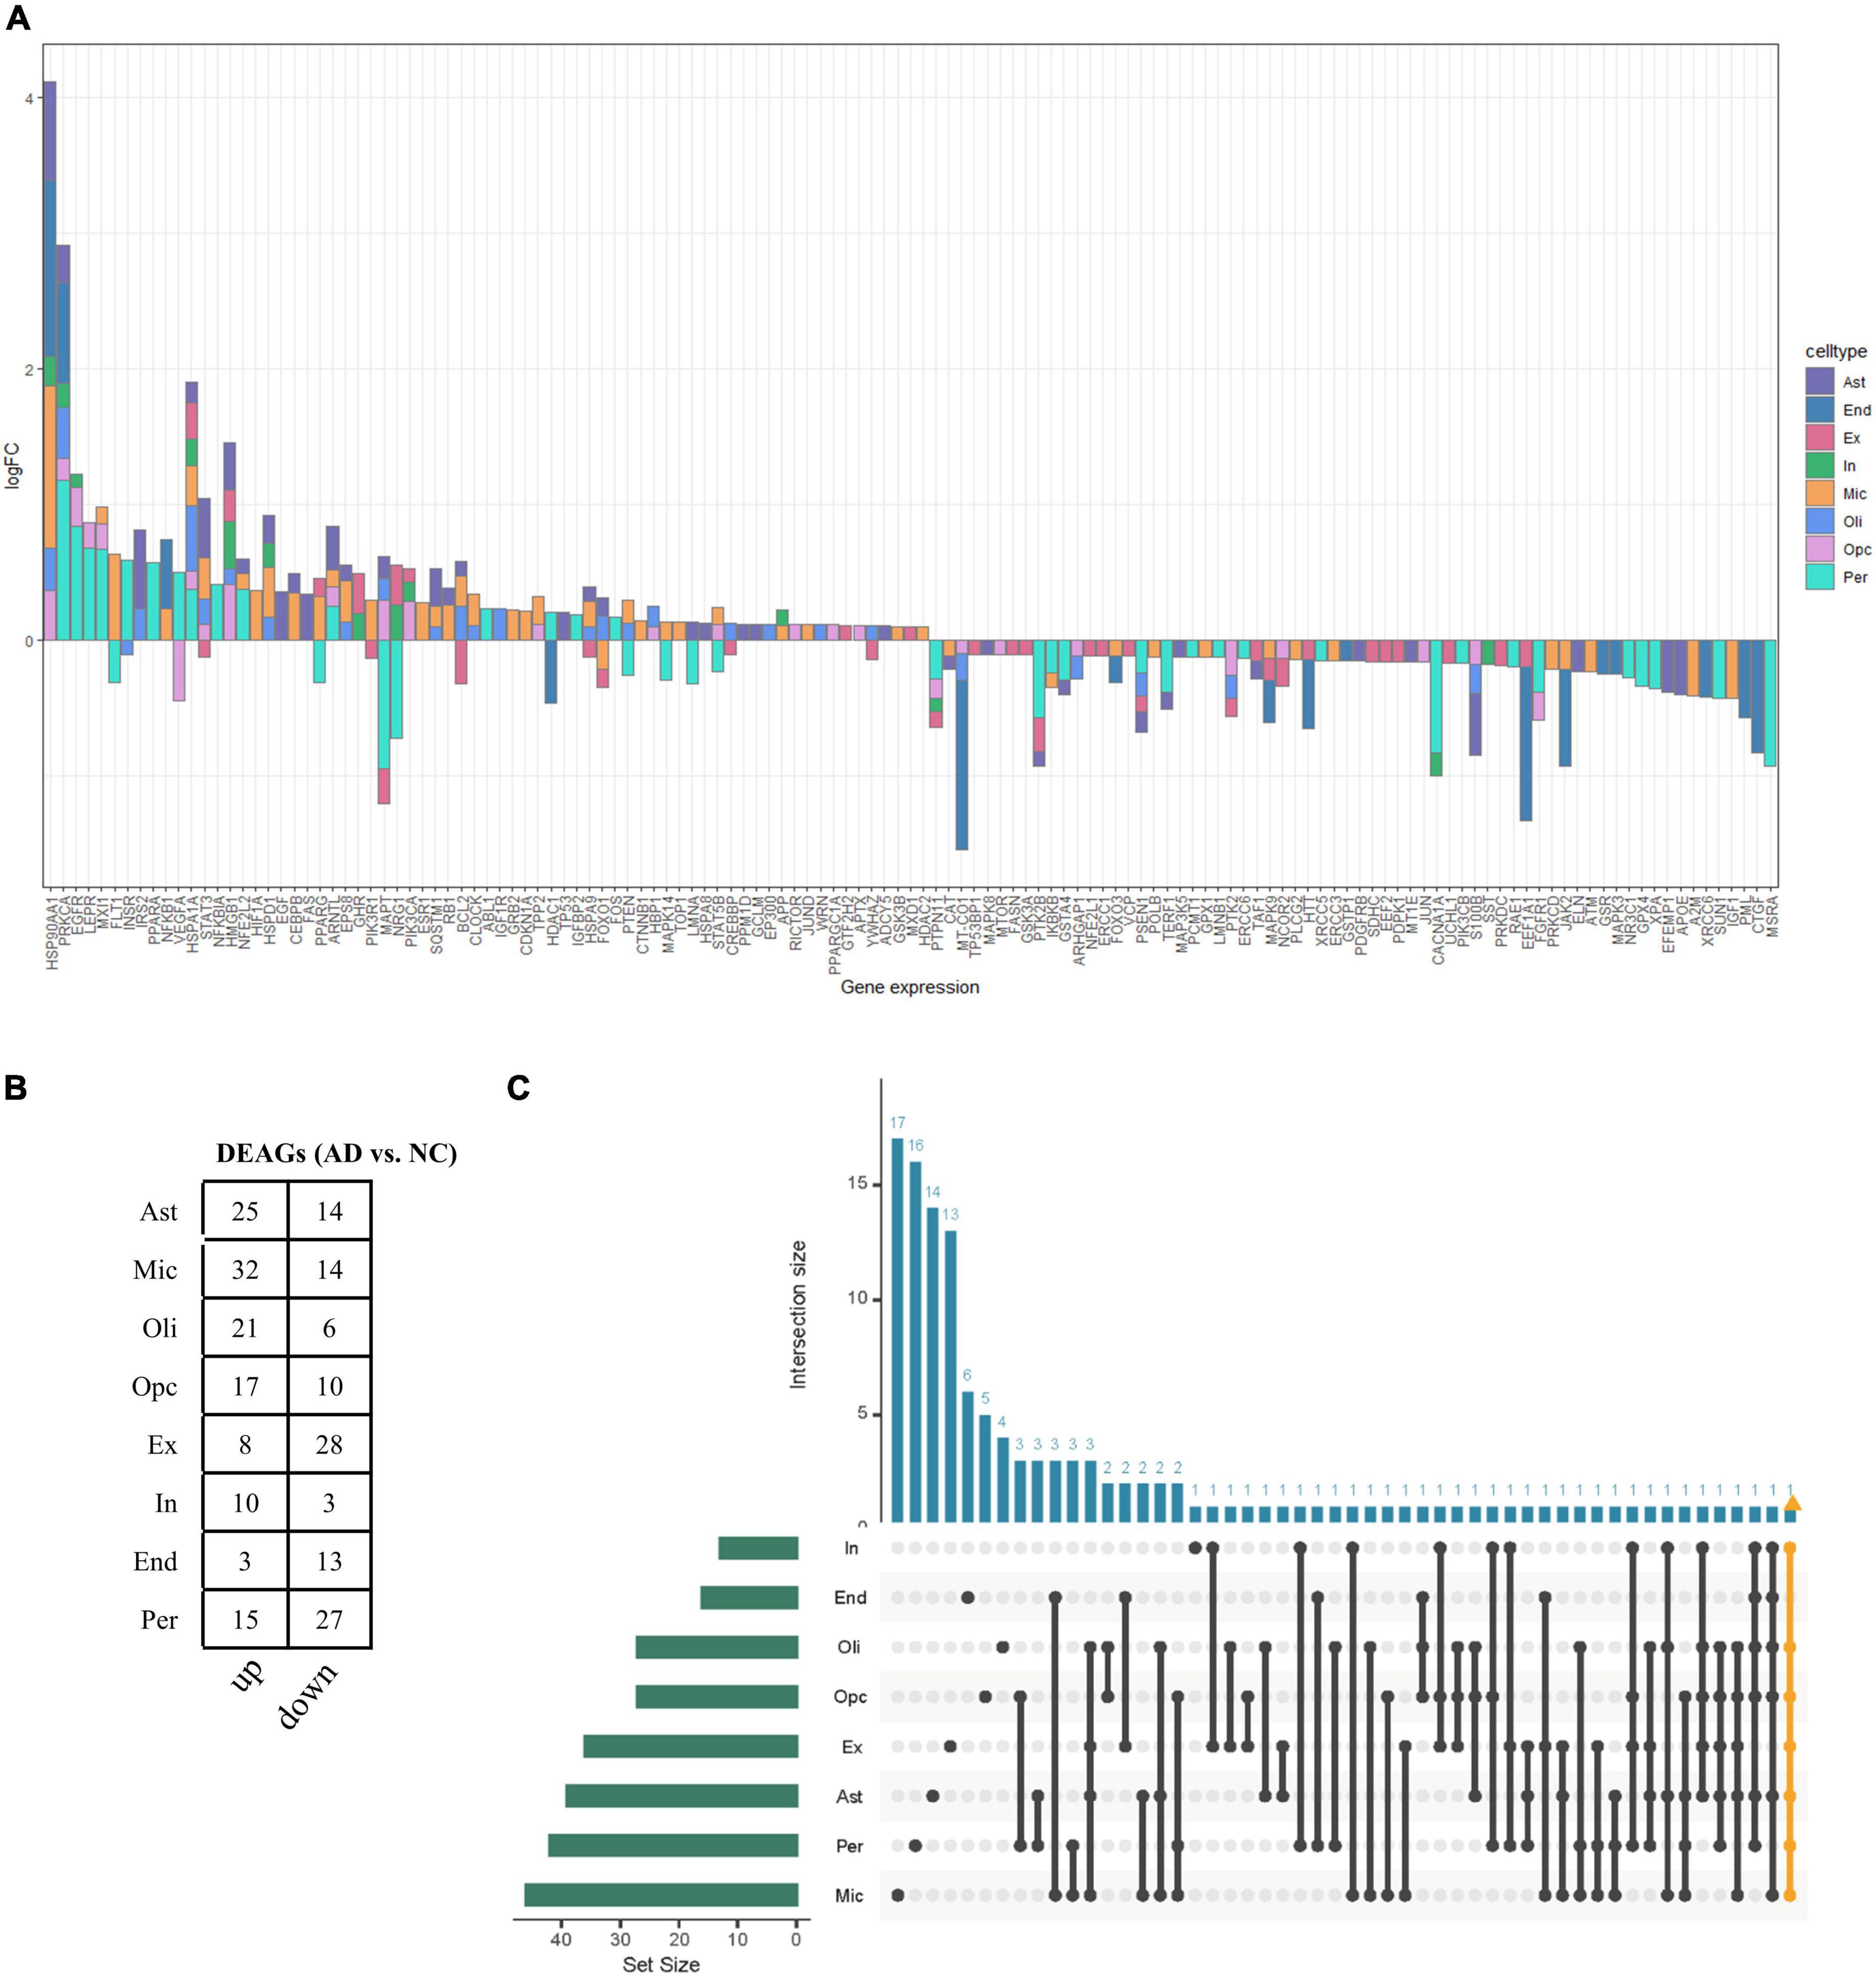
Figure 3. Aging-associated transcriptomic changes in NVU cells. (A) Consensus DEAGs upregulated (positive log2 FC) or suppressed (negative log2 FC) in NVU cells (p < 0.05, | log2 FC| > 0.1). (B) Numbers of DEAGs between AD and NC samples within each cell type. Down: downregulated; up: upregulated. (C) UpSet plot depicting the number of overlap DEAGs across all eight cell types. Also shown are the numbers of DEAGs specific to each cell type. AD, Alzheimer’s disease; Ast, astrocyte; DEAGs, differentially expressed aging-related genes; End, endothelial cell; Ex, excitatory neuron; FC, fold change; In, inhibitory neuron; Mic, microglia; NC, normal control; Oli, oligodendrocyte; Opc, oligodendrocyte progenitor cell; Per, pericyte.
Identification of key aging-related genes in Alzheimer’s disease using the least absolute shrinkage and selection operator cox regression model
Bulk transcriptome analysis is helpful for collecting key information about cell populations and screening features genes. To validate the aging-associated transcriptomic changes in NVU of AD detailed above, we compared our results with the bulk transcriptome dataset GSE48350. A total of 90 DEAGs, including 39 upregulated genes and 51 downregulated genes, were obtained based on an adjusted p-value < 0.05 and | log2 Fold Change| > 0.1 (Supplementary Table 5). The DEAGs were visualized using the volcano plot (Figure 4A). GO and KEGG were performed to depict the biological processes and molecular pathways of the DEAGs. These genes were significantly enriched in cellular senescence, longevity regulating pathway, and apoptosis pathway (Figures 4B,C and Supplementary Table 6). Among the 153 DEAGs identified in our snRNA-seq analysis, 37 DEAGs in the brain cortex microarray data exhibited concordant changes in expression levels (Figure 4D and Supplementary Table 7), of which 16 genes were upregulated, and 21 genes were downregulated.
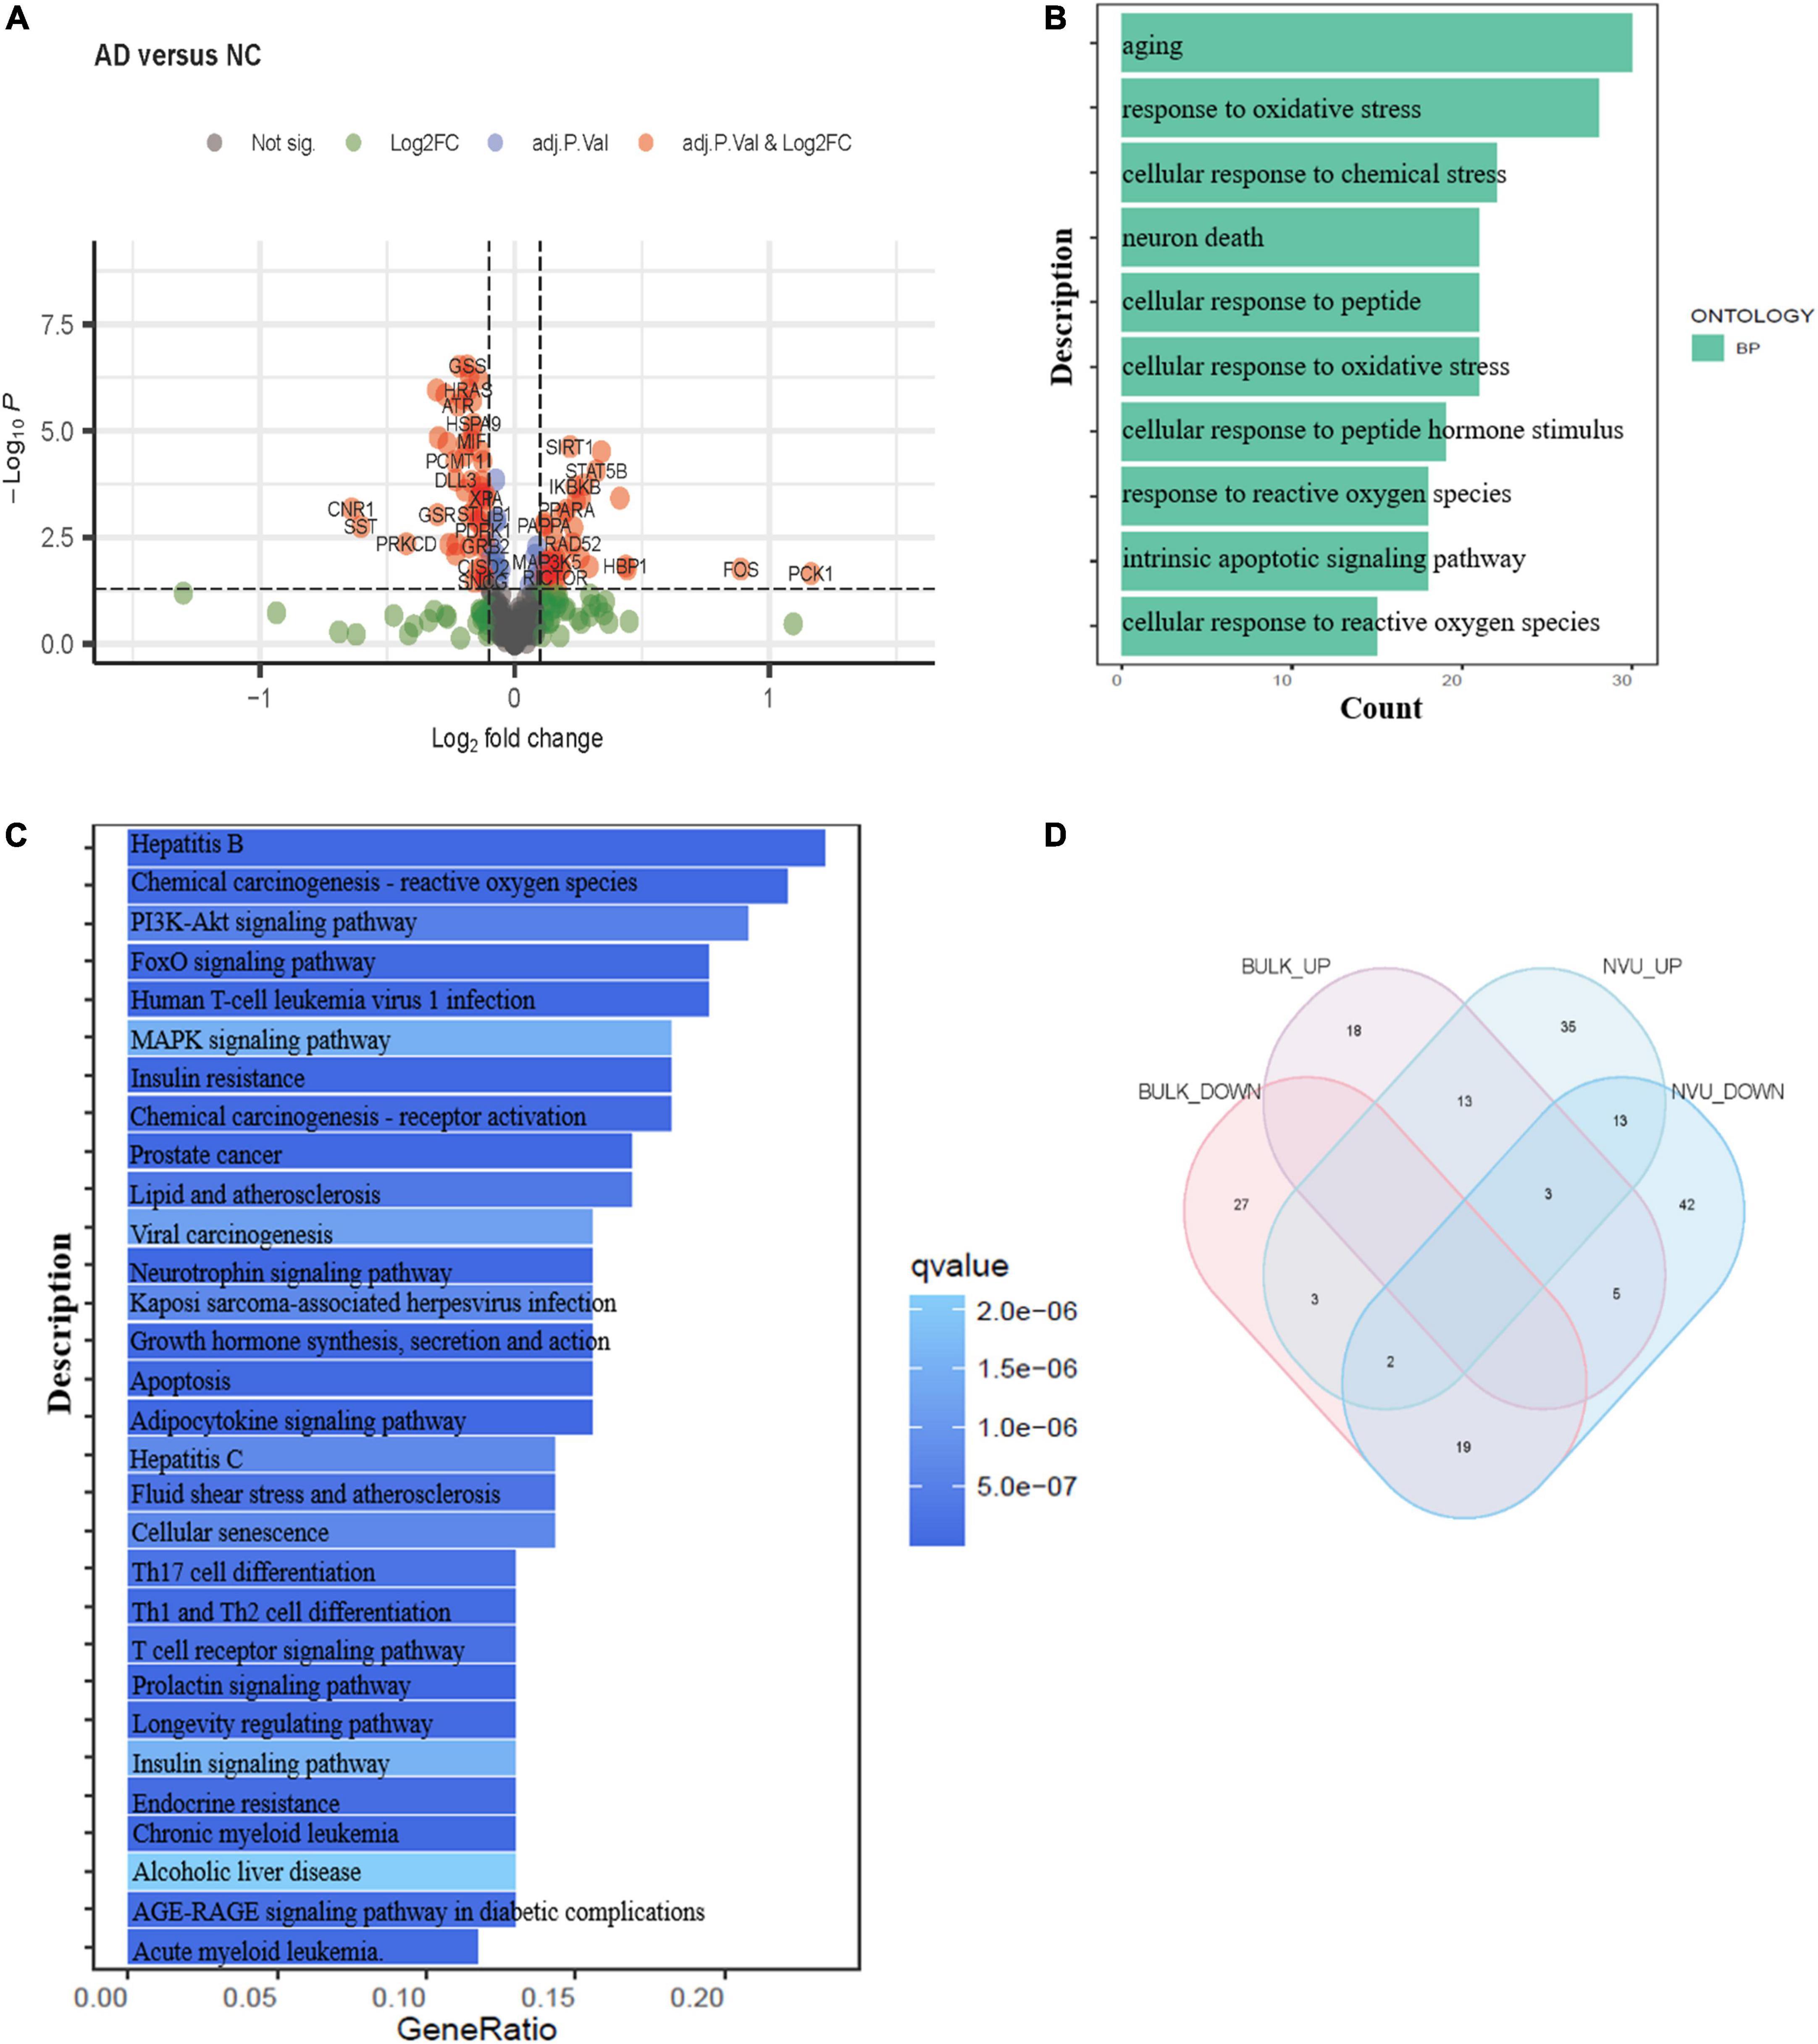
Figure 4. Validation of the aging-related transcriptomic changes in the AD brain based on data from a microarray study. (A) The volcano plot of DEAGs in GSE48350 (adjusted p-value < 0.05 and | log2 FC| > 0.1). (B) The GO analysis of DEAGs in GSE48350. (C) The KEGG pathway analysis of DEAGs in GSE48350. (D) Veen plot showed the common downregulated DEAGs and common upregulated DEAGs between NVU cells (from snRNA-seq dataset: GSE174367) and brain tissues (from bulk transcriptome dataset: GSE48350). A total of 37 common DEAGs were found, including 16 upregulated genes and 21 downregulated genes. AD, Alzheimer’s disease; DEAGs, differentially expressed aging-related genes; GO, gene ontology; KEGG, Kyoto encyclopedia of genes and genomes; NVU, neurovascular unit.
To identify the AGs most associated with AD, the 37 DEAGs were entered into a LASSO logistic regression model. We separated all samples in GSE48350 (80 AD and 173 NC samples) into training and test sets. Fifteen potential predictors in the training set were identified to construct a model to calculate the risk score in the LASSO logistic regression (Figure 5A). The coefficient values and information of the 15 genes are displayed in Table 2. We calculated a risk score for each patient based on the expression of the 15 genes using the LASSO regression model:
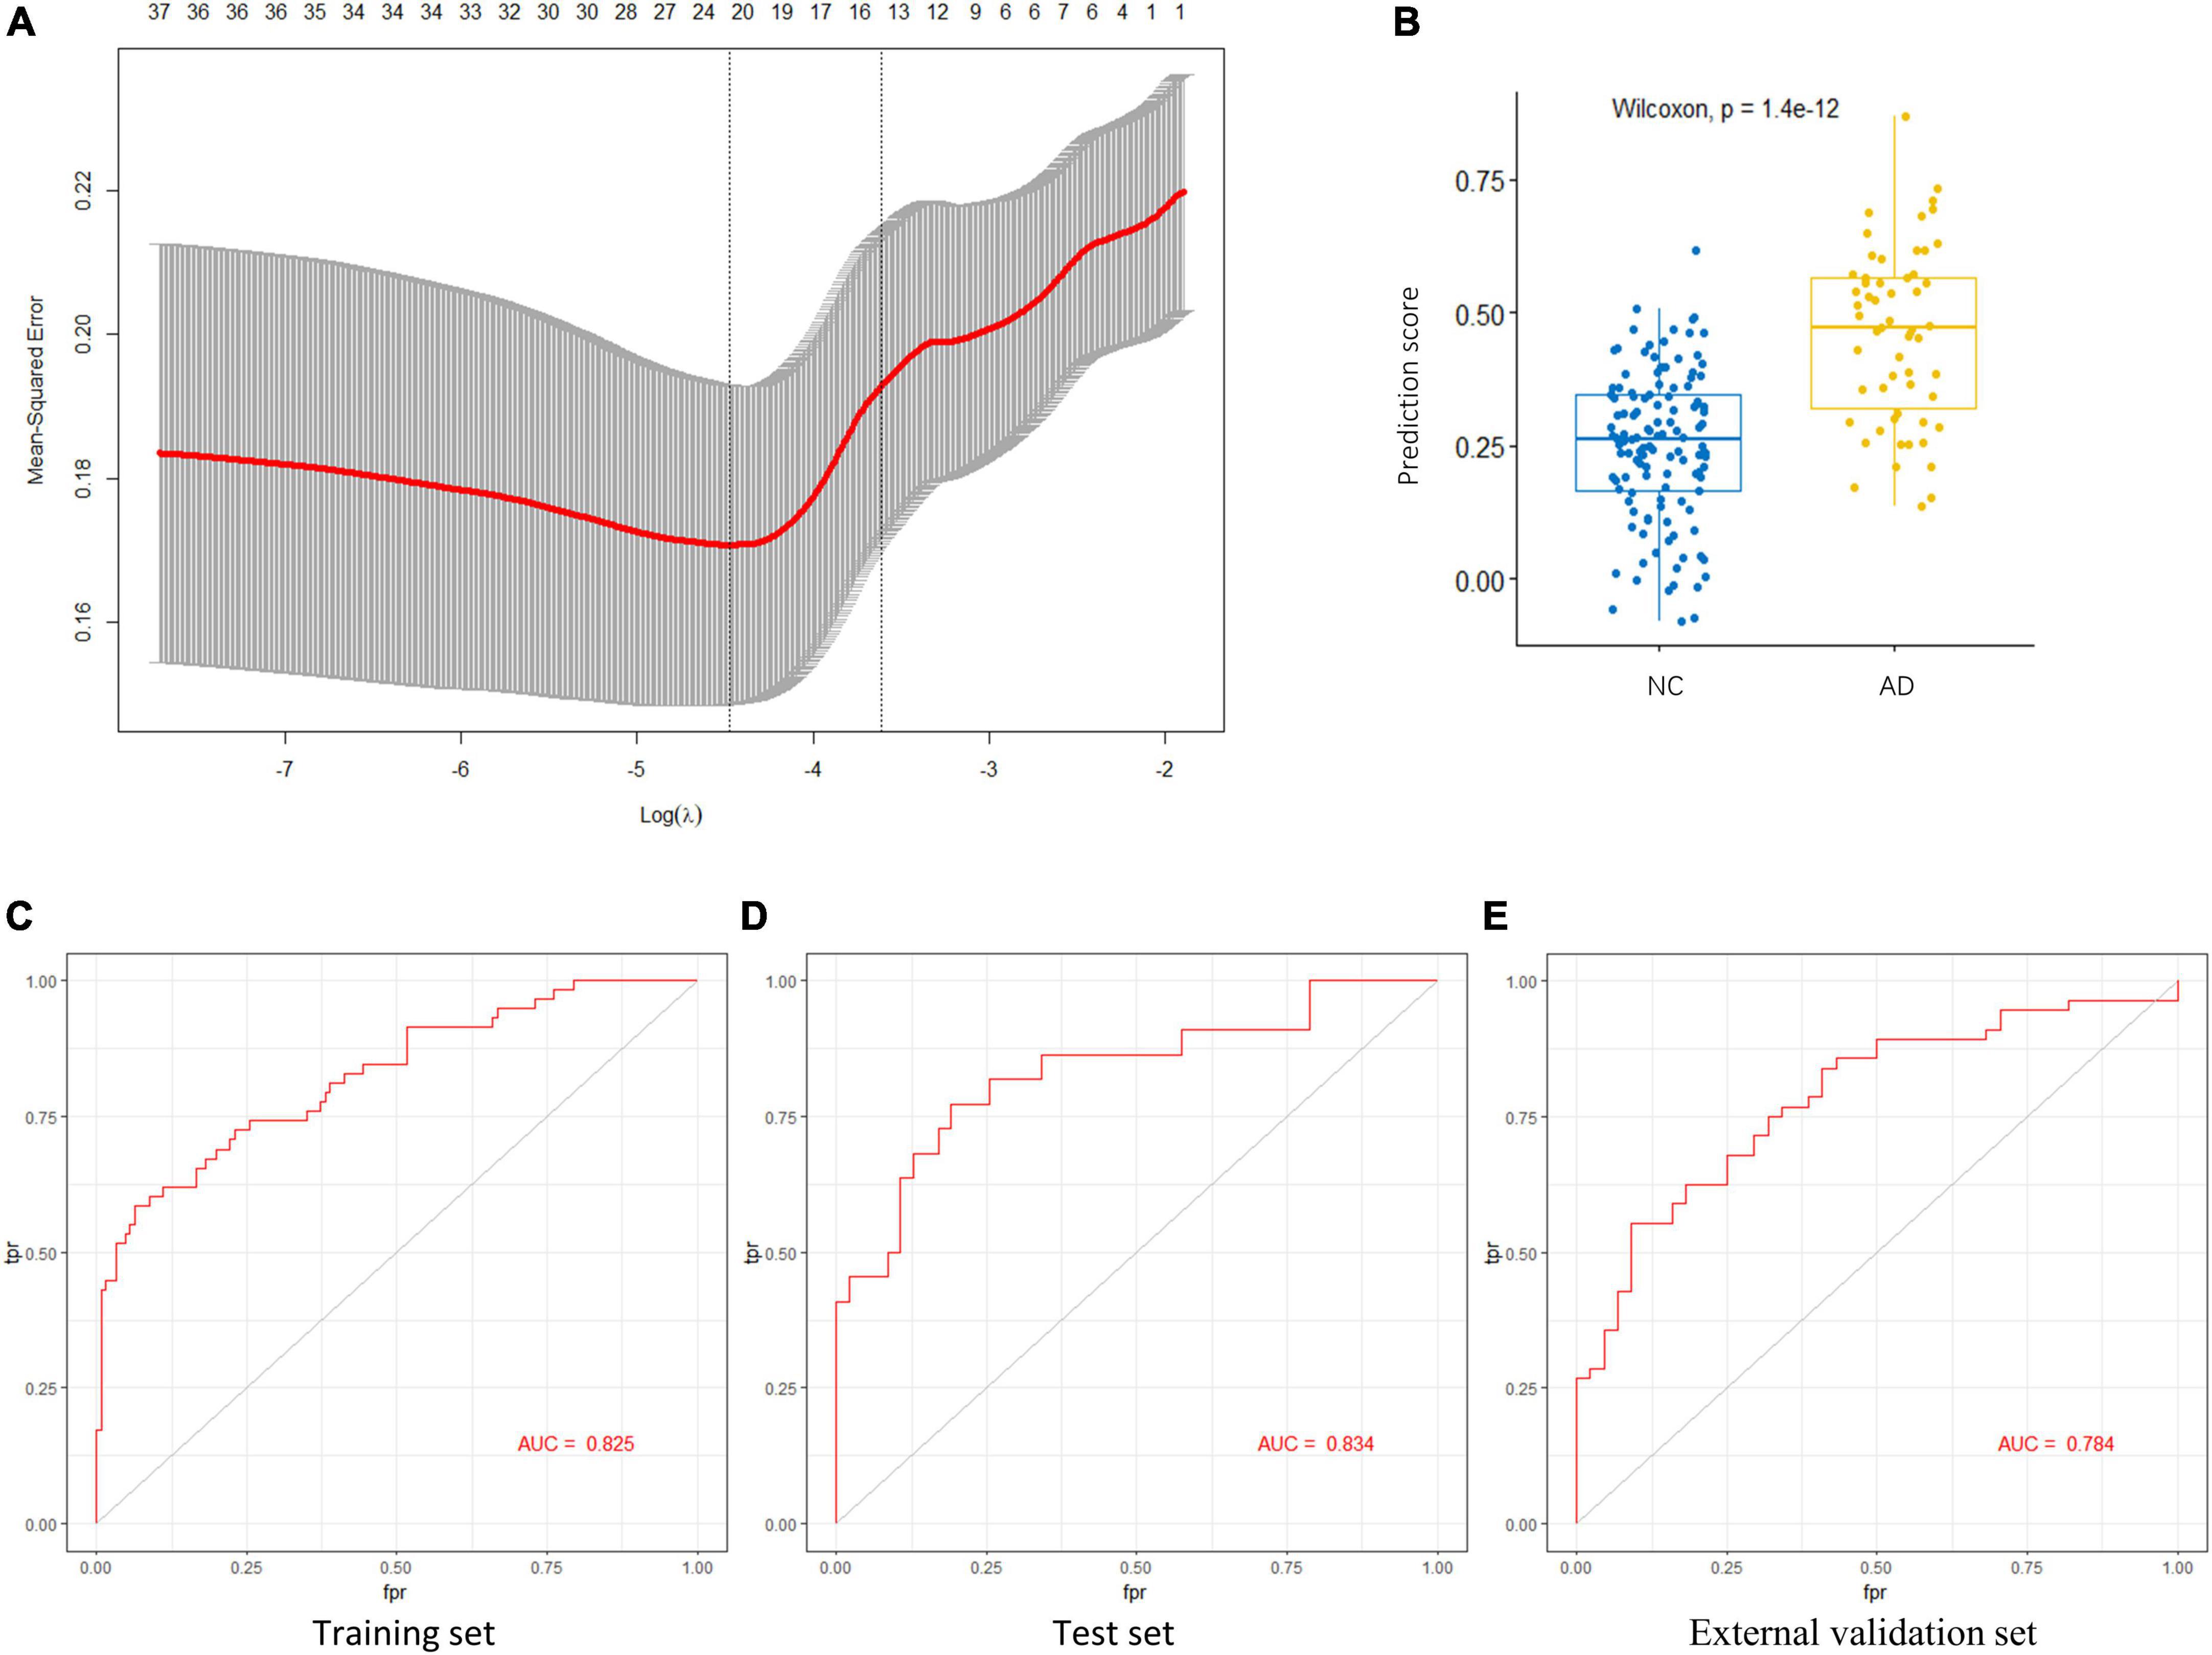
Figure 5. Key AGs selection through the LASSO model. (A) The selection of the best lambda in the LASSO model. (B) Boxplot used to assess the performance of the prediction model. (C) The AUC was 0.825 in training set. (D) The AUC was 0.834 in test set. (E) The AUC was 0.784 in validation set GSE122063. AG, aging-related gene; AUC, area under the curve; LASSO, least absolute shrinkage and selection operator.

Table 2. The 15 genes associated with the risk model in Alzheimer’s disease (AD).
The LASSO regression model based on the 15 AGs could efficiently distinguish patients with AD from NC subjects (p < 1.4e-12, Wilcoxon test) (Figure 5B). The AUC for the ROC curve of the model was 0.825 in the training set (Figure 5C) and 0.834 in the test set (Figure 5D). Subsequently, we evaluated the ability of the LASSO regression model to distinguish between AD and NC samples in the external validation set, and the AUC of the model was 0.784 (Figure 5E). These results demonstrate that our 15-gene-based model displays a relatively good capacity to classify AD and NC samples.
Validation of aging-associated transcriptomic changes in multiple cortical regions
Subsequently, we validated the expression of the 15 key AGs across multiple brain regions (in GSE48350). Among the 15 AGs identified before, 11 genes were differentially expressed in the superior frontal cortex (AD: n = 21, NC: n = 48), 9 in the hippocampus (AD: n = 19, NC: n = 43), 10 in the entorhinal cortex (AD: n = 15, NC: n = 39), and eight in the post-central gyrus (AD: n = 25, NC: n = 43) (Supplementary Figure 1). These replicable DEAGs in various brain regions exhibited concordant changes in expression levels. These results further validated the aging-associated transcriptomic changes identified in snRNA-seq analysis.
The correlation between dysregulated aging-related genes and Alzheimer’s disease severity
The importance of the key AGs in AD has been confirmed. We next sought to determine if the change in these AGs correlated with indicators of AD severity. The presence of AD-type neurofibrillary lesions was quantified by Braak staging (Braak and Braak, 1991). We used samples in the dataset GSE106241 to examine whether the AG expressions varied in different Braak stages in AD. IGF1R and MXI1 were significantly upregulated in Braak V and VI compared with Braak I and II (Figures 6A,B). PPARA was significantly upregulated in Braak III and IV compared with Braak I and II (Figure 6C). MAPK9 and YWHAZ were identified to be downregulated in Braak V and VI compared with Braak I and II (Figures 6D,E). Amyloid plaque is another important pathological hallmark of AD, and higher amyloid plaque burden scores (0–3) indicate greater pathology. We analyzed the dataset GSE29378 to determine whether the expression levels of AGs varied in patients with different plaque scores. IGF1R was upregulated in patients with plaque score = 2/3 compared with those with plaque score = 1 (Figure 6F). MAPK9 was downregulated in patients with plaque score = 2 compared with those with plaque score = 1 (Figure 6G). Taken together, upregulated IGF1R, MXI1, and PPARA, and downregulated MAPK9 and YWHAZ in NVU cells may be involved in progression of AD pathology.
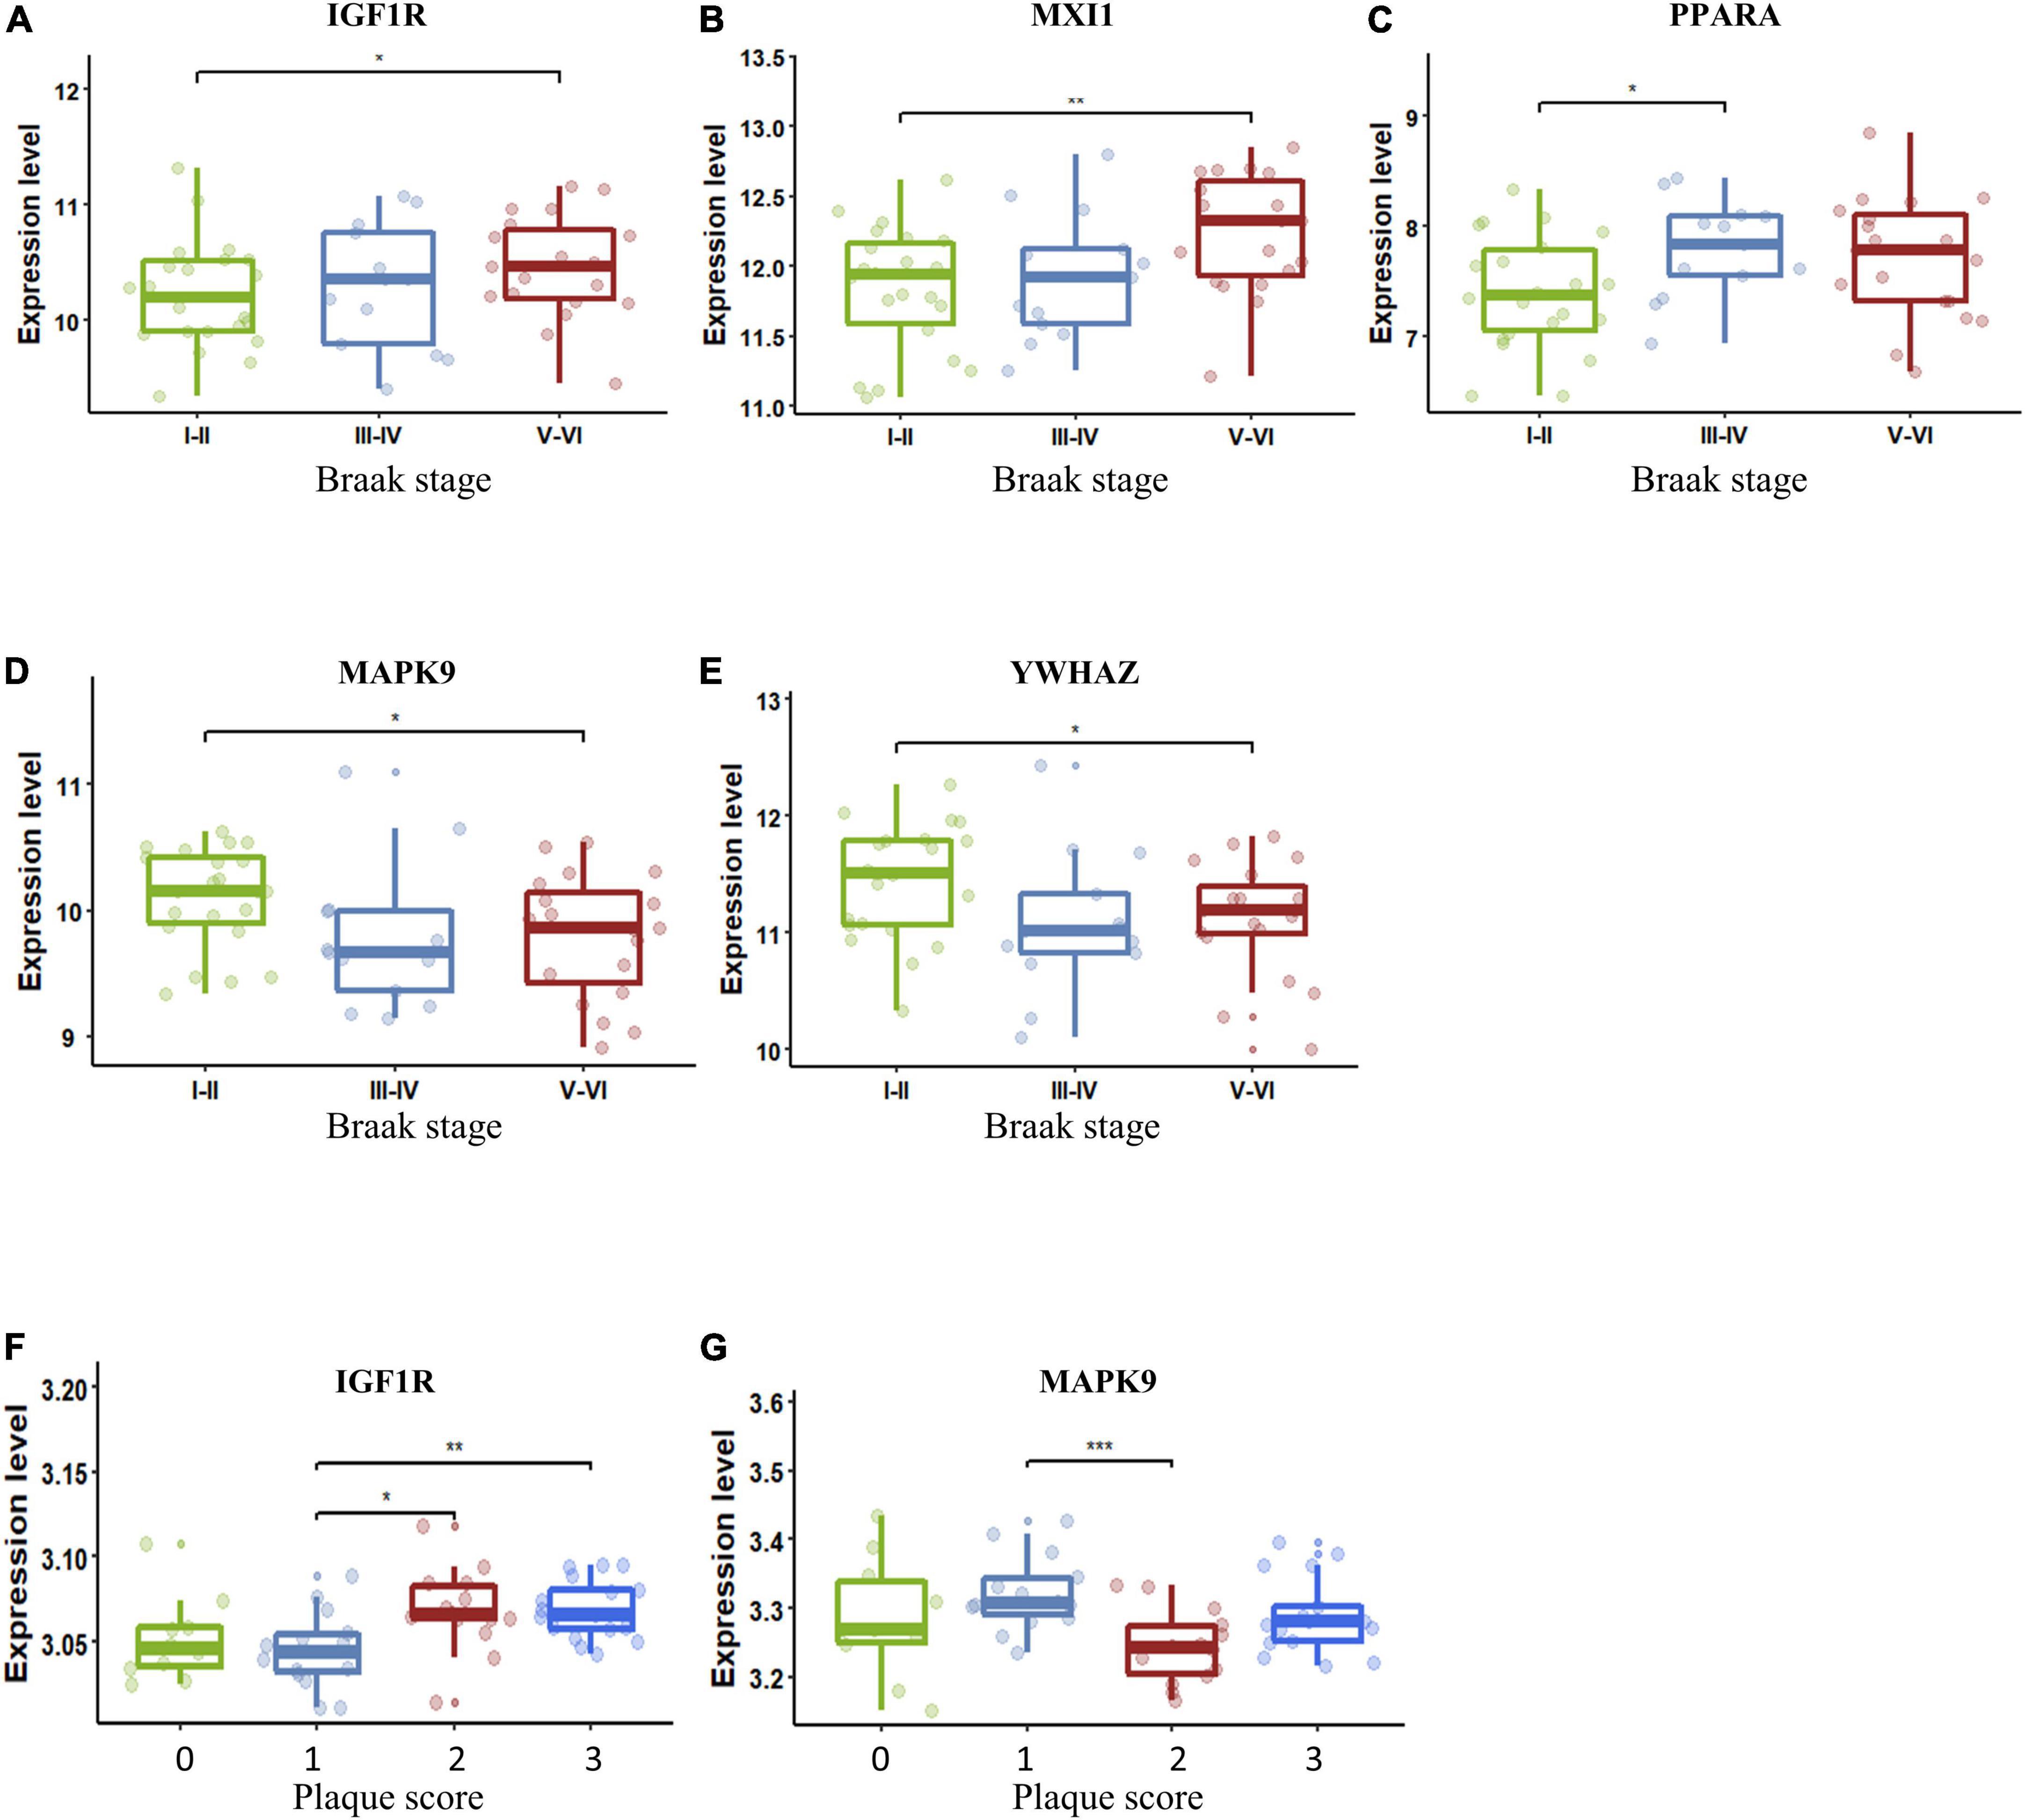
Figure 6. Key AG expression levels in AD patients with different Braak stages or plaque scores. (A) The expression of IGF1R in different Braak stages of AD. (B) The expression of MXI1 in different Braak stages of AD. (C) The expression of PPARA in different Braak stages of AD. (D) The expression of MAPK9 in different Braak stages of AD. (E) The expression of YWHAZ in different Braak stages of AD. (F) The expression of IGF1R in different plaque scores of AD. (G) The expression of MAPK9 in different plaque scores of AD. The upper, lower, and middle horizontal lines of the box represent the upper, lower, and median quartiles, respectively. The t-test was used to estimate whether differences between the two groups were significant. Asterisks denotes significant difference. p-value: *p < 0.05; **p < 0.01; ***p < 0.001. AD, Alzheimer’s disease; AG, aging-related gene.
Cell type-specific alterations of key aging-related genes in Alzheimer’s disease
We next analyzed the variation in the expression of key AGs in each NVU cell type. These AGs were significantly altered in a specific cell type, including changes specific to astrocytes (e.g., NFE2L2 and RB1), microglia (e.g., PRKCD, MAPK9, STAT5B, RB1, FOS, MXI1, and NFE2L2), oligodendrocytes (e.g., IGF1R), OPCs (e.g., STAT5B and MXI1), excitatory neurons (e.g., PRKDC, PDPK1, SDHC, YWHAZ, MAPK9, HTT, and HSPA9), ECs (e.g., YWHAZ, MAPK9, HTT, and FOS), and pericyte (e.g., HTT, IGF1R, RB1, FOS, NFE2L2, PPARA, and MXI1) (Figure 7A). Figure 7B showed the relative expression profiles of each gene in each cell types. The key AGs show considerable heterogeneity among the cell type-specific expression patterns (Figure 7C). Bulk transcriptome data cannot detect DEGs with opposite directionality in different cell types. We previous found that upregulated IGF1R, MXI1, and PPARA, and downregulated MAPK9 and YWHAZ may be correlated with AD progression. With snRNA-seq analysis, we found that IGF1R was upregulated in oligodendrocytes and pericytes but downregulated in ECs. MXI1 was upregulated in microglia, pericytes and OPCs but downregulated in ECs. YWHAZ was downregulated in ECs, excitatory neurons but upregulated in oligodendrocytes. The single cell-level resolution is crucial as changes in gene expression, for example directionality, may be conditional on cell type.
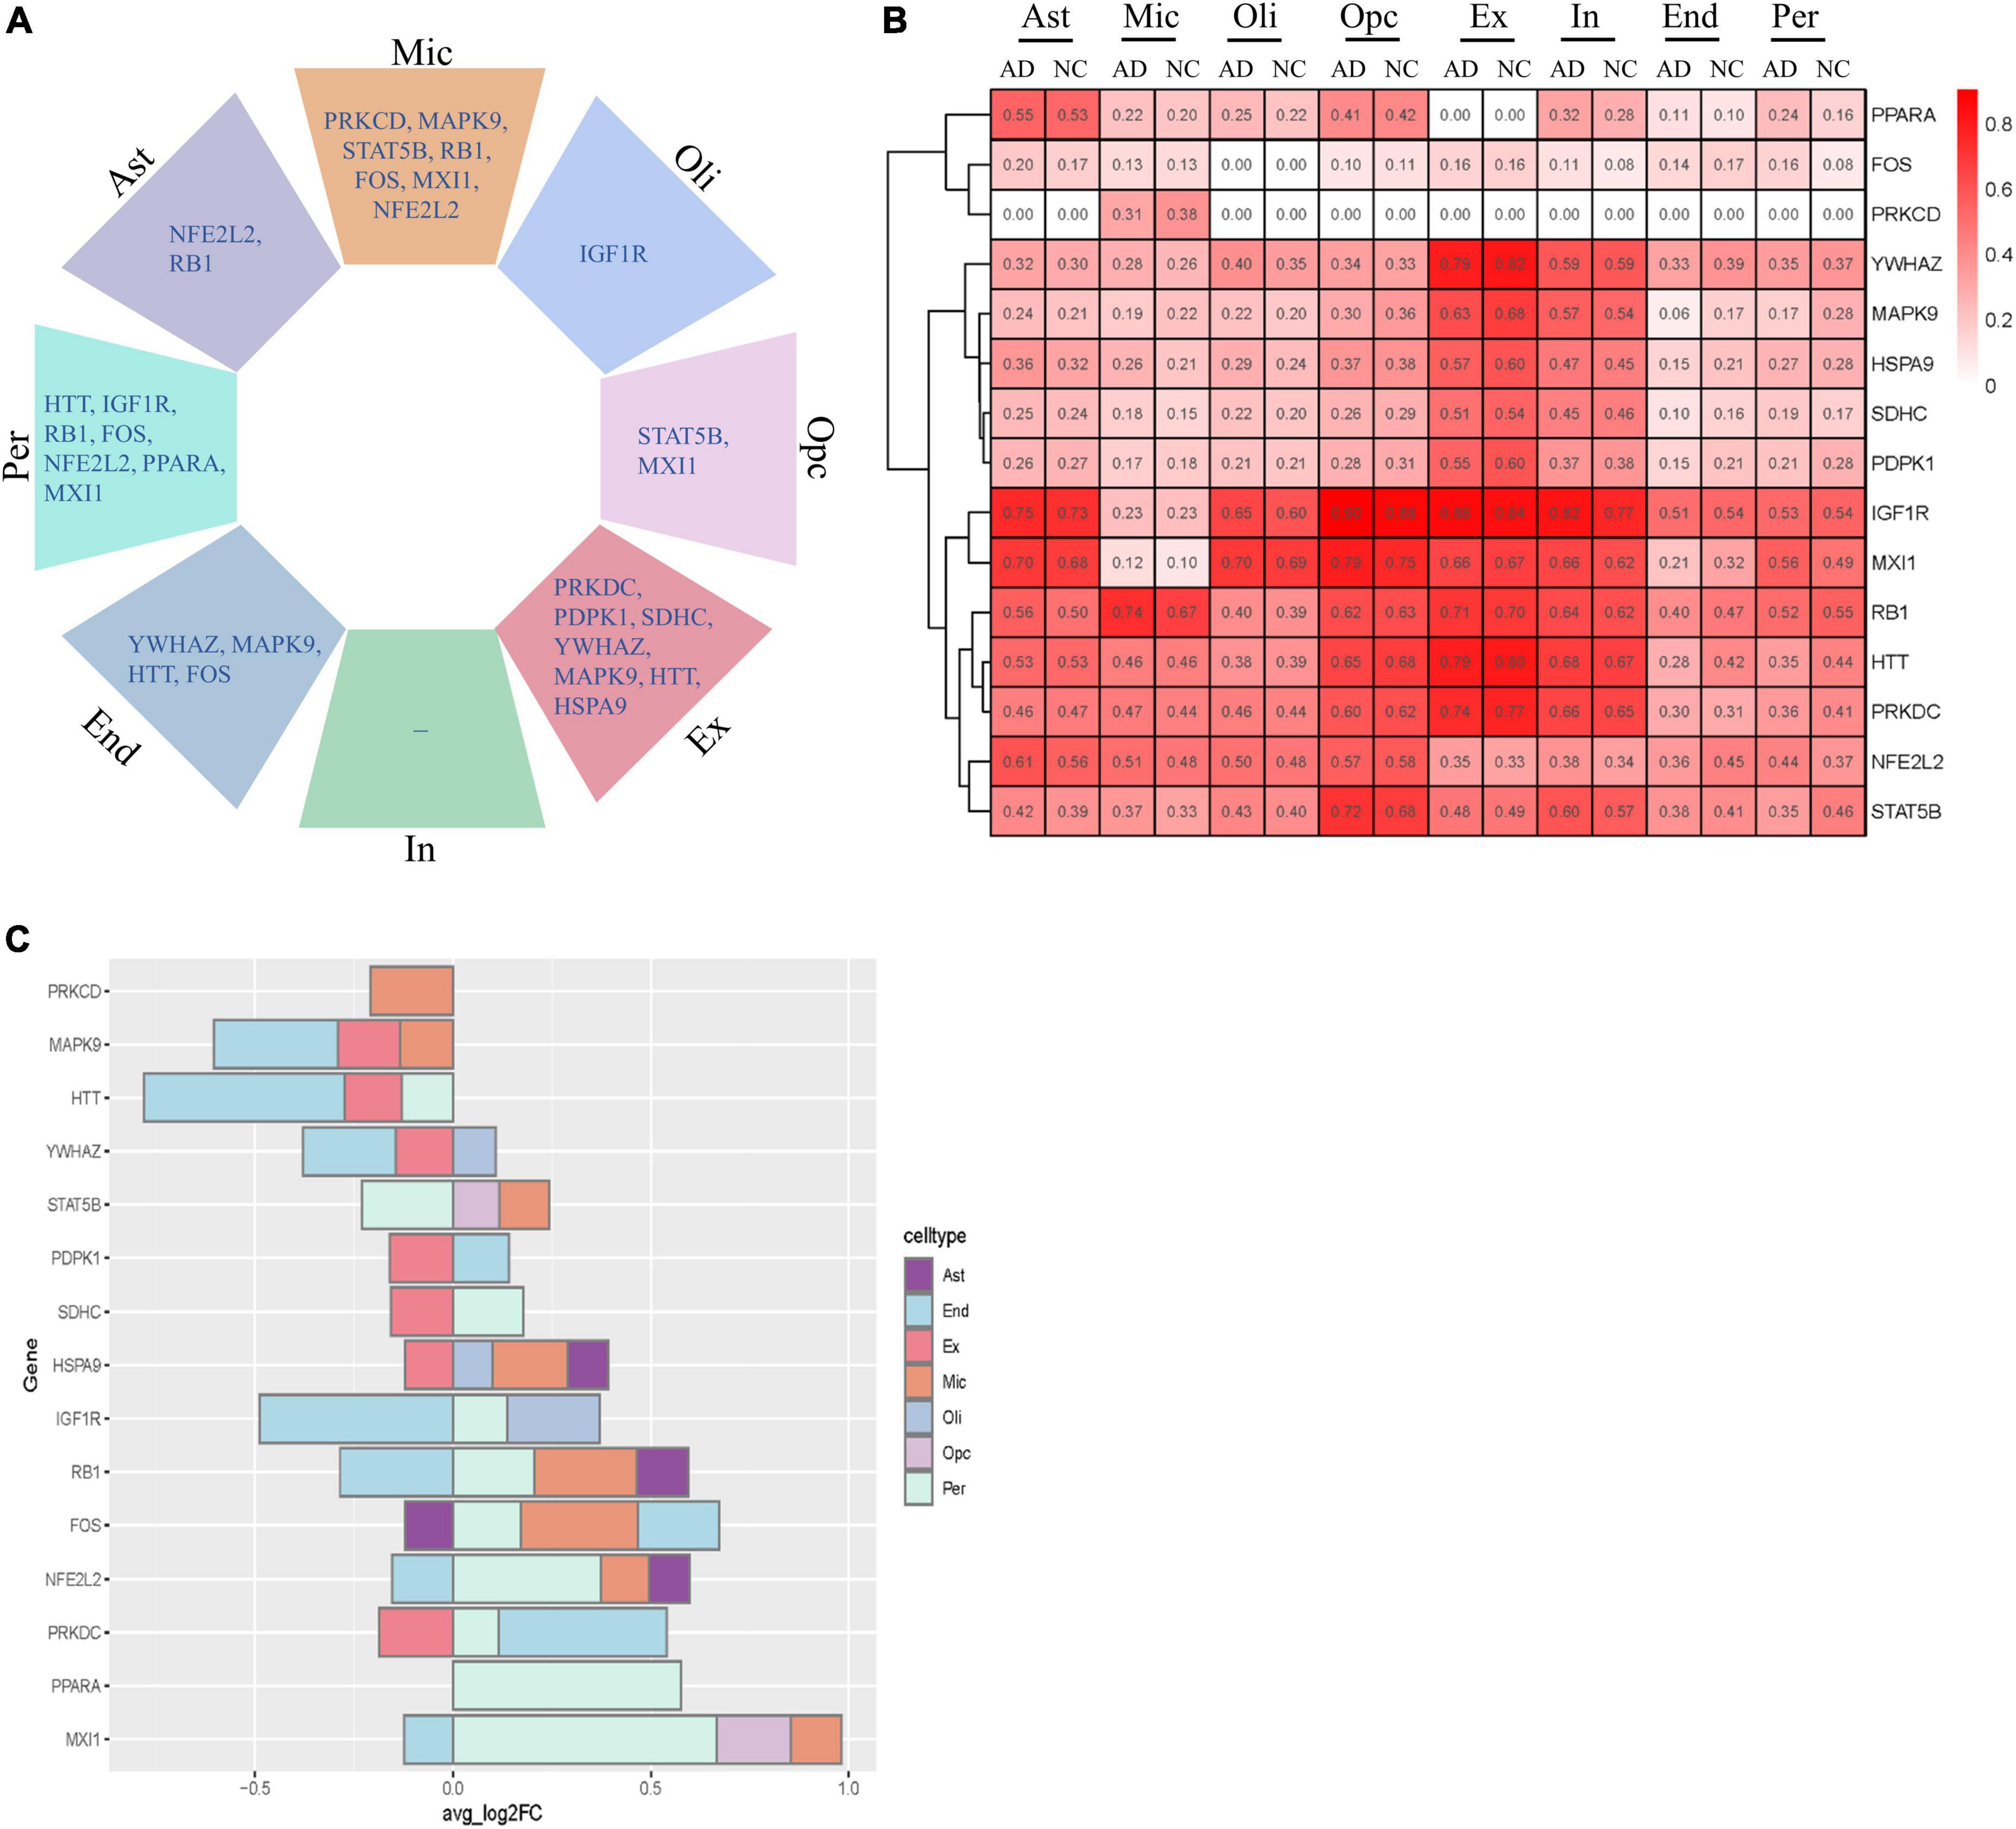
Figure 7. Cell type-specific alterations of key AGs in AD. (A) Key DEAGs in different NVU cell types. (B) The expression levels of key AGs in each NVU cell type. (C) Differentially expressed key AGs in NVU cells between AD and NC. AD, Alzheimer’s disease; AGs, aging-related genes; Ast, astrocyte; DEAGs, differentially expressed aging-related genes; End, endothelial cell; Ex, excitatory neuron; FC, fold change; In, inhibitory neuron; Mic, microglia; NC, normal control; NVU, neurovascular unit; Oli, oligodendrocyte; Opc, oligodendrocyte progenitor cell; Per, pericyte.
Discussion
Aging is one of the strongest risk factors for the development of AD. Aging may directly affect cells of NVU. However, scarce attention has been paid to the role of NVU aging in AD pathogenesis. Thus, defining the contribution of aging-related molecular pathways in NVU cells, and their role in the development of AD is of great importance. To address this question, we analyzed single-nucleus transcriptome data of prefrontal cortex from 11 AD patients and seven NC individuals. We examined the transcriptomes of each NVU cell type, including astrocytes, microglia, oligodendrocytes, OPCs, excitatory neurons, inhibitory neurons, ECs, and pericytes, to determine whether the eight cell types were impacted by aging. GSEA analysis confirmed the cellular senescence-associated pathways enriched in microglia and oligodendrocytes. The results consistent with previous findings that glia cells are more likely to be influenced by aging. Senescent microglia and astrocytes accumulate in MAPTP301SPS19 mouse model (a model of tau-dependent neurodegenerative disease), and clearance of these cells prevents neurofibrillary tangle deposition, gliosis, and degeneration of hippocampal and cortical neurons (Bussian et al., 2018). Oligodendrocytes are the largest group of non-neuronal cells in the brain, and the number of oligodendrocytes declines by age, which showed a significant 27% decrease over adult life from 20 to 90 years (Pelvig et al., 2008). Several Additional studies confirmed that oligodendrocytes in aging is associated with diminished remyelination capacity, increased atrophy of white matter, and a decline in motor learning (Ruckh et al., 2012; Habes et al., 2016).
To comprehensively investigate the transcriptional changes associated with aging in NVU, we next analyzed the expression patterns of AGs in each NVU cell type. Subsequently, validation of the aging-related transcriptomic changes in NVU was conducted in bulk transcriptomic data of AD. GO and KEGG pathway analysis in bulk transcriptomic data uncovered function of DEAGs, such as aging, apoptosis, cellular senescence, longevity regulating pathway. Although the relationships between aging and apoptosis are complex, studies have speculated that apoptosis contributes to aging (Zheng et al., 2005). Longevity is modulated by aging, and senescence inhibition leads to health and longevity (Tousian et al., 2020).
Using the LASSO method, we selected 15 crucial AGs based on the intersection of DEAGs from snRNA-seq data and those from bulk transcriptome data of AD, which performed well in discriminating AD from NC samples. Additionally, this 15-gene model was well-validated in the external dataset. Some of these genes have been reported previously to be involved in AD pathogenesis. It has been confirmed that aberrant IGF1R signaling existed in the post-mortem brains of AD patients, and long-term suppression of IGF1R signaling delayed AD progression. Genetic ablation of IGF1R in neurons of the aging mouse brain could protect against the neuroinflammation and memory impairment induced by Aβ oligomers (George et al., 2017). Transcription factor NFE2L2 is an important regulator of autophagy gene expression. In AD patients, neurons expressing high levels of APP also expressed NFE2L2, indicating their attempt to degrade intracellular aggregates through autophagy (Pajares et al., 2016). Microglia activation and secretion of inflammatory cytokines are involved in the pathogenesis of AD, and STAT5B plays a crucial role in mediating IL-3-induced microglia activation (Natarajan et al., 2004). APP contributes to maintaining synaptic homeostasis (Müller et al., 2017), and wild-type huntingtin (HTT) facilitates the transport of APP by increasing the number of APP-containing vesicles (Colin et al., 2008). MAPK9 is an important player in the stress response and was reported to mediate autophagy induced by Aβ1-42 oligomers. In addition, studies have also elaborated on the important role of YWHAZ (Ho Kim et al., 2015; Yang et al., 2020; Zhou et al., 2020), PRKCD (Park et al., 2020), and SDHC (Bisht et al., 2020) in the development of AD. These findings in experimental studies strongly support our analytic results. Nevertheless, the molecular mechanism of these AGs contributing to AD pathogenesis is still poorly understood, and further studies are required to investigate the potential mechanisms of the AGs.
We observed that IGF1R, MXI1, PPARA, YWHAZ, and MAPK9 were remarkably strongly correlated with pathologic progression in AD and may function as facilitators or inhibitors of AD. There is no previous literature addressing the role of MXI1 in the development of AD. Mxi1 proteins has been proved to be essential in cellular growth control and in the induction of the differentiated state (Schreiber-Agus et al., 1998). Previous study identified Myc-Mxi1 signaling as a crucial downstream effector of FoxOs in the regulation of proliferation of renal cancer (Gan et al., 2010). Three key features of senescent cells include increased resistance to apoptosis death, a block-to-cell proliferation, and alterations in differentiated functions (Tsugu et al., 2000). It is likely that the studies probing the role of MXI1 in brain aging has significance for revealing potential pathogenesis of AD. These AGs have cell type-specific expression patterns and function. IGF1R is differentially expressed in oligodendrocytes and pericytes, MXI1 in pericytes, OPCs and microglia, PPARA in pericytes, YWHAZ in ECs and excitatory neurons, MAPK9 in ECs, excitatory neurons, and microglia. However, attentions was seldom paid to the function of these key AGs in a specific cell type. The problems become much more complicated owing to that these genes are shown to be dysregulated in different directions across different NVU cell types. Consideration for cell type-specific regulatory mechanism may be important in the design of therapeutic targets for AD. Further study is required to elucidate the cell-specific roles of these genes in the pathogenesis of AD. Our results provide valuable clues for investigating potential mechanism underlying AD.
Conclusion
There is no effective therapy for AD at present; thus, further studies are needed to determine more accurate biomarkers with clinical utility. This study assessed aging-related transcriptomic changes in NVU cells of AD, which were validated with bulk transcriptome data. We identified 15 crucial DEAGs closely associated with AD by a series of bioinformatics analysis, including IGF1R, MXI1, RB1, PPARA, NFE2L2, STAT5B, FOS, PRKCD, YWHAZ, HTT, MAPK9, HSPA9, SDHC, PRKDC, and PDPK1. The diagnostic model based on the 15 AGs was constructed with relatively high AUC values in the external dataset. Of these, IGF1R, MXI1, PPARA, YWHAZ, and MAPK9 were remarkably strongly correlated with pathologic progression in AD and may be candidate genes for future molecular studies. More importantly, different expression patterns of key AGs in specific cell types may serve as a cell-specific therapeutic target for AD. Our comprehensive analysis of the snRNA sequence of NVU cells and bulk transcriptome data of AD reveals previously unknown molecular changes, as well as cellular targets, that potentially underlie the functional dysregulation of NVU in AD, providing important insights for therapeutic development.
Data availability statement
Publicly available datasets were analyzed in this study. This data can be found here (http://www.ncbi.nlm.nih.gov/geo/), GSE174367, GSE48350, GSE122063, GSE29378, and GSE106241.
Ethics statement
The data relating to participants were obtained from the public GEO database. Ethical review and approval were not required for this study on human participants in accordance with the local legislation and institutional requirements. Written informed consent was not required in accordance with the local legislation and institutional requirements.
Author contributions
YZ wrote the manuscript and drew the figures. Y-ZX provided methodological advice. Y-SL conceived the idea and had been involved in manuscript conception and drafting. All authors read and approved the final manuscript.
Funding
This work was supported by the National Natural Science Foundation of China (No. 82071593), the Fundamental Research Funds for the Central Universities of Central South University (No. 2021zzts0359), and Hunan Provincial Innovation Foundation for Postgraduate (No. CX20210128).
Conflict of interest
The authors declare that the research was conducted in the absence of any commercial or financial relationships that could be construed as a potential conflict of interest.
Publisher’s note
All claims expressed in this article are solely those of the authors and do not necessarily represent those of their affiliated organizations, or those of the publisher, the editors and the reviewers. Any product that may be evaluated in this article, or claim that may be made by its manufacturer, is not guaranteed or endorsed by the publisher.
Supplementary material
The Supplementary Material for this article can be found online at: https://www.frontiersin.org/articles/10.3389/fnagi.2022.949074/full#supplementary-material
Footnotes
References
Armstead, W. M., and Vavilala, M. S. (2019). Propranolol protects cerebral autoregulation and reduces hippocampal neuronal cell death through inhibition of interleukin-6 upregulation after traumatic brain injury in pigs. Br. J. Anaesth. 123, 610–617. doi: 10.1016/j.bja.2019.07.017
Berchtold, N. C., Cribbs, D. H., Coleman, P. D., Rogers, J., Head, E., Kim, R., et al. (2008). Gene expression changes in the course of normal brain aging are sexually dimorphic. Proc. Natl. Acad. Sci. U.S.A. 105, 15605–15610. doi: 10.1073/pnas.0806883105
Bisht, I., Ambasta, R. K., and Kumar, P. (2020). An integrated approach to unravel a putative crosstalk network in Alzheimer’s disease and Parkinson’s disease. Neuropeptides 83:102078. doi: 10.1016/j.npep.2020.102078
Braak, H., and Braak, E. (1991). Neuropathological stageing of Alzheimer-related changes. Acta Neuropathol. 82, 239–259. doi: 10.1007/bf00308809
Bussian, T. J., Aziz, A., Meyer, C. F., Swenson, B. L., van Deursen, J. M., and Baker, D. J. (2018). Clearance of senescent glial cells prevents tau-dependent pathology and cognitive decline. Nature 562, 578–582. doi: 10.1038/s41586-018-0543-y
Campisi, J. (2013). Aging, cellular senescence, and cancer. Annu. Rev. Physiol. 75, 685–705. doi: 10.1146/annurev-physiol-030212-183653
Colin, E., Zala, D., Liot, G., Rangone, H., Borrell-Pagès, M., Li, X. J., et al. (2008). Huntingtin phosphorylation acts as a molecular switch for anterograde/retrograde transport in neurons. EMBO J. 27, 2124–2134. doi: 10.1038/emboj.2008.133
Consortium, T. G. O. (2019). The gene ontology resource: 20 years and still GOing strong. Nucleic Acids Res. 47, D330–D338. doi: 10.1093/nar/gky1055
de Magalhães, J. P., Costa, J., and Toussaint, O. (2005). HAGR: The human ageing genomic resources. Nucleic Acids Res. 33, D537–D543. doi: 10.1093/nar/gki017
Deli, M. A., Abrahám, C. S., Kataoka, Y., and Niwa, M. (2005). Permeability studies on in vitro blood-brain barrier models: Physiology, pathology, and pharmacology. Cell Mol. Neurobiol. 25, 59–127. doi: 10.1007/s10571-004-1377-8
Edgar, R., Domrachev, M., and Lash, A. E. (2002). Gene expression omnibus: NCBI gene expression and hybridization array data repository. Nucleic Acids Res. 30, 207–210. doi: 10.1093/nar/30.1.207
Fu, W. Y., Wang, X., and Ip, N. Y. (2019). Targeting neuroinflammation as a therapeutic strategy for Alzheimer’s disease: Mechanisms, drug candidates, and new opportunities. ACS Chem. Neurosci. 10, 872–879. doi: 10.1021/acschemneuro.8b00402
Gan, B., Lim, C., Chu, G., Hua, S., Ding, Z., Collins, M., et al. (2010). FoxOs enforce a progression checkpoint to constrain mTORC1-activated renal tumorigenesis. Cancer Cell 18, 472–484. doi: 10.1016/j.ccr.2010.10.019
George, C., Gontier, G., Lacube, P., François, J. C., Holzenberger, M., and Aïd, S. (2017). The Alzheimer’s disease transcriptome mimics the neuroprotective signature of IGF-1 receptor-deficient neurons. Brain 140, 2012–2027. doi: 10.1093/brain/awx132
Habes, M., Erus, G., Toledo, J. B., Zhang, T., Bryan, N., Launer, L. J., et al. (2016). White matter hyperintensities and imaging patterns of brain ageing in the general population. Brain 139, 1164–1179. doi: 10.1093/brain/aww008
Ho Kim, J., Franck, J., Kang, T., Heinsen, H., Ravid, R., Ferrer, I., et al. (2015). Proteome-wide characterization of signalling interactions in the hippocampal CA4/DG subfield of patients with Alzheimer’s disease. Sci. Rep. 5:11138. doi: 10.1038/srep11138
Hu, X., De Silva, T. M., Chen, J., and Faraci, F. M. (2017). Cerebral vascular disease and neurovascular injury in ischemic stroke. Circ. Res. 120, 449–471. doi: 10.1161/circresaha.116.308427
Iadecola, C. (2004). Neurovascular regulation in the normal brain and in Alzheimer’s disease. Nat. Rev. Neurosci. 5, 347–360. doi: 10.1038/nrn1387
Iadecola, C. (2017). The neurovascular unit coming of age: A journey through neurovascular coupling in health and disease. Neuron 96, 17–42. doi: 10.1016/j.neuron.2017.07.030
Jäkel, S., Agirre, E., Mendanha Falcão, A., van Bruggen, D., Lee, K. W., Knuesel, I., et al. (2019). Altered human oligodendrocyte heterogeneity in multiple sclerosis. Nature 566, 543–547. doi: 10.1038/s41586-019-0903-2
Kanehisa, M., Sato, Y., Kawashima, M., Furumichi, M., and Tanabe, M. (2016). KEGG as a reference resource for gene and protein annotation. Nucleic Acids Res. 44, D457–D462. doi: 10.1093/nar/gkv1070
Lähteenvuo, J., and Rosenzweig, A. (2012). Effects of aging on angiogenesis. Circ. Res. 110, 1252–1264. doi: 10.1161/circresaha.111.246116
Lau, S. F., Cao, H., Fu, A. K. Y., and Ip, N. Y. (2020). Single-nucleus transcriptome analysis reveals dysregulation of angiogenic endothelial cells and neuroprotective glia in Alzheimer’s disease. Proc. Natl. Acad. Sci. U.S.A. 117, 25800–25809. doi: 10.1073/pnas.2008762117
Lourbopoulos, A., Ertürk, A., and Hellal, F. (2015). Microglia in action: How aging and injury can change the brain’s guardians. Front. Cell Neurosci. 9:54. doi: 10.3389/fncel.2015.00054
Marttinen, M., Paananen, J., Neme, A., Mitra, V., Takalo, M., Natunen, T., et al. (2019). A multiomic approach to characterize the temporal sequence in Alzheimer’s disease-related pathology. Neurobiol. Dis. 124, 454–468. doi: 10.1016/j.nbd.2018.12.009
McKay, E. C., Beck, J. S., Khoo, S. K., Dykema, K. J., Cottingham, S. L., Winn, M. E., et al. (2019). Peri-infarct upregulation of the oxytocin receptor in vascular dementia. J. Neuropathol. Exp. Neurol. 78, 436–452. doi: 10.1093/jnen/nlz023
Miller, J. A., Woltjer, R. L., Goodenbour, J. M., Horvath, S., and Geschwind, D. H. (2013). Genes and pathways underlying regional and cell type changes in Alzheimer’s disease. Genome Med. 5:48. doi: 10.1186/gm452
Montagne, A., Barnes, S. R., Sweeney, M. D., Halliday, M. R., Sagare, A. P., Zhao, Z., et al. (2015). Blood-brain barrier breakdown in the aging human hippocampus. Neuron 85, 296–302. doi: 10.1016/j.neuron.2014.12.032
Morabito, S., Miyoshi, E., Michael, N., Shahin, S., Martini, A. C., Head, E., et al. (2021). Single-nucleus chromatin accessibility and transcriptomic characterization of Alzheimer’s disease. Nat. Genet. 53, 1143–1155. doi: 10.1038/s41588-021-00894-z
Müller, U. C., Deller, T., and Korte, M. (2017). Not just amyloid: Physiological functions of the amyloid precursor protein family. Nat. Rev. Neurosci. 18, 281–298. doi: 10.1038/nrn.2017.29
Natarajan, C., Sriram, S., Muthian, G., and Bright, J. J. (2004). Signaling through JAK2-STAT5 pathway is essential for IL-3-induced activation of microglia. Glia 45, 188–196. doi: 10.1002/glia.10316
Nelson, A. R., Sweeney, M. D., Sagare, A. P., and Zlokovic, B. V. (2016). Neurovascular dysfunction and neurodegeneration in dementia and Alzheimer’s disease. Biochim. Biophys. Acta 1862, 887–900. doi: 10.1016/j.bbadis.2015.12.016
Pajares, M., Jimenez-Moreno, N., Garcia-Yague, A. J., Escoll, M., de Ceballos, M. L., Van Leuven, F., et al. (2016). Transcription factor NFE2L2/NRF2 is a regulator of macroautophagy genes. Autophagy 12, 1902–1916. doi: 10.1080/15548627.2016.1208889
Park, Y. H., Hodges, A., Risacher, S. L., Lin, K., Jang, J. W., Ahn, S., et al. (2020). Dysregulated Fc gamma receptor-mediated phagocytosis pathway in Alzheimer’s disease: Network-based gene expression analysis. Neurobiol. Aging 88, 24–32. doi: 10.1016/j.neurobiolaging.2019.12.001
Pelvig, D. P., Pakkenberg, H., Stark, A. K., and Pakkenberg, B. (2008). Neocortical glial cell numbers in human brains. Neurobiol. Aging 29, 1754–1762. doi: 10.1016/j.neurobiolaging.2007.04.013
Ritchie, M. E., Phipson, B., Wu, D., Hu, Y., Law, C. W., Shi, W., et al. (2015). limma powers differential expression analyses for RNA-sequencing and microarray studies. Nucleic Acids Res. 43:e47. doi: 10.1093/nar/gkv007
Ruckh, J. M., Zhao, J. W., Shadrach, J. L., van Wijngaarden, P., Rao, T. N., Wagers, A. J., et al. (2012). Rejuvenation of regeneration in the aging central nervous system. Cell Stem Cell 10, 96–103. doi: 10.1016/j.stem.2011.11.019
Schreiber-Agus, N., Meng, Y., Hoang, T., Hou, H. Jr., Chen, K., Greenberg, R., et al. (1998). Role of Mxi1 in ageing organ systems and the regulation of normal and neoplastic growth. Nature 393, 483–487. doi: 10.1038/31008
Shantsila, E., Watson, T., and Lip, G. Y. (2007). Endothelial progenitor cells in cardiovascular disorders. J. Am. Coll. Cardiol. 49, 741–752. doi: 10.1016/j.jacc.2006.09.050
Simon, N., Friedman, J., Hastie, T., and Tibshirani, R. (2011). Regularization PATHS for cox’s proportional hazards model via coordinate descent. J. Stat. Softw. 39, 1–13. doi: 10.18637/jss.v039.i05
Srinivasan, K., Friedman, B. A., Etxeberria, A., Huntley, M. A., van der Brug, M. P., Foreman, O., et al. (2020). Alzheimer’s patient microglia exhibit enhanced aging and unique transcriptional activation. Cell Rep. 31:107843. doi: 10.1016/j.celrep.2020.107843
Stuart, T., Butler, A., Hoffman, P., Hafemeister, C., Papalexi, E., and Mauck, W. M. III, et al. (2019). Comprehensive integration of single-cell data. Cell 177, 1888.e–1902.e. doi: 10.1016/j.cell.2019.05.031
Subramanian, A., Tamayo, P., Mootha, V. K., Mukherjee, S., Ebert, B. L., Gillette, M. A., et al. (2005). Gene set enrichment analysis: A knowledge-based approach for interpreting genome-wide expression profiles. Proc. Natl. Acad. Sci. U.S.A. 102, 15545–15550. doi: 10.1073/pnas.0506580102
Tacutu, R., Thornton, D., Johnson, E., Budovsky, A., Barardo, D., Craig, T., et al. (2018). Human ageing genomic resources: New and updated databases. Nucleic Acids Res. 46, D1083–D1090. doi: 10.1093/nar/gkx1042
Tchkonia, T., Zhu, Y., van Deursen, J., Campisi, J., and Kirkland, J. L. (2013). Cellular senescence and the senescent secretory phenotype: Therapeutic opportunities. J. Clin. Invest. 123, 966–972. doi: 10.1172/jci64098
Tousian, H., Razavi, B. M., and Hosseinzadeh, H. (2020). Looking for immortality: Review of phytotherapy for stem cell senescence. Iran. J. Basic Med. Sci. 23, 154–166. doi: 10.22038/ijbms.2019.40223.9522
Tsugu, A., Sakai, K., Dirks, P. B., Jung, S., Weksberg, R., Fei, Y. L., et al. (2000). Expression of p57(KIP2) potently blocks the growth of human astrocytomas and induces cell senescence. Am. J. Pathol. 157, 919–932. doi: 10.1016/s0002-9440(10)64605-6
Wilhelm, I., Nyúl-Tóth, Á, Kozma, M., Farkas, A. E., and Krizbai, I. A. (2017). Role of pattern recognition receptors of the neurovascular unit in inflamm-aging. Am. J. Physiol. Heart Circ. Physiol. 313, H1000–H1012. doi: 10.1152/ajpheart.00106.2017
Yang, F., Diao, X., Wang, F., Wang, Q., Sun, J., Zhou, Y., et al. (2020). Identification of key regulatory genes and pathways in prefrontal cortex of Alzheimer’s disease. Interdiscip. Sci. 12, 90–98. doi: 10.1007/s12539-019-00353-8
Yu, G., and He, Q. Y. (2016). ReactomePA: An R/Bioconductor package for reactome pathway analysis and visualization. Mol. Biosyst. 12, 477–479. doi: 10.1039/c5mb00663e
Yu, G., Wang, L. G., Han, Y., and He, Q. Y. (2012). clusterProfiler: An R package for comparing biological themes among gene clusters. Omics 16, 284–287. doi: 10.1089/omi.2011.0118
Zhan, G., Serrano, F., Fenik, P., Hsu, R., Kong, L., Pratico, D., et al. (2005). NADPH oxidase mediates hypersomnolence and brain oxidative injury in a murine model of sleep apnea. Am. J. Respir. Crit. Care Med. 172, 921–929. doi: 10.1164/rccm.200504-581OC
Zheng, J., Edelman, S. W., Tharmarajah, G., Walker, D. W., Pletcher, S. D., and Seroude, L. (2005). Differential patterns of apoptosis in response to aging in Drosophila. Proc. Natl. Acad. Sci. U.S.A. 102, 12083–12088. doi: 10.1073/pnas.0503374102
Zhou, M., Haque, R. U., Dammer, E. B., Duong, D. M., Ping, L., Johnson, E. C. B., et al. (2020). Targeted mass spectrometry to quantify brain-derived cerebrospinal fluid biomarkers in Alzheimer’s disease. Clin. Proteomics 17:19. doi: 10.1186/s12014-020-09285-8
Zlokovic, B. V. (2008b). New therapeutic targets in the neurovascular pathway in Alzheimer’s disease. Neurotherapeutics 5, 409–414. doi: 10.1016/j.nurt.2008.05.011
Zlokovic, B. V. (2008a). The blood-brain barrier in health and chronic neurodegenerative disorders. Neuron 57, 178–201. doi: 10.1016/j.neuron.2008.01.003
Keywords: Alzheimer’s disease, aging, single-nucleus RNA sequencing, neurovascular unit, neurodegenerative disease
Citation: Zhao Y, Xie Y-Z and Liu Y-S (2022) Accelerated aging-related transcriptome alterations in neurovascular unit cells in the brain of Alzheimer’s disease. Front. Aging Neurosci. 14:949074. doi: 10.3389/fnagi.2022.949074
Received: 20 May 2022; Accepted: 28 July 2022;
Published: 18 August 2022.
Edited by:
Stephen D. Ginsberg, Nathan Kline Institute for Psychiatric Research, United StatesReviewed by:
Julie Simpson, The University of Sheffield, United KingdomYasir Abdul, Medical University of South Carolina, United States
Ashley Phoenix, Wake Forest School of Medicine, United States, in collaboration with reviewer YA
Copyright © 2022 Zhao, Xie and Liu. This is an open-access article distributed under the terms of the Creative Commons Attribution License (CC BY). The use, distribution or reproduction in other forums is permitted, provided the original author(s) and the copyright owner(s) are credited and that the original publication in this journal is cited, in accordance with accepted academic practice. No use, distribution or reproduction is permitted which does not comply with these terms.
*Correspondence: You-Shuo Liu, bGl1eW91c2h1b0Bjc3UuZWR1LmNu