 Yingming Kong
 Yanghao Tai
 Bin Chen
 Chunzheng Li2
 Liang Shi
- 1Third Hospital of Shanxi Medical University, Shanxi Bethune Hospital, Shanxi Academy of Medical Sciences Tongji Shanxi Hospital, Taiyuan, China
- 2Basic Medical College, Shanxi Medical University, Taiyuan, China
- 3Department of Neurology, Shanxi Bethune Hospital, Shanxi Academy of Medical Science, Tongji Shanxi Hospital, Third Hospital of Shanxi Medical University, Taiyuan, China
Objective: Serum neurofilament light chain (sNfL) is one of the most sensitive diagnostic biomarkers for a variety of neurodegenerative pathologies. Potassium, an essential electrolyte, plays a critical role in maintaining neuronal health and the proper functioning of the central nervous system (CNS). The aim of our research was to investigate the association between serum potassium level and sNfL levels.
Methods: Based on the National Health and Nutrition Examination Survey (NHANES) database, we analyzed data from the 2013 to 2014 NHANES. Serum potassium concentrations were measured via ion-selective electrode (ISE) technology. The levels of sNfL were measured using a sensitive immunoassay developed by Siemens Healthineers. Our researcher analyzed the association between potassium level in serum and sNfL in American persons using multivariate logistic regression analysis and smoothed curve fitting. The consistency of these results was examined in various population subgroups.
Results: A total of 1,670 participants were involved in our research, including 872 women (50.5%) and 798 men (49.5%). The median serum potassium concentration was 4.0 mmol/L and the median sNfL was 12.3 pg/ml. After adjusting for potential confounders in the full model, individuals with higher serum potassium concentrations had higher sNfL levels (Q3 vs. Q1, β = 2.86, 95% CI: 0.33–5.39, P = 0.027). There was a non-linear positive dose-response association between higher serum potassium concentrations and sNfL levels (P for non-linearity = 0.028). Based on the results of stratified analysis, the relationship was stronger in the low- and middle-income group, non-drinking and non-physical activity participants, and participants with hypertension and diabetes.
Interpretation: In the cohort of American adults, a greater serum potassium concentration was linked to a higher sNfL. However, causality still needs to be further verified.
1 Introduction
Neurofilament proteins constitute the cytoskeleton of mature neurons (Gafson et al., 2020). Neurofilament light chain is one of its major subunits and constitutes a scaffolding protein for the neuronal cytoskeleton through spontaneous assembly. Within the central nervous system (CNS) and peripheral nerve system, serum neurofilament light chain (sNfL) is crucial in terms of conduction velocity and axon caliber (Gaetani et al., 2019). The sNfL is released into serum and cerebrospinal fluid following axonal injury or degeneration. Due to its high solubility and low molecular weight physicochemical properties, it can be detected at relatively low levels (Abu-Rumeileh et al., 2023). However, given the high risk associated with lumbar puncture for obtaining cerebrospinal fluid, the advantages of serum sNfL assays are more pronounced, including being minimally invasive and inexpensive (Tortosa-Carreres et al., 2024). As evidenced by earlier research, sNfL is thought to be a sensitive diagnostic biomarker for a variety of neurologic and neurodegenerative diseases. Previous studies have demonstrated that sNfL is thought to be a sensitive diagnostic biomarker for a variety of neurodegenerative diseases, especially for various neurological disorders characterized by axonal degeneration (Arslan and Zetterberg, 2023). Clinically, sNfL is an important biomarker for monitoring disease recurrence as well as evaluating the efficacy and prognosis of treatment, including motor neuron disease, Parkinson’s disease (PD), Alzheimer’s disease (AD), multiple sclerosis, primary psychiatric diseases, Guillain–Barre syndrome, traumatic brain injury, stroke, genetic peripheral neuropathy, and other neurological disorders (Aamodt et al., 2021; Abdelhak et al., 2023; Benkert et al., 2022; Brousse et al., 2023; Chen et al., 2022; Hwang et al., 2023; Rossor and Reilly, 2022; Teunissen et al., 2022; van Tilburg et al., 2024; Wang et al., 2024). The sNfL is therefore widely used to assess neuroinflammatory and degenerative diseases. Notably, sNfL levels are often influenced by external environmental factors (Bi et al., 2024). Notably, NfL levels are not only influenced by factors within the nervous system, but may also be regulated by external environmental factors, including the homeostasis of metal ions. These ions play critical roles in the nervous system and are involved in a variety of biochemical processes such as cell signaling, enzymatic reactions, and maintenance of neurotransmitter homeostasis (Cicero et al., 2017; Lai et al., 2024). The delicate balance of metal ions is critical for neuronal function. Therefore, the impact of metal ions cannot be ignored when assessing the diagnostic significance of NfL in neurodegenerative diseases.
Metal ions are ubiquitously present in the CNS and play an important role in maintaining neurophysiological homeostasis and neuronal function. Specifically, metal ions can function as receptors, transporter proteins, enzymes, transcription factors, and so on. Imbalances in ion concentrations can affect the physiological activities of nerve cells, even leading to cell death and affecting the health of the organism (Kawabata, 2022). Therefore, metal homeostasis is important for the maintenance of neurophysiological homeostasis. Emerging studies have shown that various neurodegenerative diseases are associated with metal ion imbalance, such as AD, vascular dementia, PD, and amyotrophic lateral sclerosis (Bisaglia and Bubacco, 2020; Carri et al., 2003; Tabet et al., 2001; Wang et al., 2020). For example, it has been observed in established experimental animal models that various metal ions can synergistically induce neurotoxic effects, which in turn lead to the development of vascular dementia (Tanaka and Kawahara, 2017). In the brain, the concentration of metal ions is usually higher than in other parts of the body. Cells have evolved a variety of metal regulatory mechanisms to maintain homeostasis in the intra- and extracellular environments, especially in the CNS (Jomova et al., 2022). Once the homeostatic balance of metals in the CNS is disrupted, progressive neurodegeneration, neuronal loss, protein deposition, and a variety of oxidative stress and inflammatory responses occur (Liu et al., 2022). For the dynamic balance of metal ions, blood potassium plays an important role.
It has been well established that sNfL is associated with a variety of neurodegenerative diseases (Gao et al., 2023). Based on the common outcome of neurodegenerative diseases and the research evidence that elevated potassium levels lead to myelin destruction (Boerio et al., 2014), our study aimed to elucidate the relationship between serum potassium ions and sNfL from a cross-sectional perspective using a large sample of data from the National Health and Nutrition Examination Survey (NHANES).
2 Materials and methods
2.1 Data sources
The 2013–2014 NHANES datasets were the original information resource for the present analysis. The NHANES database provides a comprehensive range on each participant’s laboratory tests, disease information, human examinations, and population characteristics. The NHANES database ensures data reliability through nationally representative sampling and standardized protocols, the use of the most advanced and reliable techniques of information collection and organizational and statistical methods for data analysis. This data is subsequently subjected to additional analysis and utilized to study risk factors for a variety of diseases. A sophisticated multi-stage probabilistic approach was used in this study to ensure that the samples used are accurate and representative. Each participant signed up an informed agreement and the qualification of human subjects in NHANES was approachable via the National Center for Health Statistics (NCHS) Ethics Review Board.
2.2 Research population
In this research, a total of 10,175 individuals were chosen from the NHANES 2013–2014 dataset, as depicted in Figure 1. Exclusions were made for participants with incomplete age data under 20 years (n = 4,406), missing educational information (n = 7), unknown marital status (n = 3), and lacking economic data (n = 699). Additionally, subjects with incomplete data on various factors such as BMI (n = 201), smoking habits (n = 1), alcohol consumption (n = 400), CVD (n = 13), hypertension (n = 3), hyperlipidemia (n = 26), and diabetes (n = 2) were also ruled out. The study’s criteria necessitated a dataset that included both serum potassium and sNfL levels; hence, those without serum potassium data (n = 170) and those without sNfL data (n = 2,574) were not considered. Consequently, the final analysis comprised 1,670 participants (Figure 1).
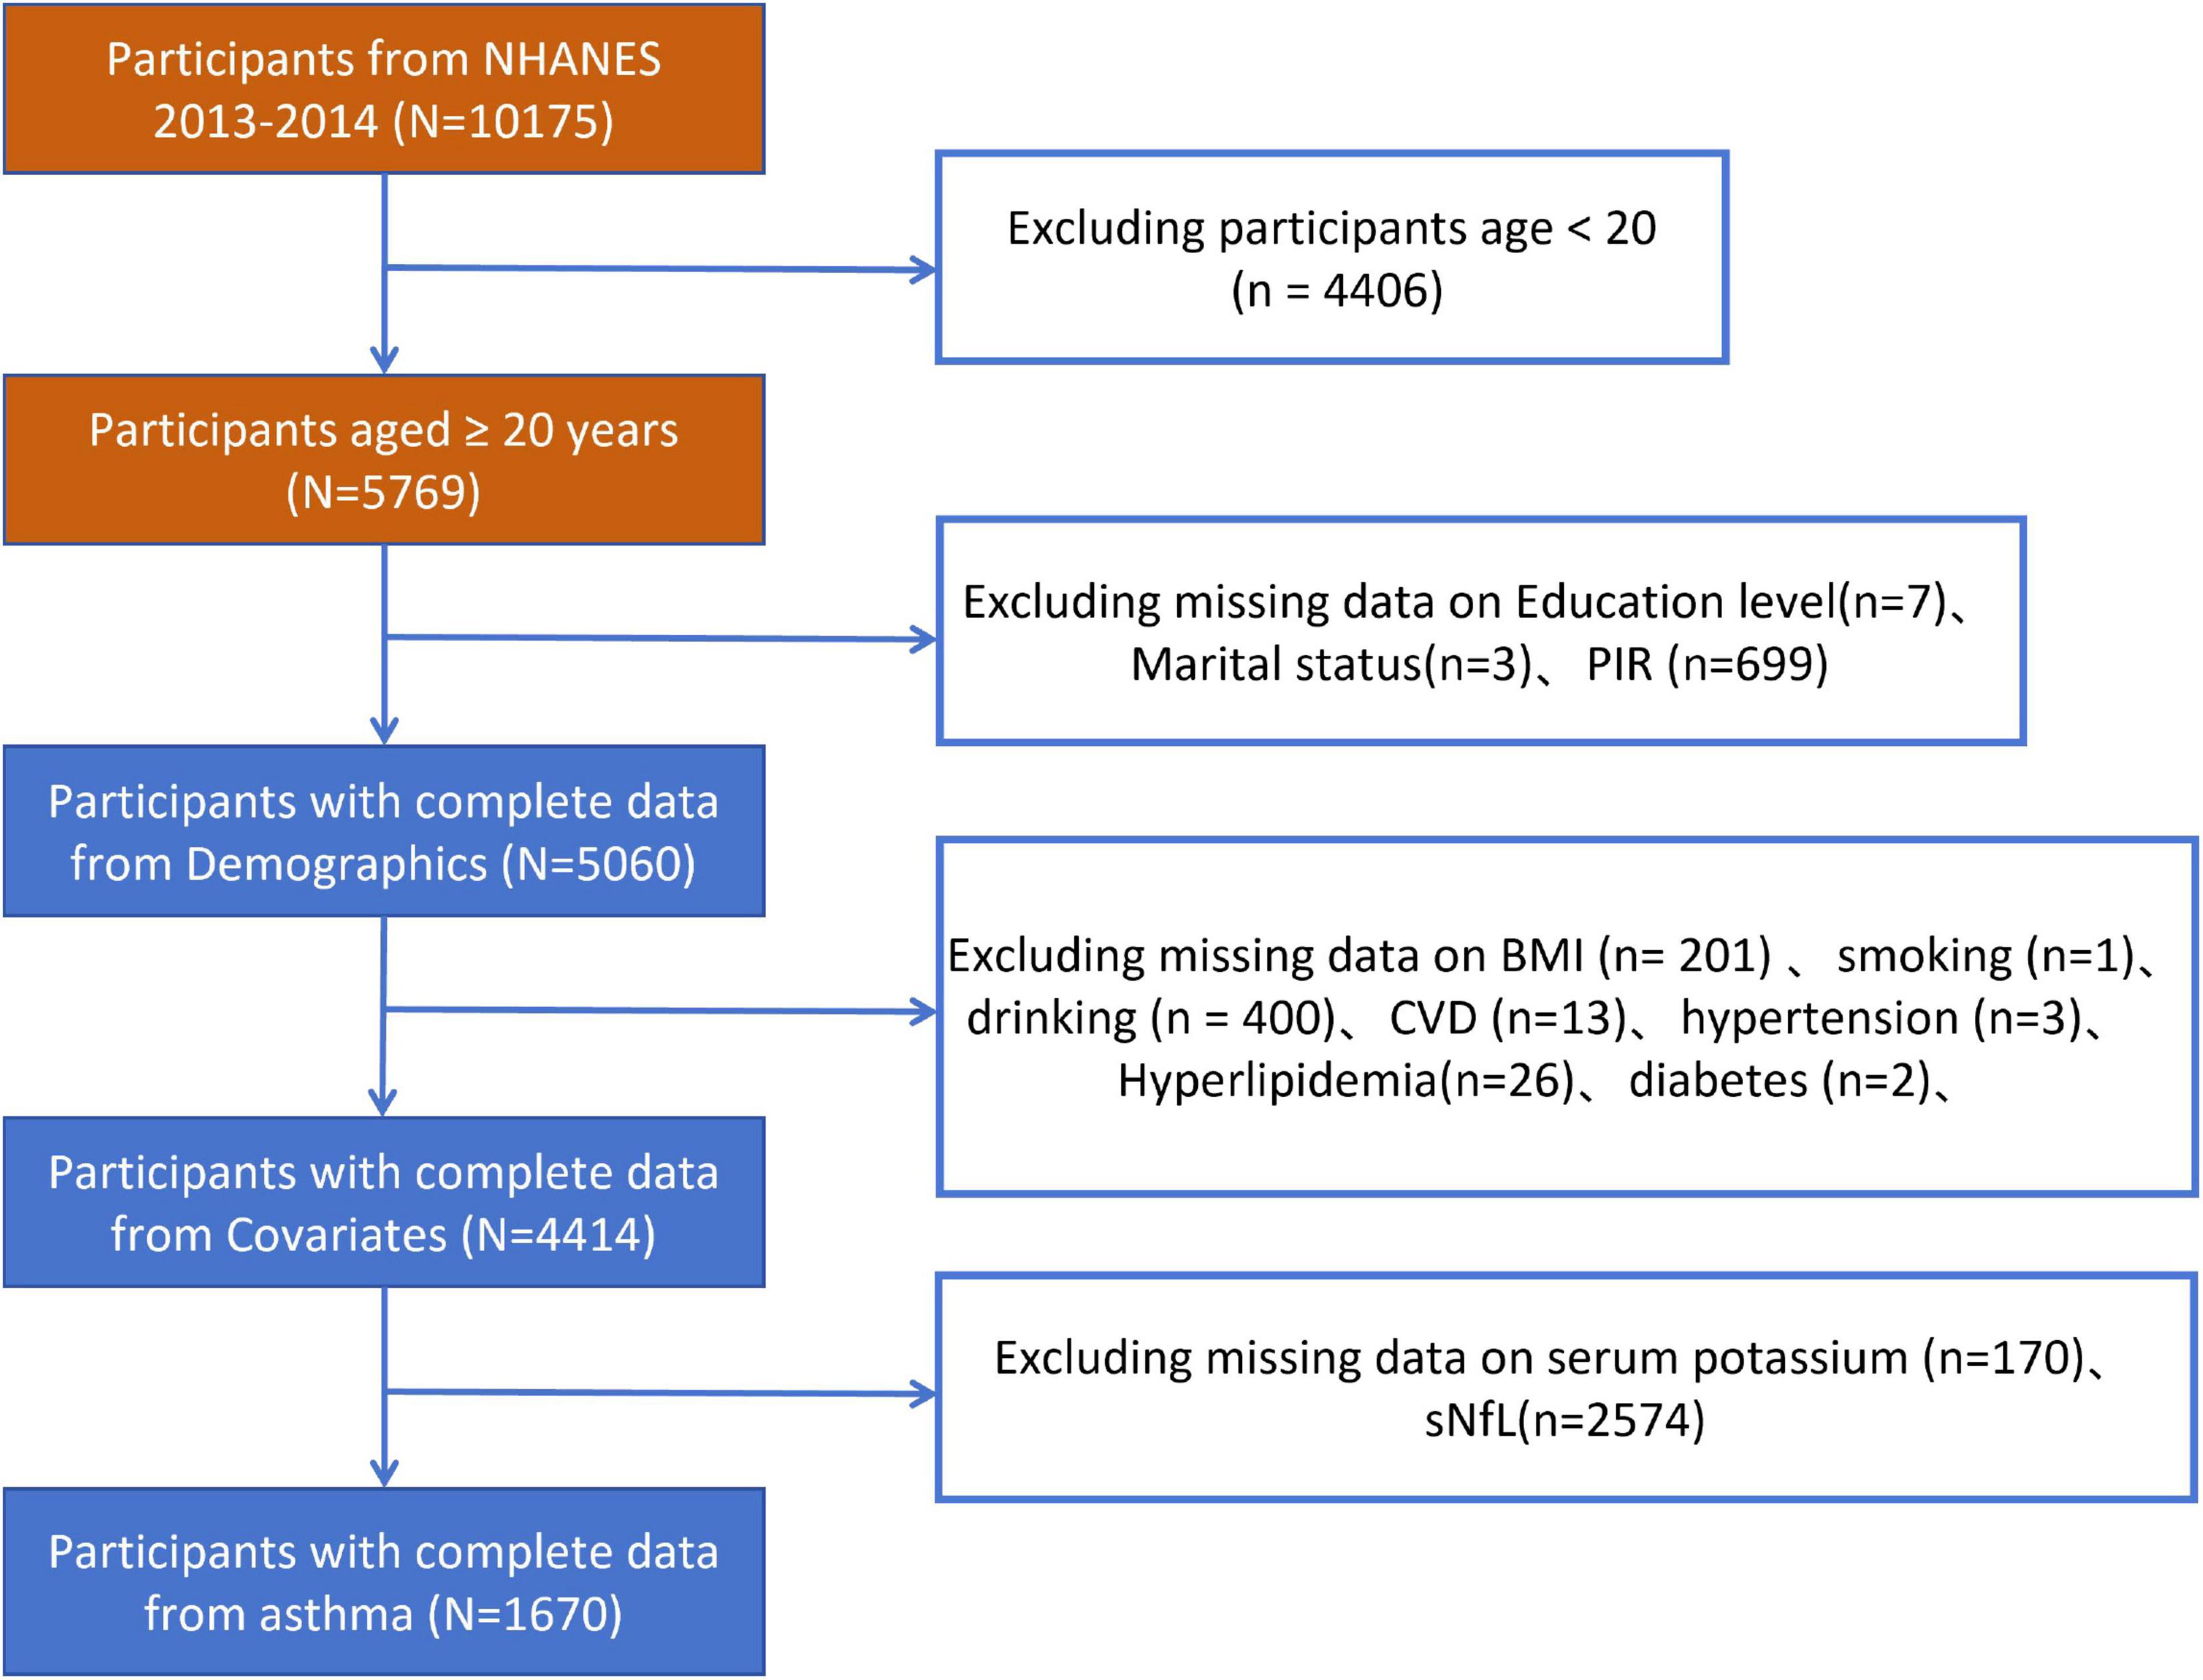
Figure 1. Flowchart depicting participant selection in the study.
2.3 Definition of exposed variables and outcome variable
The measurement step of sNfL levels was performed on the high-throughput fully automated immunoassay platform Atellica, based on a highly sensitive immunoassay developed by Siemens Healthineers. In the NHANES database for the period 2013–2014, participants aged 20–75 years were included, and their serum samples were measured and processed at mobile examination centers. These participants agreed to preserve their blood samples for further study analysis, while their original serum samples were also securely stored. For more information and detailed agreements, please visit the following link: http://wwwn.cdc.gov/Nchs/Nhanes/2013-2014/SSSNFL_H.htm. The minimum limit of quantification (LLOQ) for this assay was set at 3.9 pg/ml, which was derived from the analysis of replicate test results from 44 low-concentration neurofilament protein light chain (NfL) samples. The criterion for determining LLOQ is that the coefficient of variation (CV) does not exceed 20%. For analytes that measure below LLOQ, the result field should be populated with an imputation value equal to LLOQ divided by root number 2. For analytes that measure more than ULOQ, the result field should be populated with a value equal to ULOQ multiplied by the root number 2. The concentration of potassium is determined by measuring the ionic activity in the solution. The DxC800 instrument uses ion-selective electrode (ISE) technology to determine potassium levels in biological fluid samples, either indirectly or diluted. The potassium electrode used by the device contains a valinomycin membrane that is able to sense potassium ions and produce a potential change that follows the Nernst equation, which allows the concentration of potassium in solution to be calculated.
2.4 Covariates
Covariates in this investigation were variables that might affect the relationship between the levels of serum potassium and sNfL. Covariates considered in this study included sociodemographic factors including age (≤40, 41–60, >60), educational level (high school graduate/GED or equivalent, college graduate or above, less than 12th grade), ethnicity (other Hispanic, other race, non-Hispanic black, non-Hispanic white, and Mexican American), family poverty income ratio (PIR) (≤1.0, 1.1–4.0, >4.0), and marital condition (living alone, married and living with partner). The researchers also included health related factors, hypertension, diabetes, alcohol consumption, physical activity, smoking status, hyperlipidemia, and cardiovascular diseases (all described as yes/no). PIR is the measurement of socioeconomic position, defined as the ratio of income to the United States Census Bureau’s poverty level for a family. Individuals are classified as present smokers, never smokers, and former smokers based on “Do you personally use cigarette or tobacco?” and “Smoked more than 100 cigarettes in your lifetime.” Based on “Drink at least twelve times in a lifetime or a year,” the definition of a drinker includes current, never, and former drinkers. According to questionnaire information, self-reported disease was also considered, including diabetes. The diagnosed of cardiovascular disease, hypertension, and hyperlipidemia was regarded as the basis of a self-reported history of specific diseases. The definition of cardiovascular disease includes coronary heart disease, stroke, congestive heart failure, angina, and heart attack. Laboratory data include alanine aminotransferase, aspartate aminotransferase, alkaline phosphatase, total calcium, chloride, uric acid, direct HDL-cholesterol, triglyceride, LDL-cholesterol, and total cholesterol.
2.5 Statistical methods
Continuous and categorical variables were used to characterize participants at baseline. Continuous ones are described in terms of mean ± standard deviation and categorical variables are described by numbers and percentages. Weighted t-tests and Chi-square tests were conducted for comparisons of baseline characteristics among these participants. By assessing the corrected OR and 95% CI, the study conducted the weighted linear regression model, to investigate the connection between serum potassium level and sNfL among patients. Three models were used by us with varying degrees of modification for covariates (model 1, unadjusted for covariates; model 2, modified for age, gender, race, education level, marital status, and PIR; and model 3, with adjustments for age, gender, race, education level, marital status, PIR, smoking status, alcohol use, hypertension, diabetes, cardiovascular disease, and laboratory test indicators. In all three models, continuous variable serum potassium was used by our researchers. In addition, dose-response association between serum potassium and sNfL among patients assessed by using restricted cubic spline (RCS). The multiple linear regression models included the continuous and categorical models. The serum potassium was divided into tertiles, and then the linear trends were conducted via considering the median value of every subgroup as the continuous variable. In addition, our researchers conducted the subgroup analyses by general information, disease condition, alcohol consumption, smoking status, physical activity, and interaction analyses were performed to examine whether there were different associations between subgroups. R 4.3.3 and SPSS 26.0 were used for all statistical analyses carried out in this investigation. In terms of statistics, a bilateral P-value of less than 0.05 was deemed significant.
3 Result
3.1 Baseline characteristics of participants
This study recruited 10,175 individuals from NHANES 2013–2014. The flowchart of participant inclusion and exclusion is shown in Figure 1. People with incomplete information on age <20 years, sociodemographic data, covariates were excluded, and the remaining 4,414 participants were retained. In addition, after excluding participants who had incomplete data on serum potassium, the remaining 4,244 participants were considered in our investigation. After excluding incomplete data on sNfL, the information of the remaining 1,670 participants was retained. The characteristics of participants involved in this investigation at baseline were presented in Table 1. A total of 872 women (50.5%) and 798 men (49.5%) were included in the study. Significant differences were observed between males and females in marital status, smoking, alcohol consumption, hypertension, intense physical exercise, body mass index, aspartate aminotransferase levels (SAS), alanine aminotransferase levels (SAT), total calcium levels (CA), cholesterol levels (CH), chloride levels (CL), uric acid levels (UA), high-density lipoprotein levels, total cholesterol levels (TC), and triglyceride levels (TG). The median serum potassium concentration was 4.0 mmol/L and the median sNfL was 12.3 pg/ml.
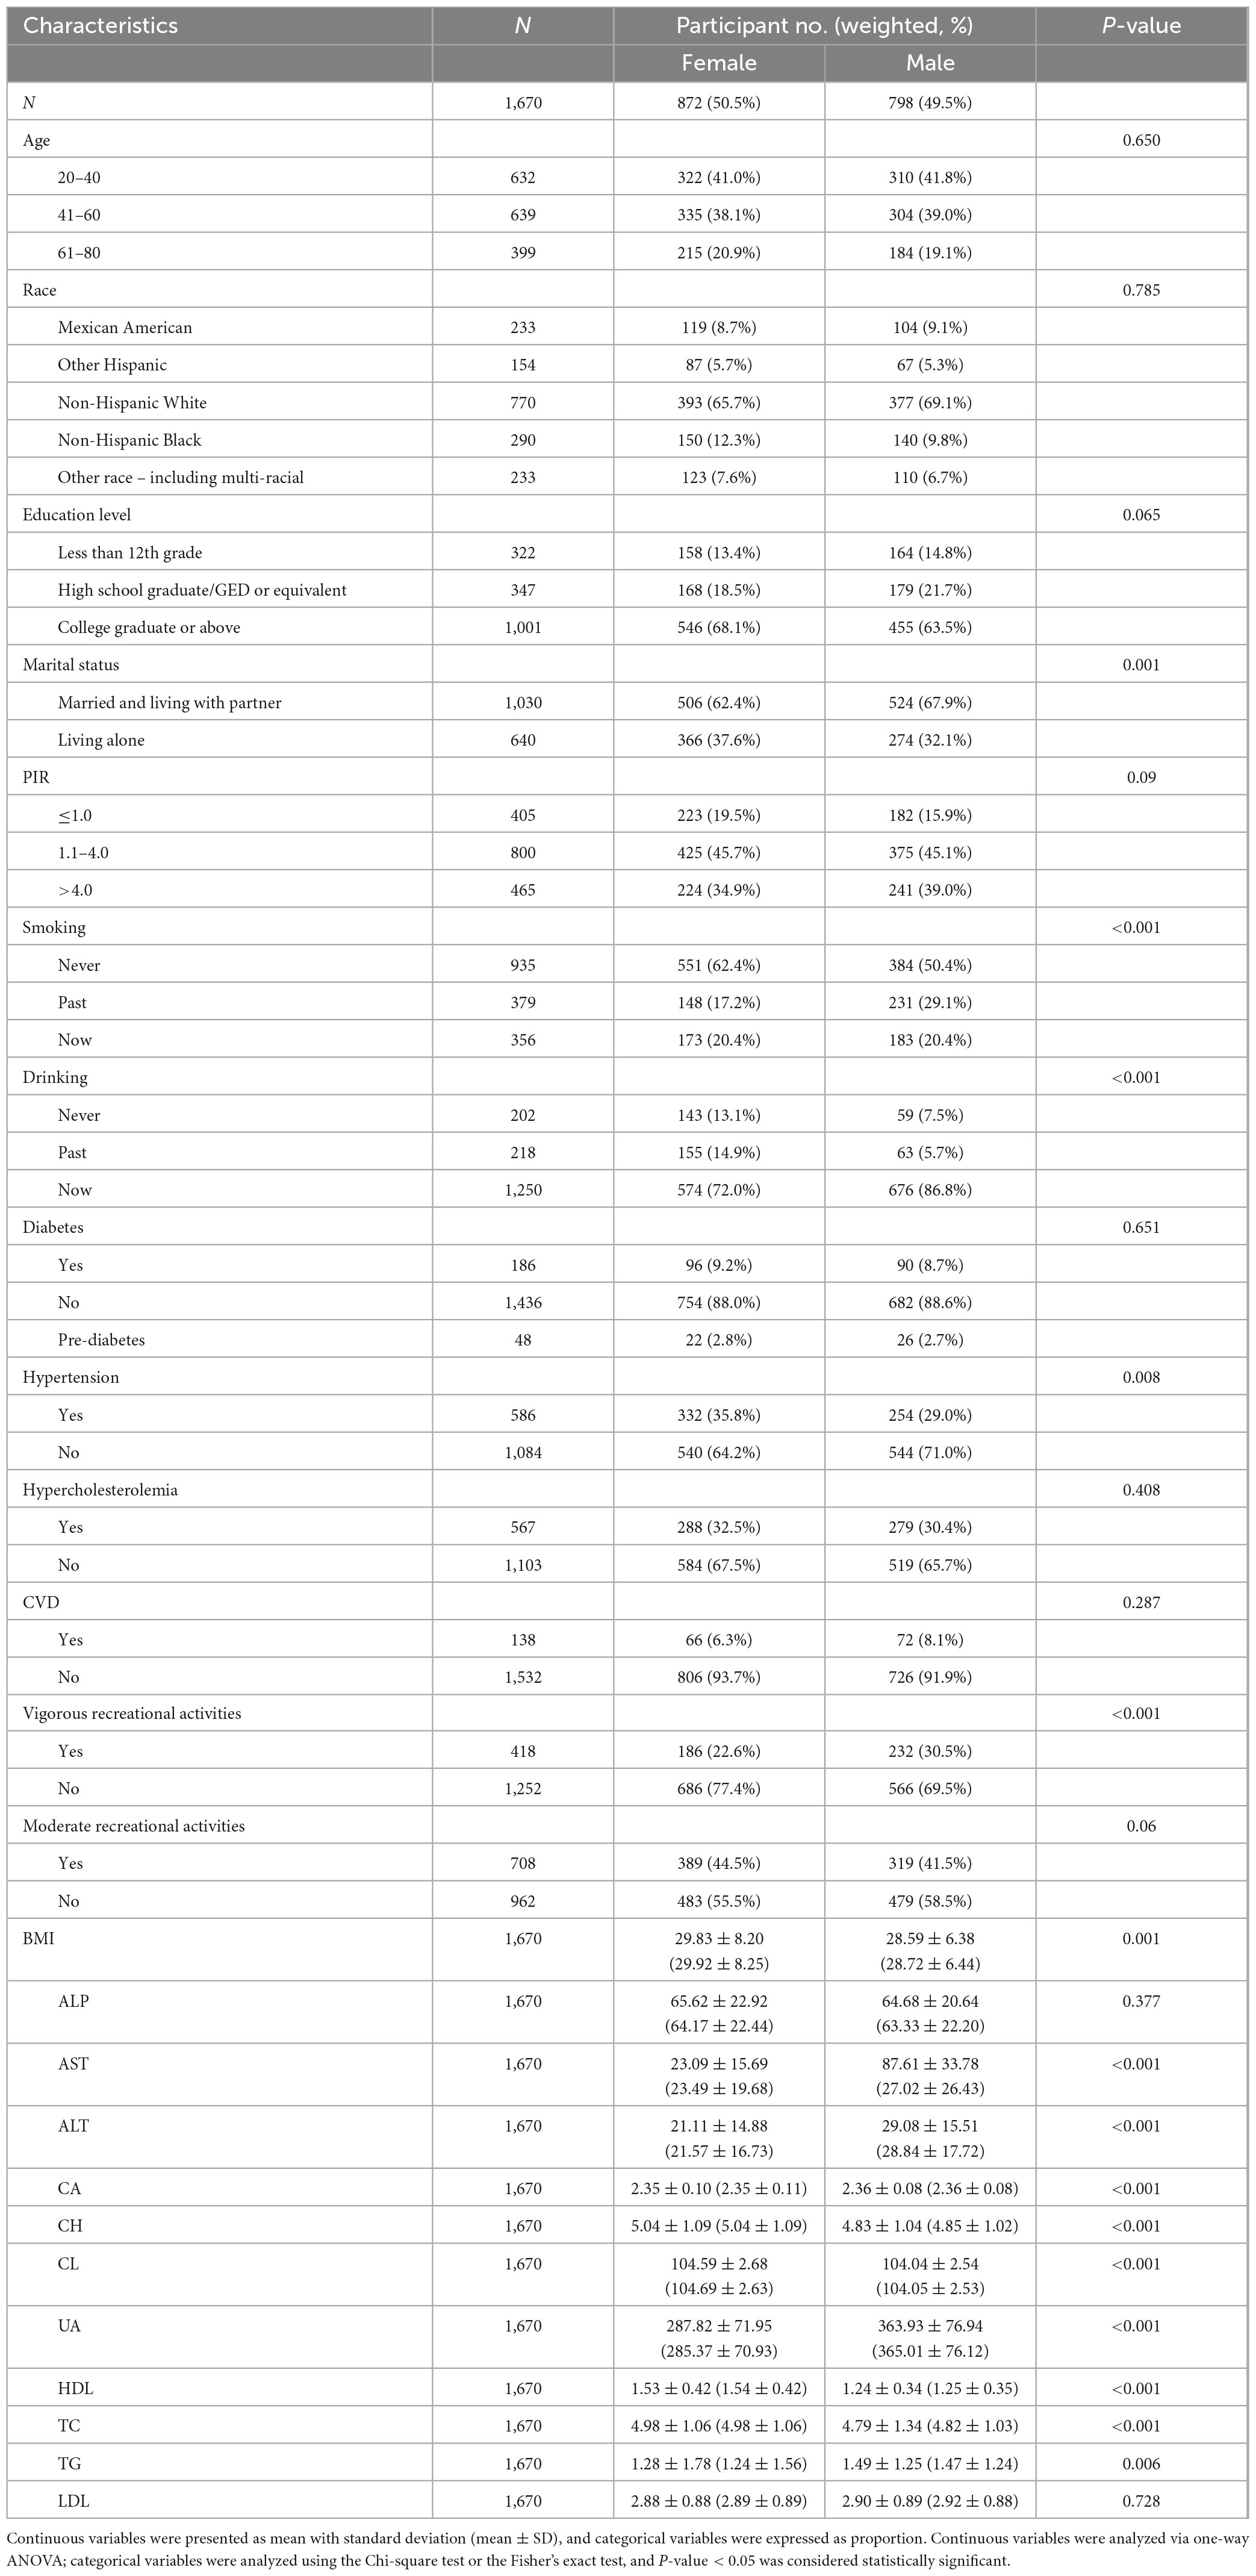
Table 1. Baseline characteristics of participants based on sNfL.
3.2 Association between serum potassium and sNfL
This crude model showed a significant association between serum potassium levels and sNfL levels, with a 6.87 increase in sNfL for each unit increase in serum potassium (β = 6.87, 95% CI: 4.05–9.68, P < 0.001). Model 2 adjusted for sociodemographic factors (marital status, poverty rate, race, age, sex, and education level) and showed a 4.87 increase in sNfL (β = 4.87, 95% CI: 2.09–7.66, P < 0.001). Model 3 was further adjusted from model 2 for BMI, smoking status, alcohol use, cardiovascular disease, vigorous recreational activities, moderate recreational activities, hypertension, hyperlipidemia, diabetes and laboratory test indicators as covariates, and the results showed a significant increase in sNfL of 5.15 per unit increase in serum potassium (β = 5.15, 95% CI: 2.25–8.04, P < 0.001).
As shown in Table 2, serum potassium was also categorized in three equal parts and compared with the first part used as a reference. In all three models, there was a significant dose-response trend with increasing serum potassium (P < 0.05 for trend). Specifically, in model 1, sNfL increased by 4.36 units in the Q3 group compared with the Q1 group (β = 4.36, 95% CI: 1.86–6.85, P < 0.001). In model 2, sNfL increased by 2.87 units in group Q3 compared with group Q1 (β = 2.87, 95% CI: 0.41–5.33, P = 0.021). In model 3, sNfL increased by 2.86 units in group Q3 compared with group Q1 (β = 2.86, 95% CI: 0.33–5.39, P = 0.027). Although the increasing trend in model 3 was reduced compared to models 1 and 2, the association was still statistically significant. In addition, in Figure 2, the non-linear relationship between serum potassium and sNfL was explored using RCS curve regression. Figure 2 shows the results of multiple linear regression using RCS, revealing linear and positive correlations between serum potassium and sNfL levels in models 1, 2, and 3 (model 1 P for non-linearity = 0.002, model 2 P for non-linearity = 0.008, and model 3 P for non-linearity = 0.028).
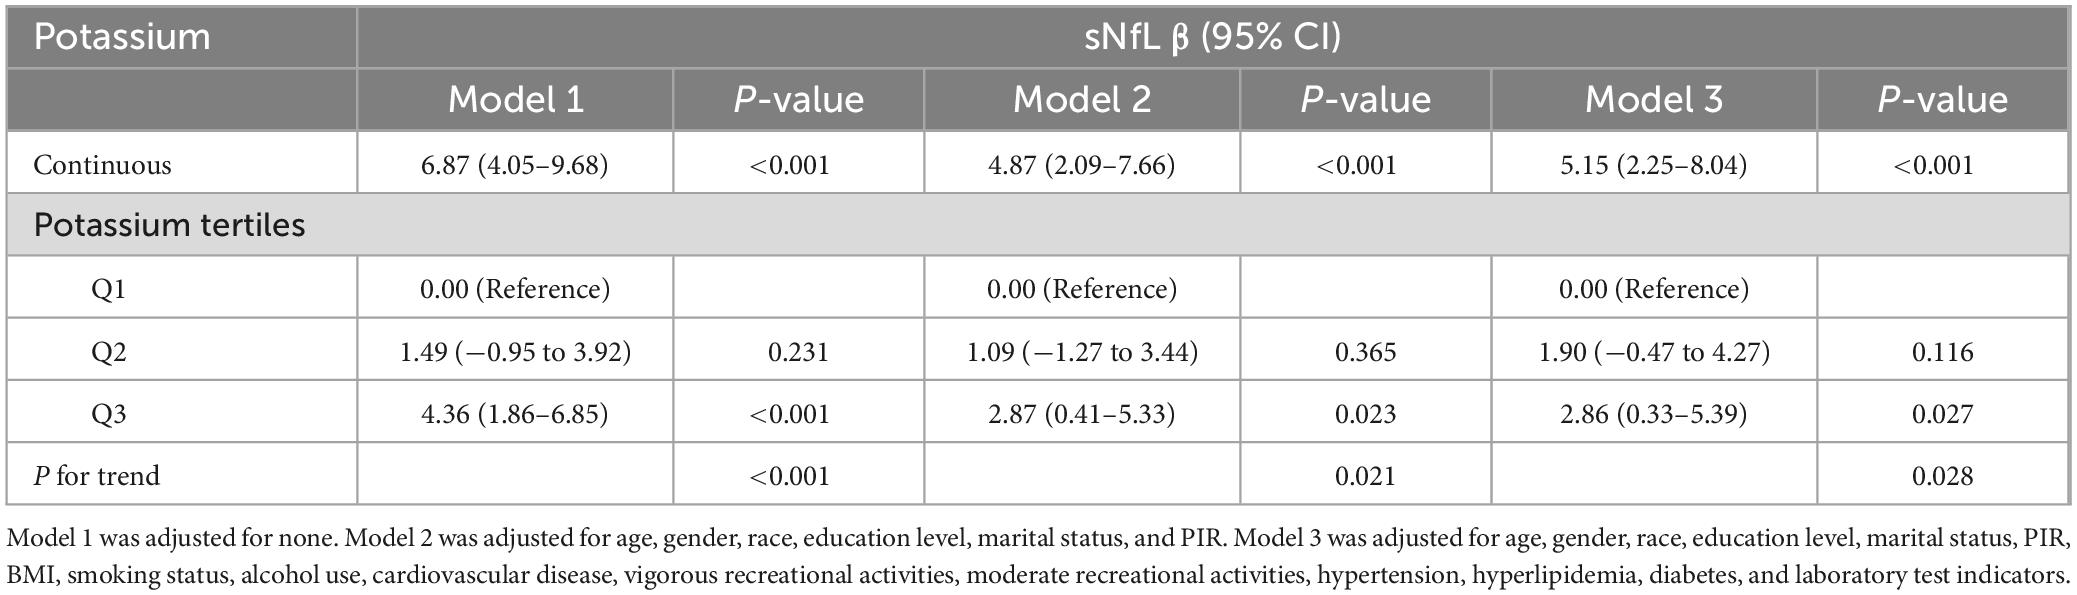
Table 2. Weighted regression models and trend tests elucidating the association between potassium and sNfL.
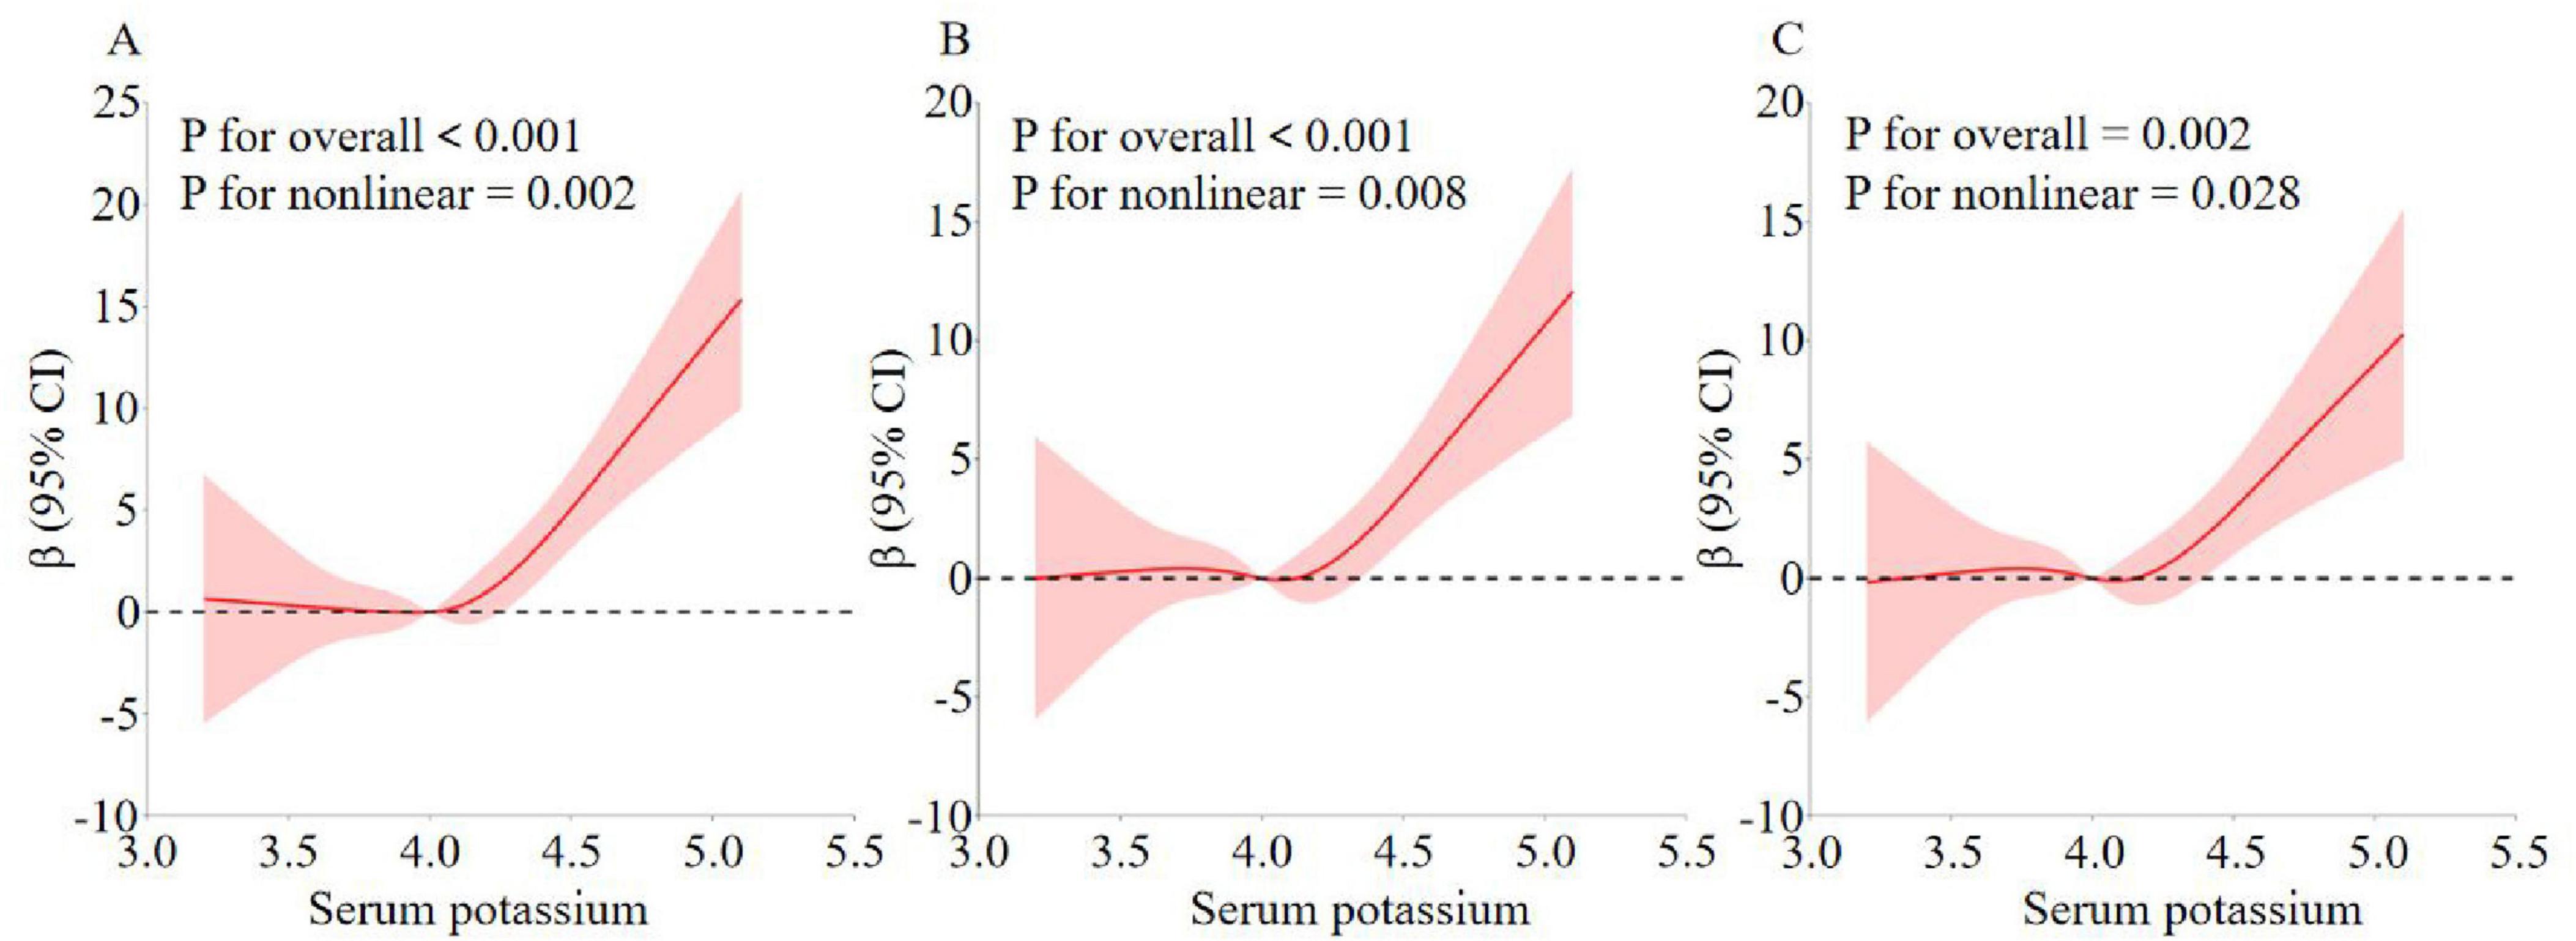
Figure 2. Analysis of the measured response relationship between potassium and sNfL. (A) Model 1 was adjusted for none. (B) Model 2 was adjusted for age, gender, race, education level, marital status, and PIR. (C) Model 3 was adjusted for age, gender, race, education level, marital status, PIR, BMI, smoking status, alcohol use, cardiovascular disease, vigorous recreational activities, moderate recreational activities, hypertension, hyperlipidemia, diabetes, and laboratory test indicators. The solid red line indicates the OR and the red shaded area indicates the 95% CI.
3.3 Subgroup analysis
To further explore the factors influencing the association between serum potassium and sNfL, we executed a stratified analysis, factoring in a spectrum of sociodemographic determinants(gender, age, ethnicity, educational attainment, marital status, and economic disparity), smoking, alcohol consumption, physical activity, and disease status (hypertension, hyperlipidemia, diabetes, and CVD). The nuanced relationships, elucidated through weighted logistic regression and detailed in Table 3, indicated a lack of significant interaction between serum potassium and sNfL across gender (P = 0.325), age (P = 0.957), education (P = 0.467), marital status (P = 0.950), smoking (P = 0.731), cardiovascular disease (P = 0.110), and hyperlipidemia (P = 0.223) strata.
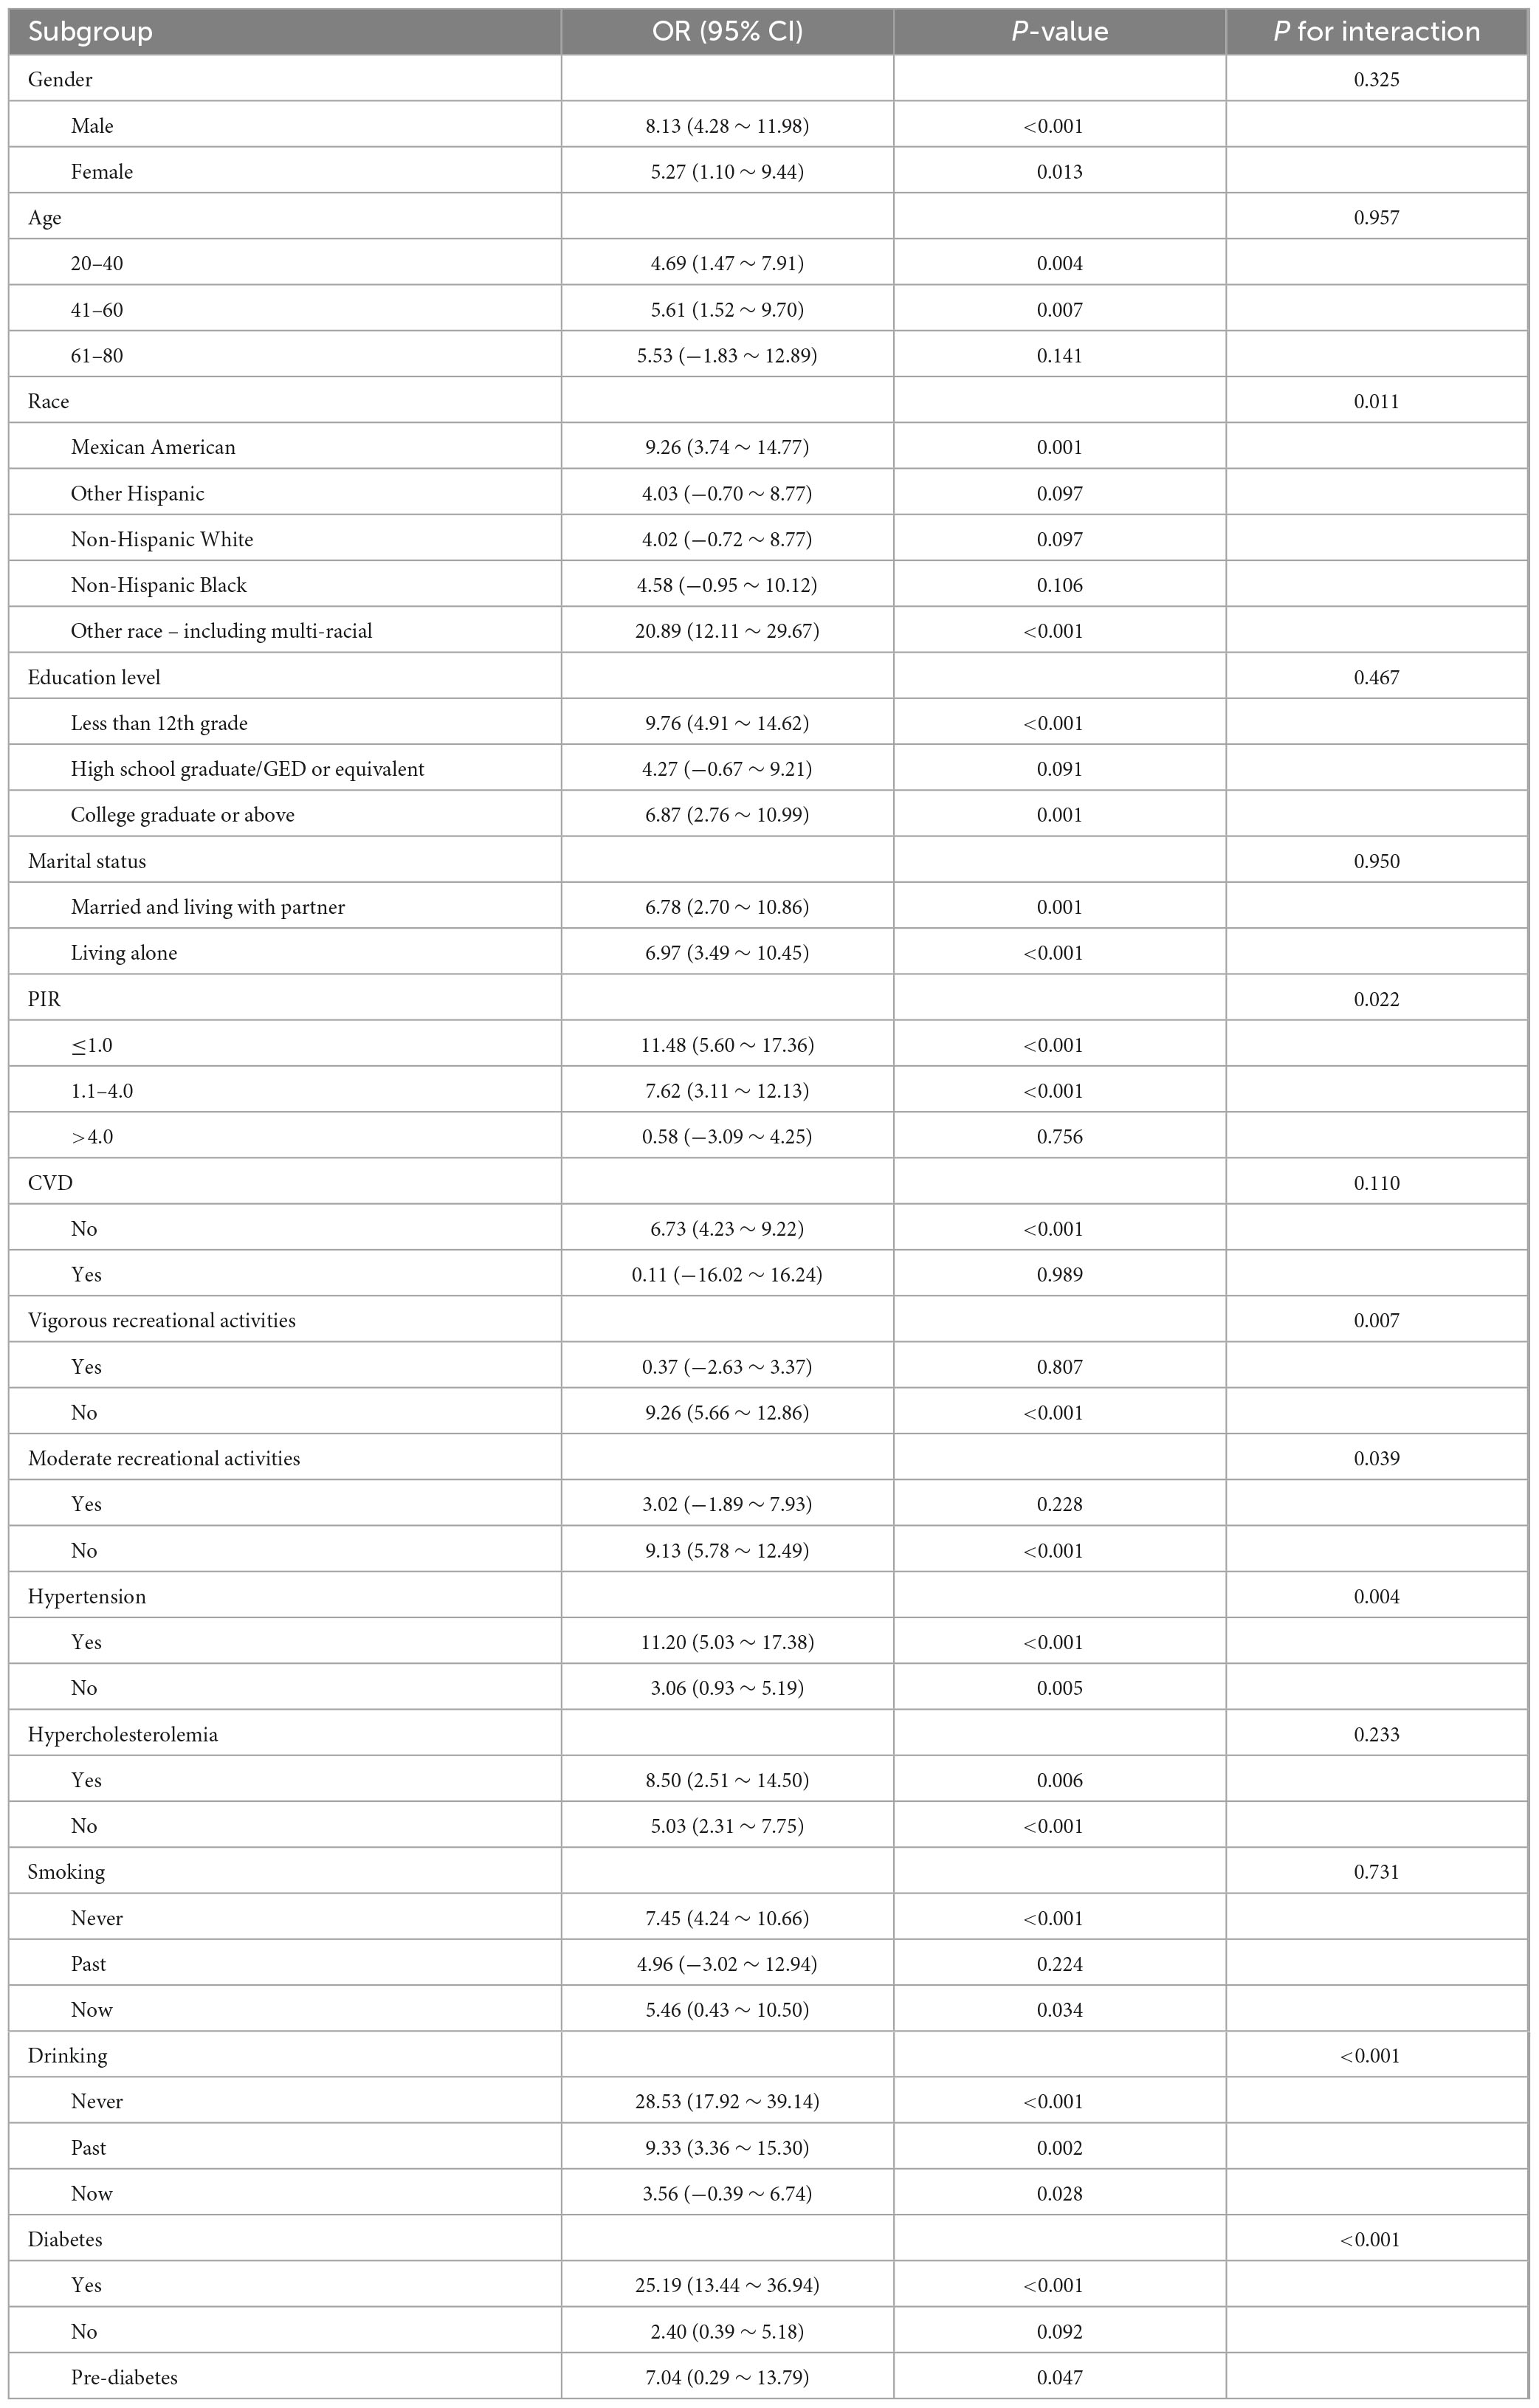
Table 3. Subgroup analysis of the association between potassium and sNfl.
Within the ethnic groups, robust positive correlations between serum potassium and sNfL were exclusively noted among Mexican American individuals (β = 9.26, 95% CI: 3.74–14.77, P = 0.001) and those of other ethnicities (β = 20.89, 95% CI: 12.11–29.67, P < 0.001). Economic status, as gauged by the poverty-to-income ratio (PIR), revealed significant positive associations within the low-income (β = 11.48, 95% CI: 5.60–17.36, P < 0.001) and middle-income (β = 7.62, 95% CI: 3.11–12.13, P < 0.001) cohorts. In the subgroup of alcohol consumption, the most pronounced positive correlation was detected among those who had never consumed alcohol (β = 28.53, 95% CI: 17.92–39.14, P < 0.001). In the physical activity subgroup, a significant positive correlation between serum potassium and sNfL was observed in participants without vigorous or moderate physical activity (β = 9.26, 95% CI: 5.66–12.86, P < 0.001; β = 9.13, 95% CI: 5.78–12.49, P < 0.001). Furthermore, pronounced positive associations were identified among participants with hypertension (β = 11.20, 95% CI: 5.03–17.38, P < 0.001) and diabetes (β = 25.19, 95% CI: 13.44–36.94, P < 0.001).
4 Discussion
Our investigation primarily examined the correlation between the serum potassium and sNfL among the American adults using the NHANES database. This research involved in a sample size of 1,670 individuals. Weighted multifactorial liner regression analysis revealed the positive and statistically significant association observed between serum potassium and sNfL in American adult individuals after all covariates with control. Besides, RCS curves revealed a non-linear positive association between the serum potassium and sNfL the American adult individuals. Furthermore, the level of sNfL increased progressively with increasing serum potassium tertiles. Subgroup analyses revealed no significant interaction effects among gender, age, education, marital status, smoking status, cardiovascular disease, hyperlipidemia, but the statistical relationship between serum potassium and sNfL remained consistent. However, the association was affected in specific ethnic groups (Mexican Americans and other races), low-to-middle income participants, those who had never consumed alcohol and were inactive, and participants with hypertension and diabetes.
Physical activity transiently alters serum potassium levels via intracellular shifts during muscle contraction and renal excretion, as well as influencing potassium excretion through urinary discharge and sweating, resulting in a non-significant increase in sNfL levels in physically active people. Patients with diabetes mellitus, especially those with chronic kidney disease (CKD), are prone to disorders of potassium metabolism, especially hyperkalemia due to the progression of renal disease or the use of renin-angiotensin-aldosterone blockers, and also in diabetic patients themselves in the hyperglycemic state, where the polyol pathway is activated, leading to intracellular accumulation of sorbitol, which in turn leads to peripheral neuropathy and the consequent elevation of serum sNfL. Based on the common background of hyperkalemia and nerve injury in diabetic patients, the problem of nerve injury in patients with diabetes mellitus combined with hyperkalemia deserves more attention from us in the future. In hypertensive patients, elevated blood pressure may impair renal function and affect potassium excretion, thus leading to elevated serum potassium, so the relationship between elevated serum potassium and sNfL is more pronounced in the hypertensive population. Alcohol consumption usually leads to electrolyte disorders, and people who have consumed alcohol usually have poor dietary habits that affect potassium balance, resulting in a less significant association between elevated serum potassium and sNfL in this population. Studies have shown that smoking may indirectly affect kidney function (Mortensen et al., 2011), such as a decrease in glomerular filtration rate or a decrease in the ability of the tubules to secrete potassium, leading to an increase in the excretion of potassium ions from the body, which further reduces the potassium level in the blood. Smoking may therefore be a risk factor for hyperkalemia, and it remains inconclusive whether it ultimately leads to an increase or decrease in neurofilament chain protein. Meanwhile, it has been demonstrated that elevated serum potassium levels in patients with chronic heart failure can also indirectly lead to neurological damage by promoting oxidative stress and inflammatory responses (Aldahl et al., 2017). In addition, disorders of lipid metabolism are recognized as major risk factors for many neurodegenerative diseases, including AD and PD. Disorders of lipid metabolism in the brain are closely associated with the pathological progression of these diseases (Wei et al., 2023) and may affect the levels of neurofilament chain proteins, but the exact mechanisms are not fully understood. And current studies do not provide sufficient evidence to establish a direct link between changes in lipid levels and serum potassium ion levels.
Elevated levels of sNfL, a biomarker of axonal damage, reflect the extent of neuronal axonal damage, which has been studied in a variety of neurological disorders. Elevated blood potassium may lead to elevated sNfL levels reflecting increased nerve cell damage through several mechanisms. First, it has been demonstrated that cerebellar granule neurons undergo rapid apoptosis in media with a high potassium environment (Harris et al., 2002). Elevated blood potassium levels can affect the excitability of neuronal cells, leading to neuronal hyperexcitability, and this hyperexcitability can trigger a series of biochemical responses that activate the MAPK and PI3K/Akt signaling pathways. The activated MAPK signaling pathway can affect cellular response to injury, including promotion of apoptosis (Teos et al., 2008; Yang et al., 2022). Whereas the PI3K/Akt signaling pathway plays a key role in regulating cell survival and apoptosis, its activation can lead to increased apoptosis (Devader et al., 2015), implying that neuronal overexcitability may trigger neuronal cell injury or death, which leads to elevated sNfL. Second, voltage-gated potassium channels in the nervous system are de-regulated by an anchor protein, which recruits other membrane proteins and ion channels to specific subcellular structural domains, and then stabilizes these subcellular structural domains through the interaction of the anchor protein with the submembrane spectrin cytoskeleton (Lazarov et al., 2018; Stevens and Rasband, 2022). The ionic concentration gradient inside and outside the nerve cell is altered in hyperkalemic states, and this alteration may affect cytoskeletal stability. Abnormalities in the cytoskeleton may lead to abnormal aggregation or degradation of neurofilament proteins, which are the major cytoskeletal proteins of neuronal axons, and their abnormal aggregation or degradation releases the light-chain subunit of neurofilament proteins (sNfL) into the cerebrospinal fluid and the blood circulation. sNfL serves as a biomarker for axon damage, and its elevated level reflects the extent of neural axon damage. Therefore, hyperkalemia may cause abnormal aggregation or degradation of neurofilament proteins by affecting cytoskeletal stability, which in turn causes increased release of sNfL, as has been demonstrated in a variety of neurological disorders. In addition, hyperkalemia may affect cell signaling pathways, such as activating microglia by activating N-methyl-D-aspartate (NMDA) receptors and increasing calcium inward flow, and may also activate microglia by increasing the release of inflammatory factors, such as tumor necrosis factor-alpha (TNF-alpha) and interleukin-6 (IL-6), which can directly stimulate microglia, prompting them to produce more inflammatory mediators, further exacerbating neuroinflammation and causing nerve damage (Bagheri-Yarmand et al., 2021; Liu et al., 2024; Merighi et al., 2022). Finally, hyperkalemia may trigger oxidative stress through several aspects, including affecting the process of intra- and extracellular ion exchange, leading to changes in cellular membrane potential and affecting normal cellular function and the normal operation of antioxidant defense mechanisms; the ionic changes triggered by hyperkalemia may also lead to mitochondrial dysfunction, affecting the process of oxidative phosphorylation, which may increase the production of reactive oxygen species (ROS); hyperkalemia can also affect the activity of antioxidant enzymes, such as superoxide dismutase (SOD) and catalase (CAT), which are the main defense mechanisms for scavenging ROS in the body. The accumulation of ROS exceeds the body’s antioxidant capacity, leading to oxidative stress (Al-Owais et al., 2015; Koong et al., 1993; Udensi and Tchounwou, 2017). These triggered oxidative stresses, which produce large amounts of ROS, can cause oxidative damage to nerve cells, which in turn leads to cell death. The combination of all these mechanisms can lead to nerve cell damage, which in turn leads to elevated sNfL levels.
In the realm of metal ions and neurological diseases, research exploring the link between potassium and axonal degeneration has been particularly active. This research focuses the potential role of serum potassium concentration, providing a valuable foundation for doctors to better manage and control these two biomarkers while minimizing the interference of confounding factors. The research also had several limitations; the cross-sectional report cannot determine a causal relationship between serum potassium levels and sNfL. Secondly, the research was limited to inhabitants in the United States and was not representative of the population as a whole, so the findings cannot be generalized to other populations with different health behaviors and hazard factors. In addition, the data of sNfL in NHANES was only collected from 2013 to 2014, which precluded further validation using NHANES data from the remaining time periods.
According to the current investigation, we found that among American adults, the greater serum potassium levels were linked to the higher level of sNfL, even following the adjustment for confounding variables.
5 Conclusion
The investigation found a significant positive correlation between serum potassium concentration and sNfL among adults in the United States. Higher serum potassium concentration was connected with the higher level of sNfL. Our findings suggest that elevated serum potassium levels may contribute to axonal degeneration. The potential utility of serum potassium concentration evaluation in identifying axonal degeneration underscores the clinical significance of our findings. Routine assessment of serum potassium may aid in early identification of individuals at risk for axonal degeneration-related diseases and guide personalized prevention strategies.
Data availability statement
The original contributions presented in this study are included in this article/supplementary material, further inquiries can be directed to the corresponding authors.
Ethics statement
The studies involving humans were approved by the NCHS Research Ethics Review Board. The studies were conducted in accordance with the local legislation and institutional requirements. Written informed consent for participation was not required from the participants or the participants’ legal guardians/next of kin in accordance with the national legislation and institutional requirements.
Author contributions
YK: Data curation, Formal Analysis, Investigation, Methodology, Project administration, Writing – original draft, Writing – review & editing. YT: Data curation, Formal Analysis, Investigation, Methodology, Project administration, Writing – original draft, Writing – review & editing. BC: Data curation, Formal Analysis, Investigation, Methodology, Project administration, Writing – original draft, Writing – review & editing. CL: Data curation, Writing – original draft. HC: Funding acquisition, Resources, Supervision, Validation, Writing – review & editing. LS: Funding acquisition, Resources, Supervision, Validation, Writing – review & editing.
Funding
The author(s) declare financial support was received for the research and/or publication of this article. This research is financially supported by the project from Natural Science Research in Shanxi Province (202103021224350 and 202203021211247) and Shanxi Bethune Hospital Research Fund (2021YJ03).
Acknowledgments
We are grateful to the Natural Science Foundation of Shanxi Province for supporting this project.
Conflict of interest
The authors declare that the research was conducted in the absence of any commercial or financial relationships that could be construed as a potential conflict of interest.
Generative AI statement
The author(s) declare that no Generative AI was used in the creation of this manuscript.
Publisher’s note
All claims expressed in this article are solely those of the authors and do not necessarily represent those of their affiliated organizations, or those of the publisher, the editors and the reviewers. Any product that may be evaluated in this article, or claim that may be made by its manufacturer, is not guaranteed or endorsed by the publisher.
References
Aamodt, W., Waligorska, T., Shen, J., Tropea, T., Siderowf, A., Weintraub, D., et al. (2021). Neurofilament light chain as a biomarker for cognitive decline in Parkinson disease. Mov. Disord. 36, 2945–2950. doi: 10.1002/mds.28779
Abdelhak, A., Benkert, P., Schaedelin, S., Boscardin, W., Cordano, C., Oechtering, J., et al. (2023). Neurofilament light chain elevation and disability progression in multiple sclerosis. Jama Neurol. 80, 1317–1325.
Abu-Rumeileh, S., Abdelhak, A., Foschi, M., D’Anna, L., Russo, M., Steinacker, P., et al. (2023). The multifaceted role of neurofilament light chain protein in non-primary neurological diseases. Brain 146, 421–437. doi: 10.1093/brain/awac328
Aldahl, M., Jensen, A., Davidsen, L., Eriksen, M., Moller, H., Nielsen, B., et al. (2017). Associations of serum potassium levels with mortality in chronic heart failure patients. Eur. Heart J. 38, 2890–2896.
Al-Owais, M., Dallas, M., Boyle, J., Scragg, J., and Peers, C. (2015). Heme Oxygenase-1 influences apoptosis via CO-mediated inhibition of K+ channels. Adv. Exp. Med. Biol. 860, 343–351. doi: 10.1007/978-3-319-18440-1_39
Arslan, B., and Zetterberg, H. (2023). Neurofilament light chain as neuronal injury marker - What is needed to facilitate implementation in clinical laboratory practice? Clin. Chem. Lab. Med. 61, 1140–1149. doi: 10.1515/cclm-2023-0036
Bagheri-Yarmand, R., Busaidy, N., McBeath, E., Danysh, B., Evans, K., Moss, T., et al. (2021). RAC1 alterations induce acquired dabrafenib resistance in association with anaplastic transformation in a papillary thyroid cancer patient. Cancers (Basel) 13:4950. doi: 10.3390/cancers13194950
Benkert, P., Meier, S., Schaedelin, S., Manouchehrinia, A., Yaldizli, O., Maceski, A., et al. (2022). Serum neurofilament light chain for individual prognostication of disease activity in people with multiple sclerosis: A retrospective modelling and validation study. Lancet Neurol. 21, 246–257. doi: 10.1016/S1474-4422(22)00009-6
Bi, Z., Meng, Y., Ji, Q., Zhang, A., Liu, M., Xu, X., et al. (2024). Association between volatile organic compounds and serum neurofilament light chain in US adults. Sci. Total Environ. 926:171893. doi: 10.1016/j.scitotenv.2024.171893
Bisaglia, M., and Bubacco, L. (2020). Copper ions and Parkinson’s disease: Why is homeostasis so relevant? Biomolecules 10:195. doi: 10.3390/biom10020195
Boerio, D., Bostock, H., Spescha, R., and Z’Graggen, W. (2014). Potassium and the excitability properties of normal human motor axons in vivo. PLoS One 9:e98262. doi: 10.1371/journal.pone.0098262
Brousse, M., Delaby, C., De La Cruz, E., Kuhle, J., Benkert, P., Mondesert, E., et al. (2023). Serum neurofilament light chain cut-off definition for clinical diagnosis and prognosis of amyotrophic lateral sclerosis. Eur. J. Neurol. 30, 1919–1927. doi: 10.1111/ene.15813
Carri, M., Ferri, A., Cozzolino, M., Calabrese, L., and Rotilio, G. (2003). Neurodegeneration in amyotrophic lateral sclerosis: The role of oxidative stress and altered homeostasis of metals. Brain Res. Bull. 61, 365–374.
Chen, M., Liu, Y., Kuo, H., Tsai, S., Hsu, J., Huang, K., et al. (2022). Neurofilament light chain is a novel biomarker for major depression and related executive dysfunction. Int. J. Neuropsychopharmacol. 25, 99–105. doi: 10.1093/ijnp/pyab068
Cicero, C., Mostile, G., Vasta, R., Rapisarda, V., Signorelli, S., Ferrante, M., et al. (2017). Metals and neurodegenerative diseases. A systematic review. Environ. Res. 159, 82–94.
Devader, C., Khayachi, A., Veyssiere, J., Moha, O., Roulot, M., Moreno, S., et al. (2015). In vitro and in vivo regulation of synaptogenesis by the novel antidepressant spadin. Br. J. Pharmacol. 172, 2604–2617. doi: 10.1111/bph.13083
Gaetani, L., Blennow, K., Calabresi, P., Di Filippo, M., Parnetti, L., and Zetterberg, H. (2019). Neurofilament light chain as a biomarker in neurological disorders. J. Neurol. Neurosurg. Psychiatry 90, 870–881.
Gafson, A., Barthelemy, N., Bomont, P., Carare, R., Durham, H., Julien, J., et al. (2020). Neurofilaments: Neurobiological foundations for biomarker applications. Brain 143, 1975–1998.
Gao, Y., Su, D., Xue, Z., Ji, L., and Wang, S. (2023). Association between serum neurofilament light chain and cognitive performance among older adults in the United States: A cross-sectional study. Neurol. Ther. 12, 2147–2160.
Harris, C., Maroney, A., and Johnson, E. (2002). Identification of JNK-dependent and -independent components of cerebellar granule neuron apoptosis. J. Neurochem. 83, 992–1001. doi: 10.1046/j.1471-4159.2002.01219.x
Hwang, Y., Oh, E., Kim, M., Lee, C., Kim, H., Chung, S., et al. (2023). Plasma neurofilament light-chain and phosphorylated tau as biomarkers of disease severity in Huntington’s disease: Korean cohort data. J. Neurol. Sci. 452:120744. doi: 10.1016/j.jns.2023.120744
Jomova, K., Makova, M., Alomar, S., Alwasel, S., Nepovimova, E., Kuca, K., et al. (2022). Essential metals in health and disease. Chem. Biol. Interact 367:110173.
Kawabata, T. (2022). Iron-induced oxidative stress in human diseases. Cells-Basel 11:2152. doi: 10.3390/cells11142152
Koong, A., Giaccia, A., Hahn, G., and Saad, A. (1993). Activation of potassium channels by hypoxia and reoxygenation in the human lung adenocarcinoma cell line A549. J. Cell. Physiol. 156, 341–347. doi: 10.1002/jcp.1041560217
Lai, Y., Gao, F., Ge, R., Liu, R., Ma, S., and Liu, X. (2024). Metal ions overloading and cell death. Cell Biol. Toxicol. 40:72.
Lazarov, E., Dannemeyer, M., Feulner, B., Enderlein, J., Gutnick, M., Wolf, F., et al. (2018). An axon initial segment is required for temporal precision in action potential encoding by neuronal populations. Sci. Adv. 4:u8621. doi: 10.1126/sciadv.aau8621
Liu, F., Zhang, Z., Zhang, L., Meng, R., Gao, J., Jin, M., et al. (2022). Effect of metal ions on Alzheimer’s disease. Brain Behav. 12:e2527.
Liu, J., Liang, Y., Meng, Q., Chen, J., Ma, J., Zhu, H., et al. (2024). Antagonism of beta-arrestins in IL-4-driven microglia reactivity via the Samd4/mTOR/OXPHOS axis in Parkinson’s disease. Sci. Adv. 10:n4845. doi: 10.1126/sciadv.adn4845
Merighi, S., Nigro, M., Travagli, A., and Gessi, S. (2022). Microglia and Alzheimer’s disease. Int. J. Mol. Sci. 23:12990.
Mortensen, M., Wong, L., and Osterloh, J. (2011). Smoking status and urine cadmium above levels associated with subclinical renal effects in U.S. Adults without chronic kidney disease. Int. J. Hyg. Environ. Health 214, 305–310. doi: 10.1016/j.ijheh.2011.03.004
Rossor, A., and Reilly, M. (2022). Blood biomarkers of peripheral neuropathy. Acta Neurol. Scand. 146, 325–331.
Stevens, S., and Rasband, M. (2022). Pleiotropic ankyrins: Scaffolds for ion channels and transporters. Channels (Austin) 16, 216–229. doi: 10.1080/19336950.2022.2120467
Tabet, N., Mantle, D., Walker, Z., and Orrell, M. (2001). Vitamins, trace elements, and antioxidant status in dementia disorders. Int. Psychogeriatr. 13, 265–275.
Tanaka, K., and Kawahara, M. (2017). Copper enhances zinc-induced neurotoxicity and the endoplasmic reticulum stress response in a neuronal model of vascular dementia. Front. Neurosci. 11:58. doi: 10.3389/fnins.2017.00058
Teos, L., Zhao, A., Alvin, Z., Laurence, G., Li, C., and Haddad, G. (2008). Basal and IGF-I-dependent regulation of potassium channels by MAP kinases and PI3-kinase during eccentric cardiac hypertrophy. Am. J. Physiol. Heart Circ. Physiol. 295, H1834–H1845. doi: 10.1152/ajpheart.321.2008
Teunissen, C., Verberk, I., Thijssen, E., Vermunt, L., Hansson, O., Zetterberg, H., et al. (2022). Blood-based biomarkers for Alzheimer’s disease: Towards clinical implementation. Lancet Neurol. 21, 66–77.
Tortosa-Carreres, J., Cubas-Nunez, L., Quiroga-Varela, A., Castillo-Villalba, J., Ramio-Torrenta, L., Piqueras, M., et al. (2024). Predictive potential of serum and cerebrospinal fluid biomarkers for disease activity in treated multiple sclerosis patients. Mult. Scler. Relat. Disord. 88:105734.
Udensi, U., and Tchounwou, P. (2017). Potassium homeostasis, oxidative stress, and human disease. Int. J. Clin. Exp. Physiol. 4, 111–122.
van Tilburg, S., Teunissen, C., Maas, C., Thomma, R., Walgaard, C., Heijst, H., et al. (2024). Dynamics and prognostic value of serum neurofilament light chain in Guillain-Barre syndrome. Ebiomedicine 102:105072. doi: 10.1016/j.ebiom.2024.105072
Wang, K., Barton, D., McQuillan, L., Kobeissy, F., Cai, G., Xu, H., et al. (2024). Parallel cerebrospinal fluid and serum temporal profile assessment of axonal injury biomarkers neurofilament-light chain and phosphorylated neurofilament-heavy chain: Associations with patient outcome in moderate-severe traumatic brain injury. J. Neurotrauma 41, 1609–1627. doi: 10.1089/neu.2023.0449
Wang, L., Yin, Y., Liu, X., Shen, P., Zheng, Y., Lan, X., et al. (2020). Current understanding of metal ions in the pathogenesis of Alzheimer’s disease. Transl. Neurodegener. 9:10.
Wei, J., Wong, L., and Boland, S. (2023). Lipids as emerging biomarkers in neurodegenerative diseases. Int. J. Mol. Sci. 25:131.
Keywords: serum potassium, serum neurofilament light chain, sNfL, NHANES, population-based studies, axonal degeneration
Citation: Kong Y, Tai Y, Chen B, Li C, Chen H and Shi L (2025) Serum potassium level is associated with serum neurofilament light chain in American adult population: a cross-sectional analysis of the 2013–2014 National Health and Nutrition Examination Survey. Front. Aging Neurosci. 17:1511881. doi: 10.3389/fnagi.2025.1511881
Received: 15 October 2024; Accepted: 05 March 2025;
Published: 18 March 2025.
Edited by:
Huazheng Liang, Monash University – Southeast University Joint Research Institute (Suzhou), ChinaReviewed by:
Thiago Macedo e Cordeiro, The University of Texas Health Science Center at San Antonio, United StatesDongwei Sun, University of California, Riverside, United States
Copyright © 2025 Kong, Tai, Chen, Li, Chen and Shi. This is an open-access article distributed under the terms of the Creative Commons Attribution License (CC BY). The use, distribution or reproduction in other forums is permitted, provided the original author(s) and the copyright owner(s) are credited and that the original publication in this journal is cited, in accordance with accepted academic practice. No use, distribution or reproduction is permitted which does not comply with these terms.
*Correspondence: Hao Chen, MTA2NDkzNzk4N0BxcS5jb20=; Liang Shi, MTQwMzM1MjY3NUBxcS5jb20=
†These authors have contributed equally to this work
‡ORCID: Hao Chen, orcid.org/0009-0002-8386-4746; Liang Shi, orcid.org/0000-0001-6179-7023