 Geraldine Rodríguez-Nieto1,2†
 Caroline Seer1,2†
 Hamed Zivari Adab1,2†
 Antonio Jimenez-Marin3
 Sima Chalavi1,2Amirhossein Rasooli1,2
 Jesús M. Cortés3,4,5
 Stefan Sunaert6
 Stephan P. Swinnen1,2*
- 1Movement Control and Neuroplasticity Research Group, Group Biomedical Sciences, KU Leuven, Leuven, Belgium
- 2KU Leuven Brain Institute (LBI), KU Leuven, Leuven, Belgium
- 3Computational Neuroimaging Laboratory, BioBizkaia Health Research Institute, Barakaldo, Spain
- 4Ikerbasque - Basque Foundation for Science, Bilbao, Spain
- 5Department of Cell Biology and Histology, University of the Basque Country (UPV/EHU), Leioa, Spain
- 6Department of Imaging and Pathology, KU Leuven, Leuven, Belgium
Introduction: Older age is associated with alterations in executive functioning (EF). Age-related alterations in the integrity of structural brain networks may contribute to EF decline, with potential consequences for independent living. Graph theory provides powerful metrics to examine the brain's structural connectome, but few studies have investigated the relationship of EF and structural brain networks, as described by graph-theoretical measures, in older adults. We aimed to investigate the mediatory role of network characteristics for the relationship between age and EF in older adults.
Methods: Eighty-four older adults completed a battery of EF tasks to allow for the extraction of a latent Common-EF factor. White-matter tractograms were generated from diffusion neuroimaging using anatomically-constrained tractography (ACT) and spherical-deconvolution informed filtering of tractograms (SIFT2).
Results: From the resulting networks, global efficiency (reflecting integration) as well as local efficiency (reflecting segregation) were calculated. Older age was associated with worse EF and decreased global and local efficiency. Both global and local efficiency were positively correlated with EF. Local efficiency mediated the negative correlation of age and EF, whereas no such relationship was found for global efficiency. Further regional efficiency analyses identified the nodes that contributed to the mediation effect of local efficiency.
Discussion: These results shed light on the shared variability among the integrity of structural brain networks and EF at older age. A causal role of a reduced segregation in structural brain networks to support EF in older adults remains to be determined but would bear promising potential for preserving EF during aging.
1 Introduction
Executive functions (EFs) are higher-level mental processes that are believed to control lower-level operations, allowing for successful goal-directed behavior (Diamond, 2013; Friedman and Miyake, 2017). Age-related declines in EF (Ferguson et al., 2021; Fisk and Sharp, 2004; Rhodes, 2004) may have adverse consequences for wellbeing and functional independence. Several factors may contribute to age-related EF decline, including alterations in the brain white matter (Madden et al., 2009, 2012; Westlye et al., 2010). Specifically, interindividual differences in EF have been linked to decreases in white matter connectivity as seen in healthy aging (Coxon et al., 2012; Fjell et al., 2017; Gustavson et al., 2023; Hoagey et al., 2021; Li et al., 2020; Serbruyns et al., 2016; Tang et al., 2023; Ystad et al., 2011). White matter tracts across the brain have been linked to EF performance (Ribeiro et al., 2023). Accordingly, white matter microstructural alterations in regions supporting EF (i.e., a structural EF network) have been proposed as a mechanism underlying EF decline in aging (Bennett and Madden, 2014; Coxon et al., 2016; Fjell et al., 2017; Hoagey et al., 2021; Shen et al., 2020; Webb et al., 2020; Zahr et al., 2009).
Structural brain connectivity can be investigated using graph theoretical analysis (Bullmore and Sporns, 2009). Graph theoretical analysis describes brain networks as nodes and edges (i.e., pathways between nodes), and derives specific metrics that reflect different facets of the brain's network topology (Rubinov and Sporns, 2010; Sporns, 2013; Yeh et al., 2021). Within graph theoretical analysis, “efficiency parameters” describe the efficiency of information exchange within and between networks (Latora and Marchiori, 2001). Global efficiency (Eglob) indicates the efficiency of parallel information transfer between all pairs of nodes in a network, and thus its integration (Cohen and D'Esposito, 2016). Regional efficiency (Ereg) indicates, for every node in a network, how efficiently information can be transferred among its neighboring nodes when that node is removed. It thus reflects how much information transfer in a small area surrounding the node (i.e., a local subnetwork) is dependent on it (i.e., the efficiency of information transfer within this sub-network). Finally, local efficiency (Eloc) denotes the average of Ereg across all nodes (Latora and Marchiori, 2001). Hence, Eglob is a measure of network integration, whereas Ereg and Eloc are measures of network segregation.
Graph theoretical analysis has revealed age-associated alterations in structural brain networks (Damoiseaux, 2017). Specifically, cross-sectional evidence links age to decreased global efficiency (Bi et al., 2021; Hinault et al., 2021; Li et al., 2020; Wen et al., 2011; Zhao et al., 2015; but see Gong et al., 2009) as well as regional and local efficiency (Bi et al., 2021; Gong et al., 2009; Li et al., 2020; Wen et al., 2011; Zhao et al., 2015). Overall, the literature suggests that structural brain networks deteriorate with increasing age, rendering them less efficient. This is consistent with an age-related “disconnection” of structural brain networks that may underlie age-associated cognitive decline (Bennett and Madden, 2014; Fjell et al., 2017; Madden et al., 2012; O'Sullivan et al., 2001).
Cognitive performance has been shown to correlate with the integrity of structural brain networks in older adults. For instance, Wen et al. (2011) found global network efficiency to be associated with processing speed, visuospatial abilities, and EF in older adults. In addition, Li et al. (2020) reported correlations with global and local network efficiency for both attention and EF in a similar population.
Taken together, the literature suggests age-related alterations in white matter networks, with potential consequences for EF. The present study was designed to investigate age-associated differences in global, local and regional structural networks efficiency and their contribution to age-associated performance differences in EF in healthy older adults, as indexed by a latent Common EF measure. The advantage of a latent EF metric is that it integrates several domains of EF and is not limited to one particular aspect of EF. In addition, it is more reliable and generalizable as compared to measures based on averaged z-scores obtained from single tasks per domain, as it reduces variability that is not specific to EF (Miyake et al., 2000; Miyake and Friedman, 2012). We hypothesized that (1) graph theoretical measures reflecting global and local efficiency of structural networks (see Methods) would be negatively related to age and positively to EF in older adults, and (2) the efficiency of information processing in the structural connectome (indexed by these graph theoretical measures) would account for age-associated differences in EF in older adults, as studied via mediation analyses. In addition, we aimed to identify the specific nodes from which connectivity show the strongest mediating association with the relationship among age, structural network efficiency and executive functioning.
2 Materials and methods
2.1 Participants and procedure
As part of a larger multimodal project investigating neural correlates of executive function (Seer et al., 2021, 2022), 111 older adults (aged 60 years and above) were recruited from the Leuven area (Belgium). All participants had normal or corrected-to-normal vision and reported no current intake of psychoactive medication, a current diagnosis of psychiatric/neurological disorder, and/or MRI contraindications. The present analyses included 84 participants (52 female, 32 male; 70 right-handed, 4 left-handed, 10 ambidextrous), between 60 and 85 years of age (M = 68.06, SD = 4.74), who had both high quality dMRI and EF data. Eligibility based on the performance on EF tasks has been described in detail elsewhere (Seer et al., 2021). In brief, participants showing signs of insufficient adherence to the task instructions (i.e., performance levels that did not differ from chance level on at least one EF task, n = 12 participants) were excluded. None of the participants in the final sample (n = 84; Figure 1) showed signs of mild cognitive impairment, as based on the Montreal Cognitive Assessment (MoCA; M = 27.71, SD = 1.82, range: 24-30 (cutoff = 23/30, Carson et al., 2018); (Nasreddine et al., 2005). Subjective cognitive complaints were not assessed. The average number of education years was 18.06 (SD = 2.66; range: 11-24) and the average level of crystallized intelligence on the Peabody Picture Vocabulary Test (PPVT) was 109.50 (SD = 8.76, range: 82-125; Horn and Cattell, 1967; Schlichting, 2005). The study was reviewed and approved by the Ethics Committee Research UZ/KU Leuven (study number 61,577). All participants provided written informed consent to participate and were offered a compensation of € 100. The dataset is openly available on https://osf.io/hxr38/files/osfstorage.
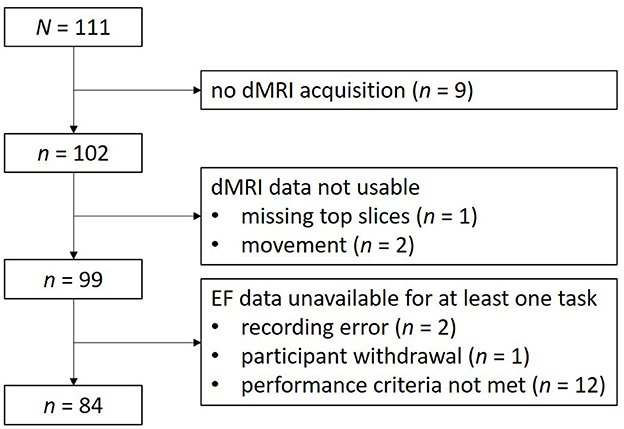
Figure 1. Flowchart depicting reasons for exclusion from analysis.
The study protocol is described in detail elsewhere (Seer et al., 2021). Participants completed three sessions: (1) a first behavioral session, where they completed background assessments and questionnaires as well as three computerized EF tasks, (2) a second behavioral session, where the remaining six computerized EF tasks were completed, and (3) a neuroimaging session. Participants completed the whole experiment on average within ~2 weeks.
2.2 Executive functioning tasks
Participants completed a comprehensive computerized battery in OpenSesame version 3.2.6 (Mathôt et al., 2012) of nine neuropsychological tasks across two test days, following a protocol similar to Friedman et al. (2016). This test battery was designed to cover three key domains of EF, i.e., inhibition (suppressing unwanted actions), shifting (switching between mental operations), and updating (managing working memory content). Every domain was tapped by three tasks. The inhibition domain was tapped by antisaccade, number-Stroop, and stop-signal tasks. In the antisaccade task, participants are presented with salient visual cues and need to avoid automatic saccades toward that stimulus. In the number-Stroop task, participants need to avoid reading out a number from a string of numbers and instead report how many numbers the string contained. In the stop-signal task, participants should withhold a prepotent motor response to a simple categorization task when cued to do so. The shifting domain was tapped by category switch, color-shape, and number-letter tasks. In all of these, participants are asked to switch back and forth between two tasks according to a visual task cue. In the category switch task, participants are cued to categorize words as either denoting an animate vs. an inanimate object (animacy task) or as describing an object that is larger vs. smaller than a football (size task). In the color-shape task, participants are asked to categorize stimuli either according to their shape (triangle vs. circle; shape task) or according to their color (red vs. green; color task). In the number-letter task, participants are presented with pairs of letters and numbers and are cued to categorize these pairs either regarding the letter being a vowel vs. a consonant (letter task) or regarding the number being odd vs. even (number task). The updating domain was tapped by digit span, keep track, and spatial 2-back tasks. In the digit-span task, participants are asked to repeat strings of numbers either in forward or in backward order, with the length of the strings increasing until the participant fails to respond correctly. In the keep track task, participants are asked to attend to a stream of words from different categories (e.g., countries, colors) and recall the last word of each category, with varying numbers of categories to keep track of. In the spatial 2-back task, participants are asked to watch a sequence of dots flashing on different locations scattered across the computer screen and to indicate, for every dot, whether the dot in that same location has been highlighted two trials before the current one. The task order was fixed to minimize between-subject variability (e.g., due to learning or fatigue effects) and hence facilitate latent variable extraction (day 1: stop-signal, category switch, digit span; day 2: color-shape, keep track, anti-saccade, spatial 2-back, number-Stroop, number-letter; Friedman et al., 2016). The rationale for this particular task order, individual task parameters, and calculation of performance scores were described in detail elsewhere (Seer et al., 2021).
A single measure of EF was derived from the common and specific EF variance, using the unity/diversity framework (Friedman and Miyake, 2017; Miyake et al., 2000; Miyake and Friedman, 2012). The nine performance scores for the tasks described above were entered into a confirmatory factor analysis in lavaan 0.6–7 (Rosseel, 2012), where a “Common EF” factor represented the shared variance by all tasks while “shifting-specific” and “updating-specific” factors represented the residual variability from shifting and updating tasks (Miyake and Friedman, 2012; Seer et al., 2021). Note that after accounting for Common EF variability, there is usually no residual variability left to be captured by an “inhibition-specific” factor; this was also the case in the current dataset (see also Friedman and Miyake, 2017; Seer et al., 2021). In the context of the present study, the “Common EF” factor score was used as the main variable of interest when assessing the interrelations between EF, Age, and brain/graph metrics in this cohort of older adults. Factor loadings and model fit indices are provided in the supplement (Supplementary Table S1). Note that this procedure also yielded shifting-specific and updating-specific EF factors. Although these factors were not of interest for the present study, we executed exploratory analyses for completeness.
2.3 MRI acquisition
MRI data were acquired on a Philips Achieva 3.0T MRI system equipped with a 32-channel head coil. A high-resolution three-dimensional T1-weighted (T1W) structural image was collected, using a magnetization-prepared rapid gradient echo (MPRAGE) sequence with the following parameters: TR/TE = 5.6/2.5 ms; flip angle = 8°; voxel size = 0.9 × 0.9 × 0.9 mm3; field of view = 256 × 240 × 187.2 mm3; 208 sagittal slices; sensitivity encoding (SENSE) = 2; total scan time = ~ 6 min. Diffusion MRI data were acquired using a single-shot echo planar imaging sequence with the following parameters: dMRI volumes with b-values = 700 s/mm2 (16 gradient directions), 1,200 s/mm2 (30 gradient directions), and 2,800 s/mm2 (50 gradient directions); 6 interspersed volumes without diffusion weighting (b = 0 s/mm2); flip angle = 90°; phase-encoding direction = posterior to anterior (PA); field of view = 240 × 240 × 140 mm3; voxel size = 2.5 × 2.5 × 2.5 mm3, TE/TR = 74/5,000 ms; multiband factor = 2; SENSE = 2; matrix size = 96 × 96; 56 transverse slices; total scan time = ~ 9 min. We also acquired five b = 0 s/mm2 images with reversed phase encoding (AP) for the purpose of susceptibility-induced distortion correction.
2.4 MRI processing
The MRtrix3 (Tournier et al., 2019) standard structural connectome construction pipeline (Smith and Connelly, 2019) available at https://github.com/BIDS-Apps/MRtrix3_connectome and described in detail elsewhere (Civier et al., 2019; Smith et al., 2015b; Yeh et al., 2016, 2019), was applied to dMRI and T1W data (see Figure 2A for a general overview of the pipeline). Where necessary, this pipeline also incorporates commands from FSL (Jenkinson et al., 2012) and Freesurfer (Fischl, 2012) software packages. Brain parcellation was performed according to the Desikan atlas (Desikan et al., 2006), which is the default atlas used by Freesurfer.
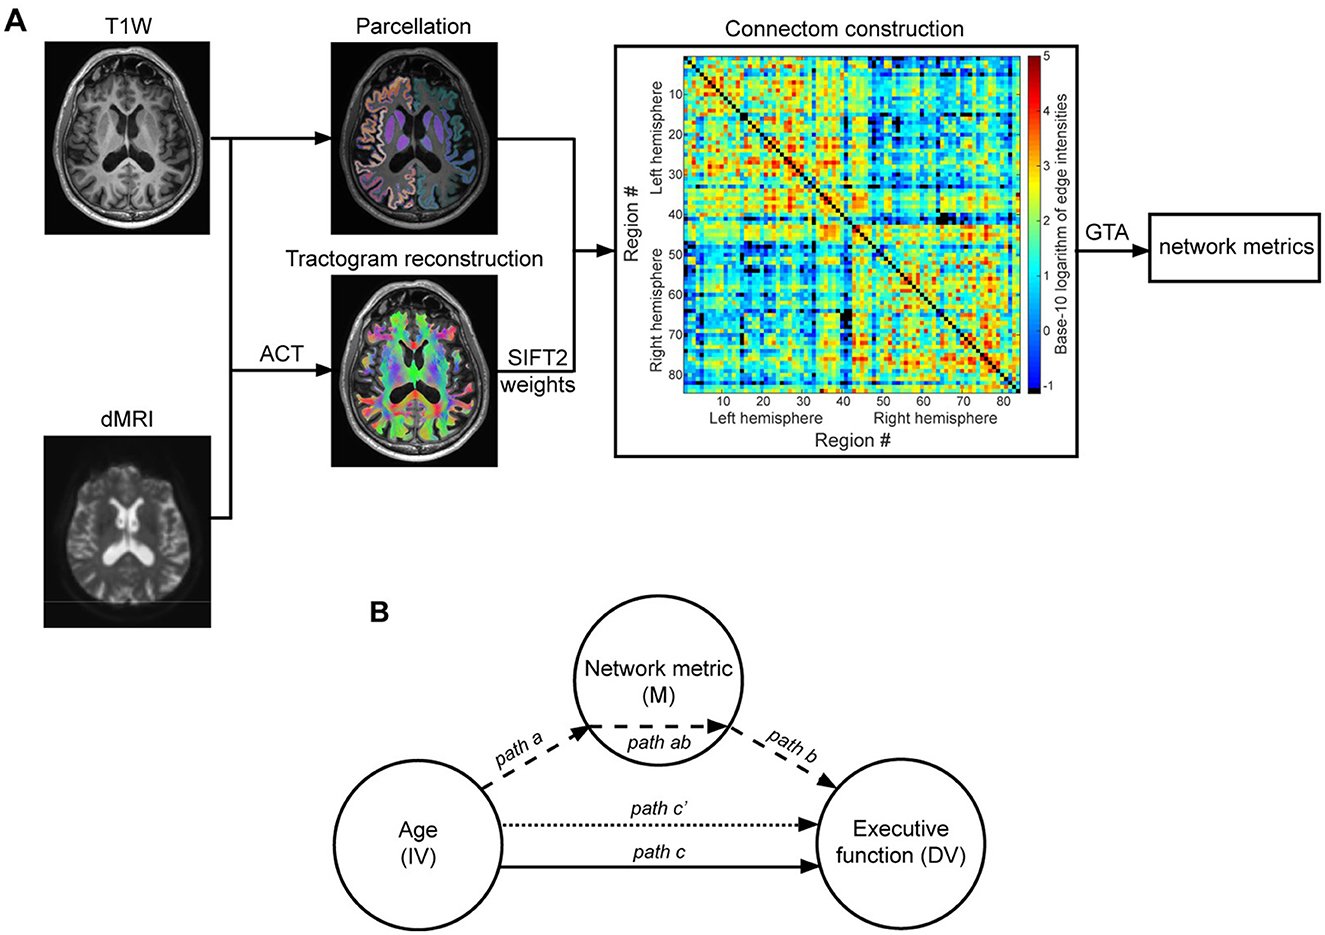
Figure 2. General overview of applying graph theoretical analysis to study brain networks (A) and overview of the mediation model (B). (A) The anatomical constrained tractography (ACT) framework was applied to the preprocessed dMRI data and T1W image of an exemplary participant to reconstruct the whole brain tractogram (overlaid on T1W image). The streamlines' weights obtained via SIFT2 (spherical-deconvolution informed filtering of tractograms) were then used in conjunction with the brain nodes image, obtained by parcellating the T1W image, to construct an 84 × 84 weighted and symmetrical connectivity matrix. The color bar shows connection strength in logarithmic scale and missing/removed connections are in black. Graph theoretical analysis was used to calculate the weighted version of network topology metrics of interest (here: global efficiency, local efficiency, regional efficiency). (B) The Mediation model was used to determine whether the age-related differences in EF in older adults are mediated by alterations in network metrics. Path c (solid line) = total effect of age (IV = independent variable) on executive function (DV = dependent variable). This total effect was, per metric of interest, separated into two distinct pathways: (1) path ab (dashed arrows) = indirect (mediation) effect, with path a reflecting the effect of age on the network metric (M = mediator variable) and path b reflecting the effect of network metric on executive function; (2) path c′ (dotted arrow) = direct effect, i.e., the effect of age on executive function independent of its effect through the network metric.
In brief, dMRI data were denoised (Veraart et al., 2016), Gibbs unringed (Kellner et al., 2016), and corrected for eddy current distortions, motion, and susceptibility induced distortions (Andersson et al., 2003, 2016, 2017; Andersson and Sotiropoulos, 2016). Three-tissue response functions representing single-fiber white matter, gray matter and cerebrospinal fluid were obtained from the corrected dMRI data using an unsupervised approach (Dhollander et al., 2016). Three-tissue constrained spherical deconvolution (CSD) was performed for each participant, using the averaged (across all participants) response functions for each tissue type with the multi-shell multi-tissue CSD algorithm (Jeurissen et al., 2014), resulting in the white matter fiber orientation distribution (FOD) for each voxel. Joint bias field correction and global intensity normalization of the 3-tissue parameters was performed in the log-domain (Dhollander et al., 2021). Subject's T1W image was also registered to the mean b = 0 s/mm2 (corrected) image via rigid-body transformation (Bhushan et al., 2015).
Following the initial processing, tractograms were generated. Thus, for each participant, the 2nd-order integration over FODs algorithm (iFOD2; Tournier et al., 2010) and the anatomically-constrained tractography (ACT; Smith et al., 2012) with dynamic seeding (Smith et al., 2015a), FOD amplitude threshold 0.06, step size of 1.25 mm, length of 5–250 mm, and backtracking (Smith et al., 2012) were used to generate 10 million probabilistic streamlines. Furthermore, each streamline was assigned a weight, computed using the spherical-deconvolution informed filtering of tractograms (SIFT2; see Smith et al., 2015a). Based on each participant's tractogram, an individual connectome was computed using 84 regions-of-interest parcellated in native space [cortex and cerebellum: Dale et al. (1999); Desikan et al. (2006); subcortical regions: Patenaude et al. (2011); see Smith et al. (2015a)], with connection strengths calculated by summing the weights of the relevant streamlines scaled by the proportionality coefficient (Smith et al., 2015a). These 84 nodes were used for further analyses. To allow for a better understanding of the distribution of regional differences, the nodes were grouped into seven larger areas (frontal, parietal, temporal, occipital, insula-cingulate, subcortical (including hippocampus), and cerebellum for the analysis of regional efficiency (see below). This categorization followed the grouping of cortical regions suggested by Klein and Tourville (2012), which is based on the Desikan atlas (Desikan et al., 2006). Intra-regional connection strengths were set to zero (Rubinov and Sporns, 2010).
2.5 Global and local efficiency as putative measures of integration and segregation
The Brain Connectivity Toolbox (Rubinov and Sporns, 2010), implemented in MATLAB (The MathWorks Inc., Natick, MA), was used to compute weighted, undirected network metrics including, global efficiency (Eglob: , where Ei is the efficiency of node i; Rubinov and Sporns, 2010), regional efficiency (Ereg), and local efficiency (Eloc: , where Eloc, i is the local efficiency of node i, and djh(Ni) is the length of the shortest path between j and h, that contains only neighbors of i; Rubinov and Sporns, 2010). Please note that Eloc is the average of Ereg across all nodes. In this study, the recommended version described in Wang et al. (2017) was used to calculate Ereg as it is a true generalization of the binary variant.
Eglob measures how efficient the parallel information transfer (flow) in the network is and thus is an index of network integration. Ereg and Eloc (i.e., the average of Ereg across all nodes) measure the efficiency of the communication amongst the first neighbors of a node when that node is removed. These metrics indicate how well a network tolerates faults and thus are indices of network segregation (Latora and Marchiori, 2001). In other words, the intercommunicability of any two nodes in the network is reflected in the network integration, or global efficiency. In contrast, the efficiency of specific clusters is reflected in the network segregation, or regional and local efficiency (see also Cohen and D'Esposito, 2016).
We decided to focus on efficiency metrics because these are reflective of the integration and segregation of the network's connectivity and because these metrics have been associated with age and/or to executive functioning in older adults (Li et al., 2020; Madden et al., 2020; Wen et al., 2011; Zhao et al., 2015). Furthermore, regional efficiency supports the identification of relevant nodes in the association among efficiency, age and executive functioning, rendering higher specificity. Nonetheless, we admit that other network properties may also be relevant. Accordingly, we included analogous supplementary analyses of other network metrics (density, clustering, modularity and strength).
2.6 Statistical analysis
Kolmogorov-Smirnov tests did not show significant deviations from normality, which was confirmed by visual inspection for the variables of interest. Partial (Pearson) correlation analyses controlling for sex and education were used to investigate the bivariate associations between age, EF, and network metrics. To examine whether age-associated variations in network metrics contribute to age-associated differences in EF in a cohort of older adults, mediation analyses were performed (MacKinnon et al., 2007). To this end, the commonly-used simple 3-path mediation model (Baron and Kenny, 1986), implemented in the PROCESS V4.0 plugin (Hayes and Rockwood, 2017) developed for IBM SPSS (V28.0 for Windows), was used (Figure 2B). Multiple comparisons were controlled using a False Discovery Rate (FDR) correction (Benjamini and Hochberg, 1995).
In this model, the total effect (path c) of independent variable (IV) on dependent variable (DV) was separated into two distinct pathways (see Figure 2): (1) indirect (mediation) effect (path ab) with path a reflecting the effect of IV on the mediator variable (M) and path b reflecting the effect of mediator variable on DV while controlling for IV; (2) direct effect of IV on DV (path c'), i.e., the effect of IV on DV independent of its effect through the mediator variable. Of particular interest was the indirect effect (path ab), since a significant indirect effect would indicate significant mediation by the mediator variable used in the model. This was accomplished using 5,000 bootstrap samples to determine bias-corrected confidence intervals for the indirect effects. Accordingly, indirect effects with 95% confidence intervals excluding zero were regarded as significantly mediating the relation between IV and DV. In this study, age, graph metrics, and common EF were, respectively, assigned as IV, M and DV. Sex and education were included as nuisance variables in all mediation models.
We conducted supplementary analyses for global metrics other than efficiency (density, clustering, modularity, and strength) to investigate whether these variables were related to age and common EF and to examine whether they mediated the age-common EF relationship. These analyses are presented in the Supplementary material (Supplementary Tables S3–S9).
3 Results
3.1 Age-associated differences in executive functioning in older adults
Within this cohort of older adults, age was significantly correlated with Common EF (r = −0.52, p < 0.001; note that this correlation remained significant when sex and education were omitted as controlling variables, r = −0.50, p < 0.001). The negative correlation coefficient indicates older age to be associated with lower Common EF scores (i.e., poorer EF; Figure 3A).
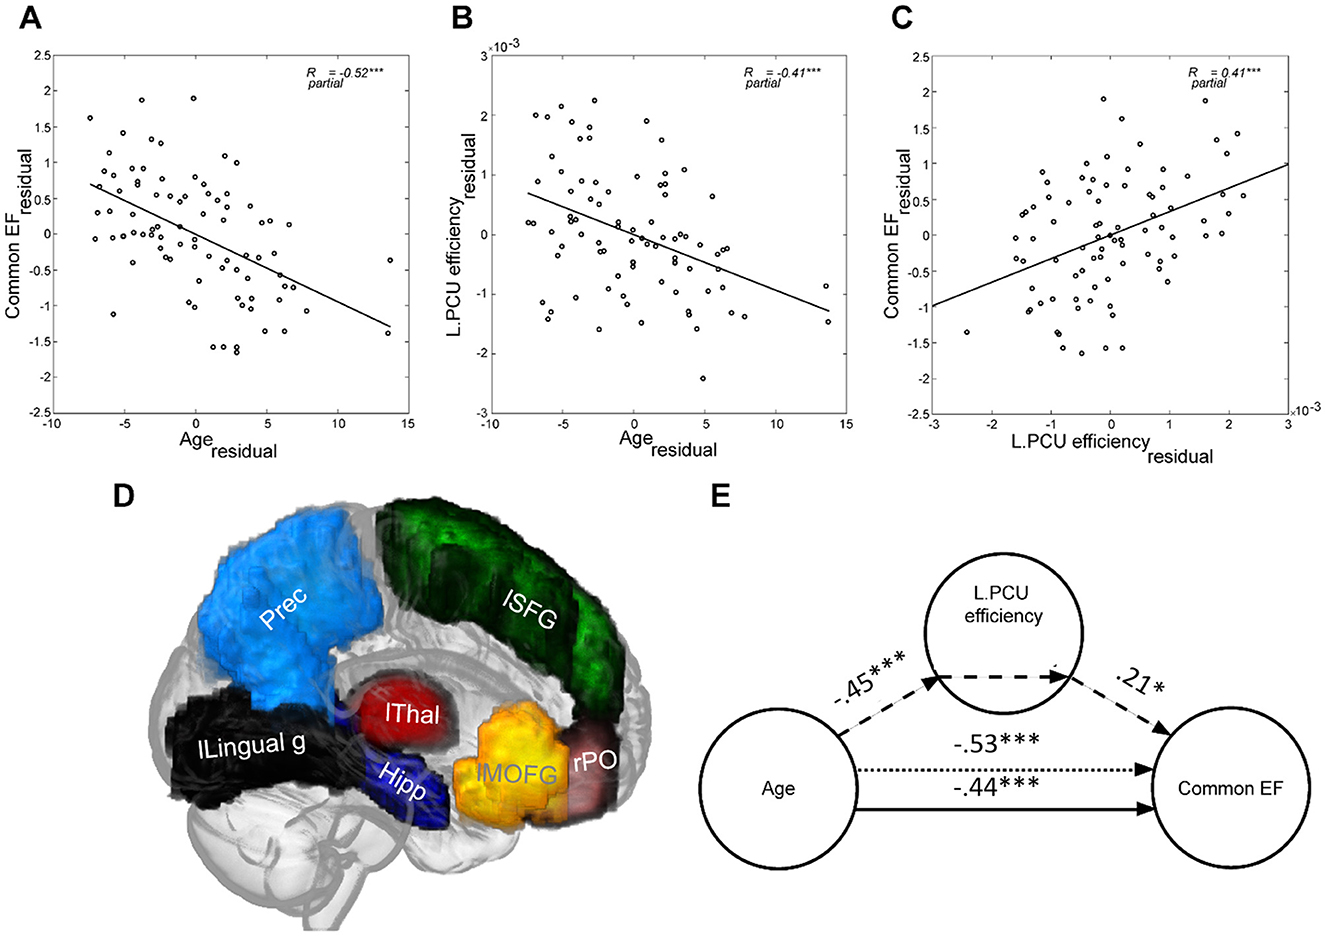
Figure 3. Age was negatively associated with both (A) Common EF and (B) Left Precuneus (as an exemplary region) efficiency in older adults. (C) Higher Left Precuneus efficiency was related to better Common EF performance. (D) The 3D representation of brain regions for which the efficiency significantly mediated the age-associated decline in Common EF in older adults (listed in Table 3) is shown on the glass brain. (E) The standardized path coefficients of the mediation model used for the same region as in (B, C) (i.e., Left Precuneus) are shown. In all plots sex and education are controlled. lSFG, left Superior Frontal Gyrus; lMOFG, left Medial Orbitofrontal Gyrus; Prec, bilateral Precuneus; lLingual g, left Lingual gyrus; Hipp, bilateral Hippocampus; lThal, left Thalamus; rPO, right Pars Orbitalis. ***p < 0.001; **p < 0.005; *p < 0.050; CI: 95% bias-corrected bootstrapped confidence interval.
3.2 Age-associated differences in brain efficiency in older adults
Investigations into brain efficiency in this cohort of older adults showed significant negative correlations for global (Eglob: 0.026 ± 0.004; r = −0.43, p < 0.001) and local (Eloc: 0.003 ± 0.0005; r = −0.43, p < 0.001) efficiency parameters with age. Omitting sex and education as controlling variables did not qualitatively change these results (Eglob: r = −0.42, p < 0.001; Eloc: r = −0.41, p < 0.001). The negative correlation coefficients indicated a decrease in global (i.e., efficiency of information transfer for the entire brain) and local (i.e., average efficiency of information transfer in local subnetworks) efficiency of the brain with increasing age. Furthermore, Ereg of 51% (43 out of 84) of the brain regions showed a significant (FDR corrected) negative correlation with age, indicating a decrease in regional efficiency as age increases (Table 1, Figure 3B for an example). To obtain a better understanding of how these regions are distributed, the individual nodes were assigned to one of seven areas including frontal (22 nodes), parietal (10 nodes), temporal (18 nodes), occipital (8 nodes), insula-cingulate (10 nodes), subcortical (including hippocampus; 14 nodes), and cerebellum (2 nodes), according to a predefined categorization (Klein and Tourville, 2012). This assignment revealed that 18 of the negatively correlated regions were located in frontal areas, 9 in parietal areas, 9 in temporal areas, 3 in occipital areas, and 4 in below-/sub-cortical areas. No significant region was found in insula-cingulate and cerebellum. No significant positive correlation with age was found for Ereg of any brain region. Finally, supplementary analyses showed that density, clustering and strength (but not modularity) were negatively related to age (Supplementary Table S4).
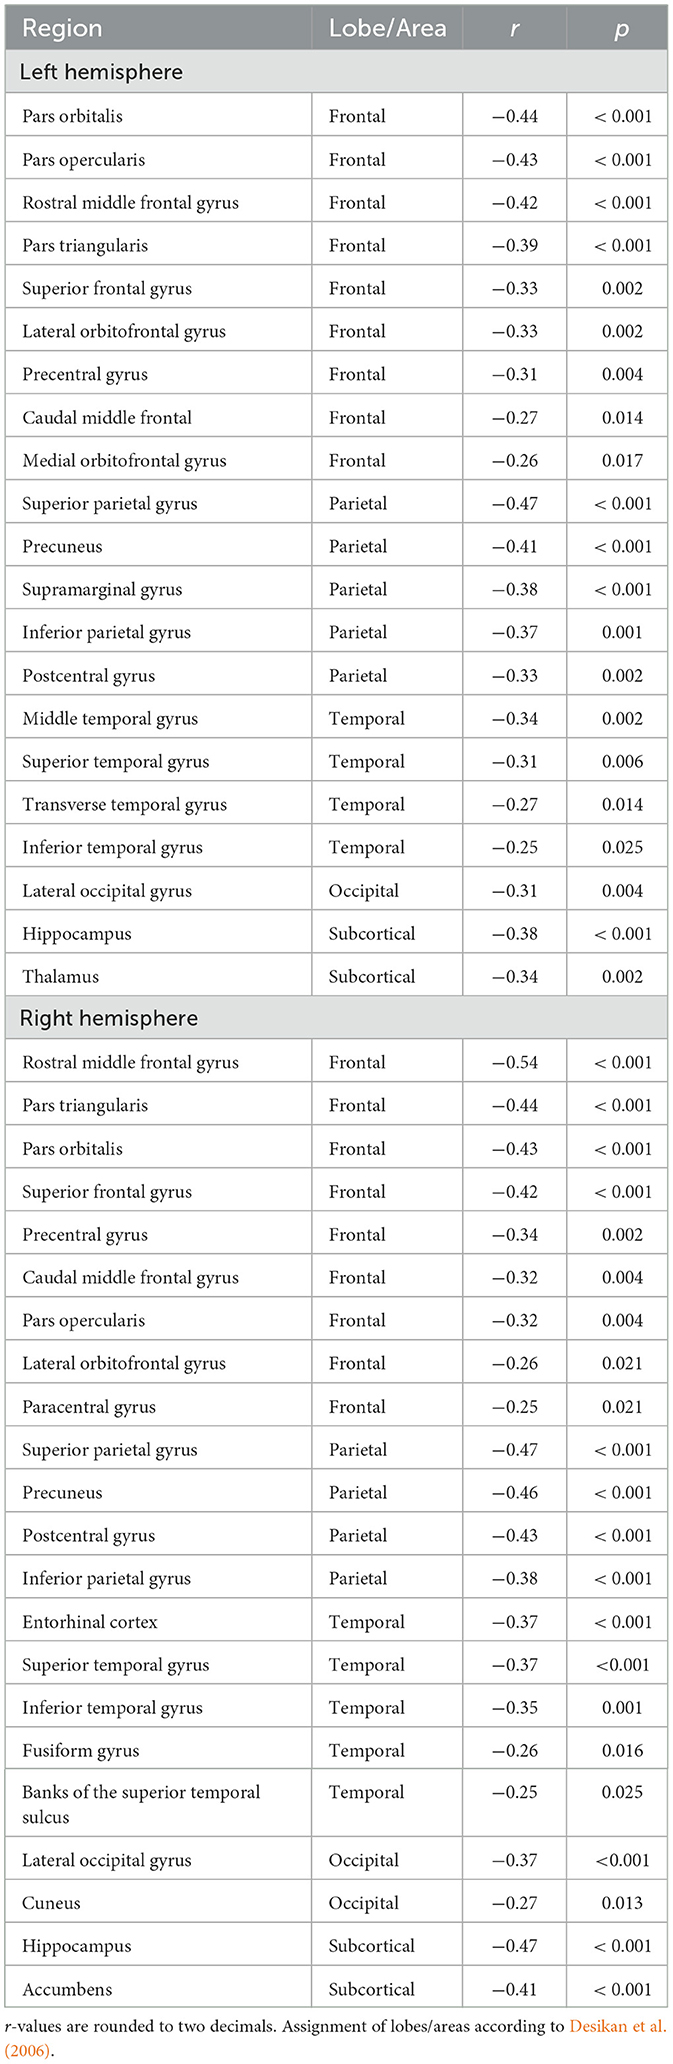
Table 1. Regions with significant age-Ereg association (controlled for sex and years of education) are listed according to hemisphere, lobe, and ascending order of p-value (FDR critical p = 0.026).
3.3 Relationship between brain efficiency and executive functioning in older adults
The Eglob (r = 0.33, p = 0.001) and Eloc (r = 0.37, p = 0.001) were significantly correlated with Common EF in older adults. Omitting sex and education as control variables did not qualitatively change these results (Eglob: r = 0.35, p = 0.001, Eloc: r = 0.39, p < 0.001). The positive correlation coefficients indicated that superior Common EF was associated with higher global (i.e., efficiency of information transfer for the entire brain) and local (i.e., average efficiency of information transfer in local subnetworks) efficiency of the brain. Moreover, Ereg of 55% (46 out of 84) of the brain regions showed a significant (FDR corrected) positive correlation with Common EF factor (Table 2, Figure 3C for an example). Thus, higher regional efficiency corresponded to better Common EF. Assigning brain regions to the different areas (Klein and Tourville, 2012) revealed that 16 of the positively correlated regions were located in frontal areas, 10 in parietal areas, 7 in temporal areas, 4 in occipital areas, and 9 in below-/sub-cortical areas. No significant region was found in insula-cingulate and cerebellum.
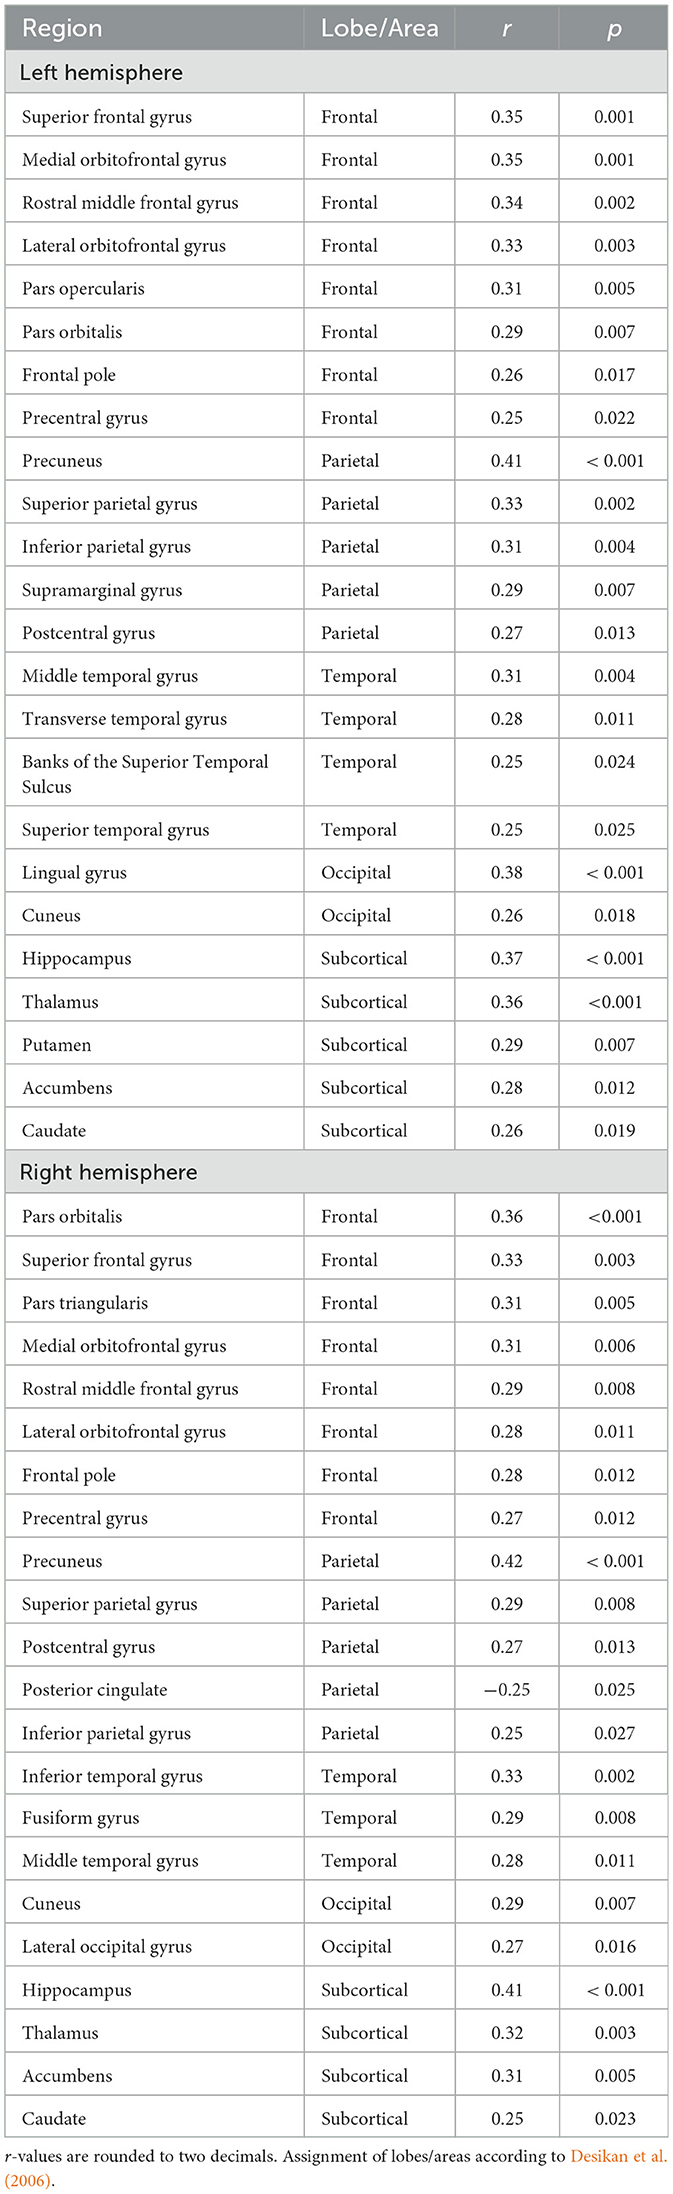
Table 2. Regions with significant Common EF-Ereg association (controlled for sex and years of education) are listed according to hemisphere, lobe, and ascending order of p-value (FDR critical p = 0.027).
Supplementary analyses showed that neither the shifting-specific nor the updating-specific factor were correlated with the efficiency metrics (Supplementary Table S10). In addition, density, clustering and strength (but not modularity) were positively related to Common EF (Supplementary Table S4).
3.4 Mediation of age-associated differences in brain efficiency on age-associated differences in executive functioning in older adults
Using Eglob as a mediator, no significant mediation effect on age-associated decrease in Common EF (βc = −0.53, p < 0.001) was found (βab = −0.06, CI: [-0.17, 0.02]; βa = −0.44, p < 0.001; βb = 0.13, p = 0.21, = −0.47, p < 0.001; sex standardized coefficient = −0.19, p = 0.05; education standardized coefficient = 0.09, p = 0.37).
Eloc significantly mediated the age-associated differences in Common EF in this cohort of older adults (βc = −0.53, p < 0.001; βab = −0.07, CI: [−0.16,−0.002]; βa = −0.44, p < 0.001; βb = 0.18, p = 0.09; = −0.45, p < 0.001; sex standardized coefficient = −0.19, p = 0.05; education standardized coefficient = 0.09, p = 0.37).
To identify for which brain regions Ereg mediated the age-associated differences in EF, we restricted the mediation analysis to those 38 regions showing significant associations with both age and Common EF in previous analyses (i.e., common regions in Tables 1, 2). The result of this analysis indicated that the age-associated differences in regional efficiency of bilateral precuneus (parietal), bilateral hippocampus (below/sub-cortical), left superior frontal gyrus (frontal), left medial orbitofrontal gyrus (frontal), left thalamus (below/sub-cortical), left lingual gyrus (occipital), and right pars orbitalis (frontal) significantly contributed to the differences in Common EF in older adults (Table 3, Figures 3D, E for an example).
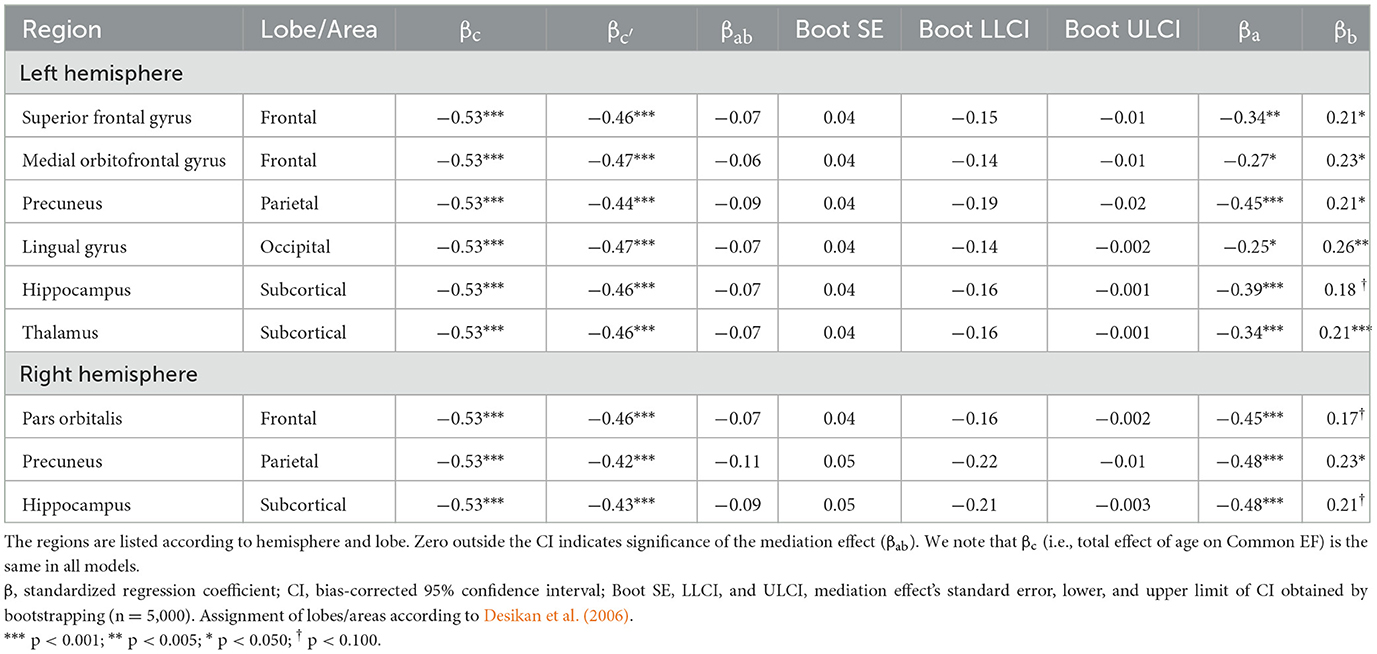
Table 3. Brain regions with Ereg significantly mediating the age-associated differences in Common EF in older adults.
Supplementary analyses showed that from the global metrics commonly related to age and Common EF (density, clustering and strength), only clustering was a significant mediator of the relationship between age and Common EF (Supplementary Table S5).
4 Discussion
This study addressed age-associated differences in global, local and regional efficiency of structural connectivity and their contribution to age-associated differences in EF in healthy older adults. We performed latent variable modeling for the assessment of EF along with the most recent state-of-the-art techniques for structural connectome construction. We found negative associations between age and global (i.e., efficiency of information transfer for the entire brain), local (i.e., average efficiency of information transfer in local subnetworks), and—for a range of brain areas—regional network efficiency metrics of structural brain networks in older adults. In addition, better EF performance was associated with higher global, local, and—for a range of brain areas—regional network efficiency. Importantly, we found that local efficiency and regional efficiency of particular nodes mediated age-associated interindividual variations in EF in older adults. In contrast, global efficiency was not a significant mediator, which may suggest that the lower performance in EF with age in older adults is mediated by a decreased segregation rather than a decreased integration.
4.1 Age-associated differences in executive functioning in older adults
Our results revealed that age was negatively related to EF—indicated by a latent factor reflecting general executive abilities—in a group of older adults. In other words, relatively younger age within the group of older adults studied here (aged between 60 and 85 years) was associated with better EF performance, which is in line with previous research (Ferguson et al., 2021; Maldonado et al., 2020). Note that this finding does not demonstrate a decline in EF that is attributable to the aging process itself, but it does reflect poorer EF performance in older in comparison to relatively younger individuals (in the population of older adults).
4.2 Age-associated differences in brain efficiency in older adults
Normal brain function implies two co-existing fundamental aspects of functional organization, namely segregation and integration of information in brain networks. Segregation refers to the ability for specialized processing within densely interconnected groups of the brain and integration refers to the ability to combine the specialized information from distributed brain networks (Rubinov and Sporns, 2010).
In this study, we focused on graph theory metrics of global and local efficiency of structural brain networks as measures of integrated and segregated information transfer, respectively. Note that graph theory also offers alternative metrics to cover network segregation and integration characteristics, such as clustering and transitivity (segregation) and characteristic path length (integration; Rubinov and Sporns, 2010; Farahani et al., 2019). The latter is highly related to the global efficiency measure (Madole et al., 2023), as both metrics use the estimation of the shortest path among nodes.
Age showed significant negative associations with both ‘'global” (i.e., efficiency of information transfer for the entire brain) and ‘'local” (i.e., average efficiency of information transfer in local subnetworks) efficiency. In other words, the global and local efficiency of structural brain networks was lower as a function of age (note that this does not imply an effect of aging, i.e., change over time). These findings are in line with earlier studies, demonstrating lower efficiency of structural brain networks at higher age (Bi et al., 2021; Gong et al., 2009; Hinault et al., 2021; Li et al., 2020; Wen et al., 2011; Zhao et al., 2015).
Both global efficiency and local efficiency both are metrics of information transfer within the brain, but they reflect different aspects: global efficiency reflects how well a network is integrated, whereas local efficiency reflects how clearly subnetworks are segregated (Cohen and D'Esposito, 2016; Latora and Marchiori, 2001; Rubinov and Sporns, 2010). Both global and local efficiency are decreased in older age. To the extent that network integration and network segregation are important for optimal functioning, our results may be suggestive of age-associated differences in successful information processing. Such a disruption of structural networks has been interpreted as a network “disconnection,” possibly underlying age-associated EF differences (see above; Bennett and Madden, 2014; Fjell et al., 2017; Madden et al., 2012; O'Sullivan et al., 2001).
Several studies have suggested an association of older age and decreased segregation of functional networks (i.e., increased connectivity between functional networks; Antonenko and Flöel, 2014; Damoiseaux, 2017; Deery et al., 2023; King et al., 2018). Our current results complement those findings in that they reveal lower efficiency of information transfer in structural brain networks in older individuals.
In this cohort of older adults, we found lower efficiency to be associated with older age in an aggregated measure across all 84 brain regions under investigation. In addition, more fine-grained analyses revealed that these effects were found across the whole brain territory, except for limbic (insula-cingulate) regions and the cerebellum. The most prominent effects were observed in frontal, parietal, and subcortical (including hippocampus) regions. The negative association between age differences and network efficiency for fronto-parietal and subcortical (including hippocampus) regions in the present dataset is roughly consistent with previous findings (Bi et al., 2021; Li et al., 2020). Notably, some of these brain areas have been identified by functional neuroimaging studies to be crucially involved in successful EF (Niendam et al., 2012; Rodríguez-Nieto et al., 2022).
4.3 Relationship between brain efficiency and executive functioning in older adults
Both global (i.e., efficiency of information transfer for the entire brain) and local (i.e., efficiency of information transfer for the local subnetworks) efficiency of structural brain networks showed marked positive correlations with EF in older adults in this study. In other words, better EF was linked to higher efficiency—thus to both better network integration (as indicated by global efficiency) and to better network segregation (as indicated by local efficiency). This is consistent with the idea that successful EF relies on intact white matter connections for efficient information transfer (Bennett and Madden, 2014; Fjell et al., 2017; Madden et al., 2012).
Similar to the link between age differences and white matter measures, local efficiency was related to EF in an aggregated measure across all brain regions under investigation. In addition, more fine-grained analyses showed associations between regional efficiency and EF to be centered on fronto-parietal and subcortical (including hippocampus) regions, which is consistent with the areas implicated in EF in functional neuroimaging work (Niendam et al., 2012; Rodríguez-Nieto et al., 2022). These areas also correspond closely to the set of brain regions where better EF was reported to correlate with higher structural regional connectivity in previous work (Wen et al., 2011).
Reduced network efficiency might hinder successful executive performance. Specifically, it can be speculated that the reduced quality of structural networks (as reflected in reduced global and local network efficiency) hampers the precise recruitment of the appropriate subnetworks when performing a cognitively challenging task, which may render information processing less efficient and more erroneous. Moreover, (haphazard) excessive recruitment of additional brain areas might be facilitated, further reducing the specificity of neural recruitment and increasing inappropriate interference. In addition, the lower efficiency of local structural networks found in the present data may align with the notion that functional connectivity within networks is often decreased in older age (Deery et al., 2023). Note that such interpretations are speculative and require functional and structural network characteristics to be studied simultaneously.
As global, local and regional efficiency of a large set of nodes were commonly related to age and executive functioning, the next step was to examine whether networks efficiency mediated the relationship between age and executive functioning in older adults.
4.4 Mediation of age-associated differences in brain efficiency on age-associated differences in executive functioning in older adults
Global efficiency (i.e., efficiency of information transfer for the entire brain) did not significantly mediate age-associated EF decrease. However, our analyses revealed a significant contribution of local efficiency (i.e., efficiency of information transfer in local subnetworks averaged across all 84 brain areas under investigation) to the relationship between age and EF in older adults. This mediation of age-associated EF differences by local efficiency was driven by the regional efficiency of a number of brain regions. Specifically, we found significant mediating effects of regional efficiency for frontal (left superior frontal gyrus and medial orbitofrontal gyrus; and right pars orbitalis), parietal (bilateral precuneus), occipital (left lingual gyrus) and subcortical (bilateral hippocampus; left thalamus) areas. Some of these brain areas correspond to the fronto-parietal and subcortical areas that are often associated with EF in functional neuroimaging (Niendam et al., 2012; Rodríguez-Nieto et al., 2022).
In the current dataset, local efficiency (reflecting segregation) was identified as a mediator of the relationship between age and EF, whereas no such relationship was detected for global efficiency (reflecting integration). Given the absence of a significant mediation for global efficiency (which does not allow for firm conclusions in either direction), it remains unclear if this pattern of results reflects that local efficiency is more crucial than global efficiency in explaining the age-associated EF difference that we found here. To the extent that (a) the associations between inter-individual differences found here are reflective of intra-individual processes (but see Borsboom et al., 2009), and (b) the absence of a significant mediation of the age-EF relationship by global efficiency reflects that global efficiency truly has no mediating role in that relationship, one may speculate that local efficiency is especially important in the age-related differences in EF functioning. Supplementary analyses further showed that clustering -another measure of segregation- was also a significant mediator between age and EF. These results suggest that segregation is essential in mediating the association between aging and executive functioning. It should also be noted that the indirect mediation effects observed here were rather small, indicating that other factors are relevant in determining the association between age and EF. Longitudinal observation studies may show if alterations in structural brain networks, as they occur during aging, predict EF deterioration (see also Fjell et al., 2017; Westlye et al., 2010). If so, structural brain network metrics might serve as early indicators of age-associated EF decline.
4.5 Strengths and limitations
The strengths of this study are its relatively large sample size, allowing for the coverage of a broad age range within older adults and the combination of a solid EF measure (as derived from latent variables) with one of the most recent state-of-the-art techniques in the analysis of the diffusion neuroimaging data (i.e., CSD in combination with ACT and SIFT2). For the assessment of EF, we utilized a large battery of neuropsychological tasks in order to extract a latent measure of EF (Friedman et al., 2016), which helps overcoming the limitations associated with single-task measures (Miyake et al., 2000; Miyake and Friedman, 2012).
For the assessment of structural brain networks, we obtained dMRI data that we analyzed using the constrained spherical deconvolution (CSD) model in combination with anatomically-constrained tractography (ACT) and spherical-deconvolution informed filtering of tractograms (SIFT2; Smith et al., 2012, 2015a; Tournier et al., 2010). These advanced analysis techniques mitigate methodological limitations with regard to crossing fibers that constitute a limitation for more traditional approaches (e.g., fractional anisotropy measures derived from diffusion tensor imaging) and have been shown to provide more reproducible and biologically meaningful connectomes (Smith et al., 2015b). Hence, this study complements the existing literature, in that it combines a rigorous approach to EF assessment with advanced techniques for the analysis of structural brain network topology in a graph-theoretical approach (see also Madden et al., 2012).
When interpreting these results, the following limitations should be considered. First, these data are correlational in nature. Hence, they do not allow for mechanistic conclusions regarding the direct involvement of the brain areas in cognitive processes, as discussed here, and individual differences in structural network parameters should not be mistaken to reflect proximate causes of EF differences (Borsboom et al., 2009). In addition, given the cross-sectional nature of these findings, it cannot be concluded based on the current data alone that reduced network efficiency in older as compared to younger individuals (as reflected in the correlations of age and network efficiency metrics) results from the aging process per se. Nevertheless, longitudinal research has identified age-related decreases of structural brain networks (Alloza et al., 2018; Fjell et al., 2017), and our results are compatible with the notion that structural brain networks are subject to decline during aging. Hence, interventions targeting the preservation of structural brain networks, and more specifically local efficiency (e.g., cognitive training interventions, Caeyenberghs et al., 2016), may be an interesting route for future research. Simultaneous assessment of the functional connectome in such studies would also allow for evaluating how differences in structural and functional connectomes are temporally related. This may be informative for generating mechanistic hypotheses regarding the consequences of age-related decline in structural connectivity. In addition, functional studies would allow for the assessment of more indirect functional connectivity and information transfer (e.g., two nodes being connected via a third node), which is not possible based on the analysis of direct connections of the structural connectome reported here.
Second, the current dataset does not allow for a comparison of the established relationships with a younger control group. Hence, it remains unclear whether similar mediation exists at young age (i.e., < 60 years of age) or whether this pattern is typical for the subpopulation of older adults (i.e., ≥60 years of age). Still, our data provide valuable information regarding the link between age, structural brain connectivity, and EF for older adults and thus contribute to the understanding of EF and the role of brain networks in the aging population.
The current study did not systematically address sex differences in the relationships between age, brain efficiency parameters, and EF. In this dataset, neither EF, nor global or local efficiency differed significantly between the sexes (all p >0.372). Future work may further explore the nature and magnitude of sex effects, potentially in combination with neurochemical assessments. When addressing such sex effects, the role of postmenopausal shifts in neurotransmission should be considered by including a young control group and/or employing a longitudinal design. Finally, it should be noted that our choice to use Desikan's atlas for brain parcellation and grouping according to Klein and Tourville (2012) resulted in this particular architecture of the structural connectome. The automatization for the use of this atlas has shown to be anatomically valid and reliable (Desikan et al., 2006) and has been widely adopted, which allows cross-study comparability. Nonetheless, alternative parcellations and groupings, for instance according to functional networks (Yeo et al., 2011), would also have been conceivable, and may have resulted in somewhat different conclusions. Analyses focused on networks or distinct tracts that are more specifically related to EF, rather than a global approach as employed here, may provide a more detailed perspective on microstructural alterations in these regions, and increase the sensitivity to detect differences between EF subdomains.
5 Conclusion
This study suggests that the decreased executive functioning performance with age in older adults is mediated by changes in the local efficiency of structural connectivity. That a similar mediation effect is observed from the clustering analysis while the mediation effect from global efficiency is lacking, suggests that the decrease in network segregation in older adults is associated with higher-order cognitive functions, whereas no such relationship is being observed for network integration. Further evidence suggests that this effect is mainly driven by a lower connectivity efficiency in particular brain regions (superior frontal gyrus, orbitofrontal regions, precuneus, lingual gyrus, hippocampus and thalamus). These nodes may be critical for executive functioning and may serve as processing hubs. Future studies could possibly reveal which biological and environmental factors influence structural segregation.
Data availability statement
The datasets presented in this study can be found in OSF online repository: https://osf.io/hxr38/?view_only=b95809d059f642e48e67e6826b64d534.
Ethics statement
The studies involving humans were approved by Ethics Committee Research UZ/KU Leuven. The studies were conducted in accordance with the local legislation and institutional requirements. The participants provided their written informed consent to participate in this study.
Author contributions
GR-N: Formal analysis, Writing – review & editing, Validation, Data curation, Supervision, Project administration. CS: Conceptualization, Writing – original draft, Supervision, Investigation, Funding acquisition, Project administration. HA: Methodology, Investigation, Writing – original draft, Visualization, Data curation, Conceptualization, Formal analysis. AJ-M: Data curation, Writing – review & editing, Formal analysis, Validation. SC: Writing – review & editing. AR: Writing – review & editing. JC: Writing – review & editing. SS: Writing – review & editing. SPS: Project administration, Resources, Conceptualization, Writing – review & editing, Investigation, Funding acquisition, Supervision.
Funding
The authors declare that financial support was received for the research and/or publication of this article. This work was supported by grants from the European Union's Horizon 2020 research and innovation program under the Marie Skłodowska- Curie grant agreement No. 794042 and a postdoctoral fellowship from the Research Foundation—Flanders (179732) to CS. JC acknowledges financial support from Ikerbasque: The Basque Foundation for Science, and from Spanish Ministry of Science (PID2023-148012OB-I00), Spanish Ministry of Health (PI22/01118), Basque Ministry of Health (2023111002 and 2022111031). Additional funding was provided to SS by the KU Leuven Research Fund (C16/15/070), the Research Foundation Flanders (G039821N), Excellence of Science grant from the Fonds Wetenschappelijk Onderzoek—Vlaanderen (FWO) and the Fonds de la Recherche Scientifique-FNRS under EOS Project No. (EOS 30446199, MEMODYN).
Acknowledgments
We thank Florian Lange for providing expert advice in preparing the neuropsychological testing setup. We thank Inara C. Timmerman, Lore Van Aerde, Anke Van Roy, Serafien D'hooge, Tori Redant, and Amanda Clauwaert for their dedicated assistance in the collection of the study data.
Conflict of interest
The authors declare that the research was conducted in the absence of any commercial or financial relationships that could be construed as a potential conflict of interest.
Generative AI statement
The author(s) declare that no Gen AI was used in the creation of this manuscript.
Publisher's note
All claims expressed in this article are solely those of the authors and do not necessarily represent those of their affiliated organizations, or those of the publisher, the editors and the reviewers. Any product that may be evaluated in this article, or claim that may be made by its manufacturer, is not guaranteed or endorsed by the publisher.
Supplementary material
The Supplementary Material for this article can be found online at: https://www.frontiersin.org/articles/10.3389/fnagi.2025.1593868/full#supplementary-material
References
Alloza, C., Cox, S. R., Blesa Cábez, M., Redmond, P., Whalley, H. C., Ritchie, S. J., et al. (2018). Polygenic risk score for schizophrenia and structural brain connectivity in older age: a longitudinal connectome and tractography study. NeuroImage 183, 884–896. doi: 10.1016/j.neuroimage.2018.08.075
Andersson, J. L. R., Graham, M. S., Drobnjak, I., Zhang, H., Filippini, N., and Bastiani, M. (2017). Towards a comprehensive framework for movement and distortion correction of diffusion MR images: within volume movement. NeuroImage 152, 450–466. doi: 10.1016/j.neuroimage.2017.02.085
Andersson, J. L. R., Graham, M. S., Zsoldos, E., and Sotiropoulos, S. N. (2016). Incorporating outlier detection and replacement into a non-parametric framework for movement and distortion correction of diffusion MR images. NeuroImage 141, 556–572. doi: 10.1016/j.neuroimage.2016.06.058
Andersson, J. L. R., Skare, S., and Ashburner, J. (2003). How to correct susceptibility distortions in spin-echo echo-planar images: application to diffusion tensor imaging. NeuroImage 20, 870–888. doi: 10.1016/S1053-8119(03)00336-7
Andersson, J. L. R., and Sotiropoulos, S. N. (2016). An integrated approach to correction for off-resonance effects and subject movement in diffusion MR imaging. NeuroImage 125, 1063–1078. doi: 10.1016/j.neuroimage.2015.10.019
Antonenko, D., and Flöel, A. (2014). Healthy aging by staying selectively connected: a mini-review. Gerontology 60, 3–9. doi: 10.1159/000354376
Baron, R. M., and Kenny, D. A. (1986). The moderator–mediator variable distinction in social psychological research: conceptual, strategic, and statistical considerations. J. Pers. Soc. Psychol. 51, 1173–1182. doi: 10.1037//0022-3514.51.6.1173
Benjamini, Y., and Hochberg, Y. (1995). Controlling the false discovery rate: a practical and powerful approach to multiple testing. J. R. Stat. Soc. Ser. B Methodol. 57, 289–300. doi: 10.1111/j.2517-6161.1995.tb02031.x
Bennett, I. J., and Madden, D. J. (2014). Disconnected aging: cerebral white matter integrity and age-related differences in cognition. Neuroscience 276, 187–205. doi: 10.1016/j.neuroscience.2013.11.026
Bhushan, C., Haldar, J. P., Choi, S., Joshi, A. A., Shattuck, D. W., and Leahy, R. M. (2015). Co-registration and distortion correction of diffusion and anatomical images based on inverse contrast normalization. NeuroImage 115, 269–280. doi: 10.1016/j.neuroimage.2015.03.050
Bi, Q., Wang, W., Niu, N., Li, H., Wang, Y., Huang, W., et al. (2021). Relationship between the disrupted topological efficiency of the structural brain connectome and glucose hypometabolism in normal aging. NeuroImage 226:117591. doi: 10.1016/j.neuroimage.2020.117591
Borsboom, D., Kievit, R. A., Cervone, D., and Hood, S. B. (2009). “The two disciplines of scientific psychology, or: the disunity of psychology as a working hypothesis,” in Dynamic Process Methodology in the Social and Developmental Sciences, eds. J. Valsiner, P. C. M. Molenaar, M. C. D. P. Lyra, and N. Chaudhary (Springer: New York, NY, USA), 67–97. doi: 10.1007/978-0-387-95922-1_4
Bullmore, E., and Sporns, O. (2009). Complex brain networks: graph theoretical analysis of structural and functional systems. Nat. Rev. Neurosci. 10, 186–198. doi: 10.1038/nrn2575
Caeyenberghs, K., Metzler-Baddeley, C., Foley, S., and Jones, D. K. (2016). Dynamics of the human structural connectome underlying working memory training. J. Neurosci. 36, 4056–4066. doi: 10.1523/JNEUROSCI.1973-15.2016
Carson, N., Leach, L., and Murphy, K. J. (2018). A re-examination of montreal cognitive assessment (MoCA) cutoff scores. Int. J. Geriatr. Psychiatry 33, 379–388. doi: 10.1002/gps.4756
Civier, O., Smith, R. E., Yeh, C.-H., Connelly, A., and Calamante, F. (2019). Is removal of weak connections necessary for graph-theoretical analysis of dense weighted structural connectomes from diffusion MRI? NeuroImage 194, 68–81. doi: 10.1016/j.neuroimage.2019.02.039
Cohen, J. R., and D'Esposito, M. (2016). The segregation and integration of distinct brain networks and their relationship to cognition. J. Neurosci. 36, 12083–12094. doi: 10.1523/JNEUROSCI.2965-15.2016
Coxon, J. P., Goble, D. J., Leunissen, I., Van Impe, A., Wenderoth, N., and Swinnen, S. P. (2016). Functional brain activation associated with inhibitory control deficits in older adults. Cereb. Cortex 26, 12–22. doi: 10.1093/cercor/bhu165
Coxon, J. P., Van Impe, A., Wenderoth, N., and Swinnen, S. P. (2012). Aging and inhibitory control of action: cortico-subthalamic connection strength predicts stopping performance. J. Neurosci. 32, 8401–8412. doi: 10.1523/JNEUROSCI.6360-11.2012
Dale, A. M., Fischl, B., and Sereno, M. I. (1999). Cortical surface-based analysis. NeuroImage 9, 179–194. doi: 10.1006/nimg.1998.0395
Damoiseaux, J. S. (2017). Effects of aging on functional and structural brain connectivity. NeuroImage 160, 32–40. doi: 10.1016/j.neuroimage.2017.01.077
Deery, H. A., Di Paolo, R., Moran, C., Egan, G. F., and Jamadar, S. D. (2023). The older adult brain is less modular, more integrated, and less efficient at rest: a systematic review of large-scale resting-state functional brain networks in aging. Psychophysiology 60:e14159. doi: 10.1111/psyp.14159
Desikan, R. S., Ségonne, F., Fischl, B., Quinn, B. T., Dickerson, B. C., Blacker, D., et al. (2006). An automated labeling system for subdividing the human cerebral cortex on MRI scans into gyral based regions of interest. NeuroImage 31, 968–980. doi: 10.1016/j.neuroimage.2006.01.021
Dhollander, T., Raffelt, D., and Connelly, A. (2016). Unsupervised 3-tissue response function estimation from single-shell or multi-shell diffusion MR data without a co-registered T1 image. Proc. Intl. Soc. Mag. Reson. Med. ISMRM Workshop on Breaking the Barriers of Diffusion MRI, Lisbon, Portugal.
Dhollander, T., Tabbara, R., Rosnarho-Tornstrand, J., Tournier, J.-D., Raffelt, D., and Connelly, A. (2021). Multi-tissue log-domain intensity and inhomogeneity normalisation for quantitative apparent fibre density. Proc. Intl. Soc. Mag. Reson. Med. 29.
Diamond, A. (2013). Executive functions. Annu. Rev. Psychol. 64, 135–168. doi: 10.1146/annurev-psych-113011-143750
Farahani, F. V., Karwowski, W., and Lighthall, N. R. (2019). Application of graph theory for identifying connectivity patterns in human brain networks: a systematic review. Front. Neurosci. 13:585. doi: 10.3389/fnins.2019.00585
Ferguson, H. J., Brunsdon, V. E. A., and Bradford, E. E. F. (2021). The developmental trajectories of executive function from adolescence to old age. Sci. Rep. 11:1382. doi: 10.1038/s41598-020-80866-1
Fisk, J. E., and Sharp, C. A. (2004). Age-related impairment in executive functioning: updating, inhibition, shifting, and access. J. Clin. Exp. Neuropsychol. 26, 874–890. doi: 10.1080/13803390490510680
Fjell, A. M., Sneve, M. H., Grydeland, H., Storsve, A. B., and Walhovd, K. B. (2017). The disconnected brain and executive function decline in aging. Cereb. Cortex 27, 2302–2307. doi: 10.1093/cercor/bhw082
Friedman, N. P., and Miyake, A. (2017). Unity and diversity of executive functions: individual differences as a window on cognitive structure. Cortex 86, 186–204. doi: 10.1016/j.cortex.2016.04.023
Friedman, N. P., Miyake, A., Altamirano, L. J., Corley, R. P., Young, S. E., Rhea, S. A., et al. (2016). Stability and change in executive function abilities from late adolescence to early adulthood: a longitudinal twin study. Dev. Psychol. 52, 326–340. doi: 10.1037/dev0000075
Gong, G., Rosa-Neto, P., Carbonell, F., Chen, Z. J., He, Y., and Evans, A. C. (2009). Age- and gender-related differences in the cortical anatomical network. J. Neurosci. 29, 15684–15693. doi: 10.1523/JNEUROSCI.2308-09.2009
Gustavson, D. E., Archer, D. B., Elman, J. A., Puckett, O. K., Fennema-Notestine, C., Panizzon, M. S., et al. (2023). Associations among executive function abilities, free water, and white matter microstructure in early old age. NeuroImage 37:103279. doi: 10.1016/j.nicl.2022.103279
Hayes, A. F., and Rockwood, N. J. (2017). Regression-based statistical mediation and moderation analysis in clinical research: observations, recommendations, and implementation. Behav. Res.Ther. 98, 39–57. doi: 10.1016/j.brat.2016.11.001
Hinault, T., Mijalkov, M., Pereira, J. B., Volpe, G., Bakke, A., and Courtney, S. M. (2021). Age-related differences in network structure and dynamic synchrony of cognitive control. NeuroImage 236:118070. doi: 10.1016/j.neuroimage.2021.118070
Hoagey, D. A., Lazarus, L. T. T., Rodrigue, K. M., and Kennedy, K. M. (2021). The effect of vascular health factors on white matter microstructure mediates age-related differences in executive function performance. Cortex 141, 403–420. doi: 10.1016/j.cortex.2021.04.016
Horn, J. L., and Cattell, R. B. (1967). Age differences in fluid and crystallized intelligence. Acta Psychol. 26, 107–129. doi: 10.1016/0001-6918(67)90011-X
Jenkinson, M., Beckmann, C. F., Behrens, T. E. J., Woolrich, M. W., and Smith, S. M. (2012). FSL. NeuroImage 62, 782–790. doi: 10.1016/j.neuroimage.2011.09.015
Jeurissen, B., Tournier, J.-D., Dhollander, T., Connelly, A., and Sijbers, J. (2014). Multi-tissue constrained spherical deconvolution for improved analysis of multi-shell diffusion MRI data. NeuroImage 103, 411–426. doi: 10.1016/j.neuroimage.2014.07.061
Kellner, E., Dhital, B., Kiselev, V. G., and Reisert, M. (2016). Gibbs-ringing artifact removal based on local subvoxel-shifts: gibbs-ringing artifact removal. Magn. Reson. Med. 76, 1574–1581. doi: 10.1002/mrm.26054
King, B. R., van Ruitenbeek, P., Leunissen, I., Cuypers, K., Heise, K.-F., Santos Monteiro, T., et al. (2018). Age-related declines in motor performance are associated with decreased segregation of large-scale resting state brain networks. Cereb. Cortex 28, 4390–4402. doi: 10.1093/cercor/bhx297
Klein, A., and Tourville, J. (2012). 101 labeled brain images and a consistent human cortical labeling protocol. Front. Neurosci. 6:171. doi: 10.3389/fnins.2012.00171
Latora, V., and Marchiori, M. (2001). Efficient behavior of small-world networks. Phys. Rev. Lett. 87:198701. doi: 10.1103/PhysRevLett.87.198701
Li, X., Wang, Y., Wang, W., Huang, W., Chen, K., Xu, K., et al. (2020). Age-related decline in the topological efficiency of the brain structural connectome and cognitive aging. Cereb. Cortex 30, 4651–4661. doi: 10.1093/cercor/bhaa066
MacKinnon, D. P., Fairchild, A. J., and Fritz, M. S. (2007). Mediation analysis. Ann. Rev. Psychol. 58, 593–614. doi: 10.1146/annurev.psych.58.110405.085542
Madden, D. J., Bennett, I. J., Burzynska, A., Potter, G. G., Chen, N., and Song, A. W. (2012). Diffusion tensor imaging of cerebral white matter integrity in cognitive aging. Bba-Mol. Basis. Dis. 1822, 386–400. doi: 10.1016/j.bbadis.2011.08.003
Madden, D. J., Bennett, I. J., and Song, A. W. (2009). Cerebral white matter integrity and cognitive aging: contributions from diffusion tensor imaging. Neuropsychol. Rev. 19, 415–435. doi: 10.1007/s11065-009-9113-2
Madden, D. J., Jain, S., Monge, Z. A., Cook, A. D., Lee, A., Huang, H., et al. (2020). Influence of structural and functional brain connectivity on age-related differences in fluid cognition. Neurobiol Aging 96, 205–222. doi: 10.1016/j.neurobiolaging.2020.09.010
Madole, J. W., Buchanan, C. R., Rhemtulla, M., Ritchie, S. J., Bastin, M. E., Deary, I. J., et al. (2023). Strong intercorrelations among global graph-theoretic indices of structural connectivity in the human brain. NeuroImage 275:120160. doi: 10.1016/j.neuroimage.2023.120160
Maldonado, T., Orr, J. M., Goen, J. R. M., and Bernard, J. A. (2020). Age differences in the subcomponents of executive functioning. J. Gerontol. B. 75, e31–e55. doi: 10.1093/geronb/gbaa005
Mathôt, S., Schreij, D., and Theeuwes, J. (2012). Opensesame: an open-source, graphical experiment builder for the social sciences. Behav. Res. Methods 44, 314–24. doi: 10.3758/s13428-011-0168-7
Miyake, A., and Friedman, N. P. (2012). The nature and organization of individual differences in executive functions: four general conclusions. Curr. Dir. Psychol. Sci. 21, 8–14. doi: 10.1177/0963721411429458
Miyake, A., Friedman, N. P., Emerson, M. J., Witzki, A. H., Howerter, A., and Wager, T. D. (2000). The unity and diversity of executive functions and their contributions to complex “frontal lobe” tasks: a latent variable analysis. Cogn. Psychol. 41, 49–100. doi: 10.1006/cogp.1999.0734
Nasreddine, Z. S., Phillips, N. A., Bedirian, V., Charbonneau, S., Whitehead, V., Collin, I., et al. (2005). The montreal cognitive assessment, MOCA: a brief screening tool for mild cognitive impairment. J. Am. Geriatr. Soc. 53, 695–699. doi: 10.1111/j.1532-5415.2005.53221.x
Niendam, T. A., Laird, A. R., Ray, K. L., Dean, Y. M., Glahn, D. C., and Carter, C. S. (2012). Meta-analytic evidence for a superordinate cognitive control network subserving diverse executive functions. Cogn. Affect. Behav. Neurosci. 12, 241–268. doi: 10.3758/s13415-011-0083-5
O'Sullivan, M., Jones, D. K., Summers, P. E., Morris, R. G., Williams, S. C. R., and Markus, H. S. (2001). Evidence for cortical “disconnection” as a mechanism of age-related cognitive decline. Neurology 57, 632–638. doi: 10.1212/WNL.57.4.632
Patenaude, B., Smith, S. M., Kennedy, D. N., and Jenkinson, M. (2011). A Bayesian model of shape and appearance for subcortical brain segmentation. NeuroImage 56, 907–922. doi: 10.1016/j.neuroimage.2011.02.046
Rhodes, M. G. (2004). Age-related differences in performance on the Wisconsin card sorting test: a meta-analytic review. Psychol. Aging 19, 482–494. doi: 10.1037/0882-7974.19.3.482
Ribeiro, M., Yordanova, Y. N., Noblet, V., Herbet, G., and Ricard, D. (2023). White matter tracts and executive functions: a review of causal and correlation evidence. Brain 147:awad308. doi: 10.1093/brain/awad308
Rodríguez-Nieto, G., Seer, C., Sidlauskaite, J., Vleugels, L., Van Roy, A., Hardwick, R., et al. (2022). Inhibition, shifting and updating: inter and intra-domain commonalities and differences from an executive functions activation likelihood estimation meta-analysis. NeuroImage 264:119665. doi: 10.1016/j.neuroimage.2022.119665
Rosseel, Y. (2012). lavaan: an R package for structural equation modeling. J. Stat. Softw. 48, 1–36. doi: 10.18637/jss.v048.i02
Rubinov, M., and Sporns, O. (2010). Complex network measures of brain connectivity: uses and interpretations. NeuroImage 52, 1059–1069. doi: 10.1016/j.neuroimage.2009.10.003
Schlichting, L. (2005). Peabody Picture Vocabulary Test-III-NL. Amsterdam: Hartcourt Test Publishers.
Seer, C., Sidlauskaite, J., Lange, F., Rodríguez-Nieto, G., and Swinnen, S. P. (2021). Cognition and action: a latent variable approach to study contributions of executive functions to motor control in older adults. Aging 13, 15942–15963. doi: 10.18632/aging.203239
Seer, C., Zivari Adab, H., Sidlauskaite, J., Dhollander, T., Chalavi, S., Gooijers, J., et al. (2022). Bridging cognition and action: executive functioning mediates the relationship between white matter fiber density and complex motor abilities in older adults. Aging 14, 7263–7281. doi: 10.18632/aging.204237
Serbruyns, L., Leunissen, I., van Ruitenbeek, P., Pauwels, L., Caeyenberghs, K., Solesio-Jofre, E., et al. (2016). Alterations in brain white matter contributing to age-related slowing of task switching performance: the role of radial diffusivity and magnetization transfer ratio: aging, brain white matter, and task switching. Hum. Brain Mapp. 37, 4084–4098. doi: 10.1002/hbm.23297
Shen, K., Welton, T., Lyon, M., McCorkindale, A. N., Sutherland, G. T., Burnham, S., et al. (2020). Structural core of the executive control network: a high angular resolution diffusion MRI study. Hum. Brain Mapp. 41, 1226–1236. doi: 10.1002/hbm.24870
Smith, R. E., and Connelly, A. (2019). “MRtrix3_connectome: A BIDS Application for quantitative structural connectome construction,” in Organisation for Human Brain Mapping (OHBM), Rome, Italy.
Smith, R. E., Tournier, J.-D., Calamante, F., and Connelly, A. (2012). Anatomically-constrained tractography: improved diffusion MRI streamlines tractography through effective use of anatomical information. NeuroImage 62, 1924–1938. doi: 10.1016/j.neuroimage.2012.06.005
Smith, R. E., Tournier, J.-D., Calamante, F., and Connelly, A. (2015a). SIFT2: Enabling dense quantitative assessment of brain white matter connectivity using streamlines tractography. NeuroImage 119, 338–351. doi: 10.1016/j.neuroimage.2015.06.092
Smith, R. E., Tournier, J.-D., Calamante, F., and Connelly, A. (2015b). The effects of SIFT on the reproducibility and biological accuracy of the structural connectome. NeuroImage 104, 253–265. doi: 10.1016/j.neuroimage.2014.10.004
Sporns, O. (2013). Structure and function of complex brain networks. Dialogues Clin. Neurosci. 15, 247–262. doi: 10.31887/DCNS.2013.15.3/osporns
Tang, R., Elman, J. A., Franz, C. E., Dale, A. M., Eyler, L. T., Fennema-Notestine, C., et al. (2023). Longitudinal association of executive function and structural network controllability in the aging brain. GeroScience 45, 837–849. doi: 10.1007/s11357-022-00676-3
Tournier, J.-D., Calamante, F., and Connelly, A. (2010). Improved probabilistic streamlines tractography by 2nd order integration over fibre orientation distributions. Proc. Intl. Soc. Mag. Reson. Med. 18:1670.
Tournier, J.-D., Smith, R., Raffelt, D., Tabbara, R., Dhollander, T., Pietsch, M., et al. (2019). MRtrix3: a fast, flexible and open software framework for medical image processing and visualisation. NeuroImage 202:116137. doi: 10.1016/j.neuroimage.2019.116137
Veraart, J., Novikov, D. S., Christiaens, D., Ades-aron, B., Sijbers, J., and Fieremans, E. (2016). Denoising of diffusion MRI using random matrix theory. NeuroImage 142, 394–406. doi: 10.1016/j.neuroimage.2016.08.016
Wang, Y., Ghumare, E., Vandenberghe, R., and Dupont, P. (2017). Comparison of different generalizations of clustering coefficient and local efficiency for weighted undirected graphs. Neural Comput. 29, 313–331. doi: 10.1162/NECO_a_00914
Webb, C. E., Rodrigue, K. M., Hoagey, D. A., Foster, C. M., and Kennedy, K. M. (2020). Contributions of white matter connectivity and BOLD modulation to cognitive aging: a lifespan structure-function association study. Cereb. Cortex 30, 1649–1661. doi: 10.1093/cercor/bhz193
Wen, W., Zhu, W., He, Y., Kochan, N. A., Reppermund, S., Slavin, M. J., et al. (2011). Discrete neuroanatomical networks are associated with specific cognitive abilities in old age. J. Neurosci. 31, 1204–1212. doi: 10.1523/JNEUROSCI.4085-10.2011
Westlye, L. T., Walhovd, K. B., Dale, A. M., Bjornerud, A., Due-Tonnessen, P., Engvig, A., et al. (2010). Life-span changes of the human brain white matter: diffusion tensor imaging (DTI) and volumetry. Cereb. Cortex 20, 2055–2068. doi: 10.1093/cercor/bhp280
Yeh, C.-H., Jones, D. K., Liang, X., Descoteaux, M., and Connelly, A. (2021). Mapping structural connectivity using diffusion MRI: challenges and opportunities. J. Magn. Reson. Imaging 53, 1666–1682. doi: 10.1002/jmri.27188
Yeh, C.-H., Smith, R. E., Dhollander, T., Calamante, F., and Connelly, A. (2019). Connectomes from streamlines tractography: assigning streamlines to brain parcellations is not trivial but highly consequential. NeuroImage 199, 160–171. doi: 10.1016/j.neuroimage.2019.05.005
Yeh, C.-H., Smith, R. E., Liang, X., Calamante, F., and Connelly, A. (2016). Correction for diffusion MRI fibre tracking biases: the consequences for structural connectomic metrics. NeuroImage 142, 150–162. doi: 10.1016/j.neuroimage.2016.05.047
Yeo, B. T. T., Krienen, F. M., Sepulcre, J., Sabuncu, M. R., Lashkari, D., Hollinshead, M., et al. (2011). The organization of the human cerebral cortex estimated by intrinsic functional connectivity. J. Neurophysiol. 106, 1125–1165. doi: 10.1152/jn.00338.2011
Ystad, M., Hodneland, E., Adolfsdottir, S., Haász, J., Lundervold, A. J., Eichele, T., et al. (2011). Cortico-striatal connectivity and cognition in normal aging: a combined DTI and resting state fMRI study. NeuroImage 55, 24–31. doi: 10.1016/j.neuroimage.2010.11.016
Zahr, N. M., Rohlfing, T., Pfefferbaum, A., and Sullivan, E. V. (2009). Problem solving, working memory, and motor correlates of association and commissural fiber bundles in normal aging: a quantitative fiber tracking study. NeuroImage 44, 1050–1062. doi: 10.1016/j.neuroimage.2008.09.046
Zhao, T., Cao, M., Niu, H., Zuo, X.-N., Evans, A., He, Y., et al. (2015). Age-related changes in the topological organization of the white matter structural connectome across the human lifespan: lifespan trajectory of human structural connectome. Hum. Brain Mapp. 36, 3777–3792. doi: 10.1002/hbm.22877
Keywords: aging, executive functions, structural connectivity, brain networks, graph theory, DWI, efficiency, segregation
Citation: Rodríguez-Nieto G, Seer C, Adab HZ, Jimenez-Marin A, Chalavi S, Rasooli A, Cortés JM, Sunaert S and Swinnen SP (2025) Efficiency of structural brain networks mediates age-associated differences in executive functioning in older adults. Front. Aging Neurosci. 17:1593868. doi: 10.3389/fnagi.2025.1593868
Received: 14 March 2025; Accepted: 13 June 2025;
Published: 08 July 2025.
Edited by:
Ian M. McDonough, Binghamton University, United StatesReviewed by:
Xueyun Deng, Sichuan Provincial People's Hospital Eastern Sichuan Hospital & Dazhou First People's Hospital, ChinaMelanie Matyi, University of Pennsylvania, United States
Copyright © 2025 Rodríguez-Nieto, Seer, Adab, Jimenez-Marin, Chalavi, Rasooli, Cortés, Sunaert and Swinnen. This is an open-access article distributed under the terms of the Creative Commons Attribution License (CC BY). The use, distribution or reproduction in other forums is permitted, provided the original author(s) and the copyright owner(s) are credited and that the original publication in this journal is cited, in accordance with accepted academic practice. No use, distribution or reproduction is permitted which does not comply with these terms.
*Correspondence: Stephan P. Swinnen, c3RlcGhhbi5zd2lubmVuQGt1bGV1dmVuLmJl
†These authors have contributed equally to this work and share first authorship