Abstract
Background:
Current research is predominantly focused on the single dysfunction after stroke, but the potential changes in brain dynamics of post-stroke cognitive and motor dysfunction (PSCMD) remain unclear, which hinders a deep understanding of its rehabilitation effects. Therefore, the objective is to explore the dynamic brain network characteristics of PSCMD.
Methods:
The clinical features and resting-state functional magnetic resonance imaging (rs-fMRI) data were collected from 75 patients with post-stroke motor dysfunction (PSMD), 33 patients with PSCMD, and 35 healthy controls (HCs). Hidden markov model (HMM) was employed for the rs-fMRI data, aiming to identify the repetitive states of brain activity while further assessing the temporal properties and activation patterns in PSCMD. Additionally, the correlation between the HMM state characteristics and clinical scale scores was systematically evaluated.
Results:
Five HMM states were ultimately identified. According to the results, PSMD and PSCMD groups showed significant changes in the dynamics of spatiotemporal attributes versus HCs, including fractional occupancy (FO), Lifetime (LT), and transition probability (TP). Furthermore, PSCMD patients exhibited greater FO than PSMD (p = 0.006) in state 3. State 3 was mainly characterized by low activation of sensorimotor and higher-order cognitive networks, as well as the high activation of the right prefrontal-parietal network, which may reflect adaptive changes in the brain after PSCMD. Besides, the FO of HMM state 3 exhibited a negative connection with the MoCa score (r = −0.389, p = 0.025).
Conclusion:
An abnormal dynamic brain reorganization pattern could be observed in PSCMD patients. Neuromodulation strategies can be optimized by HMM-derived brain states in the future.
1 Introduction
Stroke has become the predominant cause of persistent disability globally (Hilkens et al., 2024). Specifically, survivors tend to manifest as multiple functional impairments, including motor dysfunction, cognitive impairment, speech disorders, and dysphagia (Einstad et al., 2021; Wang et al., 2021; Craig et al., 2022), and over 80% of the patients will experience cognitive and motor concurrent impairments after stroke (Patel et al., 2003). This dual dysfunction has serious effects on patients’ quality of life and results in a huge socioeconomic burden. However, existing studies predominantly focus on single cognitive or motor dysfunction after stroke, while the neural mechanisms underlying post-stroke cognitive and motor dysfunction (PSCMD) are relatively overlooked (Yue et al., 2023; Wang Y. et al., 2024; Pang et al., 2024) which results in a lack of targeted treatment for PSCMD patients, thus exhibiting a negative effect on their rehabilitation outcomes.
Resting-state functional magnetic resonance imaging is extensively employed in the exploration of the neural mechanisms of patients with brain diseases (Viviano and Damoiseaux, 2020; Chen et al., 2021). It has been revealed that intra- and inter-network functional connectivity (FC) of the sensorimotor network (SMN), default mode network (DMN), frontoparietal network (FPN), and salience network (SN) of stroke patients are disrupted, and these FC changes exhibit a strong connection with various dysfunctions after stroke, such as motor and cognitive functions (Cao et al., 2023; Zhang, 2025; Larivière et al., 2018; Vicentini et al., 2021). However, static network analysis methods were employed in all of the studies mentioned above, while the dynamic properties of the network were overlooked (Yue et al., 2023; Pang et al., 2024; Cohen, 2018; Wang et al., 2020; Lu et al., 2024). With the application of a sliding-window dynamic approach, it was found by a recent study that the connections between the visual network and other networks in post-stroke cognitive dysfunction (PSCI) patients were weakened, and they were undetected in static functional connectivity analysis, which underscored the importance of dynamic functional connectivity analysis in the deep exploration of neural mechanisms (Yue et al., 2023). Besides, studies have shown that dynamic brain remodeling has been proven to be a promising approach for creating novel biomarkers for disorders such as cognitive impairment (Xu et al., 2021), schizophrenia (Sun et al., 2019) and epilepsy (Qin et al., 2024). However, there is still a great deal of unknown about how brain networks dynamically remodel after stroke, particularly in PSCMD.
Although sliding window analysis is a commonly used method, it has certain limitations. This approach depends on a fixed window size that requires predetermined size and step increments, and the choice of window size is often somewhat subjective (Vidaurre et al., 2021). Hidden markov model (HMM) has advantages in modeling temporal dependencies and avoiding arbitrary window selection. HMM can accurately capture the transient characteristics of brain state transitions and identify the differences in brain networks of neuropsychiatric patients with its millisecond time resolution (Kottaram et al., 2019; Meer et al., 2020; Javaheripour et al., 2023), thus providing a new perspective for the explanation of the neural mechanisms of neuropsychiatric diseases. For example, Lu et al. (2024) demonstrated that disrupted dynamic reorganization of the DMN might serve as a critical neural factor in cognitive deficits following mild traumatic brain injury. Besides, Zhang et al. (2024) found that frontoparietal structural damage exhibited a strong connection with the decline of activation of the cognitive control network in bipolar disorder. Moreover, Kottaram et al. (2019) demonstrated that the degree of positive symptoms in individuals with schizophrenia exhibited a connection with the enhanced activity in sensory networks and a greater percentage of time spent in states with inactive executive networks (ECN) and DMN. Vidaurre et al. (2017) observed that brain network dynamics are closely related to cognition. Cornblath et al. (2020) found that Temporal sequences of brain activity at rest are modulated by cognitive demands. These findings provided crucial evidence for the deep exploration of the underlying neural mechanisms of PSCMD. Therefore, the application of HMM to PSCMD could be employed in the identification of key biomarkers related to cognitive or motor disorders, thereby providing new insights into the optimization of neural regulation strategies.
In this study, we conducted dynamic brain network analysis of resting-state fMRI data from stroke and healthy controls (HCs) utilizing HMM methodology to identify varying brain states between stroke patients and HCs. We also explored differences in spatiotemporal properties across groups exhibiting distinct dysfunctions after stroke. Based on prior findings, we inferred that stroke patients would experience alterations in state transitions along with specific patterns within their brain networks, alongside potential shared and unique changes in spatiotemporal characteristics between PSCMD and post-stroke motor dysfunction (PSMD) networks.
2 Materials and methods
2.1 Participant
This research recruited 114 patients with motor dysfunction after stroke. The inclusion criteria were: (1) diagnosis by CT or MRI; (2) first onset of the disease; (3) duration of 2 weeks–3 months; (4) lesions confined to a single hemisphere, primarily involving the basal ganglia and their adjacent areas; (5) age range of 40–75 years old; (6) right-handedness; and (7) stable vital signs and clear consciousness. The exclusion criteria were: (1) history of stroke; (2) history of neurologic or psychiatric disorders, as well as other serious physical diseases; (3) contraindications to MRI examination. Based on the exclusion criteria, four patients were excluded due to previous neurological or mental disorders, and two patients with excessive head movement (translation > 2.5 mm, movement > 2.5°, or mean FD > 0.5 mm) were also excluded. Eventually, 108 patients were incorporated. According to previous research suggestions (Pendlebury et al., 2011; Sachdev et al., 2004), stroke patients were divided into two subgroups: the patients with MMSE score ≥ 26 and MoCA scores ≥ 26were classified as the PSCD group (n = 75), while those with MMSE scores < 26 and MoCA scores < 26 were classified as the PSCMD group (n = 33). Furthermore, 35 healthy individuals who were matched by age and gender were recruited in this research (Figure 1). This study was approved by the Ethics Committee of the 900 Hospital of the People’s Liberation Army Joint Logistics Force (NO. 2015011). Every participant provided written informed consent.
FIGURE 1

Participant recruitment flowchart.
2.2 Clinical assessment
With the application of the Fugl-Meyer assessment scale (FMA), motor function was evaluated in this study (Chen et al., 2022). Besides, daily life abilities were evaluated using the Modified Barthel Index (MBI) (Ohura et al., 2017). The Brief Mental State Examination (MMSE) and the Montreal Cognitive Assessment (MoCa) were employed in the assessment of cognitive function (Folstein et al., 1975; Nasreddine et al., 2005).
2.3 MRI acquisition
A 3.0T Siemens Trio scanner (Erlangen, Germany) with a 12-channel phased-array head coil was employed for the whole-brain imaging. Participants were positioned supine, and foam padding was applied to stabilize the head and minimize the motion artifacts. Throughout the scan, subjects were asked to keep their eyes closed and stay awake, maintain relaxed breathing, and avoid voluntary movements. rs-fMRI and detailed 3D T1-weighted structural scans were achieved from all the participants. Gradient-echo planar imaging was employed in the rs-fMRI protocol, and the parameters were set as: repetition time (TR) = 2,000 ms, echo time (TE) = 21 ms, 33 contiguous axial slices (4 mm thickness, 0.8 mm interslice gap), matrix = 64 × 64, field of view = 240 × 240 mm2, and a total of 180 volumes were collected over 6 min. 3D T1-weighted parameters were parameterized as follows: TR = 1,900 ms, TE = 2.52 ms, layer thickness = 1 mm, no layer spacing, field of view = 240 × 240 mm2, matrix = 256 × 256, number of layers = 176.
2.4 Lesion analysis
Lesions were meticulously delineated layer by layer on T1-weighted MR images utilizing MRIcron1. Subsequently, the regions of interest (ROIs) were normalized to the MNI spatial template through MR fragment normalization within the SPM8 clinical toolbox. Finally, lesion maps from stroke patients were binarized and overlaid onto T1-weighted templates in the MRIcron software to generate lesion probability maps. We constructed a composite ROI by integrating the normalized ROIs and superimposed this composite ROI onto the T1-weighted template to illustrate the overlapping regions (Figure 2).
FIGURE 2

The overlap map of the lesions across all the stroke patients. Color bar indicates the percentage of the lesion overlap.
2.5 Data preprocessing
Before data preprocessing, we flipped the MRI data of patients with left-sided lesions from left to right along the midsagittal line. DPABI2 was employed for preprocessing by the following steps: (1) Transform the initial DICOM file into the 4DNifti file format; (2) Remove the first 10 time points, alongside the concurrent slice-time correction and head motion correction on the remaining 170 time points, excluding participants with translation > 2.5 mm, movement > 2.5°, or mean FD > 0.5 mm; (3) Co-register the realigned image with a single 3D T1-weighted image to complete the transformation from a single space to the standard Montreal Institute of Neuroscience space; (4) Smooth on a 6 mm half-height, full-width Gaussian space; (5) Remove noise by regression including Friston’s 24 motor parameters, white matter, cerebrospinal fluid, and global brain signals; (6) Filter in the frequency range of 0.01–0.10 Hz to mitigate the interference of high-frequency noise and low-frequency drift on the images.
2.6 Hidden markov modeling
Hidden markov model is a markov process with the incorporation of hidden states. The changes in brain activity over time scales can be explained by a limited number of hidden states. Firstly, the AAL90 brain atlas was employed as the later observation sequence in the extraction of the time series of the subjects after preprocessing. Secondly, 90 ROIs × 170 time-point spatio-temporal data were generated for the construction of HMM. Subsequently, the HMM-MAR toolbox in MATLAB3 was used to define states through multivariate Gaussian distributions (Vidaurre et al., 2017). Iterative calculations ranging from 2 to 15 states were conducted following a prior study (Moretto et al., 2022). Finally, the number of different HMM states was evaluated by summarizing statistical indicators, which were composed of the minimum free energy and the median fraction occupancy. It was found that the HMM reached the minimum free energy state when the number of states was 5, and 5 HMM states were selected for subsequent studies (Figures 3A–C).
FIGURE 3

(A) The brain regions of each subject were segmented into 90 regions of interest with AAL mapping. (B) Time-series data, including 90 areas and 170 time points were collected for all participants. (C) Five hidden markov model (HMM) states were identified. (D) Four dynamic state metrics [including fractional occupancy (FO), lifetime (LT), switch rate (SR), and transition probability (TP)] were evaluated. * represents p < 0.05.
2.7 Temporal properties of HMM
The metrics reflecting temporal brain dynamics were examined: (1) FO: the ratio of time that each subject spent in a specific state. (2) LT: LT is the stretch that a state lingers before shifting into another, which could reflect the stability of the state; (3) Switch rate (SR): it is defined as the frequency of transitions between different states, which could indicate the speed of dynamic changes; (4) TP is the key factor of HMM, which represents the likelihood of changing from a state to another (Figure 3D).
2.8 Statistical analysis
The SPSS 23.0 software (SPSS Inc., Chicago, Illinois, United States) was utilized in this study. Continuous variables were expressed as mean ± standard deviation (SD), while categorical variables were presented as counts. The Shapiro-Wilk test was employed in the assessment of the normality of the data. Continuous variables were assessed by independent t-tests or one-way analysis of variance (ANOVA), while categorical variables were analyzed with chi-square tests. A two-tailed t-test was applied in the comparison of FO, LT, and SR of HMM status in stroke and HCs, as well as PSMD and PSCMD patients. False discovery rate (FDR) correction was applied to multiple comparisons. p < 0.05 threshold was considered to indicate statistical significance.
A non-parametric permutation test was utilized to compare HMM state transition probabilities between stroke patients and HCs, as well as PSMD and PSCMD, with the involvement of 5,000 permutations. Moreover, Spearman correlation analysis was employed in the evaluation of the connections between HMM state-time attributes and FMA and MMSE scores. p < 0.05 threshold was considered to indicate statistical significance.
2.9 Verification analysis
To validate the robustness of the results obtained from the HMM approach, we perform a validation analysis using the sliding window analysis method and K-means clustering framework. Firstly, the dynamic functional network connectivity (FNC) was computed using a sliding time window approach with the window size set to 22 TR (44s) and a step size of 1 TR. Secondly, a K-means clustering algorithm was applied to the windowed FNC matrix to extract the same number of states as in the HMM model (K = 5). Finally, the temporal properties of the dynamic FNC states were extracted to assess the consistency of the population trends.
3 Results
3.1 Demographic and clinical data
A total of 108 ischemic stroke patients and 35 HCs were included in this research. Regarding the aspects of age and gender, no significant differences were observed between the stroke patients and HCs. In stroke subgroup analysis, the MoCA scores and MMSE scores were significantly different between PSMD and PSCMD (p < 0.05), whereas no differences could be found in the aspects of stroke duration, type, lesion hemisphere, FMA, and MBI (Table 1).
TABLE 1
| Variable | PSMD (n = 75) | PSCMD (n = 33) | HCs (n = 35) | P-value |
| Age, y, mean (SD) | 56.95 ± 1.098 | 60.21 ± 1.675 | 57.69 ± 1.321 | 0.234 |
| Sex, male, n (%) | 55 (73%) | 18 (55%) | 20 (57%) | 0.090 |
| Stroke duration, d, mean (SD) | 33.91 ± 23.29 | 33.85 ± 20.56 | NA | 0.990 |
| Stroke type, ischemia, n (%) | 71 (95%) | 30 (91%) | NA | 0.456 |
| Lesion hemisphere, left, n (%) | 42 (56%) | 17 (52%) | NA | 0.666 |
| FMA, mean (SD) | 59.71 ± 25.14 | 52.48 ± 23.42 | NA | 0.163 |
| Barthel, mean (SD) | 69.64 ± 19.92 | 62.24 ± 22.46 | NA | 0.090 |
| MMSE, mean (SD) | 28.89 ± 1.09 | 21.91 ± 4.52 | NA | <0.001 |
| MoCa, mean (SD) | 28.21 ± 1.11 | 17.30 ± 6.38 | NA | <0.001 |
Demographic and clinical characteristics.
HCs, healthy controls; PSMD, post-stroke motor dysfunction; PSCMD, post-stroke cognitive and motor dysfunction; M ± SD, mean ± standard deviation.
3.2 Average functional activity of HMM states
As shown in Figure 3C, State1 is mainly a decrease in activation for most regions, but its average functional activity is relatively higher than that of state 4. State2 is mainly a relative increase in activation for most regions, but its average functional activity is relatively lower than state 5. State 3 is mainly characterized by relatively decreased activation in most areas, but increased activation in the right frontal_mid, right frontal_mid_orb, right temporal_sup, right inferior parietal lobule, right coronal gyrus, and right anterior cuneus. State4 is primarily a decrease in overall regional activation. State5 is primarily an increase in overall regional activation.
3.3 Dynamics of each HMM state
Compared with HCs, stroke patients exhibited noticeably higher FO (t = 2.603, p = 0.018, FDR-corrected) and LT (t = 2.255, p = 0.040, FDR-corrected) in State 2, as well as FO (t = 3.025, p = 0.008, FDR-corrected) and LT (t = 2.903, p = 0.010, FDR-corrected) in State 3; whereas FO (t = −4.732, p = 0.0001, FDR-corrected) and LT (t = −4.175, p = 0.0002, FDR-corrected) in State 5 exhibited a significant decreasing trend. Furthermore, it was revealed by subgroup analyses that PSCMD patients showed significantly higher FO (t = 3.096, p = 0.006, FDR-corrected) and LT (t = 2.332, p = 0.022, FDR-corrected) in State 3 than PSMD patients (Figure 4).
FIGURE 4

Fractional occupancy (FO) and lifetime (LT) in different hidden markov model (HMM) states of the stroke and healthy controls (HCs), as well as post-stroke motor dysfunction (PSMD) and post-stroke cognitive and motor dysfunction (PSCMD). Blue represents stroke patients or PSCMD patients, and yellow represents HCs or PSMD patients. *p < 0.05.
3.4 Transition patterns between HMM states
According to the comparison of the transfer patterns of HMM states, no significant difference in SR could be observed (p > 0.05) (Figure 5A), which could suggest that stroke patients exhibited stable network dynamics (similar to HCs) during resting-state scanning. However, the TP of HMM states varied between the two groups (Figure 5B). Specifically, compared with HCs, stroke patients exhibited a significantly higher transition probability for state 1 to state 3, state 2 to states 1–3, state 3 to states 1–3, and state 4 to state 1 (state 1 to 3: p = 0.011; state 2 to 1: p = 0.031; state 2 to 2: p = 0.010; state 2 to 3: p = 0.001; state 3 to 1: p = 0.040; state 3 to 2: p = 0.007; state 3 to 3: p = 0.011; state 4 to 1: p = 0.025). Besides, stroke patients exhibited a significantly lower probability of transitioning from HMM states 1, 4, and 5 to state 5 (state 1 to 5: p = 0.002; state 4 to 5: p = 0.001; state 5 to 5: p = 0.00001). Overall, it could be implied by these results that stroke patients exhibited a noteworthy pattern of aberrant transitions between HMM states.
FIGURE 5
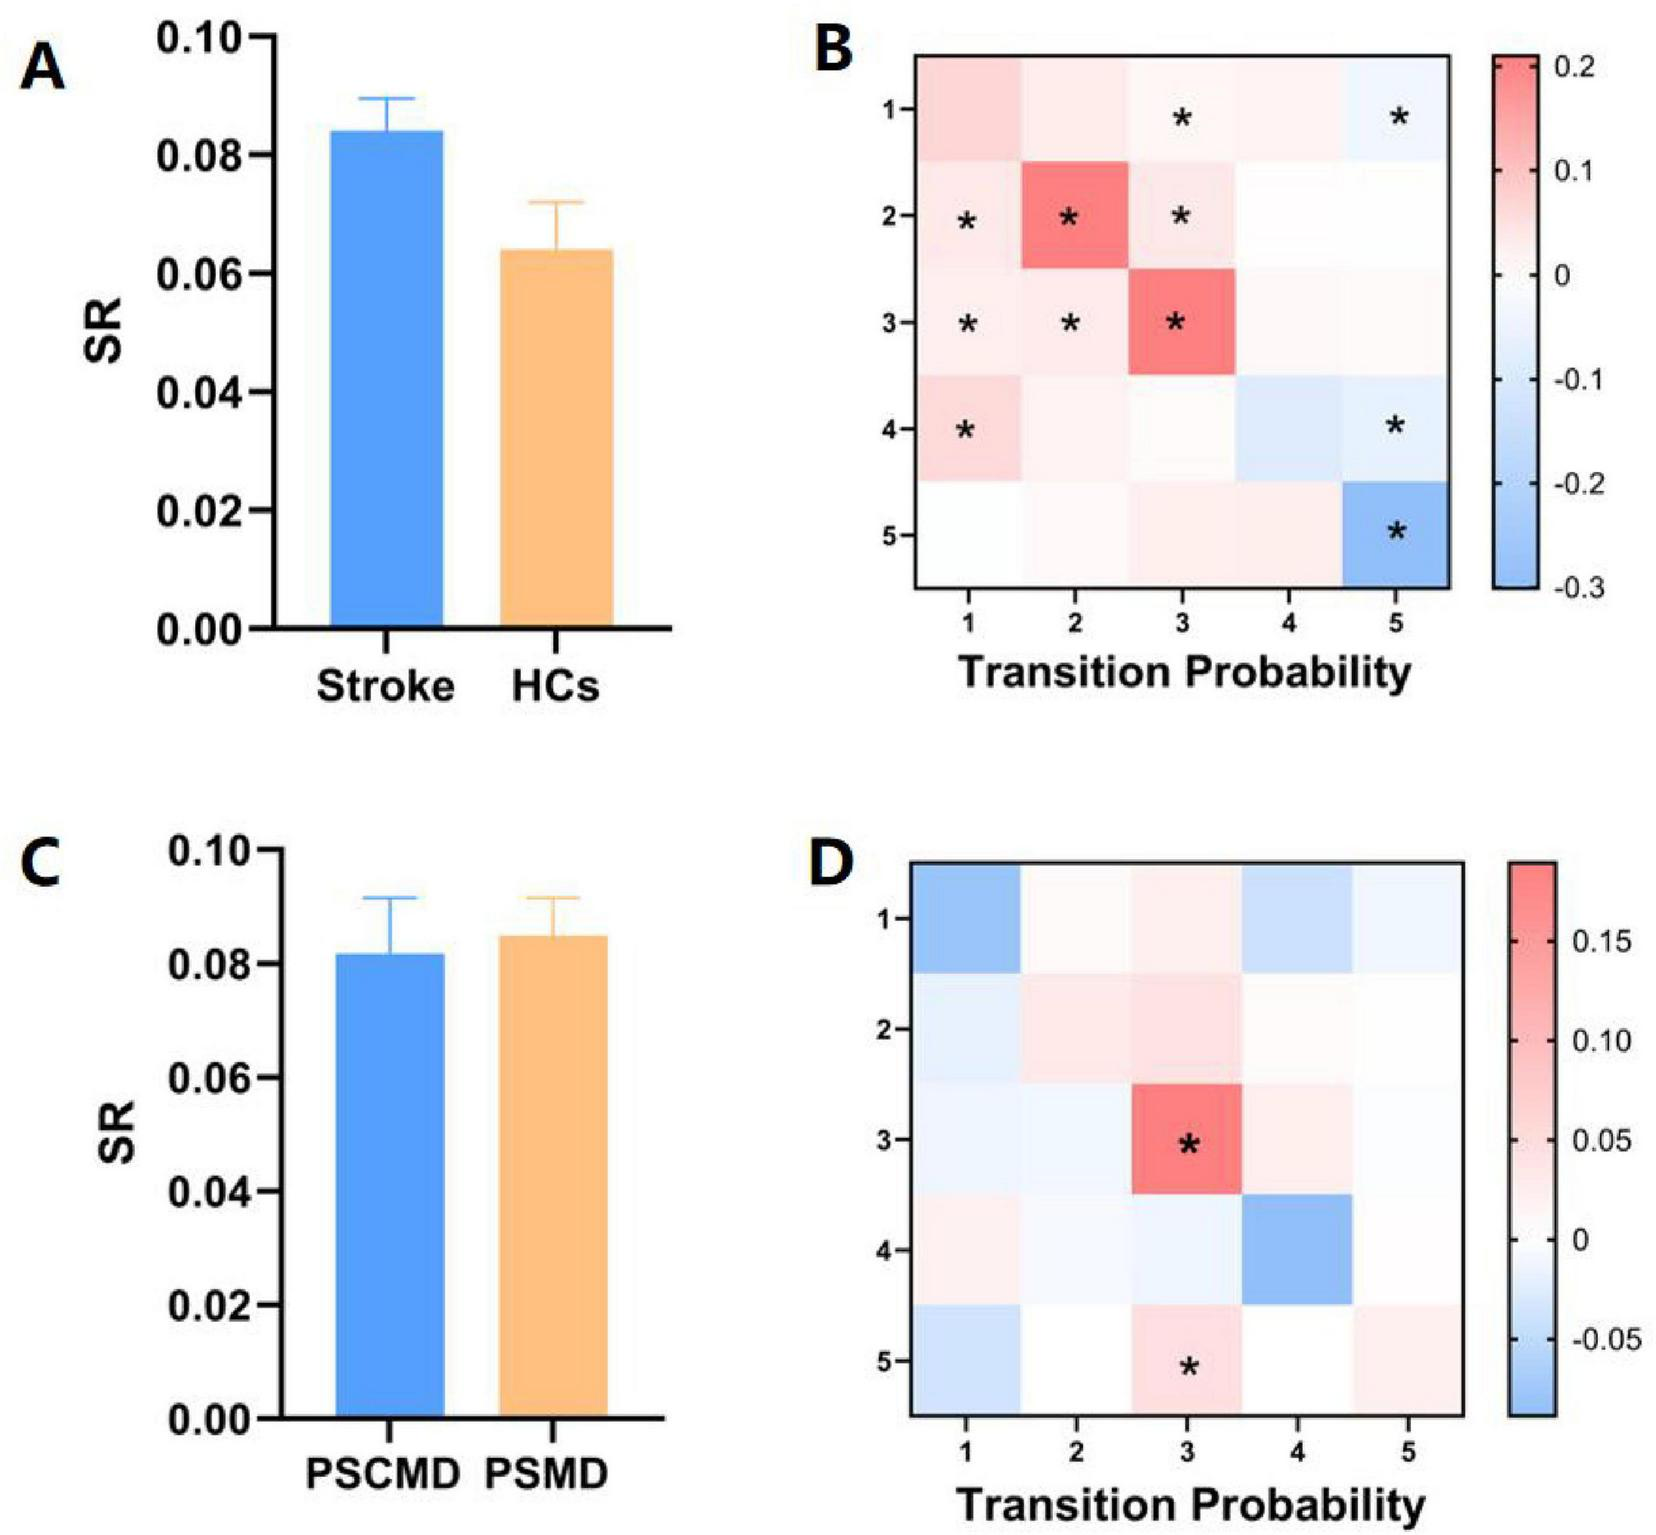
Variations in state transitions between stroke patients and healthy controls (HCs), as well as between post-stroke motor dysfunction (PSMD) and post-stroke cognitive and motor dysfunction (PSCMD) subgroups. (A) Differences in switch rate (SR) between stroke patients and HCs; (B) notable shifts in transition probability (TP) between the two groups. Red color indicates a marked increase in stroke patients relative to HCs, while blue color denotes a significant decline; (C) contrasts in SR between PSMD and PSCMD patients; (D) distinct changes in TP between PSMD and PSCMD patients. Red color indicates a marked increase in PSCMD patients versus PSMD patients, and blue color indicates a significant decrease in PSCMD patients versus PSMD patients. *p < 0.05.
In the stroke subgroup, no discernible variation was observed in SR among the HMM statuses (Figure 5C), while significant differences could be found in TP between the PSMD and PSCMD groups. Compared with PSMD, patients with PSCMD show significantly higher transition probabilities from state 3 and state 5 to state 3 (state 3 to 3: p = 0.013; state 5 to 3: p = 0.019) (Figure 5D).
3.5 Brain activation maps of states
The spatial activation patterns of large-scale whole-brain network states were investigated in this study. Compared to stroke patients, HCs were mainly characterized by state 5 (Figure 6A). State 5 showed that regions with enhanced activation were mainly located in the precentral gyrus, the postcentral gyrus, the supplementary motor area, the superior frontal gyrus, the middle frontal gyrus, the precuneus, the subparietal lobule, the subcortical regions (thalamus, caudate nucleus, and nucleus of the bean-shell), and the hippocampus. Conversely, areas with weakened brain activation were predominantly in the cuneate lobes.
FIGURE 6

Spatial activation patterns of hidden markov model (HMM)-derived brain states. (A) Average activation patterns of state 5 mainly triggered by healthy controls (HCs). (B) Average activation patterns of state 2 mainly triggered by post-stroke motor dysfunction (PSMD). (C) Average activation patterns of state 3 mainly triggered by post-stroke cognitive and motor dysfunction (PSCMD). (D) Fractional occupancy (FO) of HMM state 3 exhibited a negative connection with the Montreal Cognitive Assessment (MoCa) scores.
According to the results, stroke patients were predominantly in states 2 and 3 (Figures 6B, C). Specifically, the brain regions with enhanced activation in state 2 were mainly composed of the precentral gyrus, supplementary motor area, superior frontal gyrus, middle frontal gyrus, precuneus, subcortical regions, middle occipital gyrus and inferior occipital gyrus, and cuneus, while the activation levels were significantly lower than state 5. The regions with weakened activation in state 3 were mainly in the middle frontal gyrus, superior frontal gyrus, precentral gyrus, left supplementary motor area, subcortical regions, middle temporal gyrus, inferior temporal gyrus, angular gyrus, middle occipital gyrus and inferior occipital gyrus, and insula, whereas those with enhanced activation were predominantly in the right superior frontal gyrus, right middle frontal gyrus, right inferior parietal lobule, right angular gyrus, and right precuneus. Regarding the stroke subgroup analysis, PSMD patients were mainly dominated by state 2, while PSCMD patients were mainly dominated by state 3.
3.6 Correlation analysis
A negative correlation could be found between FO and severity of cognitive impairment in state 3 of PSCMD patients (r = −0.389, p = 0.025) (Figure 6D), while the temporal dynamic characteristics of other states exhibited no significant connections with motor or cognitive functions.
3.7 Validate analysis results
Sliding window analysis and K-mean clustering were used to obtain five states, and between-group differences in the temporal attributes of these states were calculated. We found that stroke patients had higher FO in state 3 (t = 2.933, P = 0.010, FDR-corrected), but shorter FO in state 5 (t = −4.732, P = 0.0001, FDR-corrected) compared with HCs. The comparison between stroke subgroups showed that the FO of PSCMI patients in state 3 was higher than that of PSMD patients (t = 2.436, P = 0.017, FDR-corrected). In addition, there was no difference in number of transitions between stroke and HCs group as well as the stroke subgroup in the analysis (P > 0.05). These are similar to the HMM results. However, we did not find a difference between stroke and HCs in state 2 in the validation analysis (Supplementary Figure 1).
4 Discussion
According to the evaluation of fMRI data by HMM, five states that were characterized by average functional activity and functional connectivity were identified. It was found that stroke patients exhibited abnormal connectivity and activation of multiple brain networks, which could suggest the widespread impairment of neural network integration after stroke. Besides, further subgroup analyses revealed that patients with PSCMD exhibited low activation of sensorimotor networks and higher-order cognitive networks, while the right prefrontal parietal network was highly activated. These findings suggested heterogeneity in the network dynamics of stroke patients with different functional disabilities, and HMM-derived brain states could be employed for the optimization of future neural regulation strategies.
According to recent research, fMRI can be utilized in the detection of the dynamic reconfiguration of extensive brain activity after stroke (Mao et al., 2025; Zhang et al., 2025; Wang X. et al., 2024). Notably, it was found that the LT and FO of the stroke group were significantly lower in state 5, which was characterized by strong intra- and inter-network connections, whereas the FO was significantly higher in state 3, which was characterized by weaker intra- and inter-network connection strengths. This could suggest that stroke patients were more prone to staying in a low integration state, which was consistent with prior studies based on the sliding window approach (Wang et al., 2020; Bonkhoff et al., 2020). Importantly, compared with PSMD, PSCMD exhibited higher FO in State 3, which was characterized by diminished functional connectivity between the DMN and the FPN. Functionally, the FPN was essential for cognitive control and task switching, coordinating the allocation of attentional resources, while the DMN exhibited a strong connection with the primary sensory processing and higher-order cognitive integration. Previous studies have demonstrated FPN in subcortical stroke patients, alongside the FC reduction in the network of the anterior DMN (Wang et al., 2014). Additionally, patients with PSCI showed weakened local functional connectivity in cognitive networks, including the DMN, and orbitofrontal cortex (Miao et al., 2021). Collectively, it could be suggested by these findings that the elevated FO in State 3 among PSCMD patients may involve impaired frontal-parietal integration and misallocation of attentional resources, reflecting diminished integration efficiency of higher-order cognitive networks. In addition, MMSE scores in stroke patients exhibited a significantly negative connection with FO in state 3, indicating that an increased proportion of time spent by patients in this particular state correlates with more pronounced impairments in cognitive function.
The brain is a complex and dynamic system (van der Horn et al., 2017; Ahrends et al., 2022), which can support cognitive and motor regulatory functions by switching between different brain states. By analyzing the switching rate of HMM states, we found that there was no significant difference in SR between stroke patients and HCs, but there was difference in TP between the two groups. The lack of significant difference in SR between the two groups suggests that the overall frequency of brain state transitions after stroke has a certain degree of stability, whereas the difference in TP reflects the reorganization of transfer paths between specific states in stroke patients. This may be related to the dynamic balance mechanism of the brain. Stroke patients may maintain overall stability through healthy-side compensation, but damaged networks exhibit altered state preferences. Notably, PSCMD patients were more prone to shifting to the weakly connected state 3 and staying in this state for a long time, which might be attributed to the weakened cognitive flexibility, and this should be further investigated in the future to explore its application value as a potential biomarker for PSCMD.
Based on the spatial activation map analysis of comprehensive cerebral network states, HCs were mainly characterized by state 5, showing synergistic positive activation of SMN, DMN, and FPN. It could be suggested that HCs exhibited efficient integration of multiple networks in the resting state. Conversely, a marked reduction in the activation of several brain networks was observed in stroke patients, which was consistent with prior research findings (Zhang, 2025; Chen et al., 2025; Ding et al., 2018). However, it was found that PSMD patients exhibited enhanced visual network (VN) activation versus HCs. It was indicated that abnormal functional connectivity of the VN and diminished cross-network connectivity might serve as the explanation for the pathomechanism of the defective motor-visual attentional integration after stroke, which was critical for the recovery of sensorimotor functions by driving neuroplasticity (Zappasodi et al., 2017; Zhao et al., 2018). Based on the above findings, it was inferred that VN hyperactivation in PSMD patients might reflect a compensatory reorganization pattern, which was based on the enhancement of visuomotor integration to partially compensate for impaired sensorimotor pathways (Zhao et al., 2018). Notably, PSCMD exhibited high activation of the right prefrontal-parietal networks, and this hyperactivation might be attributed to the network reorganization after brain microstructural damage. It has been indicated that the application of stimuli into the active large-scale targeted-network could enhance the cortical excitability, and it is more favorable for functional recovery (Sack et al., 2024). Therefore, the present findings not only have significant contributions to the identification of neuromarkers of PSCMD, but also have the potential to serve as “targets” for the neuromodulation of tDCS or TMS in PSCMD patients.
5 Limitations and future directions
However, several limitations still exist in this study. First, there is an imbalance in the sample size between stroke groups and HCs, which may exert a negative effect on the statistical validity of the group difference analysis. Therefore, the sample size needs to be enlarged in the future, in order to validate the broad applicability of dynamic features. Second, only the cross-sectional data were analyzed in the current study, which relatively limited the causal inference of the connections between the dynamic evolution of brain networks and clinical prognosis. Future studies should incorporate longitudinal data tracking neuroplasticity trajectories in stroke patients. Explore the integration of HMM or dFNC-derived dynamic metrics into clinical classifiers or prognostic models to assess their translational potential in identifying and stratifying PSCMD patients. Third, it’s challenging to figure out the best number of HMM states (Stevner et al., 2019; Hutchison et al., 2013; Hindriks et al., 2016). Although k = 5 is identified as the optimal solution for the current data, transient dynamic features specific to stroke may be overlooked. Overall, the increase in state numbers could improve the temporal resolution, while it was necessary to keep a balance between the model complexity and interpretability. Finally, differences in lesion locations, disease duration, and degree of impairment in stroke patients make our patient group highly heterogeneous, which may influence our interpretation. In the future, more detailed functional evaluations should be incorporated to refine each subgroups for further research.
6 Conclusion
Post-stroke patients exhibited abnormal activation patterns and broken functional connectivity across various brain networks, and specific changes were found among different subgroups. Notably, PSCMD patients demonstrated hypoactivation in extensive sensorimotor networks and higher-order cognitive networks, but they concurrently exhibited hyperactivation in the right prefrontal-parietal networks. Overall, these findings provide a basis for the development of brain-state-dependent stimulation strategies in neuromodulation interventions for stroke rehabilitation.
Statements
Data availability statement
The raw data supporting the conclusions of this article will be made available by the authors, without undue reservation.
Ethics statement
The studies involving humans were approved by the Institutional Review Boards of the 900th Hospital Ethics Committee (No. 2015011). The studies were conducted in accordance with the local legislation and institutional requirements. The participants provided their written informed consent to participate in this study. Written informed consent was obtained from the individual(s) for the publication of any potentially identifiable images or data included in this article.
Author contributions
XL: Conceptualization, Formal analysis, Methodology, Visualization, Writing – original draft. GS: Conceptualization, Data curation, Writing – original draft. XZ: Data curation, Investigation, Writing – review & editing. YZ: Investigation, Writing – review & editing. XW: Investigation, Writing – review & editing. YQ: Conceptualization, Funding acquisition, Writing – review & editing.
Funding
The author(s) declare that financial support was received for the research and/or publication of this article. This study was supported by the Natural Science Foundation of Fujian (References. 2024Y0048).
Acknowledgments
We thank all participants for their efforts in this study.
Conflict of interest
The authors declare that the research was conducted in the absence of any commercial or financial relationships that could be construed as a potential conflict of interest.
Generative AI statement
The author(s) declare that no Generative AI was used in the creation of this manuscript.
Any alternative text (alt text) provided alongside figures in this article has been generated by Frontiers with the support of artificial intelligence and reasonable efforts have been made to ensure accuracy, including review by the authors wherever possible. If you identify any issues, please contact us.
Publisher’s note
All claims expressed in this article are solely those of the authors and do not necessarily represent those of their affiliated organizations, or those of the publisher, the editors and the reviewers. Any product that may be evaluated in this article, or claim that may be made by its manufacturer, is not guaranteed or endorsed by the publisher.
Supplementary material
The Supplementary Material for this article can be found online at: https://www.frontiersin.org/articles/10.3389/fnagi.2025.1640378/full#supplementary-material
Footnotes
References
1
Ahrends C. Stevner A. Pervaiz U. Kringelbach M. L. Vuust P. Woolrich M. W. et al (2022). Data and model considerations for estimating time-varying functional connectivity in fMRI.Neuroimage252:119026. 10.1016/j.neuroimage.2022.119026
2
Bonkhoff A. K. Espinoza F. A. Gazula H. Vergara V. M. Hensel L. Michely J. et al (2020). Acute ischaemic stroke alters the brain’s preference for distinct dynamic connectivity states.Brain J. Neurol.1431525–1540. 10.1093/brain/awaa101
3
Cao X. Wang Z. Chen X. Liu Y. Abdoulaye I. A. Ju S. et al (2023). Changes in resting-state neural activity and nerve fibres in ischaemic stroke patients with hemiplegia.Brain Topogr.36255–268. 10.1007/s10548-022-00937-6
4
Chen L. Meng F. Huo C. Shao G. Pan G. Zhang X. et al (2025). Effects of tactile feedback in post-stroke hand rehabilitation on functional connectivity and cortical activation: An fNIRS study.Biomed. Opt. Express16643–656. 10.1364/BOE.541820
5
Chen P. Liu T.-W. Tse M. M. Y. Lai C. K. Y. Tsoh J. Ng S. S. M. (2022). The predictive role of hand section of fugl-meyer assessment and motor activity log in action research arm test in people with stroke.Front. Neurol.13:926130. 10.3389/fneur.2022.926130
6
Chen Q. Qing Z. Jin J. Sun Y. Chen W. Lu J. et al (2021). Ego- and allo-network disconnection underlying spatial disorientation in subjective cognitive decline.Cortex J. Devoted Study Nerv. Syst. Behav.13735–48. 10.1016/j.cortex.2020.12.022
7
Cohen J. R. (2018). The behavioral and cognitive relevance of time-varying, dynamic changes in functional connectivity.Neuroimage180515–525. 10.1016/j.neuroimage.2017.09.036
8
Cornblath E. J. Ashourvan A. Kim J. Z. Betzel R. Ciric R. Adebimpe A. et al (2020). Temporal sequences of brain activity at rest are constrained by white matter structure and modulated by cognitive demands.Commun. Biol.3:261. 10.1038/s42003-020-0961-x
9
Craig L. Hoo Z. L. Yan T. Z. Wardlaw J. Quinn T. J. (2022). Prevalence of dementia in ischaemic or mixed stroke populations: Systematic review and meta-analysis.J. Neurol. Neurosurg. Psychiatry93180–187. 10.1136/jnnp-2020-325796
10
Ding J.-R. Ding X. Hua B. Xiong X. Wen Y. Ding Z. et al (2018). Altered connectivity patterns among resting state networks in patients with ischemic white matter lesions.Brain Imaging Behav.121239–1250. 10.1007/s11682-017-9793-9
11
Einstad M. S. Saltvedt I. Lydersen S. Ursin M. H. Munthe-Kaas R. Ihle-Hansen H. et al (2021). Associations between post-stroke motor and cognitive function: A cross-sectional study.BMC Geriatr.21:103. 10.1186/s12877-021-02055-7
12
Folstein M. F. Folstein S. E. McHugh P. R. (1975). “mini-mental state”. A practical method for grading the cognitive state of patients for the clinician.J. Psychiatr. Res.12189–198. 10.1016/0022-3956(75)90026-6
13
Hilkens N. A. Casolla B. Leung T. W. Leeuw F.-E. (2024). Stroke.Lancet4032820–2836. 10.1016/S0140-6736(24)00642-1
14
Hindriks R. Adhikari M. H. Murayama Y. Ganzetti M. Mantini D. Logothetis N. K. et al (2016). Can sliding-window correlations reveal dynamic functional connectivity in resting-state fMRI?Neuroimage127242–256. 10.1016/j.neuroimage.2015.11.055
15
Hutchison R. M. Womelsdorf T. Allen E. A. Bandettini P. A. Calhoun V. D. Corbetta M. et al (2013). Dynamic functional connectivity: Promise, issues, and interpretations.Neuroimage80360–378. 10.1016/j.neuroimage.2013.05.079
16
Javaheripour N. Colic L. Opel N. Li M. Maleki Balajoo S. Chand T. et al (2023). Altered brain dynamic in major depressive disorder: State and trait features.Transl. Psychiatry13:261. 10.1038/s41398-023-02540-0
17
Kottaram A. Johnston L. A. Cocchi L. Ganella E. P. Everall I. Pantelis C. et al (2019). Brain network dynamics in schizophrenia: Reduced dynamism of the default mode network.Hum. Brain Mapp.402212–2228. 10.1002/hbm.24519
18
Larivière S. Ward N. S. Boudrias M.-H. (2018). Disrupted functional network integrity and flexibility after stroke: Relation to motor impairments.Neuroimage Clin.19883–891. 10.1016/j.nicl.2018.06.010
19
Lu L. Li F. Li H. Zhou L. Wu X. Yuan F. (2024). Aberrant dynamic properties of whole-brain functional connectivity in acute mild traumatic brain injury revealed by hidden markov models.CNS Neurosci. Ther.30:e14660. 10.1111/cns.14660
20
Mao Q. Wang H. Yao J. Chen H. Chen Y.-C. Yin X. et al (2025). Left basal ganglia stroke-induced more alterations of functional connectivity: Evidence from an fMRI study.Curr. Med. Imaging.10.2174/0115734056344477250222060225Online ahead of print.
21
Meer J. N. van der, Breakspear M. Chang L. J. Sonkusare S. Cocchi L. (2020). Movie viewing elicits rich and reliable brain state dynamics.Nat. Commun.11:5004. 10.1038/s41467-020-18717-w
22
Miao G. Rao B. Wang S. Fang P. Chen Z. Chen L. et al (2021). Decreased functional connectivities of low-degree level rich club organization and caudate in post-stroke cognitive impairment based on resting-state fMRI and radiomics features.Front. Neurosci.15:796530. 10.3389/fnins.2021.796530
23
Moretto M. Silvestri E. Zangrossi A. Corbetta M. Bertoldo A. (2022). Unveiling whole-brain dynamics in normal aging through hidden markov models.Hum. Brain Mapp.431129–1144. 10.1002/hbm.25714
24
Nasreddine Z. S. Phillips N. A. Bédirian V. Charbonneau S. Whitehead V. Collin I. et al (2005). The montreal cognitive assessment, MoCA: A brief screening tool for mild cognitive impairment.J. Am. Geriatr. Soc.53695–699. 10.1111/j.1532-5415.2005.53221.x
25
Ohura T. Hase K. Nakajima Y. Nakayama T. (2017). Validity and reliability of a performance evaluation tool based on the modified barthel index for stroke patients.BMC Med. Res. Methodol.17:131. 10.1186/s12874-017-0409-2
26
Pang X. Huang L. He H. Xie S. Huang J. Ge X. et al (2024). Reorganization of dynamic network in stroke patients and its potential for predicting motor recovery.Neural Plast.2024:9932927. 10.1155/np/9932927
27
Patel M. Coshall C. Rudd A. G. Wolfe C. D. A. (2003). Natural history of cognitive impairment after stroke and factors associated with its recovery.Clin. Rehabil.17158–166. 10.1191/0269215503cr596oa
28
Pendlebury S. Wadling S. Silver L. E. Mehta Z. Rothwell P. M. (2011). Transient cognitive impairment in TIA and minor stroke.Stroke423116–3121. 10.1161/STROKEAHA.111.621490
29
Qin L. Zhou Q. Sun Y. Pang X. Chen Z. Zheng J. (2024). Dynamic functional connectivity and gene expression correlates in temporal lobe epilepsy: Insights from hidden markov models.J. Transl. Med.22:763. 10.1186/s12967-024-05580-2
30
Sachdev P. S. Brodaty H. Valenzuela M. J. Lorentz L. Looi J. C. Wen W. et al (2004). The neuropsychological profile of vascular cognitive impairment in stroke and TIA patients.Neurology62912–919. 10.1212/01.wnl.0000115108.65264.4b
31
Sack A. T. Paneva J. Küthe T. Dijkstra E. Zwienenberg L. Arns M. et al (2024). Target engagement and brain state dependence of transcranial magnetic stimulation: Implications for clinical practice.Biol. Psychiatry95536–544. 10.1016/j.biopsych.2023.09.011
32
Stevner A. B. A. Vidaurre D. Cabral J. Rapuano K. Nielsen S. F. V. Tagliazucchi E. et al (2019). Discovery of key whole-brain transitions and dynamics during human wakefulness and non-REM sleep.Nat. Commun.10:1035. 10.1038/s41467-019-08934-3
33
Sun Y. Collinson S. Suckling J. Sim K. (2019). Dynamic reorganization of functional connectivity reveals abnormal temporal efficiency in schizophrenia.Schizophrenia Bull.45659–669. 10.1093/schbul/sby077
34
van der Horn H. J. Scheenen M. E. de Koning M. E. Liemburg E. J. Spikman J. M. van der Naalt J. (2017). The default mode network as a biomarker of persistent complaints after mild traumatic brain injury: A longitudinal functional magnetic resonance imaging study.J. Neurotrauma343262–3269. 10.1089/neu.2017.5185
35
Vicentini J. E. Weiler M. Casseb R. F. Almeida S. R. Valler L. de Campos B. M. et al (2021). Subacute functional connectivity correlates with cognitive recovery six months after stroke.Neuroimage, Clin.29:102538. 10.1016/j.nicl.2020.102538
36
Vidaurre D. Llera A. Smith S. M. Woolrich M. W. (2021). Behavioural relevance of spontaneous, transient brain network interactions in fMRI.Neuroimage229:117713. 10.1016/j.neuroimage.2020.117713
37
Vidaurre D. Smith S. M. Woolrich M. W. (2017). Brain network dynamics are hierarchically organized in time.Proc. Natl. Acad. Sci. U. S. A.11412827–12832. 10.1073/pnas.1705120114
38
Viviano R. P. Damoiseaux J. S. (2020). Functional neuroimaging in subjective cognitive decline: Current status and a research path forward.Alzheimer’s Res. Ther.12:23. 10.1186/s13195-020-00591-9
39
Wang C. Qin W. Zhang J. Tian T. Li Y. Meng L. et al (2014). Altered functional organization within and between resting-state networks in chronic subcortical infarction.J. Cereb. Blood Flow Metab.34597–605. 10.1038/jcbfm.2013.238
40
Wang X. Wang C. Liu J. Guo J. Miao P. Wei Y. et al (2024). Altered cerebellar-cerebral dynamic functional connectivity in patients with pontine stroke: A resting-state fMRI study.Brain Imaging Behav.181323–1332. 10.1007/s11682-024-00908-4
41
Wang Y. Chen H. Wang C. Liu J. Miao P. Wei Y. et al (2024). Static and dynamic interactions within the triple-network model in stroke patients with multidomain cognitive impairments.Neuroimage, Clin.43:103655. 10.1016/j.nicl.2024.103655
42
Wang Y. Li C. Ding M. Lin L. Li P. Wang Y. et al (2021). Carotid atherosclerotic calcification characteristics relate to post-stroke cognitive impairment.Front. Aging Neurosci.13:682908. 10.3389/fnagi.2021.682908
43
Wang Y. Wang C. Miao P. Liu J. Wei Y. Wu L. et al (2020). An imbalance between functional segregation and integration in patients with pontine stroke: A dynamic functional network connectivity study.Neuroimage Clin.28:102507. 10.1016/j.nicl.2020.102507
44
Xu Y. Shang H. Lu H. Zhang J. Yao L. Long Z. et al (2021). Altered dynamic functional connectivity in subcortical ischemic vascular disease with cognitive impairment.Front. Aging Neurosci.13:758137. 10.3389/fnagi.2021.758137
45
Yue X. Li Z. Li Y. Gao J. Han H. Zhang G. et al (2023). Altered static and dynamic functional network connectivity in post-stroke cognitive impairment.Neurosci. Lett.799:137097. 10.1016/j.neulet.2023.137097
46
Zappasodi F. Croce P. Giordani A. Assenza G. Giannantoni N. M. Profice P. et al (2017). Prognostic value of EEG microstates in acute stroke.Brain Topogr.30698–710. 10.1007/s10548-017-0572-0
47
Zhang J. Tang H. Zuo L. Liu H. Li Z. Jing J. et al (2025). Altered effective connectivity within brain lesioned regions and cognitive impairment after stroke.Cogn. Neurodyn.19:36. 10.1007/s11571-024-10209-7
48
Zhang X. Yang L. Lu J. Yuan Y. Li D. Zhang H. et al (2024). Reconfiguration of brain network dynamics in bipolar disorder: A hidden markov model approach.Transl. Psychiatry14:507. 10.1038/s41398-024-03212-3
49
Zhang Z. (2025). Network abnormalities in ischemic stroke: A meta-analysis of resting-state functional connectivity.Brain Topogr.38:19. 10.1007/s10548-024-01096-6
50
Zhao Z. Wu J. Fan M. Yin D. Tang C. Gong J. et al (2018). Altered intra- and inter-network functional coupling of resting-state networks associated with motor dysfunction in stroke.Hum. Brain Mapp.393388–3397. 10.1002/hbm.24183
Summary
Keywords
stroke, motor dysfunction, cognitive and motor dysfunction, hidden markov model, dynamic functional connectivity
Citation
Liu X, Song G, Zhuang X, Zhang Y, Wang X and Qin Y (2025) Altered brain dynamics in post-stroke cognitive and motor dysfunction. Front. Aging Neurosci. 17:1640378. doi: 10.3389/fnagi.2025.1640378
Received
03 June 2025
Accepted
07 August 2025
Published
26 August 2025
Volume
17 - 2025
Edited by
Hang Qu, Affiliated Hospital of Yangzhou University, China
Reviewed by
Yong Xu, First Hospital of Shanxi Medical University, China
Lin Jiang, Affiliated Hospital of Zunyi Medical University, China
Updates
Copyright
© 2025 Liu, Song, Zhuang, Zhang, Wang and Qin.
This is an open-access article distributed under the terms of the Creative Commons Attribution License (CC BY). The use, distribution or reproduction in other forums is permitted, provided the original author(s) and the copyright owner(s) are credited and that the original publication in this journal is cited, in accordance with accepted academic practice. No use, distribution or reproduction is permitted which does not comply with these terms.
*Correspondence: Yin Qin, baby792305220@163.com
†These authors have contributed equally to this work
Disclaimer
All claims expressed in this article are solely those of the authors and do not necessarily represent those of their affiliated organizations, or those of the publisher, the editors and the reviewers. Any product that may be evaluated in this article or claim that may be made by its manufacturer is not guaranteed or endorsed by the publisher.