 Mohammed Seid Hussen1
 Bess Yin-Hung Lam2
 Wei Gao3,4
 Liping Zhou1,3,5
 Kai Yip Choi1,5*Henry Ho-lung Chan1,3,5,6*
- 1Laboratory of Experimental Optometry (Neuroscience), School of Optometry, The Hong Kong Polytechnic University, Kowloon, Hong Kong SAR, China
- 2Department of Counselling and Psychology, Hong Kong Shue Yan University, Hong Kong Island, Hong Kong SAR, China
- 3Center for Eye and Vision Research (CEVR), New Territories, Hong Kong SAR, China
- 4School of Computer Science, University of Technology, Ningbo, China
- 5Research Centre for SHARP Vision (RCSV), The Hong Kong Polytechnic University, Kowloon, Hong Kong SAR, China
- 6Colour Imaging and Metaverse Research Centre, The Hong Kong Polytechnic University, Kowloon, Hong Kong SAR, China
Background: The prevalence of cognitive impairment is increasing along with global aging. Early retinal structural and vascular changes, prior to the onset of clinically detectable retinal pathologies, have been increasingly associated with cognitive changes. However, the evidence related to the predictive performance of these biomarkers remains limited. Therefore, this study aimed to develop and validate a nomogram-based scoring tool for opportunistic screening of mild cognitive impairment (MCI).
Methods: This study prospectively recruited participants aged 60 years or older, including those with normal cognitive function. The retinal images were scanned using optical coherence tomography and angiography. Following the selection of potential predictors, a logistic regression model was built to predict MCI. Subsequently, a dynamic nomogram was developed to facilitate risk scoring in a clinical setting. The model’s discriminative ability was evaluated using the area under the receiver operating characteristic curve, along with diagnostic metrics of sensitivity and specificity at 95% confidence interval (CI). The model was internally validated using bootstrapping. Decision curve analysis was conducted to evaluate the model’s clinical impact and utility.
Results: The model indicated that central macular thickness (β: −1.13; 95% CI: −0.15,-2.15; p < 0.05), outer nasal perfusion density in the macular area (β: 1.68; 95% CI: −2.92, −0.44; p = 0.008), and contrast sensitivity (β: −1.13; 95% CI: −2.03, −0.23; p < 0.05) were independently associated with MCI. This nomogram demonstrated a discriminative power of 0.90 (95% CI: 0.81, 0.98). The model also demonstrated good performance during bootstrap validation, achieving an AUC of 0.87. The optimal cutoff points achieved an accuracy of 86%, a sensitivity of 85% and a specificity of 87%. The decision curve analysis showed that the model provides a high net benefit.
Conclusion: This study developed and internally validated a dynamic, nomogram-based scoring tool for early detection of MCI that integrates non-invasive retinal and visual biomarkers. The model demonstrated high discriminative power and substantial clinical net benefit. Further evaluation of the model’s prognostic value in predicting further cognitive decline may support its clinical utility.
1 Introduction
Mild cognitive impairment (MCI) is a transitional cognitive impairment with daily functioning largely preserved (Rodrigues and Moreno, 2023). Globally, the prevalence of MCI is estimated at 15–23% among older adults (Bai et al., 2022; Chen et al., 2023; Song et al., 2023; Salari et al., 2025). The underlying pathological changes may commence approximately a decade before the onset of mild cognitive changes, reflecting an asynchrony between structural and functional alterations that likely relate to neural compensatory mechanisms masking early deficits (Beason-Held et al., 2013; Reuter-Lorenz and Park, 2014). MCI is a pressing public health issue, characterized by a heterogeneous trajectory that may either progress to dementia with annual conversion rate of 7–16% (Tifratene et al., 2015; Roberts et al., 2014) or undergo reversion to normal cognitive function (Yu et al., 2025), which is orchestrated by a wide range of demographic, health-related, and biological factors. Higher risk of dementia is associated with higher age, cardiometabolic diseases, haemorrhagic stroke, depression, physical inactivity (Baik et al., 2025), higher body mass index (McGirr et al., 2022; Rosenberg et al., 2019), higher beta amyloid burden (Ottoy et al., 2019), and presence of tau (Smith et al., 2023; Bucci et al., 2021; Mendes et al., 2024). Vision impairment has also been recognized as a potential predictor that increases the risk of dementia in older adults, through limiting physical activity and social engagement (Shang et al., 2021; Lee et al., 2021). Age-related macular degeneration (AMD), glaucoma, and diabetic retinopathy have shown a significant association with an increased risk of all-cause dementia (Feng et al., 2023; Son et al., 2025; Shang et al., 2023). Predicting dementia based on these pathological changes may lack sensitivity for early prediction of cognitive decline, as it relies on pathological alterations rather than on preceding functional and structural disruption. Thus, objective biomarkers based on early structural and functional changes prior to the onset of pathological changes are the best strategy for early intervention. Given that the retina originates from the central nervous system and shares many structural and vascular traits (Lamb et al., 2007), several studies have investigated early retinal structural and vascular changes prior to the onset of clinically detectable retinal pathologies in AD and MCI. The studies reported reduction of retinal thickness (Sánchez et al., 2020; Cunha et al., 2017; Mei et al., 2021; Kim and Kang, 2019), retinal nerve fiber layer thickness (Szegedi et al., 2020; Yan et al., 2021), vessel density (Yoon et al., 2019; Wang et al., 2020; Ma et al., 2023), and perfusion density (Robbins et al., 2022; Ma et al., 2023). These retinal changes have been shown to correlate moderately with structural and functional brain changes (Hao et al., 2023; Wong et al., 2021). This indicated that retinal structural, vascular, and electrophysiological features are useful biomarkers that may signal the central neurovascular changes underlying early cognitive decline (Ge et al., 2021). Similarly, significant alterations in visual function have also been observed, including color vision deficiency (Cabrera DeBuc et al., 2018; Elvira-Hurtado et al., 2023; Salobrar-García et al., 2019; Vidal et al., 2022) and reduced contrast sensitivity (Risacher et al., 2013; Risacher et al., 2020). These early visual and retinal neurovascular changes might serve as cost-effective, non-invasive biomarkers for early detection of cognitive decline. However, the evidence related to the predictive performance of these biomarkers remains limited. Given that over one-third of ophthalmic patients are older adults aged 65 years or older (Guest et al., 1993), an integrated opportunistic screening program could be a potential strategy for this high-risk demographic. Thus, developing user-friendly risk assessment tools for this targeted population may facilitate early screening and bridge the gap between research findings and their practical application. Thus, transforming statistical models into nomograms provides an intuitive graphical scoring system that enhances the interpretability and applicability of the model by visually representing individual risk contributions (Jalali et al., 2019). Therefore, this study aimed to develop and validate a simplified clinical risk scoring tool for opportunistic screening of MCI.
2 Materials and methods
2.1 Study subjects
The Institutional Review Board of The Hong Kong Polytechnic University ethically approved this study. The study subjects underwent a comprehensive eye examination by licensed optometrists, in accordance with the principles outlined in the Declaration of Helsinki. Written informed consent was obtained from all subjects before the procedures. The inclusion criteria involved older adults aged 60 years or older, with best-corrected visual acuity equal to or better than 0.2 LogMAR, intraocular pressure of ≤21 mmHg, and refractive error of ≤±5.00 D. Subjects with a history of eye injury, dense cataract, glaucoma, AMD, diabetic retinopathy, or hypertensive retinopathy were excluded. Sample size adequacy was assessed using the clinical prediction model rule (Peduzzi et al., 1996). This study collected multiple retinal and visual features that could correlate with cognitive decline. However, most retinal features are highly correlated and lack unique predictive power for cognitive impairment. Hence, we considered retaining 4 to 5 predictors in the final model based on the following rationale: According to the clinical prediction model development rule (Stiell and Wells, 1999), a minimum of 5 and a maximum of 10 events are required for each predictor variable (Vittinghoff and McCulloch, 2007). Accordingly, a minimum of 15 and a maximum of 25 participants with MCI, as well as a comparable number of participants with NC, were required to fit the model. In this regard, our sample was adequate for developing the prediction model. Similarly, power analysis following the model fitting showed that nearly 51 samples were required to detect the desired effect size (section 3.5).
2.2 Cognitive assessments
The cognitive assessment process involved thorough history-taking and cognitive assessment (Petersen, 2016; McCarten, 2013). The participants were probed for evidence of cognitive concerns. A cognitive assessment was performed using the Cantonese version of the Mini-Mental State Examination (MMSE) (Chiu et al., 1994), administered by trained research personnel. MMSE assesses working memory, short-term memory, attention, concentration, language, visuospatial abilities, and orientation. The MMSE score ranges from 0 to 30. Following cognitive assessment, the study subjects were categorized as having MCI or being cognitively normal (NC) based on an MMSE score < 26 (Salis et al., 2023) and reported cognitive concerns. Participants with MCI and those with NC independently conduct daily activities.
2.3 Eye health examinations
Comprehensive eye examinations, including thorough history, visual function assessment, and retinal imaging, were conducted by an optometrist, who was an independent assessor blinded to the subjects’ cognitive status and research hypothesis.
2.3.1 Visual function assessment
2.3.1.1 Chromatic sensitivity
Chromatic sensitivity was evaluated using the tablet-based Rabin Cone Contrast Test (RCCT) (Innova Medical, Inc., United States) (White et al., 2023). The test consisted of a randomized series of letters selected from the British Standards Institution’s letter set, including letters with similar legibility (H, N, V, R, U, E, D, F, P, Z). The letters assigned for L- and M-cone subtend 1.22 LogMAR, whereas those used for S-cone contrast have a size of 1.34 LogMAR. The letters are displayed on a gray background with a luminance of 21.5 cd/m2, with decreasing steps of 0.16 log units toward the cone-contrast threshold (L- and M-cone: 27.5–1%; S-cone: 173–7%), robustly indicating the red, green, and blue sensitivities, respectively. During the test, a single letter appears at the center of the screen at a fixed visual angle and viewing distance of 75 cm (Cabrera DeBuc et al., 2018). The subject must select the letter seen from an adjacent 10-letter matching display.
2.3.1.2 Contrast sensitivity
Contrast sensitivity was measured using the Mars contrast sensitivity test (Mars Perceptrix, Chappaqua, NY, United States) (Dougherty et al., 2005). This chart has eight rows of six letters, comprising 48 letters, designed to subtend a visual acuity of 1.38 LogMAR. The letters’ contrast ranges from 91% (−0.04 log units) to 1.2% (−1.92 log units), arranged in steps of 0.04 log units. During assessment, uniform illumination of 85 cd/m2 was adjusted, along with a proper testing distance of 50 cm, using near correction glass.
2.4 Retinal image acquisitions and extraction
2.4.1 Optical coherence tomography
Macular retinal thickness (MRT) and peripapillary retinal nerve fiber layer (pRNFL) thickness were scanned using Heidelberg Spectralis HRA-OCT (Heidelberg Engineering, Heidelberg, Germany). MRT was obtained with a macula-centered acquisition based on the Early Treatment Diabetic Retinopathy Study (ETDRS) strategy, encompassing a total of 300 (8.7 mm) with nine subfields: central 1 mm2, inner 3 mm2, (including inner superior, inner inferior, inner temporal, inner nasal, and outer) 6 mm2, (including outer superior, outer inferior, outer temporal and outer nasal). The pRNFL thickness was captured with an optic disk-centered scan covering 15° across seven subregions of interest: temporal superior, nasal superior, temporal inferior, nasal inferior, nasal, temporal, and global.
2.4.2 Optical coherence tomography angiography
Optical coherence tomography angiography (OCTA) was performed using the spectral-domain Cirrus 6,000 (Carl Zeiss Meditec AG, Jena, Germany). The macular vessel density (MVD) and macular perfusion density (MPD) were scanned with a 6 × 6 mm2 scanning field. Images with a quality score of less than 7 and severely affected by motion artifacts were rescanned. The OCTA built-in algorithm segments the superficial vascular layer (SVL) from the inner boundary at the internal limiting membrane to the outer boundary of the inner plexiform layer. The MPD and MVD, along with the foveal avascular zone (FAZ) area, circularity (FC), and perimeter (FP), were extracted using the built-in algorithm (Figures 1A–F) (Samara et al., 2017; Laotaweerungsawat et al., 2020).
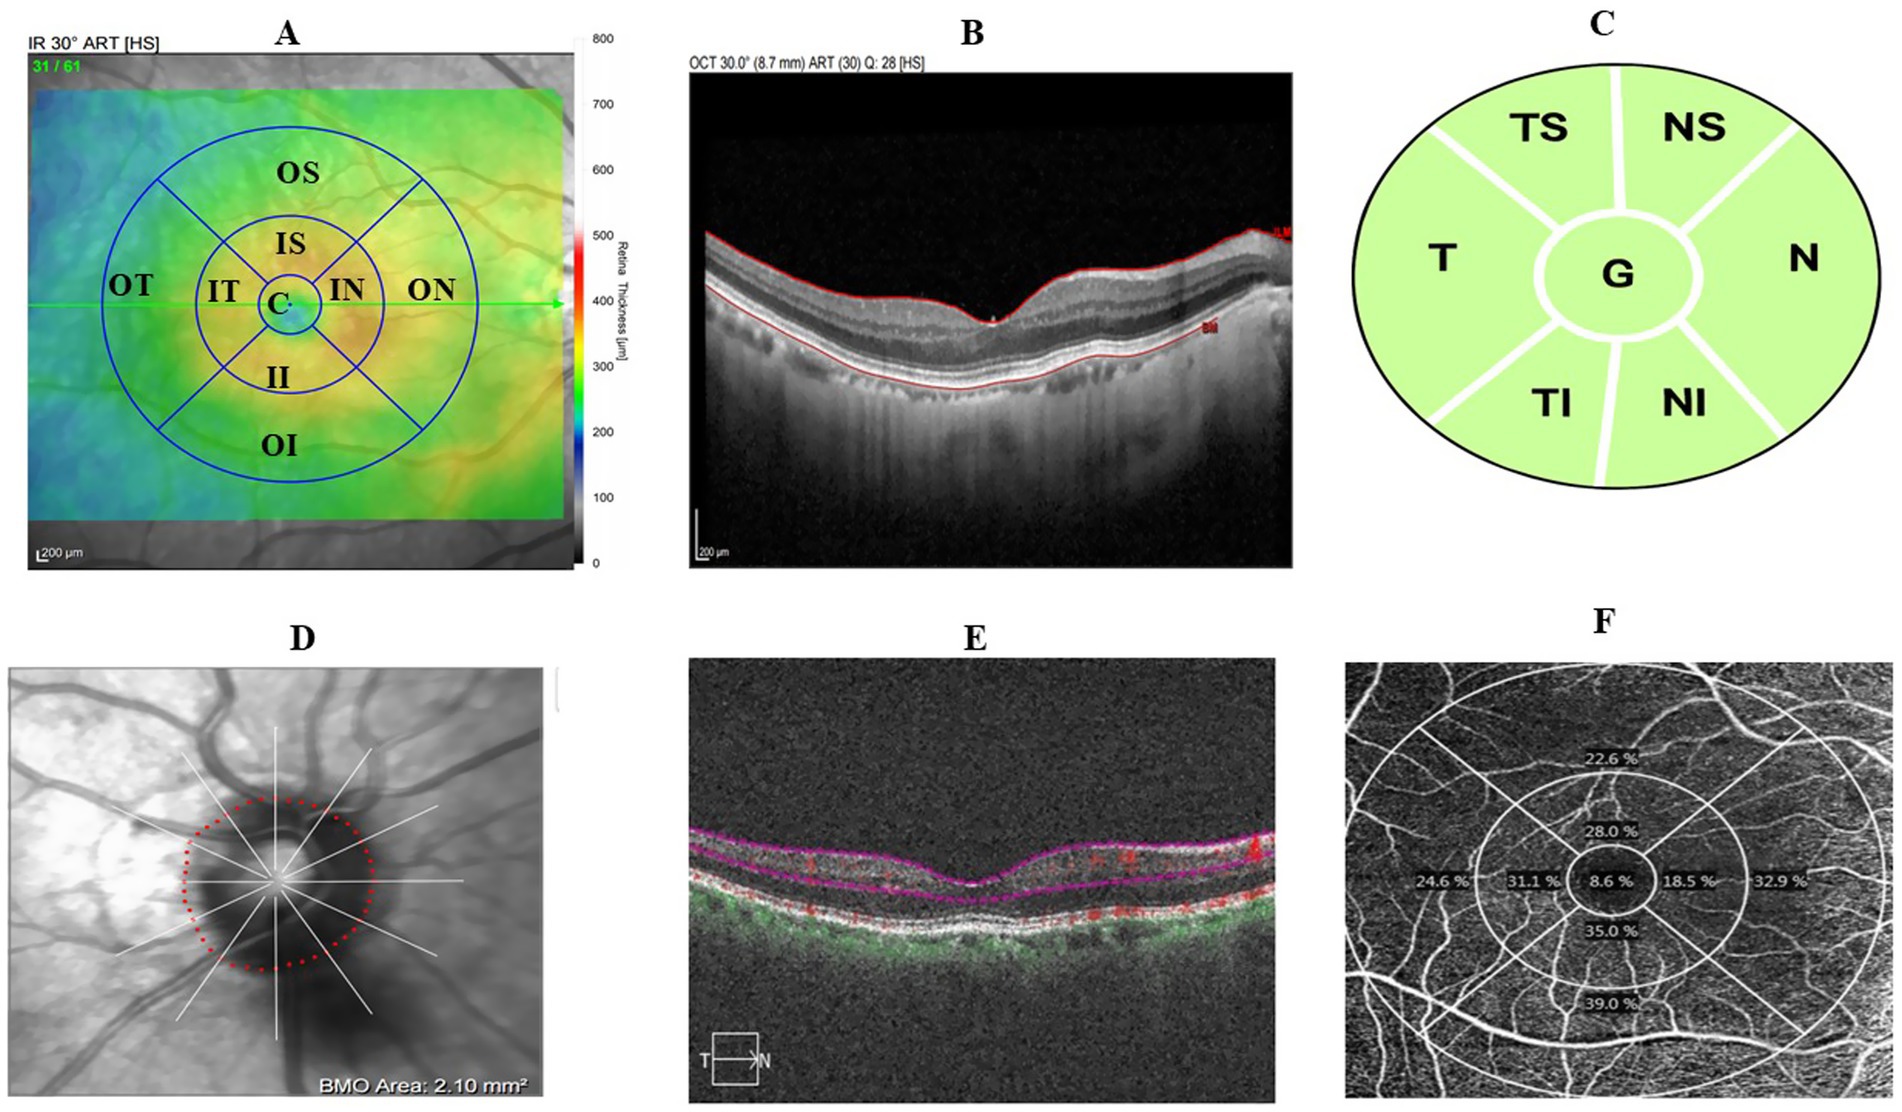
Figure 1. Retinal image scanning region based on the ETDRS grid. (A) Macular-centered scan showing 9 ETDRS grid. (B) Sample macular thickness segmentation. (C) Macular superficial vascular layer segmentation. (D) Sample macular superficial vascular layer map illustrating perfusion and vessel density. (E) Optic disc-centered scan of pRNFL thickness in 7 subregions of interest. (F) Sample optic disc-centered scan.
2.5 Data processing and analysis
2.5.1 Predictor selection and model development
The collected data were checked for missing values and consistency. Retinal images taken from both were processed. Only two subjects had retinal imaging from only one eye due to poor image quality in the contralateral eye. The data collected were processed and analyzed. This, missing data was not observed at the subject-level. Following data processing, summary statistics were performed to characterize the visual, retinal, and cognitive profiles of the participants. Retinal and visual features were compared between participants with MCI and those with NC using an independent t-test and its nonparametric version, the Mann–Whitney test (z-test). A two-sided p < 0.05 was considered statistically significant. Predictors were screened using a generalized linear model (GLM) after adjusting for age. Multicollinearity was checked with a variable inflation factor (VIF). Potential predictors with less than 10 VIF were selected by the Least Absolute Shrinkage and Selection Operator (LASSO) regression model by using the “glmnet” R packages version 4.1–91 and “MASS” R packages version 7.3–61,2 which penalizes less relevant features to zero coefficients and prevents overfitting (Ranstam and Cook, 2018).
Although there is no consensus on the ideal method for developing a model, simple models with fewer variables are usually preferred over complex models, as they are easier to interpret and apply in practice, despite excluding clinically important variables (Royston et al., 2009). Stepwise selection methods with a specific stopping rule or selection criteria are widely used, particularly in medical applications, to balance simplicity, retention of clinically relevant variables, and the risk of overfitting Since the stopping rule with a p-value of 0.05 is a stringent significance level that could potentially exclude clinically relevant factors, p-values with a cutoff of 0.1–0.2 are frequently recommended (Chowdhury and Turin, 2020). In this regard, the candidate predictors selected by LASSO were fitted into a binary logistic model using a backward stepwise method with a stopping rule of 0.1 to get the final model. Despite considering the assumption, we did not find any predictors retained in the final model with p-values between 0.05 and 0.1. Following fitting the final model, the Hosmer–Lemeshow goodness-of-fit test was performed at a p-value of 0.05. The model development process followed the guidelines for Transparent Reporting of Individual Prognosis or Diagnosis (Collins et al., 2015).
2.5.2 Theoretical design
The theoretical design of the model was developed based on a literature review that has reported associations between retinal and visual changes and cognitive impairment.
Probability of MCI = f(predictor variables).
Pr (Y = 1) = f(x), where Y = 1, denotes presence of MCI (event), and Y = 0, indicate state of NC (no event).
Pr (Y = 1) = f(β0 + β1 age + β2 color vision+ β3 contrast sensitivity + β4 retinal thickness + β5 retinal vascular features).
β0 is the intercept term, representing the baseline log-odds of MCI when all predictor variables are zero. β1 through β5 are the coefficients corresponding to each predictor variable, quantifying the change in the log-odds of MCI associated with a one-unit change in the respective predictor.
2.5.3 Nomogram construction
Based on the final model, an intuitive scoring tool, a nomogram, was developed. The scores of predictors in the nomogram were determined using the ratio method (Chen et al., 2022). The score of a predictor, denoted as i, is computed as:
2.5.4 Model performance evaluation and validation
The model’s diagnostic performance was evaluated using the area under the curve (AUC) computed from the receiver operating characteristic (ROC) curve, along with accuracy, sensitivity, specificity, positive predictive value (PPV), and negative predictive value (NPV). Model calibration was assessed by plotting deciles of predicted probability against the observed probability. The overall model performance was evaluated by the Brier score and Nagelkerke R-Square (R2), an adjusted version of the Cox and Snell R-Square (Nelson et al., 2016; Shabir et al., 2018). The Nagelkerke R-square ranges from 0 to 1, with higher values indicating better performance. The Brier score measures the accuracy of probabilistic predictions, ranging from 0 (perfect predictions) to 1 (worst possible predictions). The model was internally validated using bootstrapping to ensure its performance in future applications (Collins et al., 2015). Model validation by bootstrapping was performed by randomly generating bootstrap samples (B = 1,000) with replacement to evaluate the model’s optimism and optimism-corrected predictive performance. The optimism-corrected predictive performance of the model refers to the performance expected on unseen data. The “validate” and “val.pro” functions from the “rms” R package version 8.0–03 were used to compare multiple model performance indices. The optimal risk score cutoff points were determined based on the Youden index method [(sensitivity + specificity) − 100%] that achieved the highest possible sensitivity and specificity across different cutoff points to evaluate the accuracy in the stratification of the study subjects into clinically distinct low- and high-risk categories.
2.5.5 Decision curve analysis
Decision curve analysis (DCA) was used to evaluate the clinical impact of the model, a practical method that enhances clinicians’ decision-making (Vickers, 2008). Clinical decisions are usually navigated between two extreme situations: “treat all” and “treat none.” The specific intervention or treatment modality depends on the clinical context or problem under investigation. This study considered that retinal and visual features are risk indicators that facilitate further planning for patients attending an ophthalmic setting. The DCA compared the performance of retinal and visual features against two scenarios: “using cognitive tests for all” and “not using cognitive tests,” thereby capturing the consequences of decision-making based on a model that could yield false-negative or false-positive results. All statistical analyses, nomogram construction, and validation were performed using Stata/MP 17.0 (StataCorp LLC, 4095 Lakeway Drive, College Station, United States) and R 4.4.2 software4.
3 Results
3.1 Clinical characteristics of the study subjects
A total of 56 subjects participated: 30 with NC (mean age, 70.8 ± 7.7 years) and 26 with MCI (mean age, 77.9 ± 8.8 years). The mean cognitive score of subjects with MCI, as measured by the MMSE, was 20.34 ± 3.6, which was significantly lower than that of the NC subjects (28.08 ± 1.34, p < 0.0001). A significant proportion of the study subjects (75%) were females. Nearly half of the study subjects (51%) had chronic health conditions such as diabetes mellitus and hypertension. The L-, M-, and S-cone contrast thresholds were significantly reduced in subjects with MCI (p < 0.05). Significantly reduced contrast sensitivity was also observed in subjects with MCI (p = 0.0037). A significant sex-specific difference in cognitive score, contrast sensitivity, and chromatic contrast was not observed (p > 0.05) (Table 1).
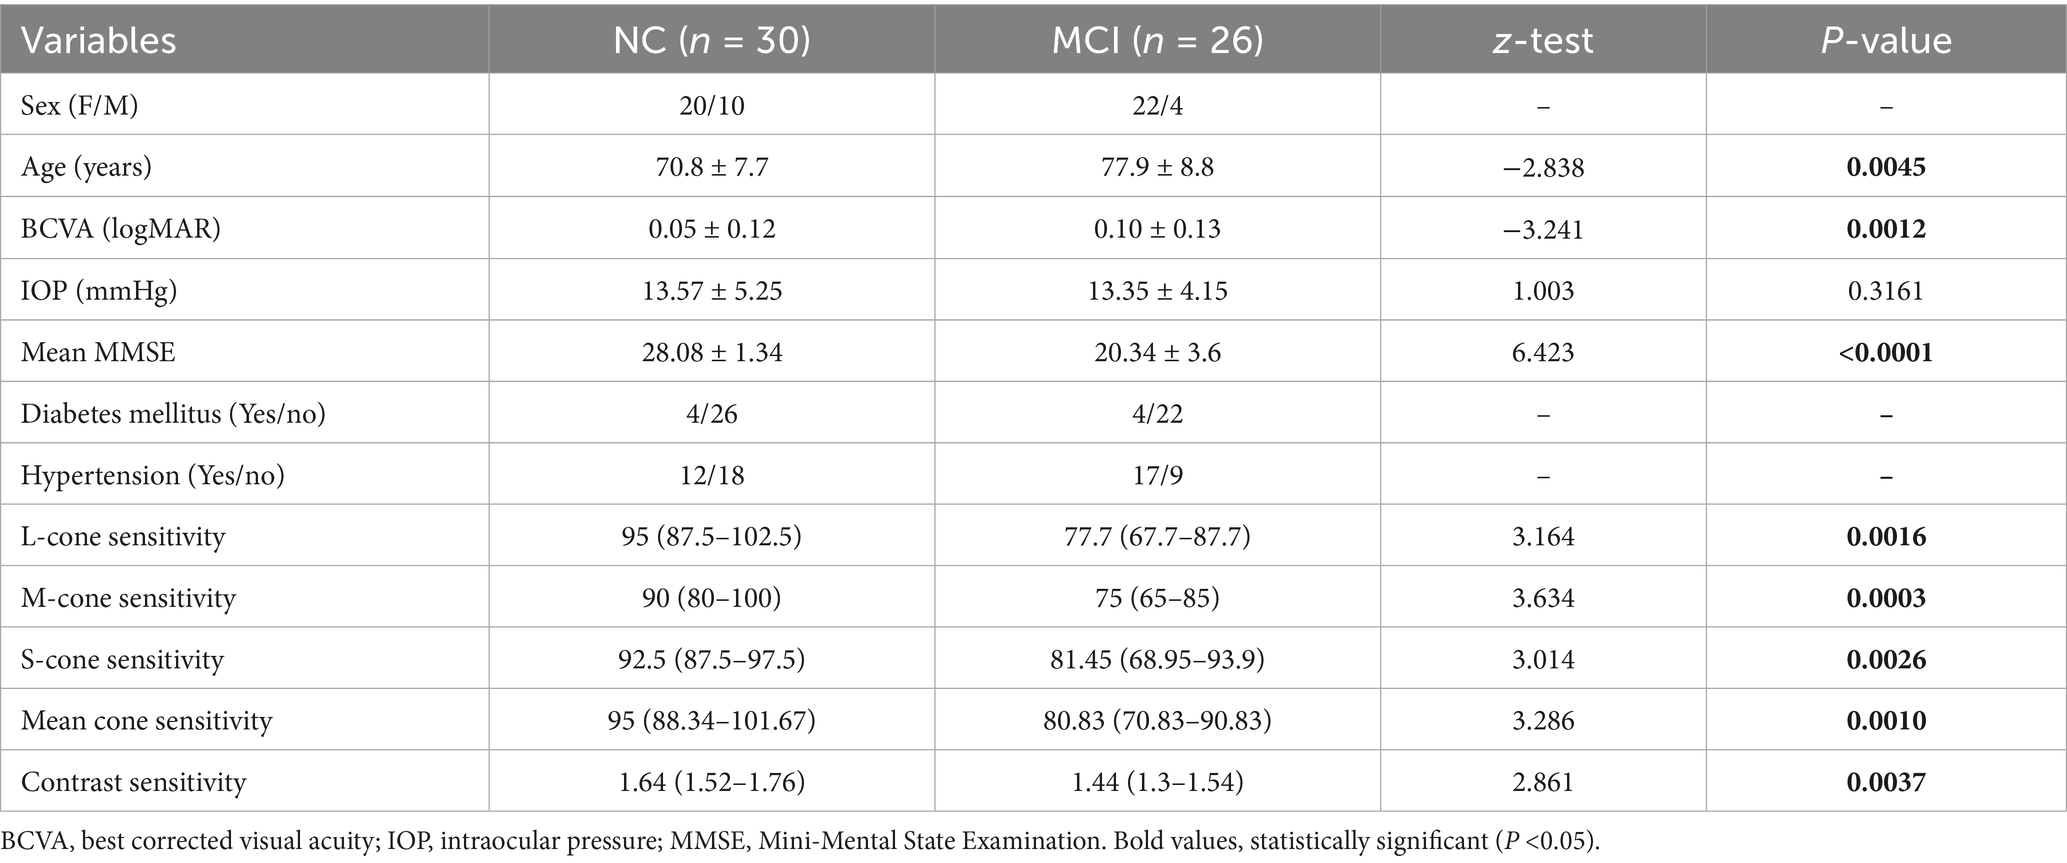
Table 1. Clinical characteristics of the study subjects.
3.2 Comparison of retinal thickness-related features
Compared with NC subjects, MCI subjects showed a statistically significant reduction in MRT across all ETDRS retinal subfields, except the inner superior subfield. In contrast, for pRNFL, the temporal thickness was the only subfield that exhibited a significant decrease in subjects with MCI compared to the NC subjects (NC: 83.13 ± 12.69; MCI: 77.28 ± 12.77, t = 1.71, p = 0.046) (Table 2). Significant central retinal thickness within 3 mm diameter was noted in females compared to male participants (p < 0.05).
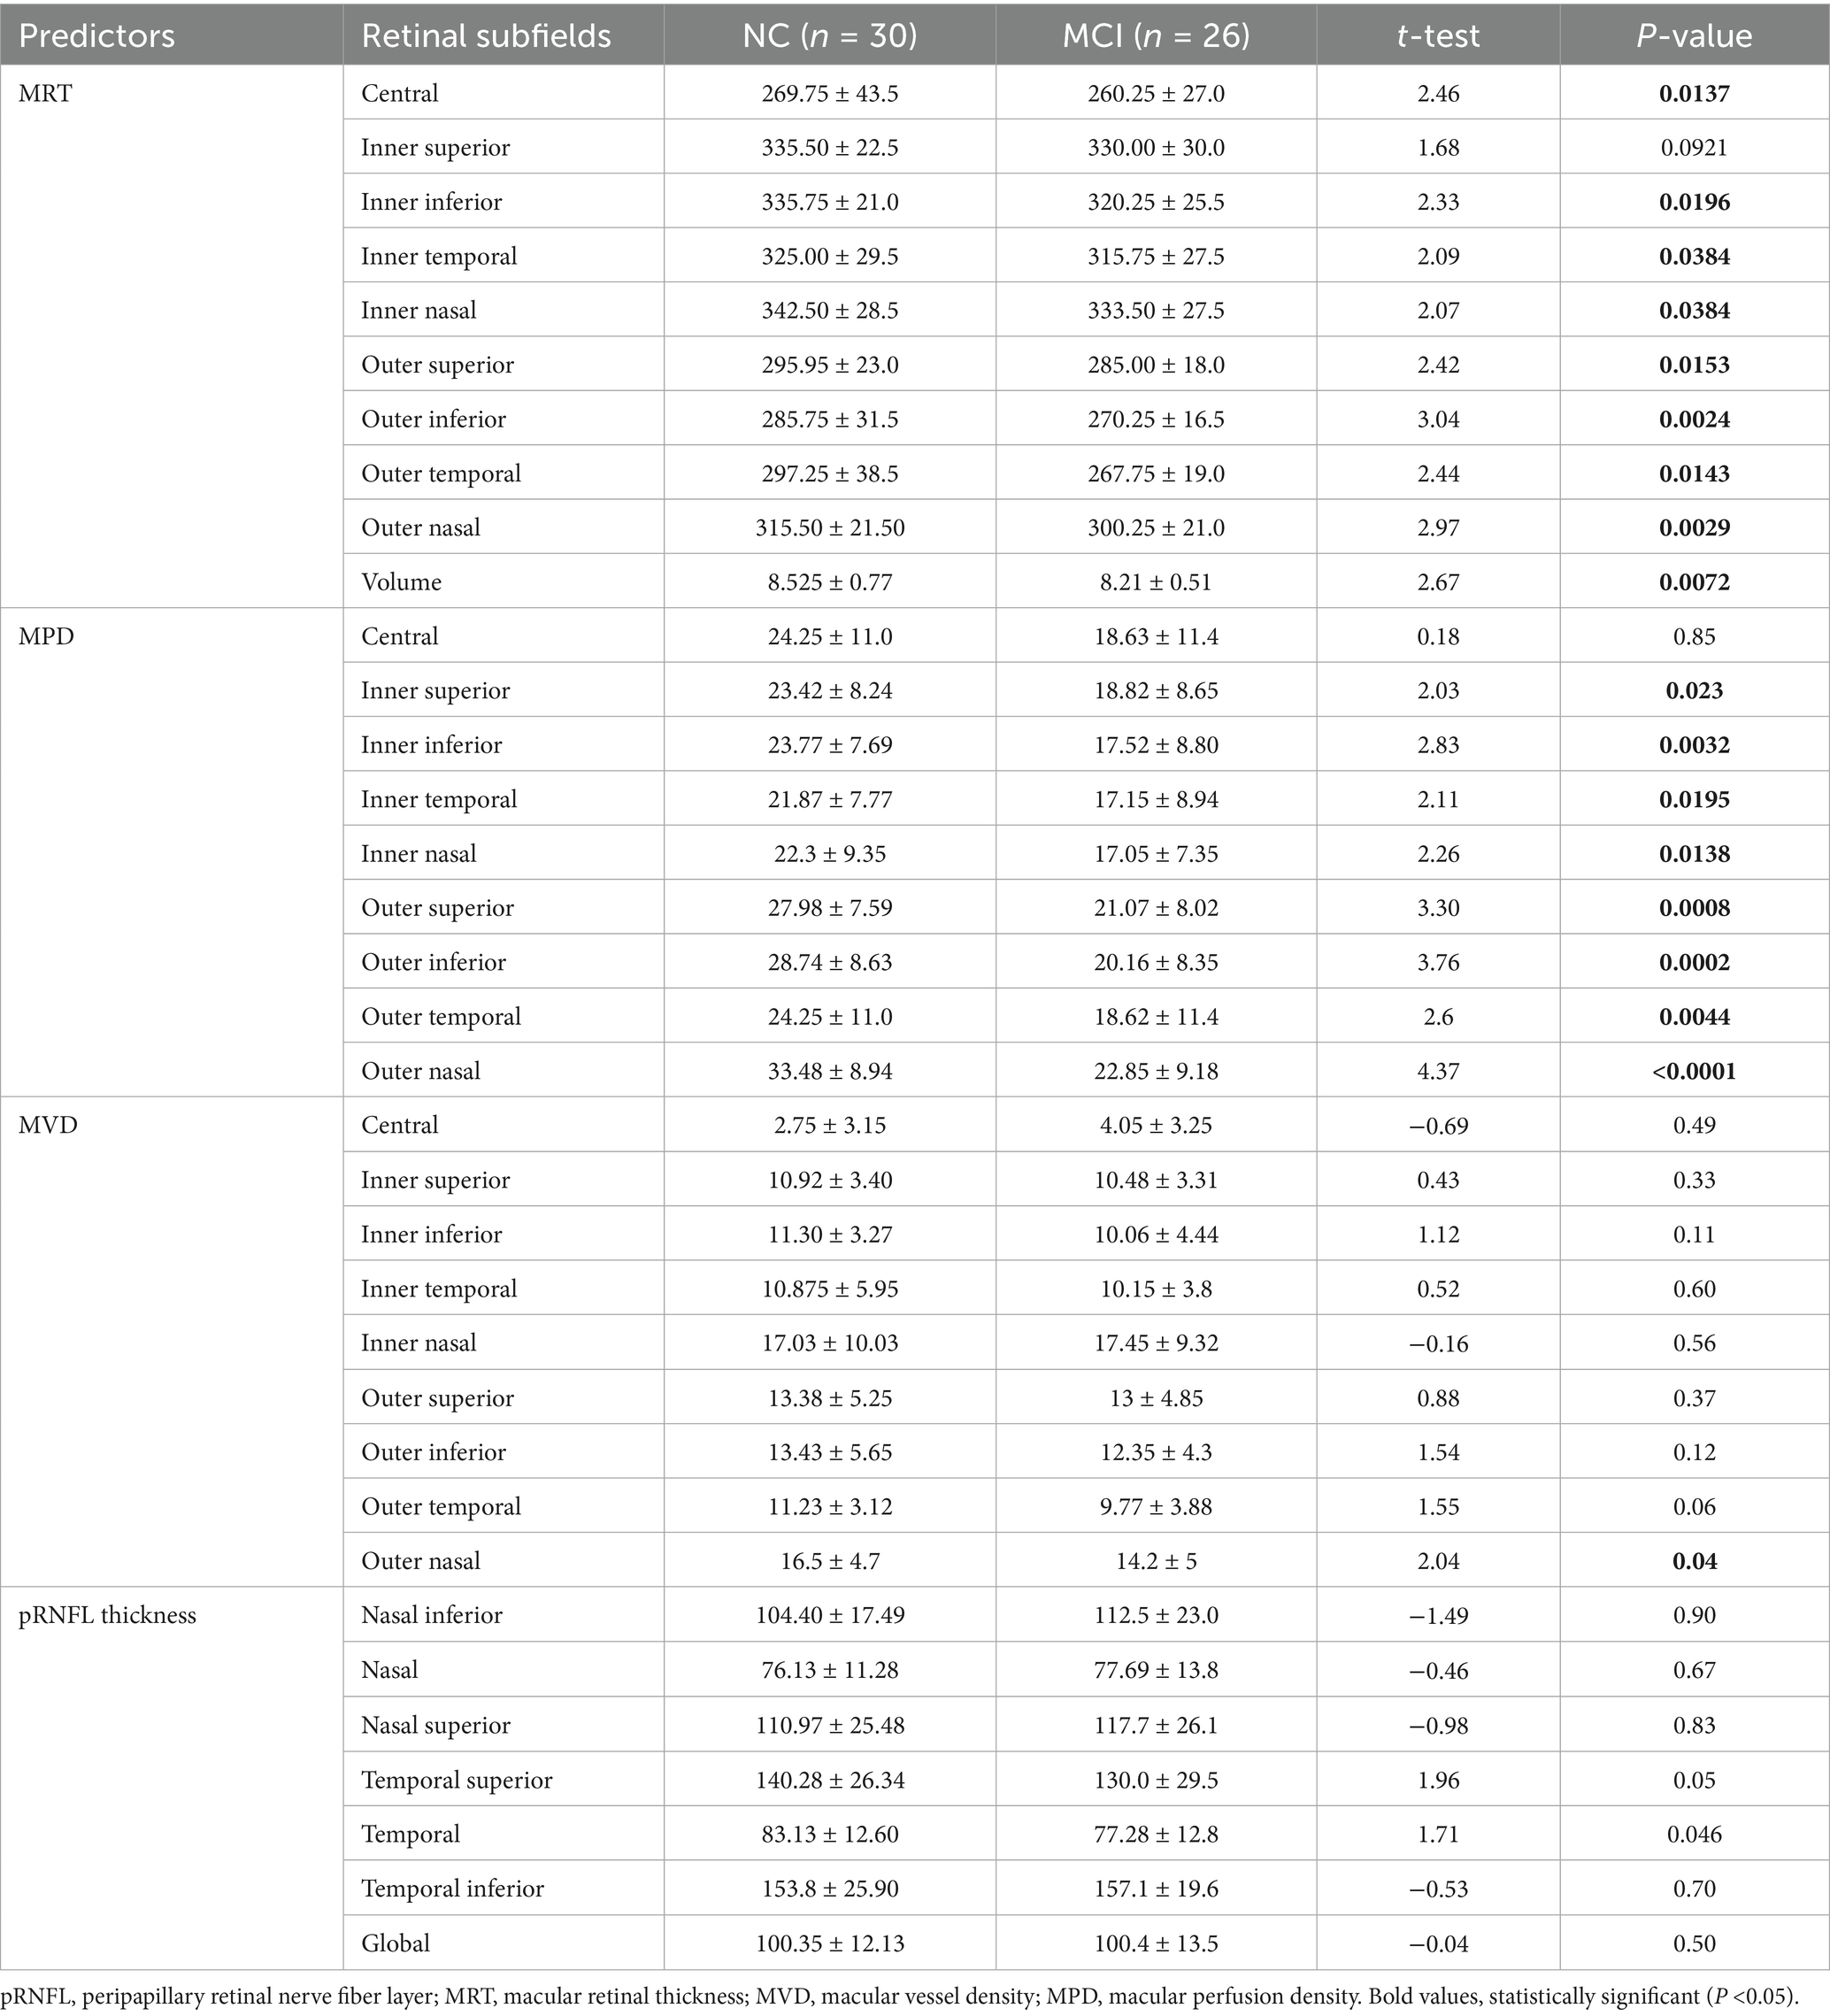
Table 2. Comparison of retinal thickness-related features between MCI and NC subjects.
3.3 Comparison of retinal vascular features
Compared with NC subjects, subjects with MCI demonstrated statistically significant reductions in MPD across all ETDRS subfields, except the central subfield. Notably, outer nasal MPD decreased more in MCI subjects than in NC subjects (p < 0.0001). Similarly, outer superior and inferior MPD were significantly lower in subjects with MCI compared to the NC subjects (CI: 21.07 ± 8.02; NC: 27.98 ± 7.59, t = 3.30, p = 0.0008) and (MCI: 20.16 ± 8.35; NC: 28.74 ± 8.63, t = 3.76, p = 0.0002), respectively. However, a significant reduction in MVD was observed only in the outer nasal subfields in subjects with MCI, and this was statistically lower than in NC subjects (p = 0.04). The outer temporal subfield also showed a trend toward reduction in subjects with MCI compared to the NC subjects, although this difference was not significant (p = 0.06) (Table 3). Significant sex-specific difference in retinal vascular changes was not observed (p > 0.05).
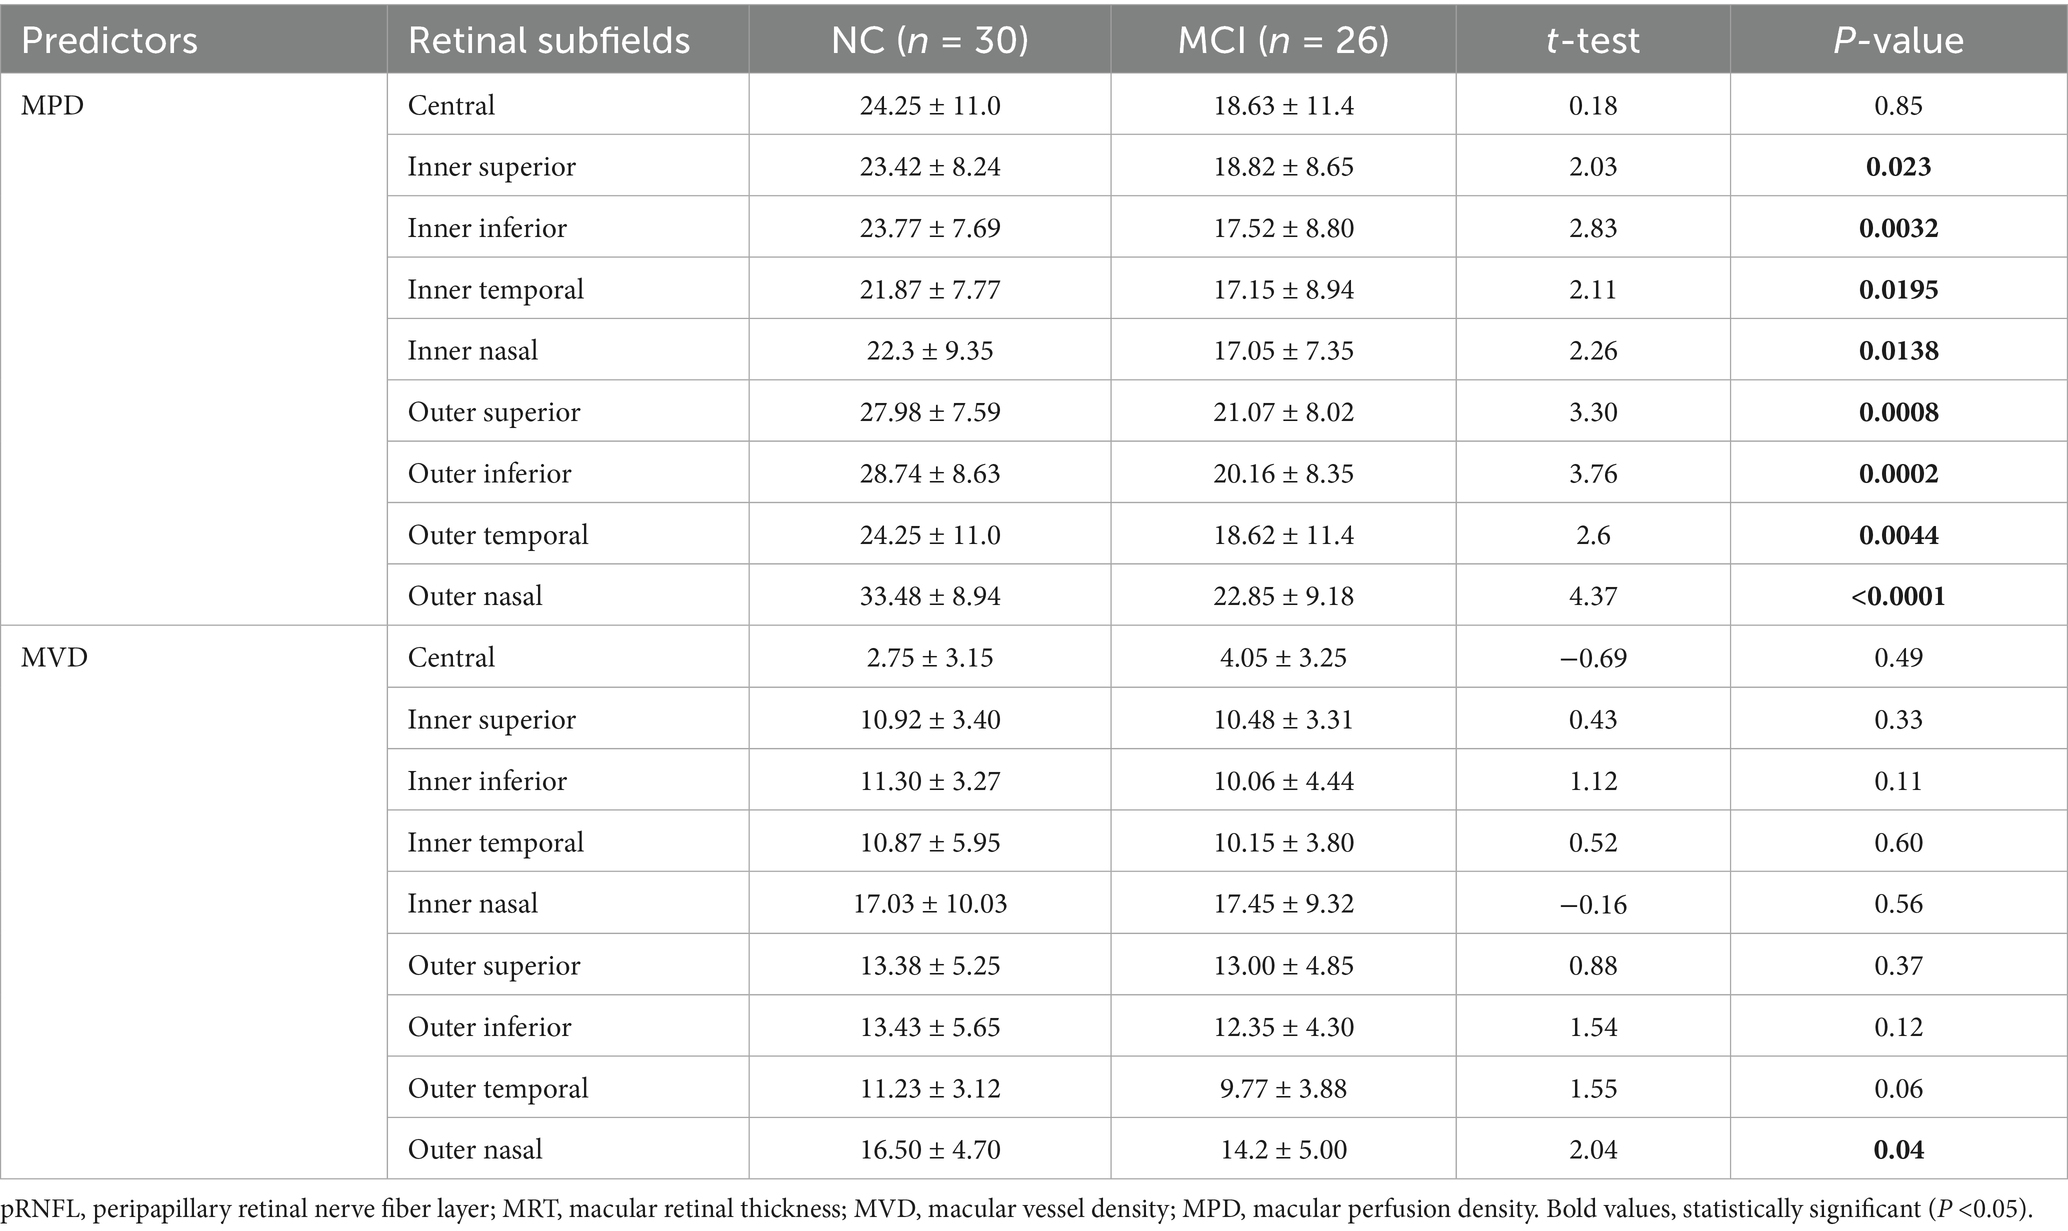
Table 3. Comparison of retinal vascular features of the superficial vascular layer between subjects with MCI and NC.
3.4 Predictor selection using LASSO regression analysis
Following screening for multicollinearity, 16 potential variables were examined using univariate analysis after adjusting for age (Table 4). These predictors were entered into the LASSO regression algorithm using a 10-fold cross-validation approach. Systematically, less relevant variables were shrunken to zero as the penalty coefficient (λ) increased. At the 0.056 optimal lambda value selected by cross-validation, 9 predictors, including age, contrast sensitivity, M-cone contrast, central MRT, outer temporal MRT, nasal inferior pRNFL, nasal superior pRNFL, outer nasal MPD, and outer superior MPD, were selected. In contrast, the coefficients of 7 predictors were shrunken to zero (Figure 2).
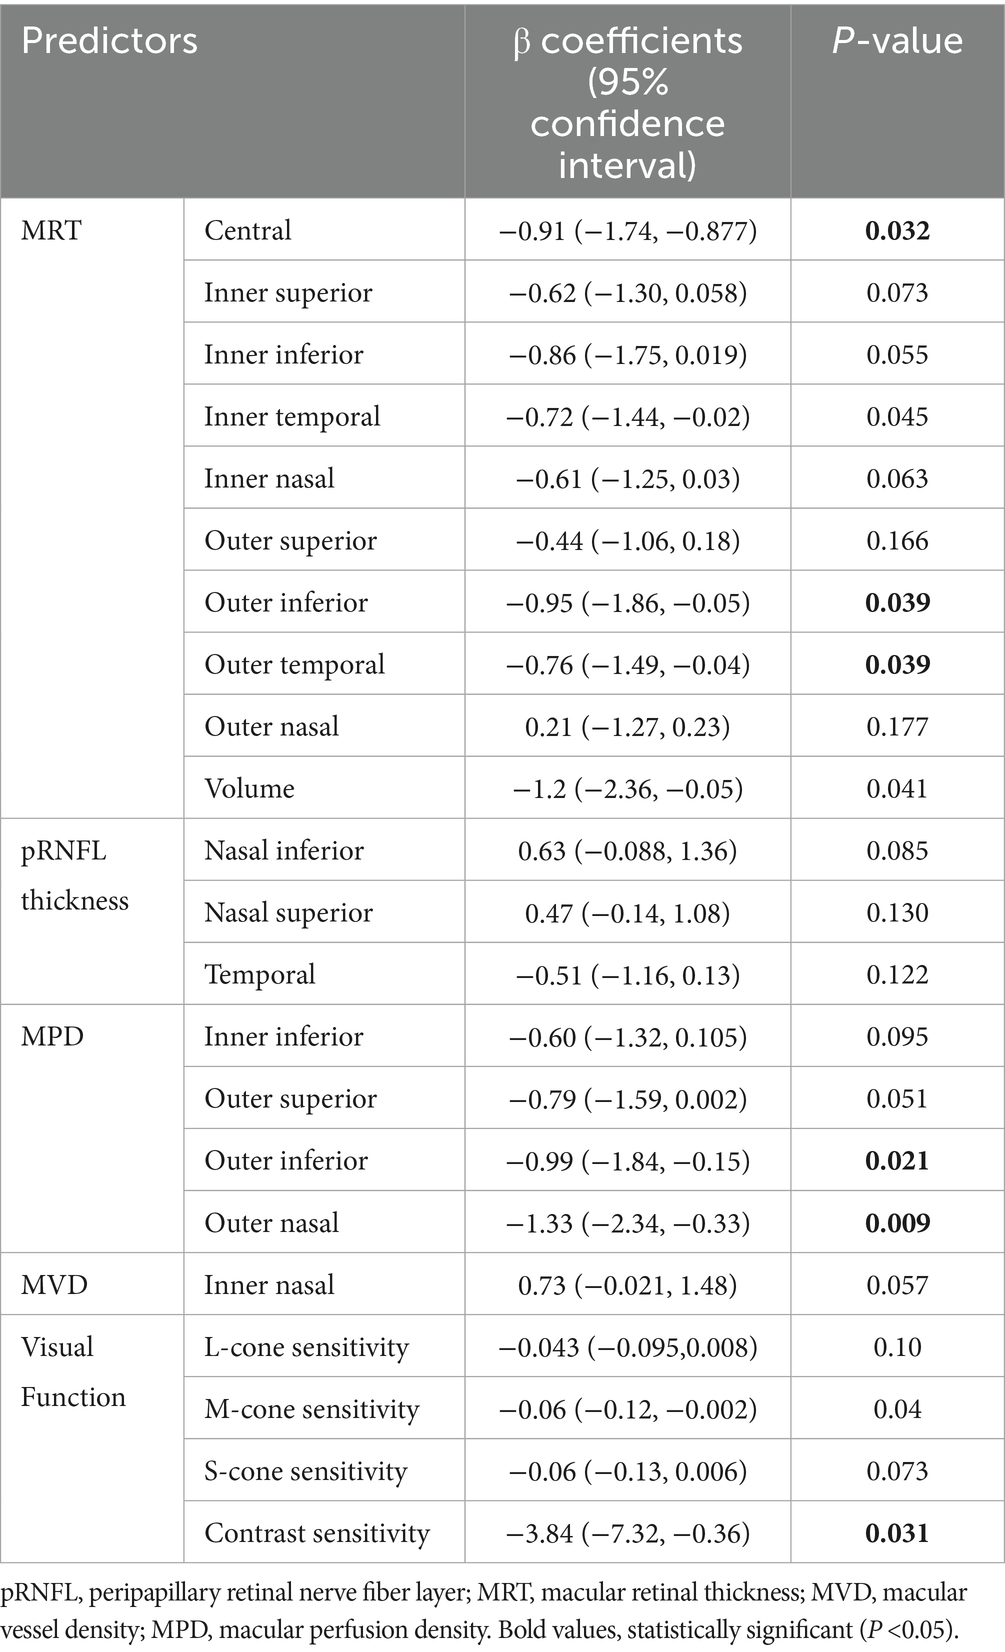
Table 4. Age-adjusted univariate analysis using a generalized linear model to identify potential predictors (n = 56).
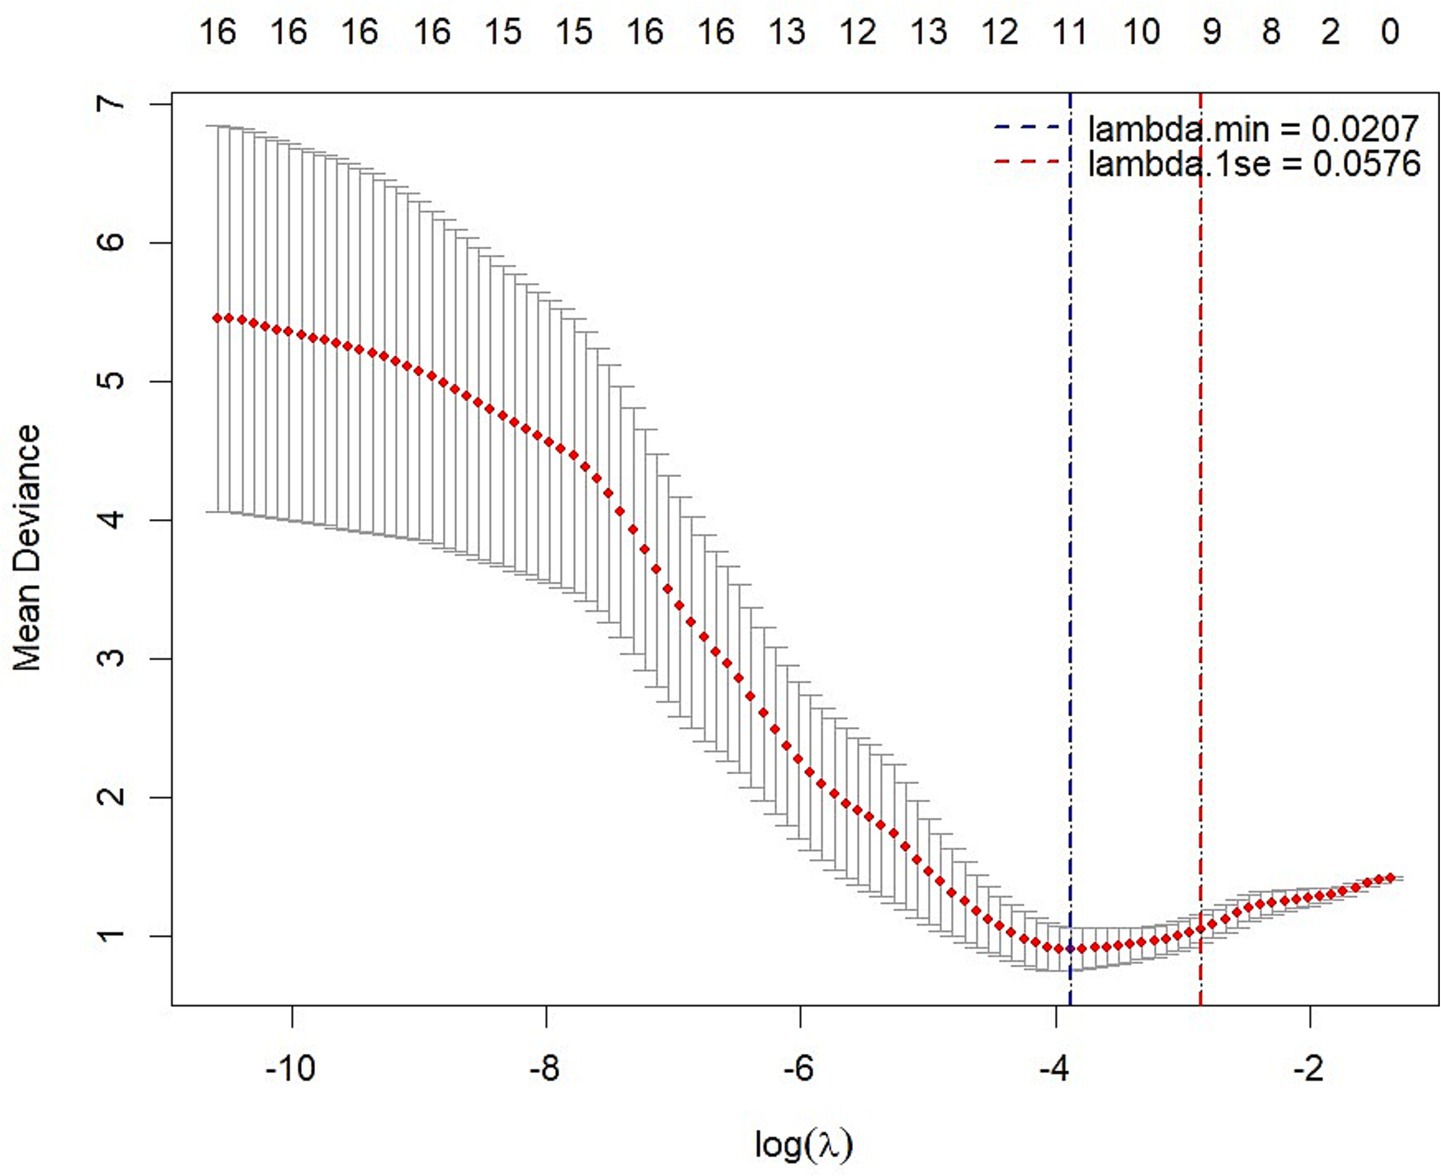
Figure 2. LASSO regression analysis with 10-fold cross-validation with a minimum error criterion to determine the optimal penalization estimate of λ.
3.5 Model development using multivariate logistic regression analysis
The selected variables were further analyzed using multivariate logistic regression analysis. The selected predictors were fitted into a multivariable binary logistic regression model using a backward stepwise method with a stopping rule of 0.10 to identify independent predictors of MCI, yielding the final model. Consequently, the final model retained 3 predictors: central MRT, outer nasal MPD, and contrast sensitivity. The Hosmer-Lemeshow goodness-of-fit test yielded a p-value greater than 0.05, indicating that the model fits the observed data well. The model indicated that a one-unit decrease in central MRT (β: −1.13; 95% CI: −0.15,-2.15; p < 0.05) and contrast sensitivity (β: 1.13; 95% CI: −2.03, −0.23; p < 0.05) was associated with a 1.13-fold increase in the risk of MCI. Similarly, a one-unit reduction in outer nasal MPD (β: 1.68; 95% CI: −2.92, −0.44; p = 0.008) was associated with an increase in the risk of MCI by 1.68 (Table 5). Based on the final regression model, the risk score ranged from −9.52 to 7.73. Subjects with MCI had a mean risk score of 1.52 ± 2.02, which was significantly higher than the mean risk score of −1.84 ± 2.38 in subjects with NC (p < 0.0001). The probability of MCI was 0.43 when central MRT (276 μm), outer nasal MPD (28.55), and contrast sensitivity (1.52) were all at their mean. When the central MRT increased by one standard deviation above the mean (318 μm), while outer nasal MPD (28.55) and contrast sensitivity (1.52) remained at their mean, the probability of MCI was 0.2. Similarly, increasing contrast sensitivity (1.72) by one standard deviation above the mean, while keeping the central MRT (276 μm) and the outer nasal MPD (28.55) at their means, yielded a probability of MCI of 0.20. Likewise, the probability of MCI was 0.13 when outer nasal MPD (38.99) was increased by one standard deviation above the mean, with central MRT (276 μm) and contrast sensitivity (1.52) at their mean. The corresponding effect size for increasing central MRT and contrast sensitivity by one standard deviation above the mean, while keeping other predictors at their means, is 0.23. The predictors showed 0.2 non-significant correlation to each other. Hence, the retrospective power analysis indicated that nearly 51 samples were required to detect the desired effect size of 0.23.
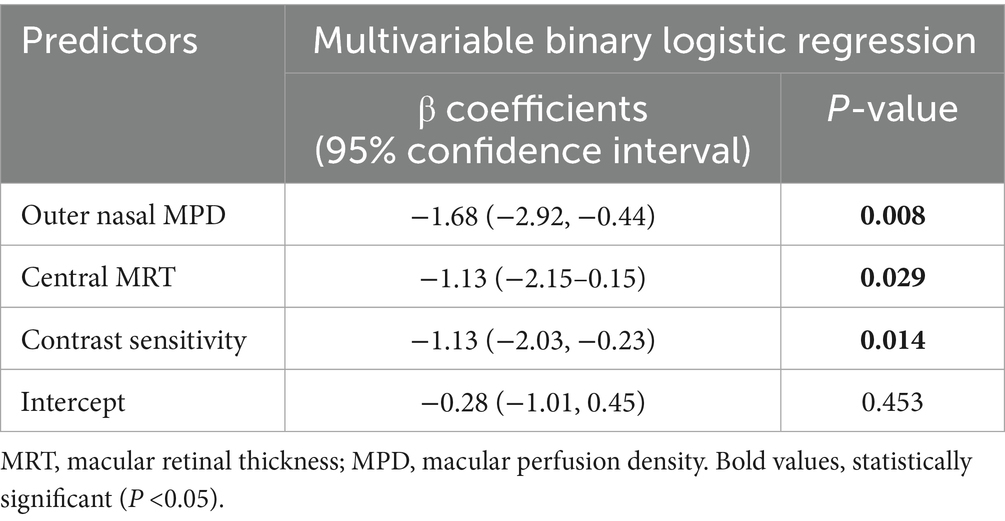
Table 5. Multivariable binary logistic regression analysis to predict MCI (n = 56).
3.6 Nomogram construction
Based on the final regression model, a nomogram incorporating central MRT, outer nasal MPD, and contrast sensitivity was constructed using the “rms” package to predict the occurrence of MCI among older adults. Construction of the nomogram involved computing the total score and the prediction index scores for each variable using the ratio method. The risk contribution of each predictor at a given observed value was scalled between 0 to 100 points, and the sum of prediction index scores for each variable contributed to the total score. Higher total scores indicated a higher risk of MCI. Furthermore, a dynamic nomogram app was also developed using the “DynNom” packages to visualize statistical models. Subsequently, the “rsconnect” function was run to deploy on a web server at https://mciprediction.shinyapps.io/MCIAPP1/. This web-based calculator has a user-friendly interface that allows manipulation of the predictors’ observed values and computation of the corresponding predicted probability of MCI (Figure 3).
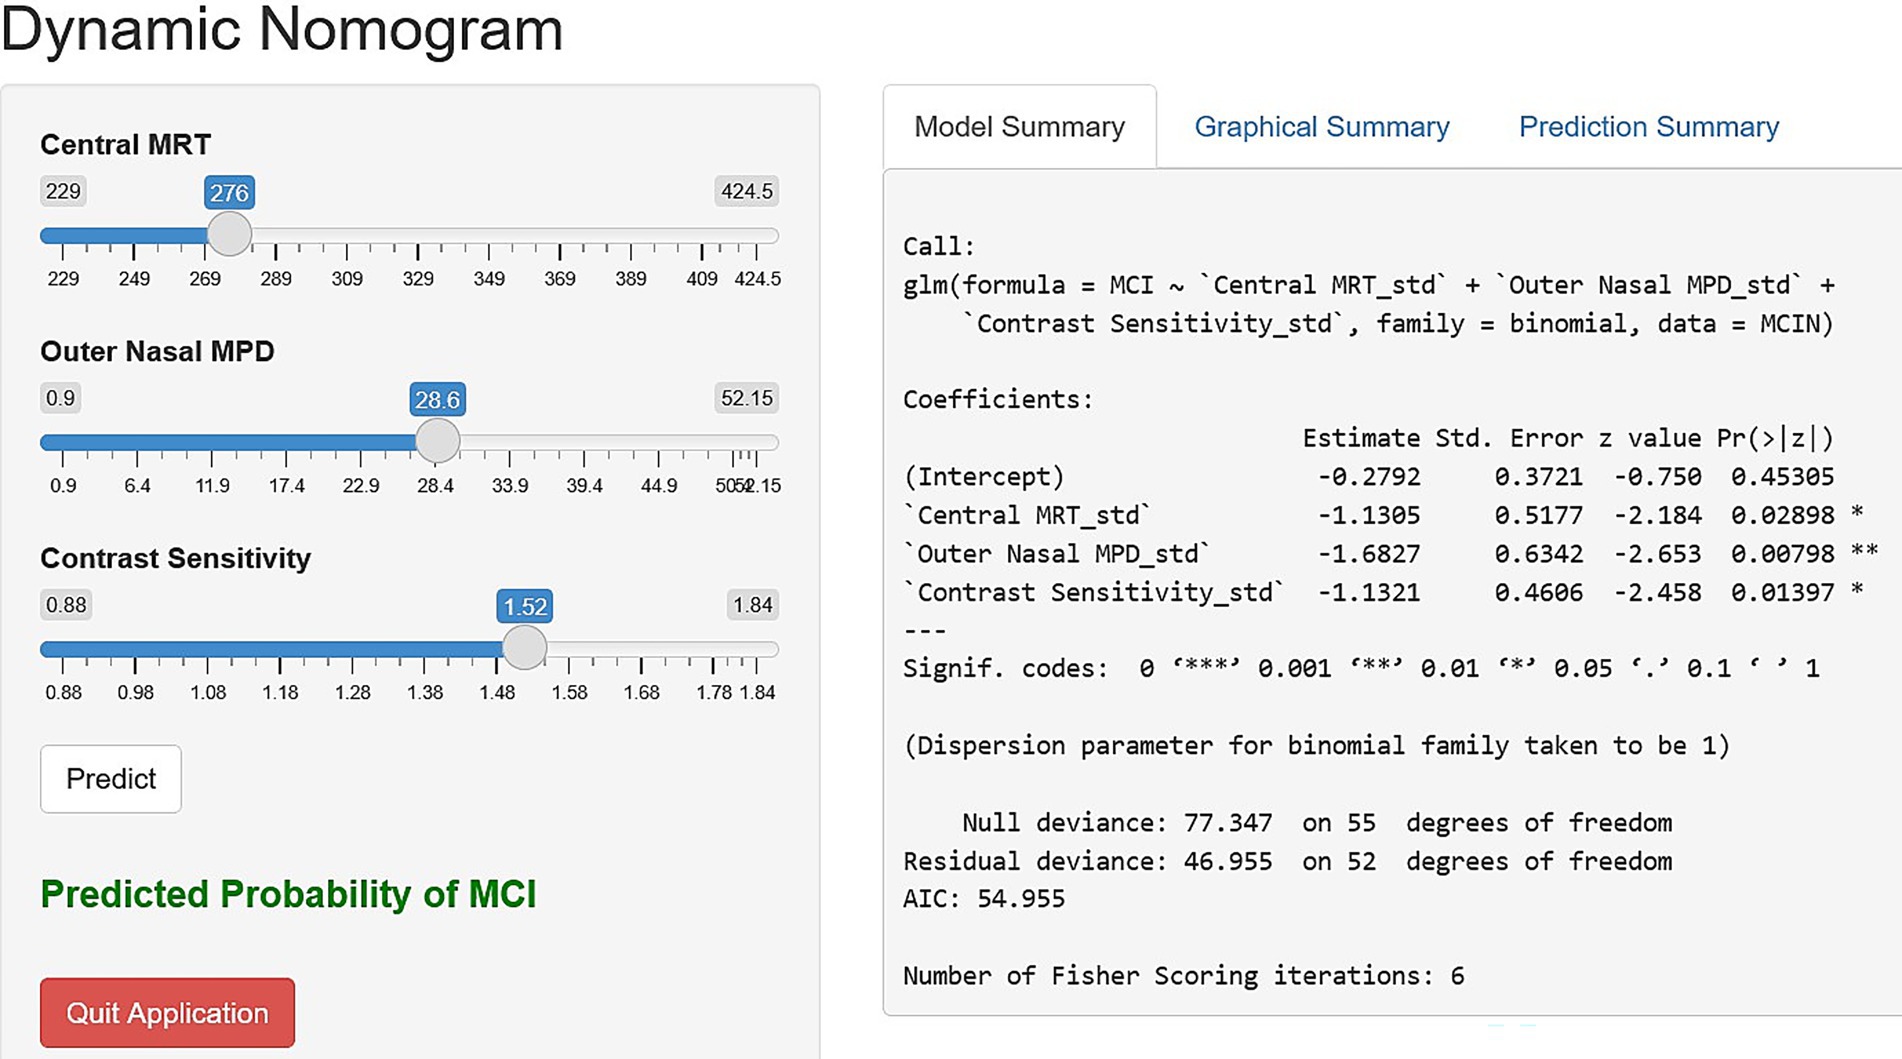
Figure 3. Dynamic nomogram application interface using central MRT, outer nasal MPD, and contrast sensitivity to simplify the risk scoring in clinical settings.
3.7 Evaluation and validation of the nomogram
Visually, the density plot against predicted probabilities was bimodal, with two distinct peaks, reflecting the concentration of observed cases across two distinct probability ranges. Low probabilities indicate NC, and higher predictive probabilities represent MCI. This bimodality indicated that the model performed well in distinguishing MCI from NC (Figure 4).
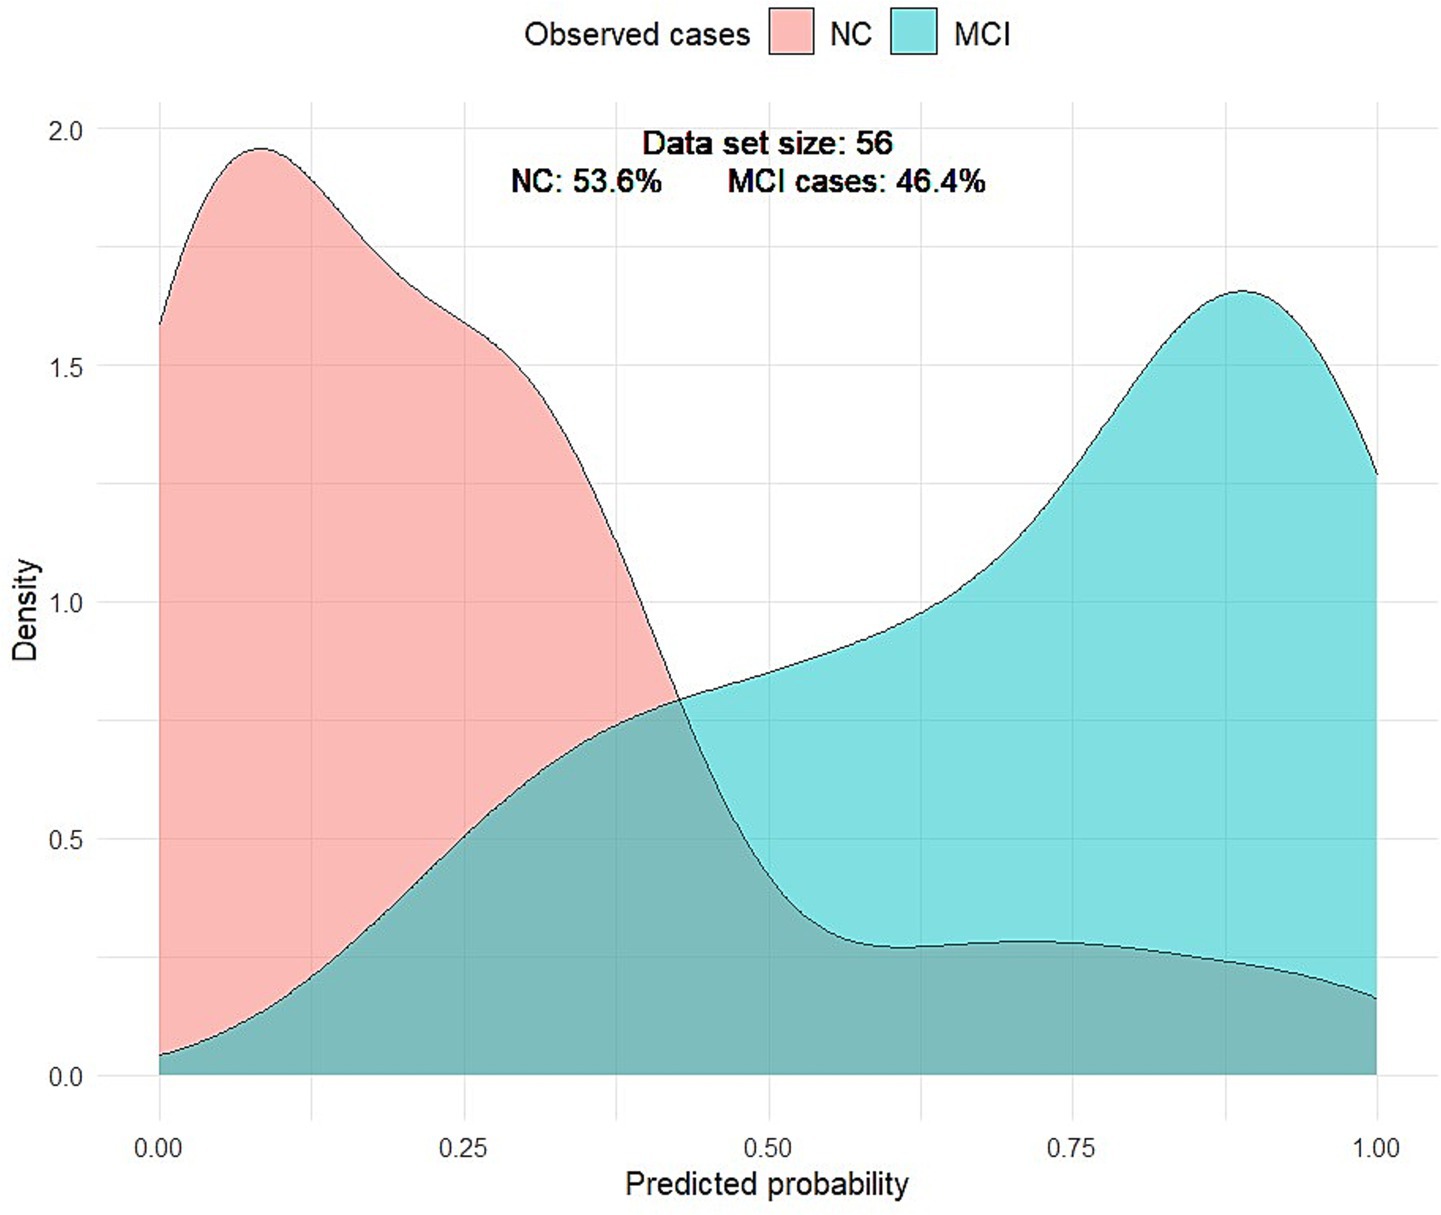
Figure 4. Density plot of predicted probabilities by MCI. The light red curve represents the density distribution for the NC group, and the light green curve represents the density distribution for the MCI group. The gray-green curve represents the false-positive and false-negative cases.
The nomogram-based model, which integrated central MRT, outer nasal MPD, and contrast sensitivity, demonstrated high discriminative power with an AUC of 0.896 (95% confidence interval: 0.81, 0.98). Alternatively, models combining only outer nasal MPD and contrast sensitivity, as well as outer nasal MPD with central MRT, also achieved a discriminative power of 0.84 (95% confidence interval: 0.74, 0.94) and 0.837 (95% confidence interval: 0.73, 0.94), respectively (Figure 1A). Through bootstrapping validation (B = 1,000), the bias-corrected AUC was 0.87, with an optimism value of 0.029, indicating that high discrimination power was also maintained for unseen data (Figures 5A,B).
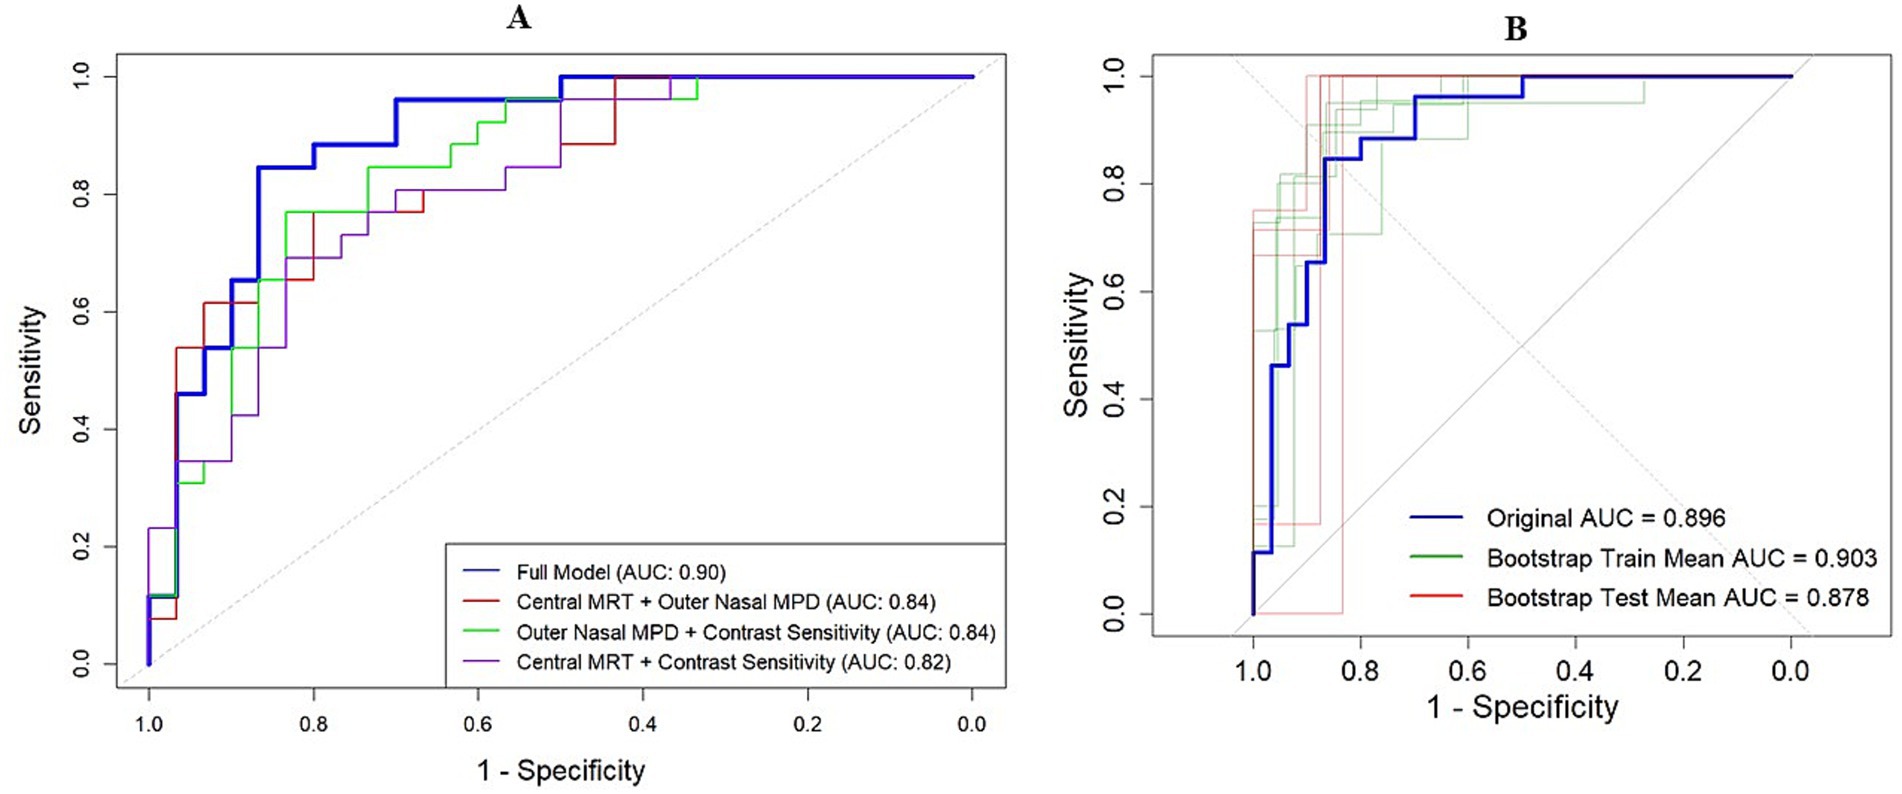
Figure 5. Model discrimination power indicated by AUC. (A) Model discrimination in the original dataset. The red curve represents AUC by combining outer nasal MPD and central MRT. The green curve indicates the AUC by combining nasal MPD and contrast sensitivity, while the pink curve denotes the AUC by combining central MRT and contrast sensitivity. The bold blue curve represents the AUC of the full model for detecting MCI among older adults. (B) Model discrimination in the bootstrap training (green curve) and testing (red curve) dataset compared to the original AUC (blue curve).
The calibration plot also showed no significant deviation, as the actual calibration curve (the gray-shaded area) was evenly bisected by the ideal calibration curve (the red line), indicating no significant under- or over-confidence, with a 95% confidence interval (p > 0.05). Following bootstrap validation, the model also showed no evidence that the bias-corrected calibration line deviates significantly from the ideal 45-degree line (Z = −0.196, p = 0.844), indicating good calibration with the test dataset (Figures 6A,B).
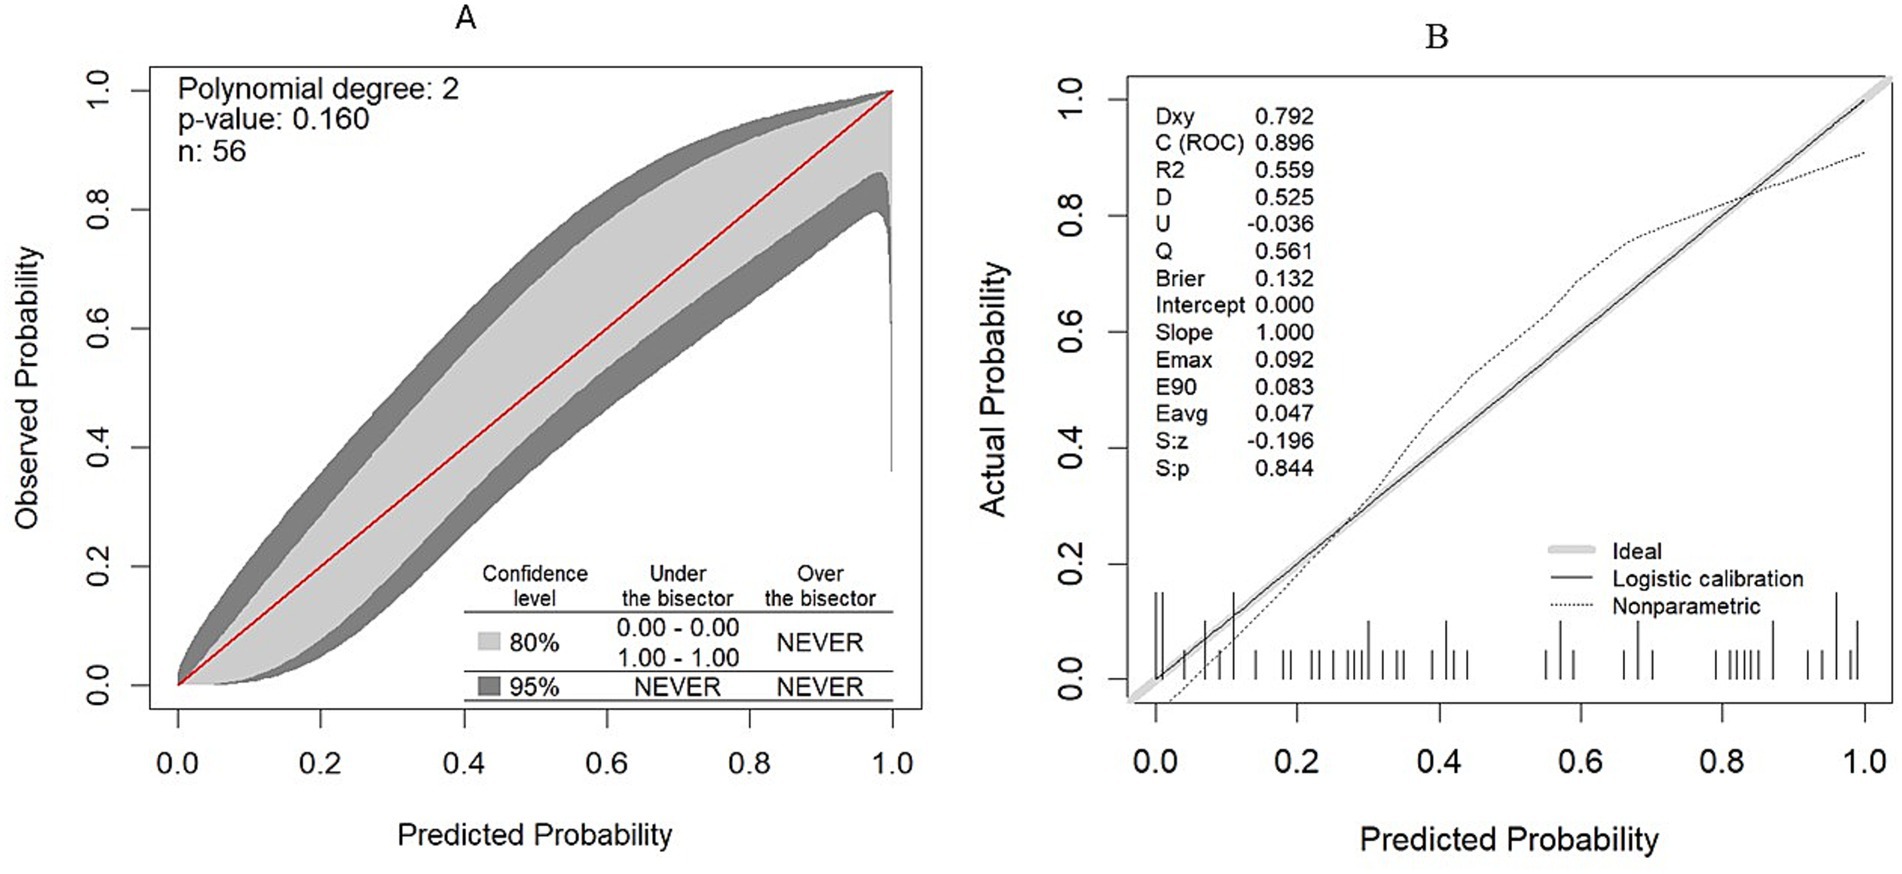
Figure 6. Model calibration plot. (A) Model calibration plot in the original dataset. (B) Model calibration plot after validation with the bootstrapping technique.
The overall model evaluation demonstrated reasonably high performance, with a Nagelkerke R-squared of 0.40. Spiegelhalter’s z-statistic p-value of the final model was 0.58, indicating that the observed and predicted probabilities were well matched and calibrated. The Brier score was 0.13, indicating high predictive accuracy. The optimism coefficients for the intercept, Brier score, and R2 were −0.0228, 0.06, and −0.0015, respectively, indicating the closeness of the bias-corrected value to the original index and ensuring high performance after validation (Table 6).
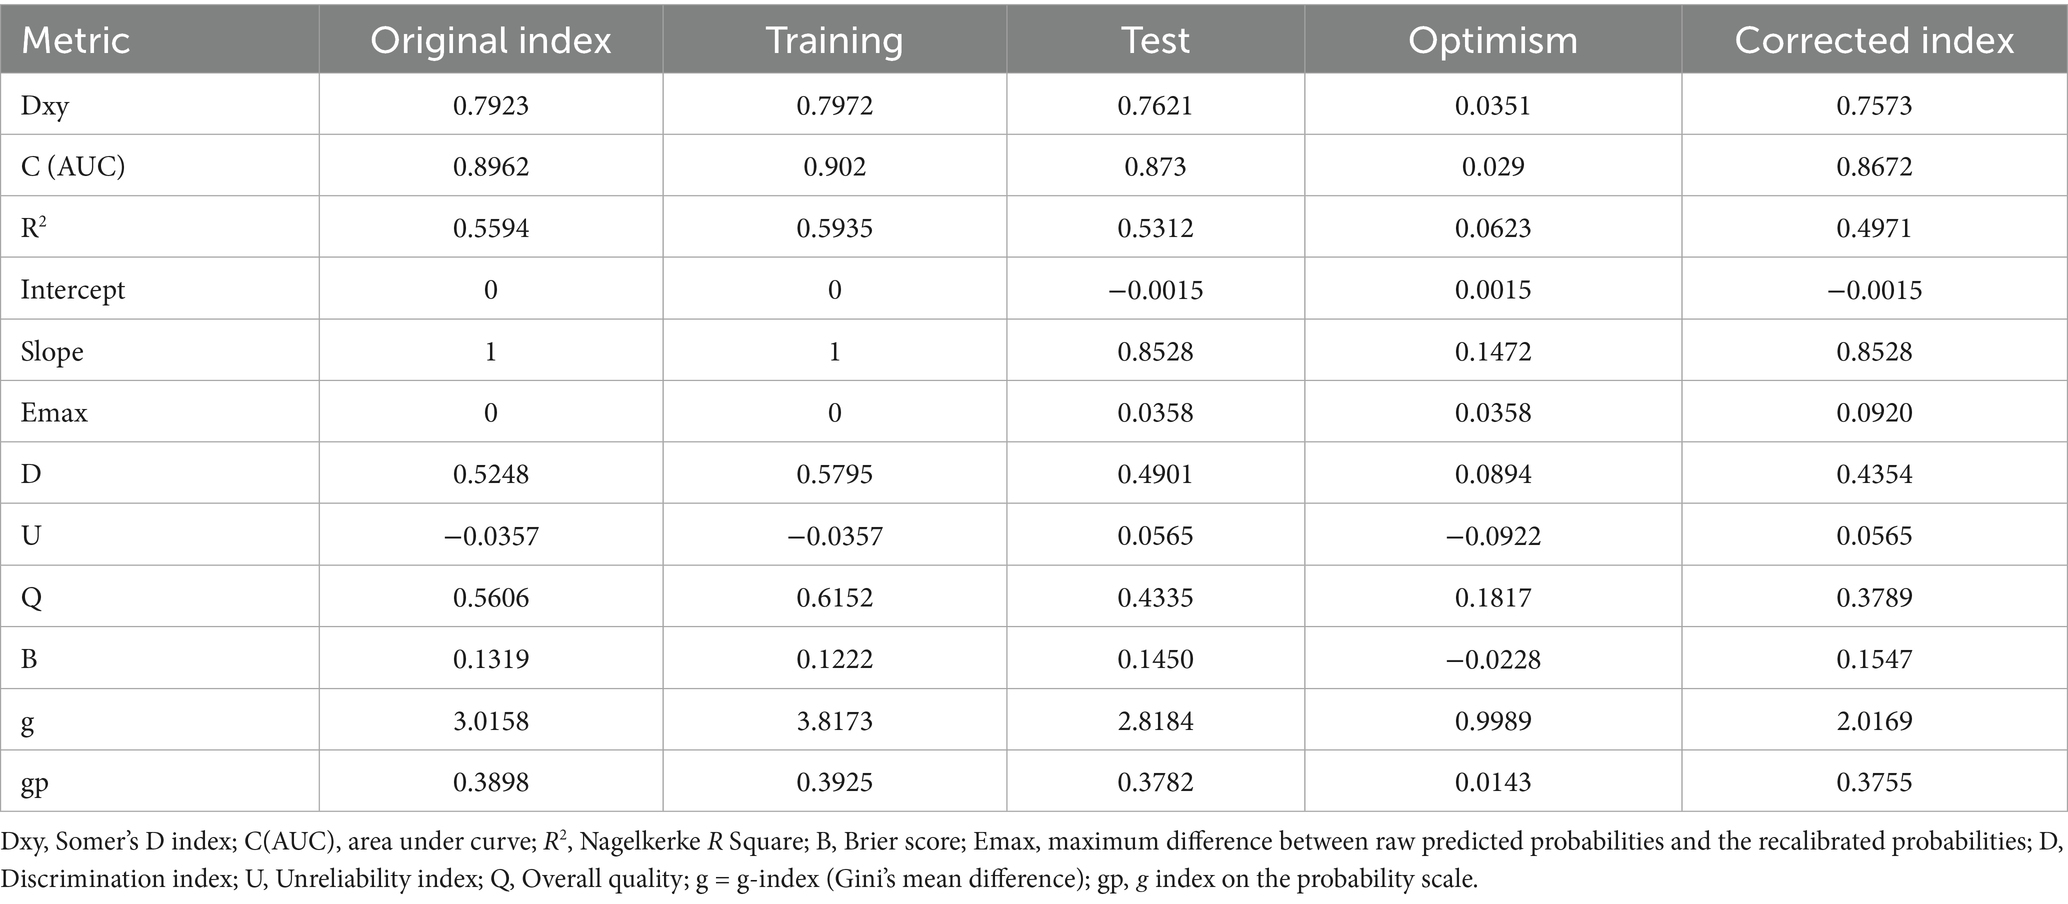
Table 6. Model performance after validation with the bootstrapping method in detecting MCI among older adults (B = 1,000).
3.8 Optimal cutoff point determination
The optimal cutoff point for stratifying subjects into low- and high-risk categories for MCI, based on the model, was determined through sensitivity analysis using the Youden index method (Table 7). At a Youden index of 0.72, the optimal cutoff points of risk score and total points derived from the nomogram were −0.31 and 116.5, respectively. These optimal cutoff points achieved the highest possible accuracy of 85.71%, sensitivity of 84.62%, specificity of 86.67%, PPV of 84.6%, and NPV of 86.6% (Figure 7).

Table 7. Risk score value and corresponding estimated predicted probability of MCI, along with common performance indices of risk score-based classification.
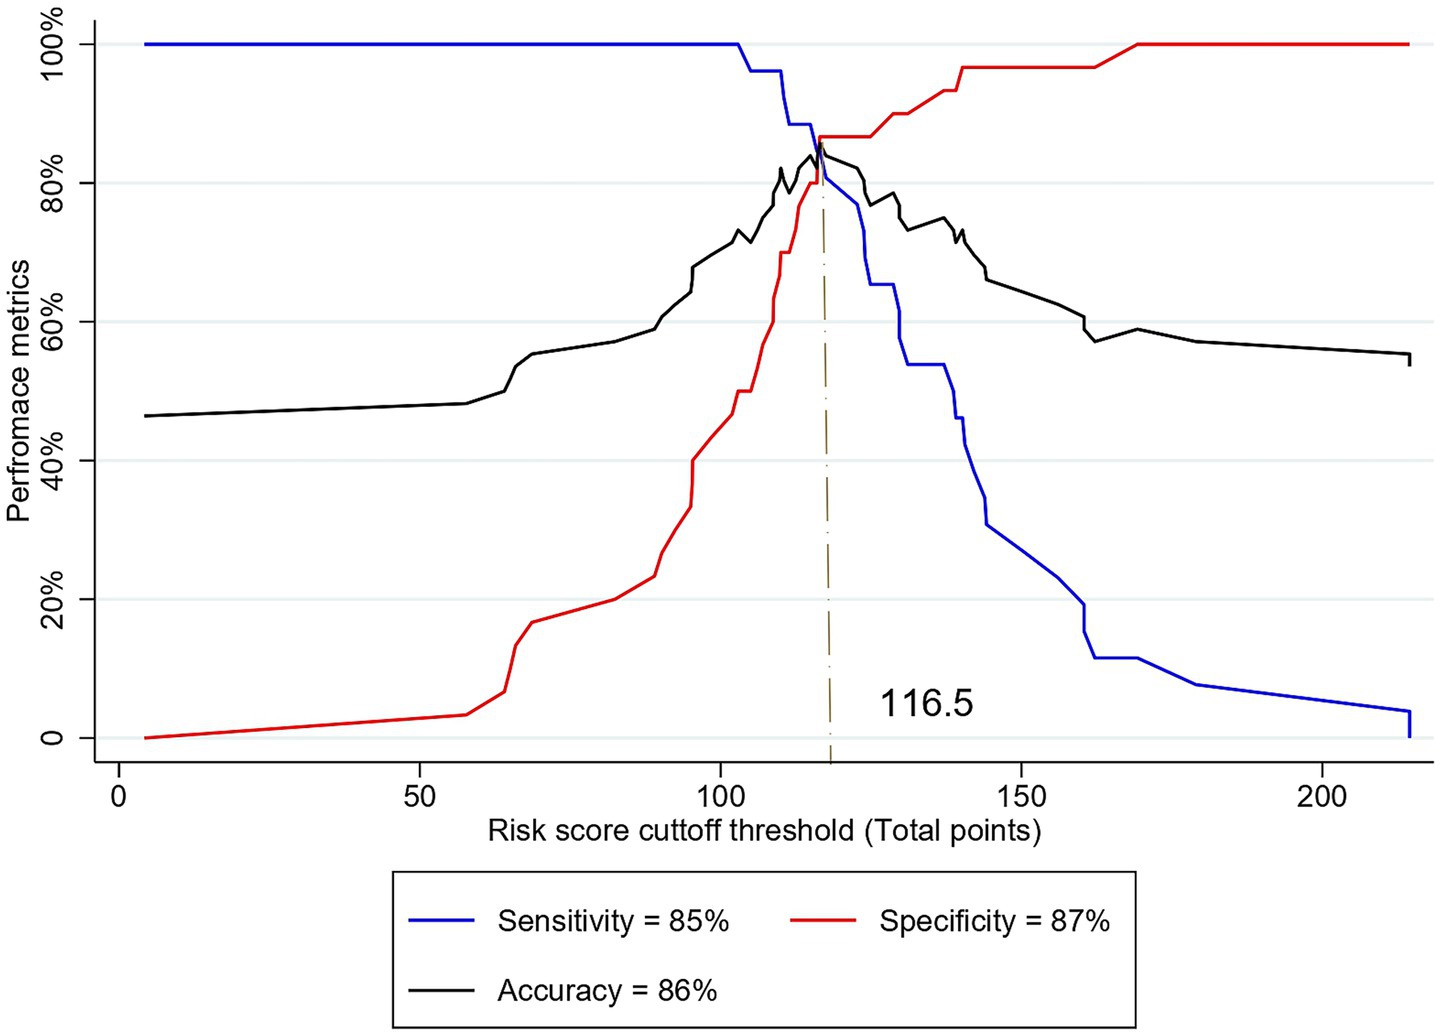
Figure 7. Sensitivity analysis of different cutoff thresholds of risk score based on the total points to predict MCI among older adults.
3.9 Clinical impact and utility of the model
Furthermore, the clinical impact and utility of the model were evaluated by DCA. In the DCA curves, the Y-axis represents the net benefit, while the X-axis indicates the threshold probability.
The net benefit of the model for each threshold probability was compared with two extreme scenarios: “treat all” and “treat none.” Thus, the DCA indicated that decision-making based on the model yields a higher net benefit for each threshold probability compared to the two extreme situations (Figure 8).
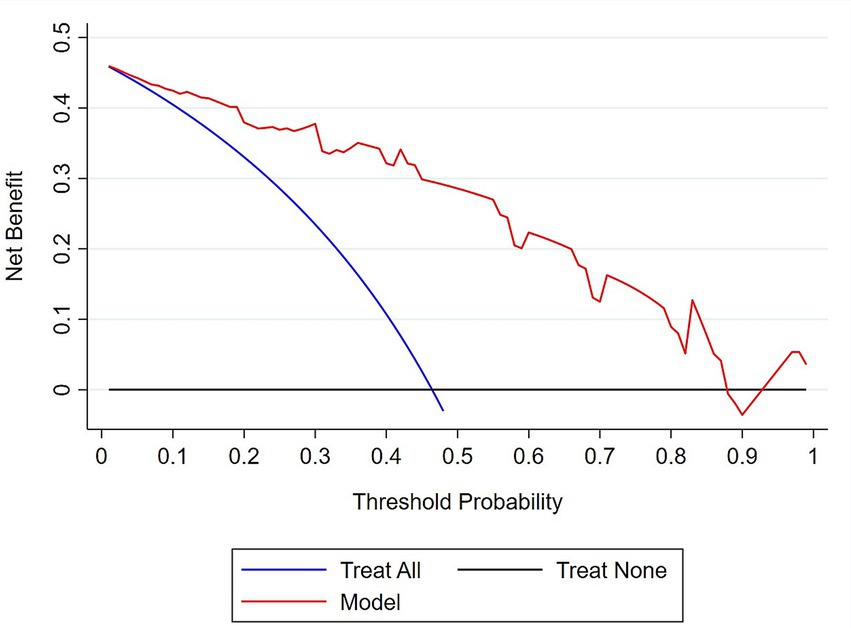
Figure 8. Decision curve analysis plot to demonstrate the clinical usefulness of the model in predicting MCI. The bold red line represents the net benefit of decision making based on the model at different threshold probabilities; the blue line represents the net benefit of treating all subjects with MCI; the black line represents the net benefit of the ‘treat none’ scenario.
4 Discussion
Dementia is a heterogeneous clinical condition that is orchestrated by a wide range of demographic, health-related, and biological factors. Vision impairment has also been recognized as a potential predictor that increases the risk of dementia in older adults, through limiting physical activity and social engagement (Shang et al., 2021; Lee et al., 2021). Specifically, retinal diseases such as AMD, glaucoma, and diabetic retinopathy have shown a significant association with an increased risk of all-cause dementia (Feng et al., 2023). Recently, early retinal structural and vascular changes, prior to the onset of clinically detectable retinal pathologies associated with AD and MCI, have been identified as useful biomarkers that may signal central neurovascular changes underlying early cognitive decline. However, they have not yet been applied in clinical practice (Ge et al., 2021). Following a rigorous model development and validation process, this study introduces a user-friendly nomogram that leverages non-invasive visual and retinal biomarkers for the early identification of cognitive impairment among ophthalmic patients. The nomogram incorporates central MRT, outer nasal MPD, and contrast sensitivity and demonstrates excellent discriminative ability in both the training and testing datasets (AUC: 0.896) to differentiate between individuals with MCI and those with normal cognitive function among ophthalmic patients aged 60 and above, as evidenced by bootstrap validation. Clinical decision-making based on the model, as assessed by DCA, suggests a potential net benefit; however, these findings remain preliminary. Both retinal and visual features exhibited good diagnostic performance, with a discriminative power of 0.78–0.8. These findings align with previous research indicating the potential of contrast sensitivity (Risacher et al., 2013; Elvira-Hurtado et al., 2023), macular retinal thickness features (Almeida et al., 2019; Salobrar-García et al., 2019; Cunha et al., 2016), and retinal vascular features (Chua et al., 2020) as biomarkers for cognitive impairment. Combining central MRT and outer nasal MPD also achieved a discriminative power of 0.84 with an accuracy of 75%, which is similar to the performance of retinal image-based deep learning model combining vascular features of the SVL, deep vascular layer, and choriocapillaris (Hao et al., 2024), OCT images and or retinal photograph (Shi et al., 2024; Gao et al., 2023; Zhang et al., 2021), and ganglion cell-inner plexiform layer thickness with OCTA images (Wisely et al., 2024). Our study enhanced the ability to detect retinal features by complementing them with visual function. Decrease in contrast sensitivity has been associated with AD and MCI (Risacher et al., 2013; Risacher et al., 2020).
The retina, as an extension of the central nervous system, shares structural and vascular traits with the brain, reflecting neural changes in neurodegenerative diseases (London et al., 2013). Importantly, identification of Aβ plaques in the postmortem retina of AD patients has been considered a significant advancement (Koronyo-Hamaoui et al., 2011; Lee et al., 2020; Koronyo et al., 2017), driving a special interest in in vivo retinal imaging. Thus, several studies have shown a significant reduction in total macular thickness associated with cognitive decline (Kim and Kang, 2019; Giménez Castejón et al., 2016; Cunha et al., 2017; Cunha et al., 2016; Hao et al., 2023; Ito et al., 2020; Kao et al., 2023). Cognitive scores positively correlate with total macular thickness (Kim and Kang, 2019; Zhao et al., 2023; Mei et al., 2021), with strong correlation in the superior and temporal quadrants. This relationship has been further substantiated by linking the perifoveal retinal thickness to the hippocampal volume (Tao et al., 2019). Specifically, a positive correlation between total retinal thickness and hippocampal volume is more predominant in MCI (Chen et al., 2023). Consistent with previous findings, this study also observed a significant association between macular thickness in central, temporal, and inferior areas and cognitive decline after adjusting for age.
The neurovascular unit of the brain maintains the integrity of the blood–brain barrier and regulates cerebral blood flow, thereby maintaining normal brain function (Yu et al., 2020). Disruption of the neurovascular unit impairs oxygen and nutrient supply, as well as the clearance of neurotoxic substances, such as β-amyloid, resulting in the expression of amyloid precursor protein, capillary hypoperfusion, neurofibrillary tangle formation, neuroinflammation, neuronal damage, and cognitive deficits (Ahmad et al., 2020; Kisler et al., 2017; Nelson et al., 2016; Shabir et al., 2018). Neurodegenerative diseases that cause cognitive decline are associated with reduced neurovascular coupling (Gao et al., 2023) and decreased cerebral blood flow (Li et al., 2023). Similarly, many studies have documented retinal vascular alterations in the posterior pole associated with AD and MCI (Criscuolo et al., 2020; Chua et al., 2020; Fang et al., 2021; Hu et al., 2023; Jiang et al., 2023; Jiang et al., 2018). Retinal vascular changes have been linked to the high burden of retinal amyloid, in which a severe decrease in retinal vascular zonula occludens-1 and claudin-5 correlated with abundant arteriolar Aβ40 deposition in subjects with MCI and AD (Shi et al., 2023). Retinal claudin-5 deficiency has shown a significant association with cerebral amyloid angiopathy, while vascular zonula occludens-1 defects have been linked to cerebral pathology and cognitive decline. This study also detected a significant association between perfusion density in the macular area and cognitive impairment, suggesting an underlying neurodegenerative process. This evidence of altered retinal structural and neurovascular features provides insight into the possibility that the brain and retina may undergo a shared trajectory of neurodegeneration underlying cognitive changes. Altogether, this model comprises predictors that show a trend of association with cognitive changes, although some inconsistencies are present. This evidence suggests that the model is scientifically explainable, as it links the importance of retinal and visual features to cognitive function and their plausible scientific relationship.
Additionally, model interpretability is crucial to the model’s clinical utility. In routine clinical practice, clinicians easily collect the observed value of many predictive variables. However, using the predictors to make a holistic decision about the disease or treatment outcome over time requires a scientific formulation. Nomogram-based models are increasingly considered valuable clinical tools that convert complex statistical models into simple, intuitive graphical risk indicator tools. Given that a nomogram integrates multiple prognostic factors into a single score, nomogram-based prediction provides continuous risk scores, allowing for precise stratification into personalized risk categories, compared with traditional clinical staging of disease. This tool is commonly used in tracking chronic diseases, particularly in the management of cancer (Vernerey et al., 2016; Liu et al., 2022). This study uses readily extractable predictors, without requiring further feature generation, which may ensure technical efficiency and model utilization feasibility. The scoring is intuitively simplified with a dynamic nomogram app, enabling rapid, efficient classification of the target population. Moreover, the net benefit analysis indicated that the model yields a higher net benefit across all threshold probability ranges. Thus, the net benefit suggests that the consequences of decision-making based on the model were cost-effective, despite no economic evaluation having been conducted.
Although the clinical demographic profiles of ophthalmic patients vary with eye care models, the model may target a high-risk segment of patients who are readily accessible for opportunistic screening.
This approach might complement existing cognitive assessments, but decision-making based on the nomogram should be carefully contextualized within broader clinical evaluation. Moreover, because the model was developed with a small sample size, there may be a risk of overfitting and limited generalizability, despite adherence to the clinical prediction model development rule (Stiell and Wells, 1999) and the use of a rigorous variable selection method. Following statistically proven sample size estimation methods such as Riley’s approach might decrease random error (Riley et al., 2019; Riley et al., 2020). Moreover, the retrospective power analysis obtained from this study may also facilitate prior sample size estimation in future clinical studies.
The model was internally validated with good performance, yet external validation with independent, larger datasets with multicenter cohorts is imperative to establish generalizability and clinical applicability. Given these limitations, this nomogram-based risk-scoring tool should currently be regarded as a proof-of-concept that requires further validation before clinical application.
Additionally, MCI is a heterogeneous clinical entity with a complex trajectory, orchestrated by demographic, health-related, and biological factors, so that some progress to dementia, others remain stable or revert to normal (Aerts et al., 2017). Modifiable risk factors such as smoking, obesity, depression, and excessive alcohol consumption have a significant role in dementia prediction and the management process (Blotenberg et al., 2025). This model has not incorporated these modifiable risk factors. Integrating such factors may substantially enhance predictive accuracy for stratifying MCI into progressor and non-progressor phenotypes. Hence, longitudinal studies are warranted to determine potential predictors of MCI progression.
Furthermore, although MMSE has demonstrated a sensitivity of 60% and a specificity of 80–87% (Tariq et al., 2006; Kaufer et al., 2008; Saxton et al., 2009), relying on a single global screening tool may therefore lead to misclassification bias. Thus, comprehensive domain-specific cognitive assessments, including a thorough history and functional assessment, and conventional diagnostic clinical criteria, are important to increase accuracy (Petersen, 2016; McCarten, 2013; Markwick et al., 2012).
5 Conclusion
The study developed a simplified diagnostic prediction model that utilizes an intuitive nomogram scoring system, integrating both retinal features and visual function parameters. The model demonstrated relatively good performance and net benefit across all ranges of threshold probabilities, which might complement visual and neurovascular evidence with cognitive tests. Using a well-validated model trained on a large dataset, in conjunction with cognitive tests, might support early detection of MCI in the ophthalmic setting. Thus, further external validation is essential prior to clinical application and generalization.
Data availability statement
The original contributions presented in the study are included in the article/supplementary material, further inquiries can be directed to the corresponding authors.
Ethics statement
The study involved humans subjecs, and ethical approval was received from the Institutional Review Board of The Hong Kong Polytechnic University (approval number: HSEARS20190326002). The procedures were performed adhering to the tenet of the 1964 Declaration of Helsinki and its later amendments. The study was conducted in accordance with the local legislation and institutional requirements. The participants provided their written informed consent to participate in this study.
Author contributions
MH: Conceptualization, Methodology, Writing – original draft, Writing – review & editing. BL: Methodology, Writing – review & editing. WG: Methodology, Software, Writing – review & editing. LZ: Methodology, Supervision, Writing – review & editing. KC: Funding acquisition, Investigation, Methodology, Supervision, Validation, Writing – review & editing. HC: Conceptualization, Funding acquisition, Project administration, Resources, Supervision, Validation, Writing – original draft, Writing – review & editing.
Funding
The author(s) declare that financial support was received for the research and/or publication of this article. This work was supported by the General Research Fund (PolyU 151001/17M) and the Research Impact Fund (PolyU R5006-21) from the Research Grants Council of the Hong Kong Special Administrative Region, China.
Acknowledgments
The authors would like to acknowledge the support from the Jockey Club Design Institute for Social Innovation, The Hong Kong Polytechnic University.
Conflict of interest
The authors declare that the research was conducted in the absence of any commercial or financial relationships that could be construed as a potential conflict of interest.
Generative AI statement
The authors declare that no Gen AI was used in the creation of this manuscript.
Any alternative text (alt text) provided alongside figures in this article has been generated by Frontiers with the support of artificial intelligence and reasonable efforts have been made to ensure accuracy, including review by the authors wherever possible. If you identify any issues, please contact us.
Publisher’s note
All claims expressed in this article are solely those of the authors and do not necessarily represent those of their affiliated organizations, or those of the publisher, the editors and the reviewers. Any product that may be evaluated in this article, or claim that may be made by its manufacturer, is not guaranteed or endorsed by the publisher.
Footnotes
References
Aerts, L., Heffernan, M., Kochan, N. A., Crawford, J. D., Draper, B., Trollor, J. N., et al. (2017). Effects of MCI subtype and reversion on progression to dementia in a community sample. Neurology 88, 2225–2232. doi: 10.1212/wnl.0000000000004015
Ahmad, A., Patel, V., Xiao, J., and Khan, M. M. (2020). The role of neurovascular system in neurodegenerative diseases. Mol. Neurobiol. 57, 4373–4393. doi: 10.1007/s12035-020-02023-z
Almeida, A. L. M., Pires, L. A., Figueiredo, E. A., Costa-Cunha, L. V. F., Zacharias, L. C., Preti, R. C., et al. (2019). Correlation between cognitive impairment and retinal neural loss assessed by swept-source optical coherence tomography in patients with mild cognitive impairment. Alzheimers Dement 11, 659–669. doi: 10.1016/j.dadm.2019.08.006
Bai, W., Chen, P., Cai, H., Zhang, Q., Su, Z., Cheung, T., et al. (2022). Worldwide prevalence of mild cognitive impairment among community dwellers aged 50 years and older: a meta-analysis and systematic review of epidemiology studies. Age Ageing 51:173. doi: 10.1093/ageing/afac173
Baik, K., Kang, M., Park, Y. J., Chung, S. J., Oh, K., Koh, S. B., et al. (2025). Twelve-year nationwide cohort study identifying risk factors for conversion from mild cognitive impairment to Alzheimer’s disease. Sci. Rep. 15:35418. doi: 10.1038/s41598-025-16620-2
Beason-Held, L. L., Goh, J. O., An, Y., Kraut, M. A., O'Brien, R. J., Ferrucci, L., et al. (2013). Changes in brain function occur years before the onset of cognitive impairment. J. Neurosci. 33, 18008–18014. doi: 10.1523/JNEUROSCI.1402-13.2013
Blotenberg, I., Wittström, F., Michalowsky, B., Platen, M., Wucherer, D., Teipel, S., et al. (2025). Modifiable risk factors and symptom progression in dementia over up to 8 years-results of the DelpHi-MV trial. Alzheimers Dement 17:e70050. doi: 10.1002/dad2.70050
Bucci, M., Chiotis, K., and Nordberg, A.for the Alzheimer’s Disease Neuroimaging Initiative (2021). Alzheimer’s disease profiled by fluid and imaging markers: tau PET best predicts cognitive decline. Mol. Psychiatry 26, 5888–5898. doi: 10.1038/s41380-021-01263-2
Cabrera DeBuc, D., Somfai, G. M., Arthur, E., Kostic, M., Oropesa, S., and Mendoza Santiesteban, C. (2018). Investigating multimodal diagnostic eye biomarkers of cognitive impairment by measuring vascular and neurogenic changes in the retina. Front. Physiol. 9:1721. doi: 10.3389/fphys.2018.01721
Chen, P., Cai, H., Bai, W., Su, Z., Tang, Y. L., Ungvari, G. S., et al. (2023). Global prevalence of mild cognitive impairment among older adults living in nursing homes: a meta-analysis and systematic review of epidemiological surveys. Transl. Psychiatry 13:88. doi: 10.1038/s41398-023-02361-1
Chen, J., Li, L., Chen, T., Yang, X., Ru, H., Li, X., et al. (2022). Predicting the risk of active pulmonary tuberculosis in people living with HIV: development and validation of a nomogram. BMC Infect. Dis. 22:388. doi: 10.1186/s12879-022-07368-5
Chen, S., Zhang, D., Zheng, H., Cao, T., Xia, K., Su, M., et al. (2023). The association between retina thinning and hippocampal atrophy in Alzheimer's disease and mild cognitive impairment: a meta-analysis and systematic review. Front. Aging Neurosci. 15:1232941. doi: 10.3389/fnagi.2023.1232941
Chiu, H. F., Lee, H., Chung, W., and Kwong, P. (1994). Reliability and validity of the Cantonese version of mini-mental state examination. East Asian Arch. Psychiatr. 4:25.
Chowdhury, M. Z. I., and Turin, T. C. (2020). Variable selection strategies and its importance in clinical prediction modelling. Fam Med Community Health. 8:e000262. doi: 10.1136/fmch-2019-000262
Chua, J., Hu, Q., Ke, M., Tan, B., Hong, J., Yao, X., et al. (2020). Retinal microvasculature dysfunction is associated with Alzheimer's disease and mild cognitive impairment. Alzheimer's Res Ther 12:161. doi: 10.1186/s13195-020-00724-0
Collins, G. S., Reitsma, J. B., Altman, D. G., and Moons, K. G. M. (2015). Transparent reporting of a multivariable prediction model for individual prognosis or diagnosis (TRIPOD): the TRIPOD statement. Br. J. Cancer 112, 251–259. doi: 10.1038/bjc.2014.639
Criscuolo, C., Cennamo, G., Montorio, D., Carotenuto, A., Strianese, A., Salvatore, E., et al. (2020). Assessment of retinal vascular network in amnestic mild cognitive impairment by optical coherence tomography angiography. PLoS One 15:e0233975. doi: 10.1371/journal.pone.0233975
Cunha, L. P., Lopes, L. C., Costa-Cunha, L. V. F., Costa, C. F., Pires, L. A., Almeida, A. L. M., et al. (2016). Macular thickness measurements with frequency domain-OCT for quantification of retinal neural loss and its correlation with cognitive impairment in Alzheimer's disease. PLoS One 11:e0153830. doi: 10.1371/journal.pone.0153830
Cunha, J. P., Proença, R., Dias-Santos, A., Almeida, R., Águas, H., Alves, M., et al. (2017). OCT in Alzheimer's disease: thinning of the RNFL and superior hemiretina. Graefes Arch. Clin. Exp. Ophthalmol. 255, 1827–1835. doi: 10.1007/s00417-017-3715-9
Dougherty, B. E., Flom, R. E., and Bullimore, M. A. (2005). An evaluation of the Mars letter contrast sensitivity test. Optom. Vis. Sci. 82, 970–975. doi: 10.1097/01.opx.0000187844.27025.ea
Elvira-Hurtado, L., López-Cuenca, I., de Hoz, R., Salas, M., Sánchez-Puebla, L., Ramírez-Toraño, F., et al. (2023). Alzheimer's disease: a continuum with visual involvements. Front. Psychol. 14:1124830. doi: 10.3389/fpsyg.2023.1124830
Fang, M., Strand, K., Zhang, J., Totillo, M., Signorile, J. F., Galvin, J. E., et al. (2021). Retinal vessel density correlates with cognitive function in older adults. Exp. Gerontol. 152:111433. doi: 10.1016/j.exger.2021.111433
Feng, J., Huang, C., Liang, L., Li, C., Wang, X., Ma, J., et al. (2023). The association between eye disease and incidence of dementia: systematic review and Meta-analysis. J. Am. Med. Dir. Assoc. 24, 1363–1373.e6. doi: 10.1016/j.jamda.2023.06.025
Gao, H., Zhao, S., Zheng, G., Wang, X., Zhao, R., Pan, Z., et al. (2023). Using a dual-stream attention neural network to characterize mild cognitive impairment based on retinal images. Comput. Biol. Med. 166:107411. doi: 10.1016/j.compbiomed.2023.107411
Ge, Y.-J., Xu, W., Ou, Y. N., Qu, Y., Ma, Y. H., Huang, Y. Y., et al. (2021). Retinal biomarkers in Alzheimer’s disease and mild cognitive impairment: a systematic review and meta-analysis. Ageing Res. Rev. 69:101361. doi: 10.1016/j.arr.2021.101361
Giménez Castejón, D., Dudekova, M., Gómez Gallego, M., and Lajara Blesa, J. (2016). Macular thickness in subjective memory complaints and mild cognitive impairment: a non-invasive biomarker. Neuroophthalmology. 40, 16–22. doi: 10.3109/01658107.2015.1118516
Guest, C. S., Lee, S. E., Ferguson, M. P., Urquhart, N. L., and Taylor, H. R. (1993). Demographic characteristics of ophthalmic outpatients at the Royal Victorian eye and ear hospital. Aust. N. Z. J. Ophthalmol. 21:284. doi: 10.1111/j.1442-9071.1993.tb00976.x
Hao, J., Kwapong, W. R., Shen, T., Fu, H., Xu, Y., Lu, Q., et al. (2024). Early detection of dementia through retinal imaging and trustworthy AI. NPJ Digit Med. 7:294. doi: 10.1038/s41746-024-01292-5
Hao, X., Zhang, W., Jiao, B., Yang, Q., Zhang, X., Chen, R., et al. (2023). Correlation between retinal structure and brain multimodal magnetic resonance imaging in patients with Alzheimer's disease. Front. Aging Neurosci. 15:1088829. doi: 10.3389/fnagi.2023.1088829
Hu, Z., Wang, L., Zhu, D., Qin, R., Sheng, X., Ke, Z., et al. (2023). Retinal alterations as potential biomarkers of structural brain changes in Alzheimer's disease Spectrum patients. Brain Sci. 13:460. doi: 10.3390/brainsci13030460
Ito, Y., Sasaki, M., Takahashi, H., Nozaki, S., Matsuguma, S., Motomura, K., et al. (2020). Quantitative assessment of the retina using OCT and associations with cognitive function. Ophthalmology 127, 107–118. doi: 10.1016/j.ophtha.2019.05.021
Jalali, A., Alvarez-Iglesias, A., Roshan, D., and Newell, J. (2019). Visualising statistical models using dynamic nomograms. PLoS One 14:e0225253. doi: 10.1371/journal.pone.0225253
Jiang, C., Wang, Y., Dong, Y., Liu, R., Song, L., Wang, S., et al. (2023). Associations of microvascular dysfunction with mild cognitive impairment and cognitive function among rural-dwelling older adults in China. J Alzheimer's Dis 93, 1111–1124. doi: 10.3233/jad-221242
Jiang, H., Wei, Y., Shi, Y., Wright, C. B., Sun, X., Gregori, G., et al. (2018). Altered macular microvasculature in mild cognitive impairment and Alzheimer disease. J. Neuroophthalmol. 38, 292–298. doi: 10.1097/wno.0000000000000580
Kao, C. C., Hsieh, H. M., Chang, Y. C., Chu, H. C., Yang, Y. H., and Sheu, S. J. (2023). Optical coherence tomography assessment of macular thickness in Alzheimer's dementia with different neuropsychological severities. J Pers Med. 13:1118. doi: 10.3390/jpm13071118
Kaufer, D. I., Williams, C. S., Braaten, A. J., Gill, K., Zimmerman, S., and Sloane, P. D. (2008). Cognitive screening for dementia and mild cognitive impairment in assisted living: comparison of 3 tests. J. Am. Med. Dir. Assoc. 9, 586–593. doi: 10.1016/j.jamda.2008.05.006
Kim, J. I., and Kang, B. H. (2019). Decreased retinal thickness in patients with Alzheimer's disease is correlated with disease severity. PLoS One 14:e0224180. doi: 10.1371/journal.pone.0224180
Kisler, K., Nelson, A. R., Montagne, A., and Zlokovic, B. V. (2017). Cerebral blood flow regulation and neurovascular dysfunction in Alzheimer disease. Nat. Rev. Neurosci. 18, 419–434. doi: 10.1038/nrn.2017.48
Koronyo, Y., Biggs, D., Barron, E., Boyer, D. S., Pearlman, J. A., Au, W. J., et al. (2017). Retinal amyloid pathology and proof-of-concept imaging trial in Alzheimer's disease. JCI Insight 2:3621. doi: 10.1172/jci.insight.93621
Koronyo-Hamaoui, M., Koronyo, Y., Ljubimov, A. V., Miller, C. A., Ko, M. H. K., Black, K. L., et al. (2011). Identification of amyloid plaques in retinas from Alzheimer's patients and noninvasive in vivo optical imaging of retinal plaques in a mouse model. NeuroImage 54, S204–S217. doi: 10.1016/j.neuroimage.2010.06.020
Lamb, T. D., Collin, S. P., and Pugh, E. N. (2007). Evolution of the vertebrate eye: opsins, photoreceptors, retina and eye cup. Nat. Rev. Neurosci. 8, 960–976. doi: 10.1038/nrn2283
Laotaweerungsawat, S., Psaras, C., Liu, X., and Stewart, J. M. (2020). OCT angiography assessment of retinal microvascular changes in diabetic eyes in an urban safety-net hospital. Ophthalmol Retina. 4, 425–432. doi: 10.1016/j.oret.2019.11.008
Lee, G.-I., Chi, S. A., Kim, K., Seo, S. W., Kim, H. J., Chung, T. Y., et al. (2021). Visual impairment increases the risk of dementia, especially in young males in a 12-year longitudinal follow-up study of a national cohort. Sci. Rep. 11:11393. doi: 10.1038/s41598-021-91026-4
Lee, S., Jiang, K., McIlmoyle, B., To, E., Xu, Q. A., Hirsch-Reinshagen, V., et al. (2020). Amyloid Beta Immunoreactivity in the retinal ganglion cell layer of the Alzheimer's eye. Front. Neurosci. 14:758. doi: 10.3389/fnins.2020.00758
Li, J., Zeng, Q., Luo, X., Li, K., Liu, X., Hong, L., et al. (2023). Decoupling of regional cerebral blood flow and brain function along the Alzheimer's disease continuum. J Alzheimer's Dis 95, 287–298. doi: 10.3233/jad-230503
Liu, Y., Wang, Y., and Zhang, W. (2022). Scoring system and a simple nomogram for predicting radioiodine refractory differentiated thyroid cancer: a retrospective study. EJNMMI Res. 12:45. doi: 10.1186/s13550-022-00917-8
London, A., Benhar, I., and Schwartz, M. (2013). The retina as a window to the brain-from eye research to CNS disorders. Nat. Rev. Neurol. 9, 44–53. doi: 10.1038/nrneurol.2012.227
Ma, X., Xie, Z., Wang, H., Tian, Z., Bi, Y., Li, Y., et al. (2023). A cross-sectional study of retinal vessel changes based on optical coherence tomography angiography in Alzheimer's disease and mild cognitive impairment. Front. Aging Neurosci. 15:1101950. doi: 10.3389/fnagi.2023.1101950
Markwick, A., Zamboni, G., and de Jager, C. A. (2012). Profiles of cognitive subtest impairment in the Montreal cognitive assessment (MoCA) in a research cohort with normal Mini-mental state examination (MMSE) scores. J. Clin. Exp. Neuropsychol. 34, 750–757. doi: 10.1080/13803395.2012.672966
McCarten, J. R. (2013). Clinical evaluation of early cognitive symptoms. Clin. Geriatr. Med. 29, 791–807. doi: 10.1016/j.cger.2013.07.005
McGirr, A., Nathan, S., Ghahremani, M., Gill, S., Smith, E. E., and Ismail, Z. (2022). Progression to dementia or reversion to Normal cognition in mild cognitive impairment as a function of late-onset neuropsychiatric symptoms. Neurology 98, e2132–e2139. doi: 10.1212/wnl.0000000000200256
Mei, X., Qiu, C., Zhou, Q., Chen, Z., Chen, Y., Xu, Z., et al. (2021). Changes in retinal multilayer thickness and vascular network of patients with Alzheimer's disease. Biomed. Eng. Online 20:97. doi: 10.1186/s12938-021-00931-2
Mendes, A. J., Ribaldi, F., Lathuiliere, A., Ashton, N. J., Zetterberg, H., Abramowicz, M., et al. (2024). Comparison of plasma and neuroimaging biomarkers to predict cognitive decline in non-demented memory clinic patients. Alzheimer's Res Ther 16:110. doi: 10.1186/s13195-024-01478-9
Nelson, A. R., Sweeney, M. D., Sagare, A. P., and Zlokovic, B. V. (2016). Neurovascular dysfunction and neurodegeneration in dementia and Alzheimer's disease. Biochim. Biophys. Acta 1862, 887–900. doi: 10.1016/j.bbadis.2015.12.016
Ottoy, J., Niemantsverdriet, E., Verhaeghe, J., de Roeck, E., Struyfs, H., Somers, C., et al. (2019). Association of short-term cognitive decline and MCI-to-AD dementia conversion with CSF, MRI, amyloid- and 18F-FDG-PET imaging. NeuroImage: Clinical. 22:101771. doi: 10.1016/j.nicl.2019.101771
Peduzzi, P., Concato, J., Kemper, E., Holford, T. R., and Feinstein, A. R. (1996). A simulation study of the number of events per variable in logistic regression analysis. J. Clin. Epidemiol. 49, 1373–1379. doi: 10.1016/s0895-4356(96)00236-3
Petersen, R. C. (2016). Mild cognitive impairment. Continuum 22, 404–418. doi: 10.1212/con.0000000000000313
Ranstam, J., and Cook, J. A. (2018). LASSO regression. Br. J. Surg. 105, 1348–1348. doi: 10.1002/bjs.10895
Reuter-Lorenz, P. A., and Park, D. C. (2014). How does it STAC up? Revisiting the scaffolding theory of aging and cognition. Neuropsychol. Rev. 24, 355–370. doi: 10.1007/s11065-014-9270-9
Riley, R. D., Ensor, J., Snell, K. I. E., Harrell, F. E., Martin, G. P., Reitsma, J. B., et al. (2020). Calculating the sample size required for developing a clinical prediction model. BMJ 368:m441. doi: 10.1136/bmj.m441
Riley, R. D., Snell, K. I. E., Ensor, J., Burke, D. L., Harrell, F. E., Moons, K. G. M., et al. (2019). Minimum sample size for developing a multivariable prediction model: part I – continuous outcomes. Stat. Med. 38, 1262–1275. doi: 10.1002/sim.7993
Risacher, S. L., WuDunn, D., Pepin, S. M., MaGee, T. R., McDonald, B. C., Flashman, L. A., et al. (2013). Visual contrast sensitivity in Alzheimer's disease, mild cognitive impairment, and older adults with cognitive complaints. Neurobiol. Aging 34, 1133–1144. doi: 10.1016/j.neurobiolaging.2012.08.007
Risacher, S. L., WuDunn, D., Tallman, E. F., West, J. D., Gao, S., Farlow, M. R., et al. (2020). Visual contrast sensitivity is associated with the presence of cerebral amyloid and tau deposition. Brain Commun. 2:fcaa019. doi: 10.1093/braincomms/fcaa019
Robbins, C. B., Akrobetu, D., Ma, J. P., Stinnett, S. S., Soundararajan, S., Liu, A. J., et al. (2022). Assessment of retinal microvascular alterations in individuals with amnestic and NONAMNESTIC mild cognitive impairment using optical coherence tomography angiography. Retina 42, 1338–1346. doi: 10.1097/IAE.0000000000003458
Roberts, R. O., Knopman, D. S., Mielke, M. M., Cha, R. H., Pankratz, V. S., Christianson, T. J. H., et al. (2014). Higher risk of progression to dementia in mild cognitive impairment cases who revert to normal. Neurology 82, 317–325. doi: 10.1212/wnl.0000000000000055
Rodrigues, E. A., and Moreno, S. (2023). Conceptualizing healthy cognitive aging: the role of time and variability. Front. Hum. Neurosci. 17:1240630. doi: 10.3389/fnhum.2023.1240630
Rosenberg, A., Solomon, A., Jelic, V., Hagman, G., Bogdanovic, N., and Kivipelto, M. (2019). Progression to dementia in memory clinic patients with mild cognitive impairment and normal β-amyloid. Alzheimer's Res Ther 11:99. doi: 10.1186/s13195-019-0557-1
Royston, P., Moons, K. G. M., Altman, D. G., and Vergouwe, Y. (2009). Prognosis and prognostic research: developing a prognostic model. BMJ 338:b604. doi: 10.1136/bmj.b604
Salari, N., Lotfi, F., Abdolmaleki, A., Heidarian, P., Rasoulpoor, S., Fazeli, J., et al. (2025). The global prevalence of mild cognitive impairment in geriatric population with emphasis on influential factors: a systematic review and meta-analysis. BMC Geriatr. 25:313. doi: 10.1186/s12877-025-05967-w
Salis, F., Costaggiu, D., and Mandas, A. (2023). Mini-mental state examination: optimal cut-off levels for mild and severe cognitive impairment. Geriatrics (Basel) 8:12. doi: 10.3390/geriatrics8010012
Salobrar-García, E., de Hoz, R., Ramírez, A. I., López-Cuenca, I., Rojas, P., Vazirani, R., et al. (2019). Changes in visual function and retinal structure in the progression of Alzheimer's disease. PLoS One 14:e0220535. doi: 10.1371/journal.pone.0220535
Samara, W. A., Shahlaee, A., Adam, M. K., Khan, M. A., Chiang, A., Maguire, J. I., et al. (2017). Quantification of diabetic macular ischemia using optical coherence tomography angiography and its relationship with visual acuity. Ophthalmology 124, 235–244. doi: 10.1016/j.ophtha.2016.10.008
Sánchez, D., Castilla-Marti, M., Marquié, M., Valero, S., Moreno-Grau, S., Rodríguez-Gómez, O., et al. (2020). Evaluation of macular thickness and volume tested by optical coherence tomography as biomarkers for Alzheimer's disease in a memory clinic. Sci. Rep. 10:1580. doi: 10.1038/s41598-020-58399-4
Saxton, J., Morrow, L., Eschman, A., Archer, G., Luther, J., and Zuccolotto, A. (2009). Computer assessment of mild cognitive impairment. Postgrad. Med. 121, 177–185. doi: 10.3810/pgm.2009.03.1990
Shabir, O., Berwick, J., and Francis, S. E. (2018). Neurovascular dysfunction in vascular dementia, Alzheimer's and atherosclerosis. BMC Neurosci. 19:62. doi: 10.1186/s12868-018-0465-5
Shang, X., Zhu, Z., Huang, Y., Zhang, X., Wang, W., Shi, D., et al. (2023). Associations of ophthalmic and systemic conditions with incident dementia in the UK biobank. Br. J. Ophthalmol. 107, 275–282. doi: 10.1136/bjophthalmol-2021-319508
Shang, X., Zhu, Z., Wang, W., Ha, J., and He, M. (2021). The association between vision impairment and incidence of dementia and cognitive impairment: a systematic review and meta-analysis. Ophthalmology 128, 1135–1149. doi: 10.1016/j.ophtha.2020.12.029
Shi, X. H., Ju, L., Dong, L., Zhang, R. H., Shao, L., Yan, Y. N., et al. (2024). Deep learning models for the screening of cognitive impairment using multimodal fundus images. Ophthalmol. Retina 8, 666–677. doi: 10.1016/j.oret.2024.01.019
Shi, H., Koronyo, Y., Fuchs, D.‐. T., Sheyn, J., Jallow, O., Mandalia, K., et al. (2023). Retinal arterial Aβ40 deposition is linked with tight junction loss and cerebral amyloid angiopathy in MCI and AD patients. Alzheimers Dement. 19, 5185–5197. doi: 10.1002/alz.13086
Smith, R., Cullen, N. C., Pichet Binette, A., Leuzy, A., Blennow, K., Zetterberg, H., et al. (2023). Tau-PET is superior to phospho-tau when predicting cognitive decline in symptomatic AD patients. Alzheimers Dement. 19, 2497–2507. doi: 10.1002/alz.12875
Son, K. Y., Choi, Y. J., Kim, B., Han, K., Hwang, S., Jung, W., et al. (2025). Association between age-related macular degeneration with visual disability and risk of dementia: a Nationwide cohort study. J. Am. Med. Dir. Assoc. 26:105392. doi: 10.1016/j.jamda.2024.105392
Song, W. X., Wu, W. W., Zhao, Y. Y., Xu, H. L., Chen, G. C., Jin, S. Y., et al. (2023). Evidence from a meta-analysis and systematic review reveals the global prevalence of mild cognitive impairment. Front. Aging Neurosci. 15:1227112. doi: 10.3389/fnagi.2023.1227112
Stiell, I. G., and Wells, G. A. (1999). Methodologic standards for the development of clinical decision rules in emergency medicine. Ann. Emerg. Med. 33, 437–447. doi: 10.1016/s0196-0644(99)70309-4
Szegedi, S., Dal-Bianco, P., Stögmann, E., Traub-Weidinger, T., Rainer, M., Masching, A., et al. (2020). Anatomical and functional changes in the retina in patients with Alzheimer's disease and mild cognitive impairment. Acta Ophthalmol. 98, e914–e921. doi: 10.1111/aos.14419
Tao, R., Lu, Z., Ding, D., Fu, S., Hong, Z., Liang, X., et al. (2019). Perifovea retinal thickness as an ophthalmic biomarker for mild cognitive impairment and early Alzheimer's disease. Alzheimers Dement 11, 405–414. doi: 10.1016/j.dadm.2019.04.003
Tariq, S. H., Tumosa, N., Chibnall, J. T., Perry, M. H., and Morley, J. E. (2006). Comparison of the Saint Louis university mental status examination and the mini-mental state examination for detecting dementia and mild neurocognitive disorder--a pilot study. Am. J. Geriatr. Psychiatry 14, 900–910. doi: 10.1097/01.Jgp.0000221510.33817.86
Tifratene, K., Robert, P., Metelkina, A., Pradier, C., and Dartigues, J. F. (2015). Progression of mild cognitive impairment to dementia due to AD in clinical settings. Neurology 85, 331–338. doi: 10.1212/wnl.0000000000001788
Vernerey, D., Huguet, F., Vienot, A., Goldstein, D., Paget-Bailly, S., van Laethem, J. L., et al. (2016). Prognostic nomogram and score to predict overall survival in locally advanced untreated pancreatic cancer (PROLAP). Br. J. Cancer 115, 281–289. doi: 10.1038/bjc.2016.212
Vickers, A. J. (2008). Decision analysis for the evaluation of diagnostic tests, prediction models and molecular markers. Am. Stat. 62, 314–320. doi: 10.1198/000313008x370302
Vidal, K. S. M., Decleva, D., Barboni, M. T. S., Nagy, B. V., de Menezes, P. A. H., Aher, A., et al. (2022). The association between acquired color deficiency and PET imaging of neurodegeneration in mild cognitive impairment and Alzheimer disease. Invest. Ophthalmol. Vis. Sci. 63:20. doi: 10.1167/iovs.63.5.20
Vittinghoff, E., and McCulloch, C. E. (2007). Relaxing the rule of ten events per variable in logistic and cox regression. Am. J. Epidemiol. 165, 710–718. doi: 10.1093/aje/kwk052
Wang, X., Zhao, Q., Tao, R., Lu, H., Xiao, Z., Zheng, L., et al. (2020). Decreased retinal vascular density in Alzheimer's disease (AD) and mild cognitive impairment (MCI): An optical coherence tomography angiography (OCTA) study. Front. Aging Neurosci. 12:572484. doi: 10.3389/fnagi.2020.572484
White, K. M., Livnat, I., Frambach, C. R., Doan, J., Mehta, U. V., Yuh, C., et al. (2023). Quantitative cone contrast threshold testing in patients with differing pathophysiological mechanisms causing retinal diseases. Int J Retina Vitreous. 9:9. doi: 10.1186/s40942-023-00442-3
Wisely, C. E., Richardson, A., Henao, R., Robbins, C. B., Ma, J. P., Wang, D., et al. (2024). A convolutional neural network using multimodal retinal imaging for differentiation of mild cognitive impairment from normal cognition. Ophthalmol. Sci. 4:100355. doi: 10.1016/j.xops.2023.100355
Wong, M. N. K., Lai, D. W. L., Chan, H. H. L., and Lam, B. Y. H. (2021). Neural and retinal characteristics in relation to working memory in older adults with mild cognitive impairment. Curr. Alzheimer Res. 18, 185–195. doi: 10.2174/1567205018666210608114044
Yan, Y., Wu, X., Wang, X., Geng, Z., Wang, L., Xiao, G., et al. (2021). The retinal vessel density can reflect cognitive function in patients with Alzheimer's disease: evidence from optical coherence tomography angiography. J Alzheimer's Dis 79, 1307–1316. doi: 10.3233/jad-200971
Yoon, S. P., Grewal, D. S., Thompson, A. C., Polascik, B. W., Dunn, C., Burke, J. R., et al. (2019). Retinal microvascular and neurodegenerative changes in Alzheimer's disease and mild cognitive impairment compared with control participants. Ophthalmol Retina. 3, 489–499. doi: 10.1016/j.oret.2019.02.002
Yu, X., Ji, C., and Shao, A. (2020). Neurovascular unit dysfunction and neurodegenerative disorders. Front. Neurosci. 14:334. doi: 10.3389/fnins.2020.00334
Yu, H.-H., Tan, L., Jiao, M. J., Lv, Y. J., Zhang, X. H., Tan, C. C., et al. (2025). Dissecting the clinical and pathological prognosis of MCI patients who reverted to normal cognition: a longitudinal study. BMC Med. 23:260. doi: 10.1186/s12916-025-04092-0
Zhang, Q., Li, J., Bian, M., He, Q., Shen, Y., Lan, Y., et al. (2021). Retinal imaging techniques based on machine learning models in recognition and prediction of mild cognitive impairment. Neuropsychiatr. Dis. Treat. 17, 3267–3281. doi: 10.2147/ndt.S333833
Keywords: mild cognitive impairment, ocular biomarkers, risk scoring, dynamic nomogram, early detection
Citation: Hussen MS, Lam BY-H, Gao W, Zhou L, Choi KY and Chan HH-L (2025) Early detection of mild cognitive impairment utilizing ocular biomarker-based risk scoring nomogram. Front. Aging Neurosci. 17:1669948. doi: 10.3389/fnagi.2025.1669948
Edited by:
Eleni Konsolaki, American College of Greece, GreeceReviewed by:
Paul E. Alele, Mbarara University of Science and Technology, UgandaIoanna Spentza, American College of Greece, Greece
Copyright © 2025 Hussen, Lam, Gao, Zhou, Choi and Chan. This is an open-access article distributed under the terms of the Creative Commons Attribution License (CC BY). The use, distribution or reproduction in other forums is permitted, provided the original author(s) and the copyright owner(s) are credited and that the original publication in this journal is cited, in accordance with accepted academic practice. No use, distribution or reproduction is permitted which does not comply with these terms.
*Correspondence: Henry Ho-lung Chan, aGVucnlobC5jaGFuQHBvbHl1LmVkdS5oaw==; Kai Yip Choi, a2FpeWlwLmNob2lAcG9seXUuZWR1Lmhr