 Meijuan Shi
 Youmin Guo2
 Chenwang Jin
 Cong Shen
- 1Department of Radiology, The Second Affiliated Hospital of Xi’an Jiaotong University, Xi’an, Shaanxi, China
- 2Department of PET/CT, The First Affiliated Hospital of Xi’an Jiaotong University, Xi’an, Shaanxi, China
Objectives: This study aims to investigate age-related alterations of lung structure.
Methods: We retrospectively collected 928 male subjects from an annual lung nodule screening cohort. The quantitative parameters included lung volume (LV), mean lesion density (MLD), emphysema indexes (LAA-910, LAA-910%, LAA-950 and LAA-950%), number of bronchi (NB) and volume of bronchi (VB), as well as ratio of airway to the lung (ALR). The quantitative parameters were calculated for total lung, right lung, left lung, and the individual lobes.
Results: LV and VB peaked in the group of 51–60 years-old and 61–70 years-old, respectively. MLD decreased with age, while LAA-910, LAA-950, LAA-910%, LAA-950%, and ALR all showed an increasing trend with age. LV, NB, and VB of the right lung were larger than those of the left lung, while MLD, LAA-950, LAA-950%, and ALR of the right lung were lower than those of the left lung (P < 0.05). The LV of bilateral upper lobes increased with age, while a decline of LV of bilateral lower lobes was observed since the sixties. The MLD of the bilateral lower lobes decreased (P < 0.05). The LAA-910%, LAA-950%, and ALR of the 71–80 years-old in all five lobes were higher than those of the other four groups (P < 0.05). LAA-950 and LAA-950% of bilateral lower lobes displayed a steeper increase began at 60 years old. We also provide a computational formula, LungAge Score, for the assessment of the structural lung aging features.
Conclusion: Lung aging is not a linear process, and the lung structural alterations in the upper and lower lobes exhibit significant heterogeneity.
1 Introduction
Evidence showed that chronic respiratory diseases (CRDs) are the third leading cause of death, responsible for 4.0 million deaths (95% uncertainty interval 3.6–4.3), with a prevalence of 454.6 million cases (417.4–499.1) globally (GBD, 2019 Chronic Respiratory Diseases Collaborators et al., 2023), which imposing a huge burden of death, disability and healthcare costs. Aging is one of the most important risk factors for CRDs, and the worldwide increase in life expectancy has been accompanied by an increase in the prevalence of age-related CRDs (Cho and Stout-Delgado, 2020; Schneider et al., 2021; Skloot, 2017). Thus, the study of age-related lung changes is imperative to preventing or ameliorating CRDs.
The normal aging process of the lungs is associated with structural and functional alterations (Miller, 2010). That means, the “healthy aging” individuals may suffer from age-related disease but retain their functional abilities. Previous studies have shown that the loss of elastic recoil, hyperinflation, air trapping, progressive enlargement of the alveolar ducts and distal alveoli, and an increase in residual volume are the main physiological manifestations in the aging lung (Bowdish, 2019; Kasmani et al., 2023). On one hand, the alterations of lung structure of normal aging may be partly responsible for the increased susceptibility of older persons to lung disorders, such as emphysema-predominant chronic obstructive pulmonary disease, fatal respiratory infection, interstitial lung diseases, and primary lung cancer (MacNee, 2016; Han et al., 2021). On the other hand, these overlaps put forward a challenge in the clinical management of CRDs. Thus, we need to analyze the changes in lung structure in the elderly.
Computer tomography (CT) is a practical and noninvasive method for evaluating lung structures (Jiao et al., 2024). Meanwhile, advanced image post-processing techniques enable the quantitative analysis of changes in lung and branches, which is helpful in understanding the normal aging process. Researchers in our team and other studies have proved the value of the quantitative biomarkers of emphysema, the airway, and air trapping (relative volume change of −860 Hounsfield Unit (HU) to −950 HU) in the clinical management of CRDs (Yin et al., 2019; Jiang et al., 2018; Shen et al., 2025; Shen et al., 2020; Kim et al., 2022; Tanabe et al., 2018). However, there are no studies available for the quantification of age-related changes in the lungs of the CRD-free cohort, which is essential for understanding normal aging.
Thus, we aimed to investigate age-related alterations in lung structure using a quantitative technique to assess lung tissue (lung volume, mean lung density), emphysema (LAA910, LA950), and the bronchial tree (the number of branches and the volume of branches) in a Chinese male cohort from a single institution. Meanwhile, we designed a comprehensive evaluation score, the LungAge score, to assess the physiological aging of lungs.
2 Materials and methods
2.1 Subjects
This was a post-hoc analysis of a prospective clinical trial, which was registered online (http://www.chictr.org/en/; registration number ChiCTR-OCH-14004934). The Ethics Committee of the Institutional Review Board approved this study (No. 2013-114–1). All participants were fully informed of the nature of the study and provided written informed consent for participation.
In this study, we included only males to avoid factors that contribute to sex-related differences (Terada et al., 2023; Silveyra et al., 2021). Chest CT images of 1,097 subjects were retrospectively collected from August 2017 to December 2019 from an annual lung nodule screening cohort. The inclusion criteria were: 1) male subjects who underwent a non-contrast chest CT scan; 2) age between 18 and 80 years old. The exclusion criteria were: 1) subjects with a congenital deformity of the spine or thorax (n = 25); 2) subjects who had a history of lung illness or any respiratory symptoms (n = 10); 3) subjects with a history of lobectomy or pneumonectomy (n = 10); 4) subjects with noticeable respiratory or motion artifact (n = 37); 5) subjects with apparent lesions in the CT scan, such as the diffused emphysema, bronchiectasis, interstitial lung abnormality, lobar consolidation, nodules or mass of the lung, active tuberculosis or tuberculosis involving multiple pulmonary lobes, lung atelectasis, interstitial lung diseases or pleura effusion, confirmed by a more than 5-year experienced chest radiologist (n = 83); and 6) subjects with severe heart, liver, and kidney dysfunction (n = 4).
Finally, 928 male subjects were included in the analysis. All subjects were grouped by age, with 10 years as an age group, including ≤40 years old (n = 56), 41–50 years old (n = 154), 51–60 years old (n = 297), 61–70 years old (n = 277), 71–80 years old (n = 144). Figure 1 illustrates a flowchart outlining the process for selecting and grouping participants.
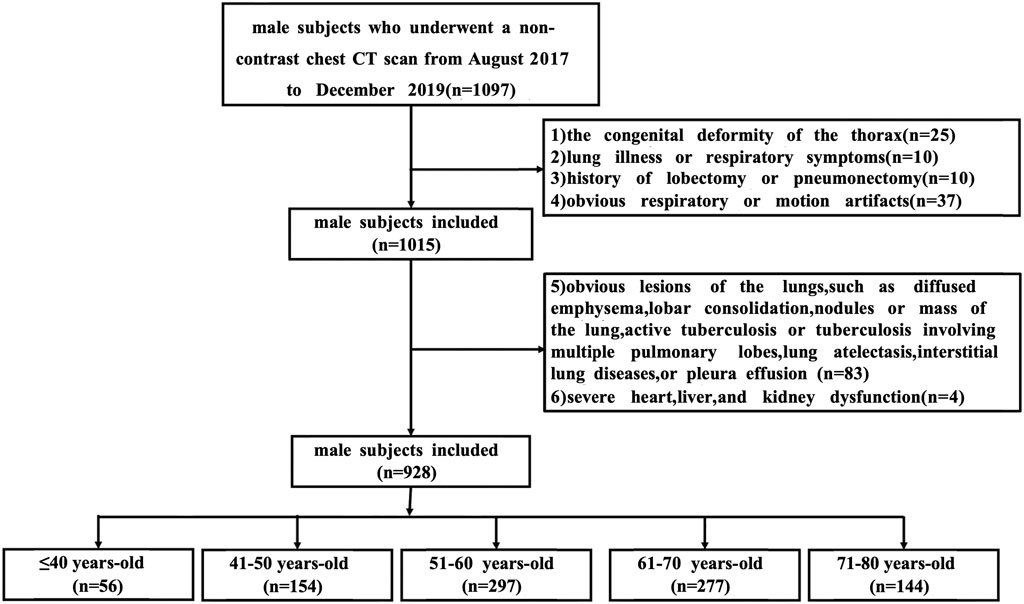
Figure 1. The workflow of subjects. Abbreviations: CT, computed tomography.
2.2 Chest CT scan
All CT scans were acquired with the same scanning and reconstruction conditions. CT scans were performed using a 64-MSCT scanner (Gemini TF PET/CT; Philips, Netherlands) from the apex to the base of the lungs at the end-inspiratory phase. An automatic current of 100–300 mAs (based on body weight) and a kilovoltage of 120 were used. Other scanning parameters were held constant: helical acquisition, gantry rotation time of 0.4 s, reconstructed section thickness of 1.25 mm, and reconstructed section interval of 1.25 mm. Images were reconstructed to encompass the entire lung field in a 512 × 512 pixel matrix using the full iterative reconstruction.
2.3 Quantitative assessment of the lung structure
Raw data were stored in Digital Imaging and Communications in Medicine format and then transferred to a lung structure analysis workflow to segment the lung field and airways.
Automated computerized schemes were used to obtain whole lung field from CT acquisitions. First, the entire lung was segmented using a three-dimensional adaptive border matching algorithm (Figure 2A) (Pu et al., 2009). Pulmonary fissures were detected using computational geometry, and the surfaces of individual lobes were demarcated by representing the pulmonary fissures as implicit surface functions (Figure 2B) (Pu et al., 2011). The results of the computerized segmentation were verified by visual inspection and manually corrected when the computer failed.
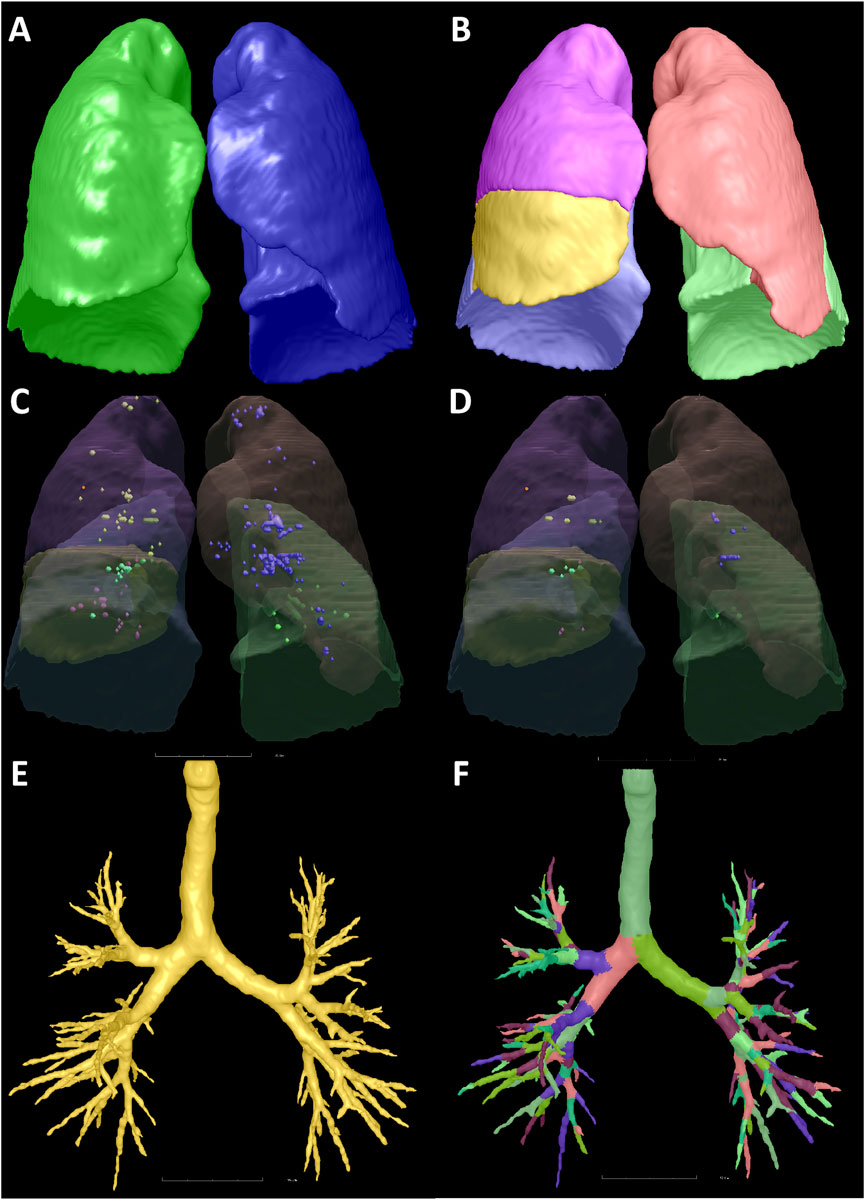
Figure 2. Illustration of the segmentation of the lung, lobes, emphysema, and bronchus. A 53-year-old male with no respiratory symptoms and no apparent abnormalities on the chest CT scan. The bilateral lungs (A), five lobes (B), LAA-910 (C), LAA-950 (D), and the bronchi (E,F) were segmented. The LV, LAA-910, LAA-950, MLD, NB, and VB of the total lung were 4562.38 mL, 12.61 mL, 1.73 mL, −770.18 HU, 177 and 77.14 mL, respectively. Abbreviations: CT, computed tomography; LV, lung volume; LAA-910, lower attenuation area than −910 Hounsfield unit; LAA-950, lower attenuation area than −950 Hounsfield unit; MLD, mean lung density; NB, number of bronchi; VB, volume of bronchi.
Lung volume (LV) of the total lung (TL), right lung (RL), left lung (LL) and five lobes (right upper lobe (RUL), right middle lobe (RML), right lower lobe (RLL), left upper lobe (LUL), and left lower lobe (LLL)) were computed using the segmentation results by counting the voxels circumscribed by the boundaries and multiplying by the volume (mL).
Emphysema was quantified using the percentage of low-attenuation areas below −910 HU (LAA-910) (Figure 2C) and below −950 HU (LAA-950) (Figure 2D). As LAA-910 and LAA-950 were two widely used emphysema metrics (San José Estépar et al., 2025; Yang et al., 2025; Koo et al., 2023). Mean lung density (MLD) is a general indicator of all the components in a given volume of lung, which includes the air, acini, small airways, arteries, veins, capillaries, and epithelial lining fluid. MLD can be quantified by the average density of all the voxels. The ratios of the LAA-910 to LV and LAA-950 to LV were recorded as LAA-910% and LAA-950%, respectively.
The airway tree is automatically recognized and extracted by a geometric algorithm (Pu et al., 2012). The number of bronchi (NB) and the volume of bronchi (VB) were also calculated for TL, RL, LL, and five lobes (Figures 2E,F).
The degree of mismatch between the airway and lung, an indicator of lung function in healthy subjects, is defined as the ratio of airway volume to lung volume (ALR) on a CT scan for TL, RL, LL, and five lobes (Maetani et al., 2023).
2.4 Statistical analysis
The following statistical analyses were conducted using IBM SPSS Statistics version 25.0 (IBM Corp., Armonk, NY, United States). Baseline characteristics and quantitative parameters of the lung structures were summarized by age group, using mean ± standard deviation (SD) for normally distributed variables and median (interquartile range) for skewed variables. For variables with a normal distribution, one-way analysis of variance (ANOVA) was used to assess differences among groups; for variables without a normal distribution, the Kruskal-Wallis test was applied. The least significant difference (LSD) for variables with equal variance or Tamhane’s T2 for variables with unequal variance was then used to compare the two groups. A paired t-test or paired samples Wilcoxon Signed-Rank test was used to evaluate the quantitative parameter differences between the right and left lung. The main structural lung changes between one age stage and the previous age stage were identified using binary logistic regression. A two-sided P-value less than 0.05 was considered statistically significant for all statistical analyses.
The following statistical analyses were conducted using the MATLAB (R2023a, The MathWorks, Inc.). A polynomial weighted least squares fitting method incorporating the RLOESS smoothing technique was fitted to visualize the changing trend of quantitative parameters throughout lung aging, where the weighting scheme is adaptively determined through an iterative robust estimation process.
The LungAge model was conducted using R language (version 4.0.5). The correlation analysis was used to initially select correlated parameters. Then, the generalized additive model (GAM), a flexible nonlinear model that extends the generalized linear model by replacing linear predictors with additive functions, was applied to select the most discriminative quantitative parameters. Then, a machine learning model method, eXtreme Gradient Boosting, was used to build a predictive model. Then, mean squared error (MSE), root mean squared error (RMSE), mean absolute error (MAE), and mean absolute percentage error (MAPE) were calculated to evaluate the model, and a 5-fold cross-validation was applied to test its performance by R2. Finally, the potential confounders, height, weight, smoking history, and BMI, were analyzed.
3 Results
3.1 Age-related lung structure alterations of the TL, RL and LL
Totally, 928 males from an annual lung nodule screening cohort aged 25–85 were divided into five subgroups. The height and weight of71–80 years-old were significantly lower than those of the former three groups (P < 0.05). The BMI were not significantly different among the five age groups (P > 0.05).
For the TL, RL and LL, LV peaked in the group of 51–60 years-old. The LV of the TL and RL of 51–60 years-old was significantly larger than that of ≤40 and 41–50 years-old (P < 0.05) (as shown in Table 1).
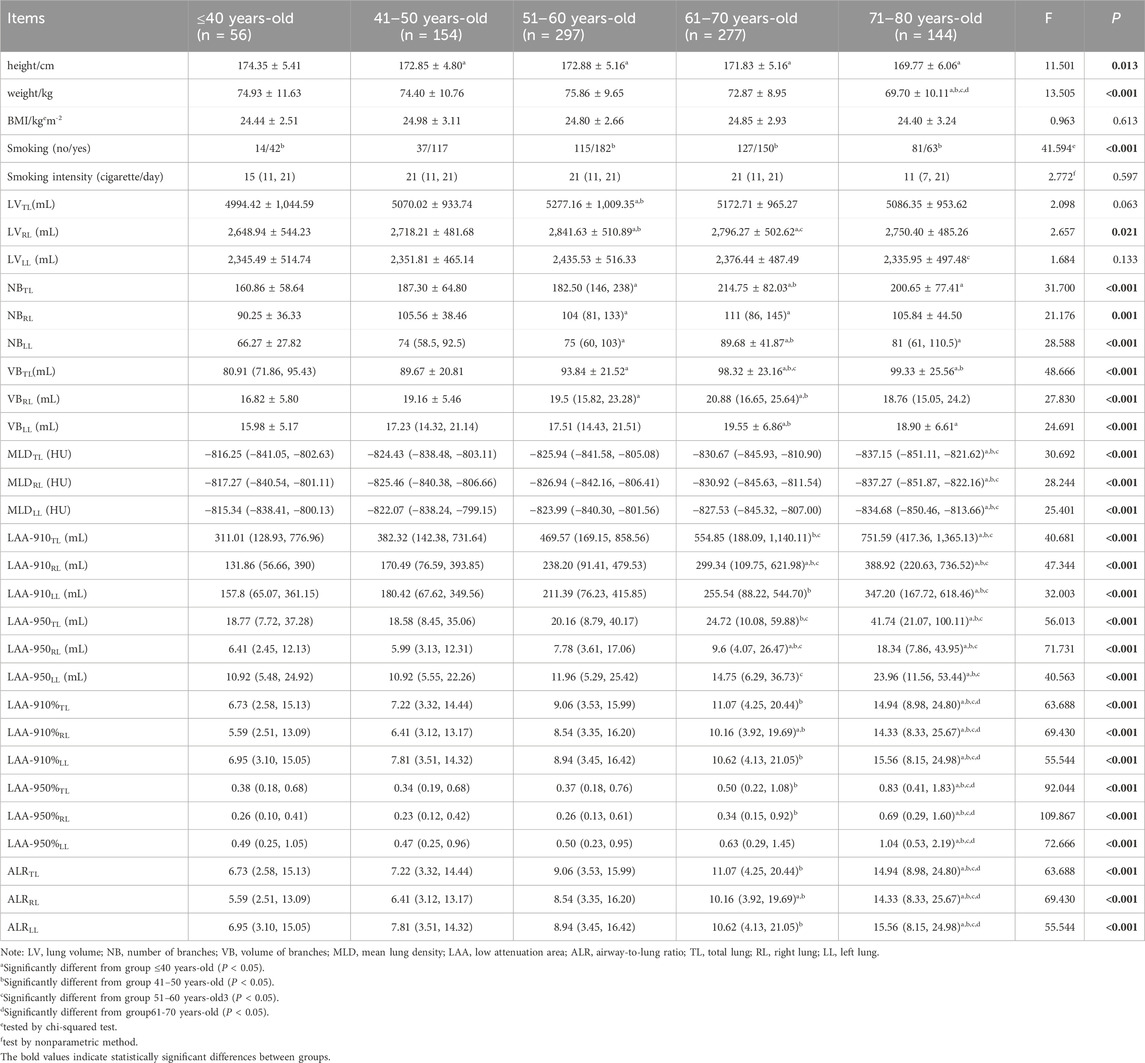
Table 1. Basic demographic characteristics of the patients.
For the TL, RL and LL, NB peaked at 61–70 years-old. The NB in the 51–60 and 61–70 years-old age groups was significantly higher than that in the ≤40 years old group (P < 0.05) (as shown in Table 1).
The VB of TL peaked in the group of 71–80 years-old, and VB of RL and LL peaked at 61–70 years-old. For the TL, RL and LL, the VB of 61–70 years-old was significantly higher than that of the ≤40 and 41–50 years-old (P < 0.05) (as shown in Table 1).
MLD decreased with age, while LAA-910, LAA-950, LAA-910%, LAA-950%, and ALR all showed an increasing trend with age. MLD was significantly lower in the 71–80 years-old group than that of the ≤40 years-old, 41–50 years-old, and 51–60 years-old groups, while LAA-910%, LAA950%, and ALR of 71–80 years-old were significantly higher than those of the other four age groups (P < 0.05) (as shown in Table 1).
In all five age groups, LV, NB, and VB of the RL were larger than those of the LL (P < 0.05). MLD, LAA-950, LAA-950%, and ALR of the RL were lower than those of the LL (P < 0.05) (as shown in Table 2).
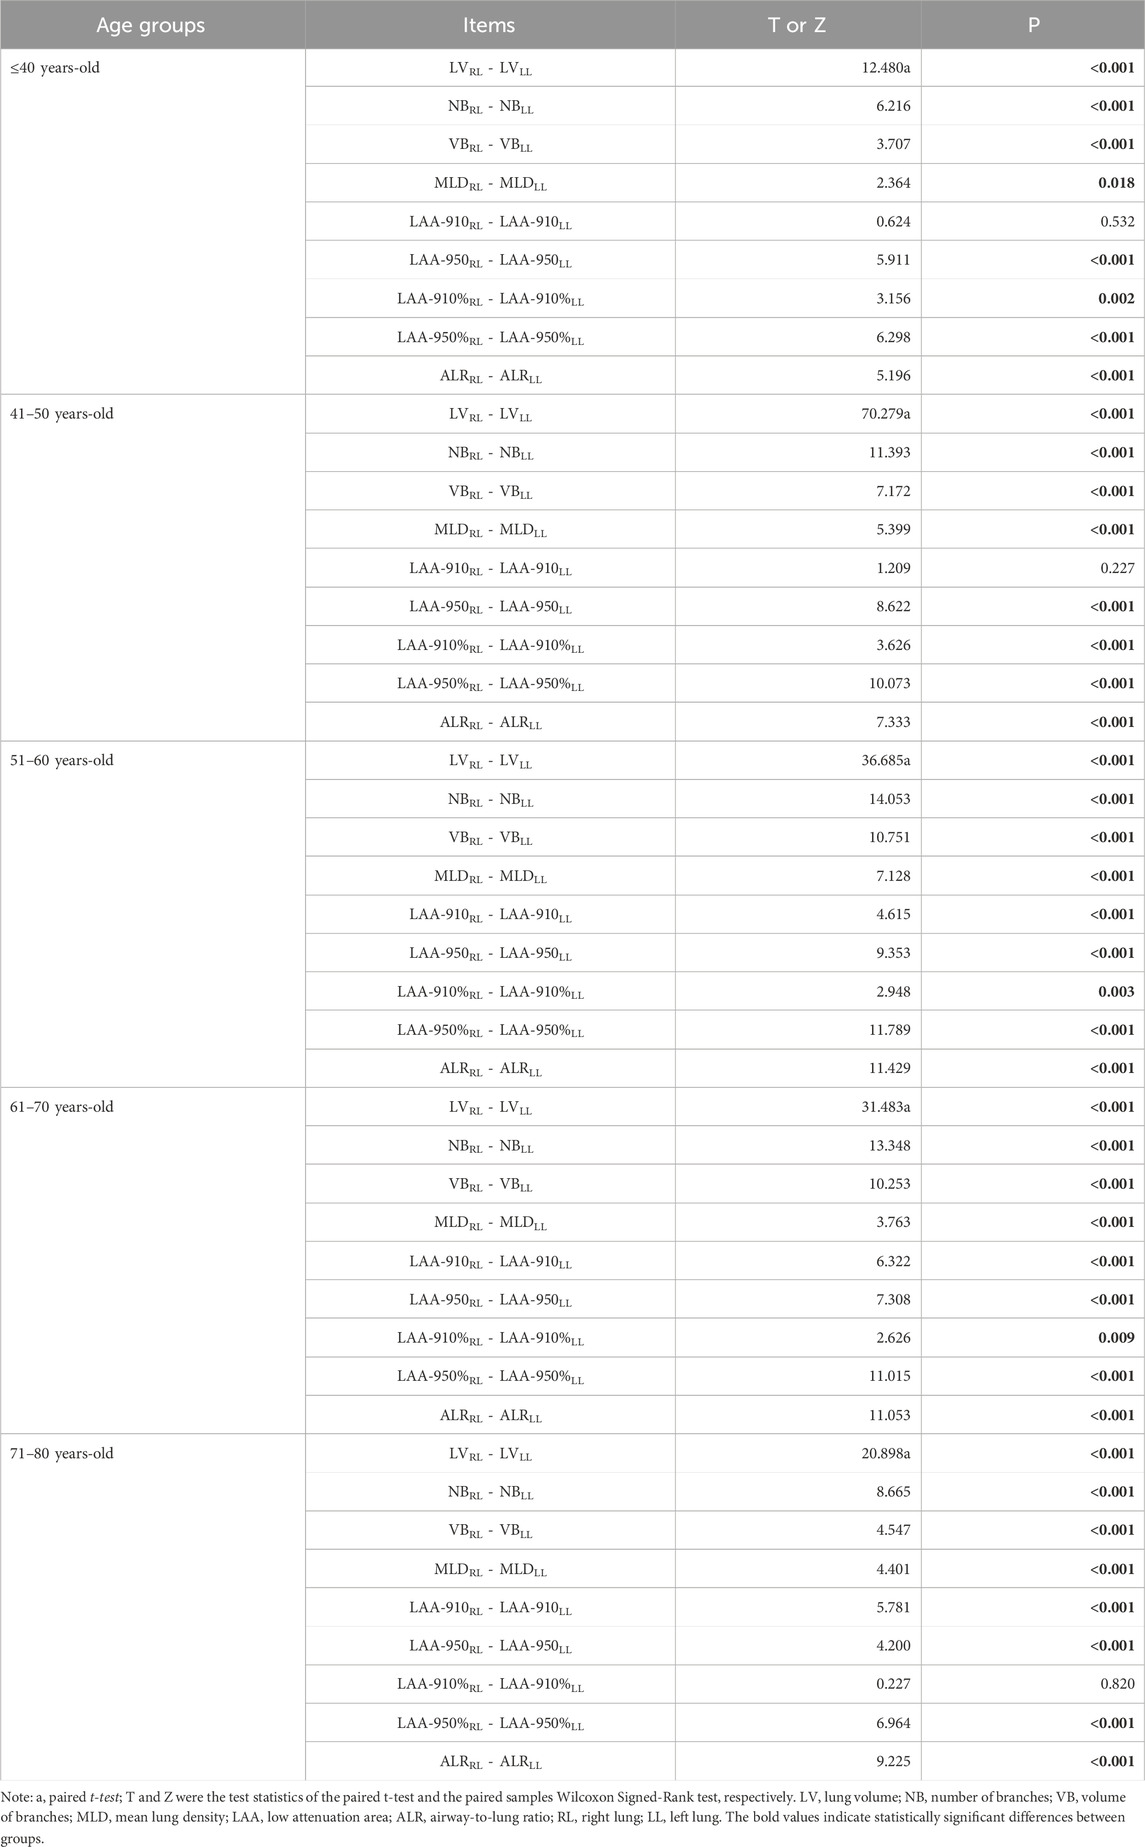
Table 2. The comparison of the quantitative parameters between theRL and the LL.
3.2 Age-related lung structure alterations of individual lobes
The LV of bilateral upper lobes increased with age, while a decline of LV of bilateral lower lobes was observed since the age group of the sixties. The significance was observed in theRLL between the age groups of 61–70 years-old and 51–60 years-old, as well as between the 71–80 years-old and 51–60 years-old groups (P < 0.05) (as shown in Table 3).
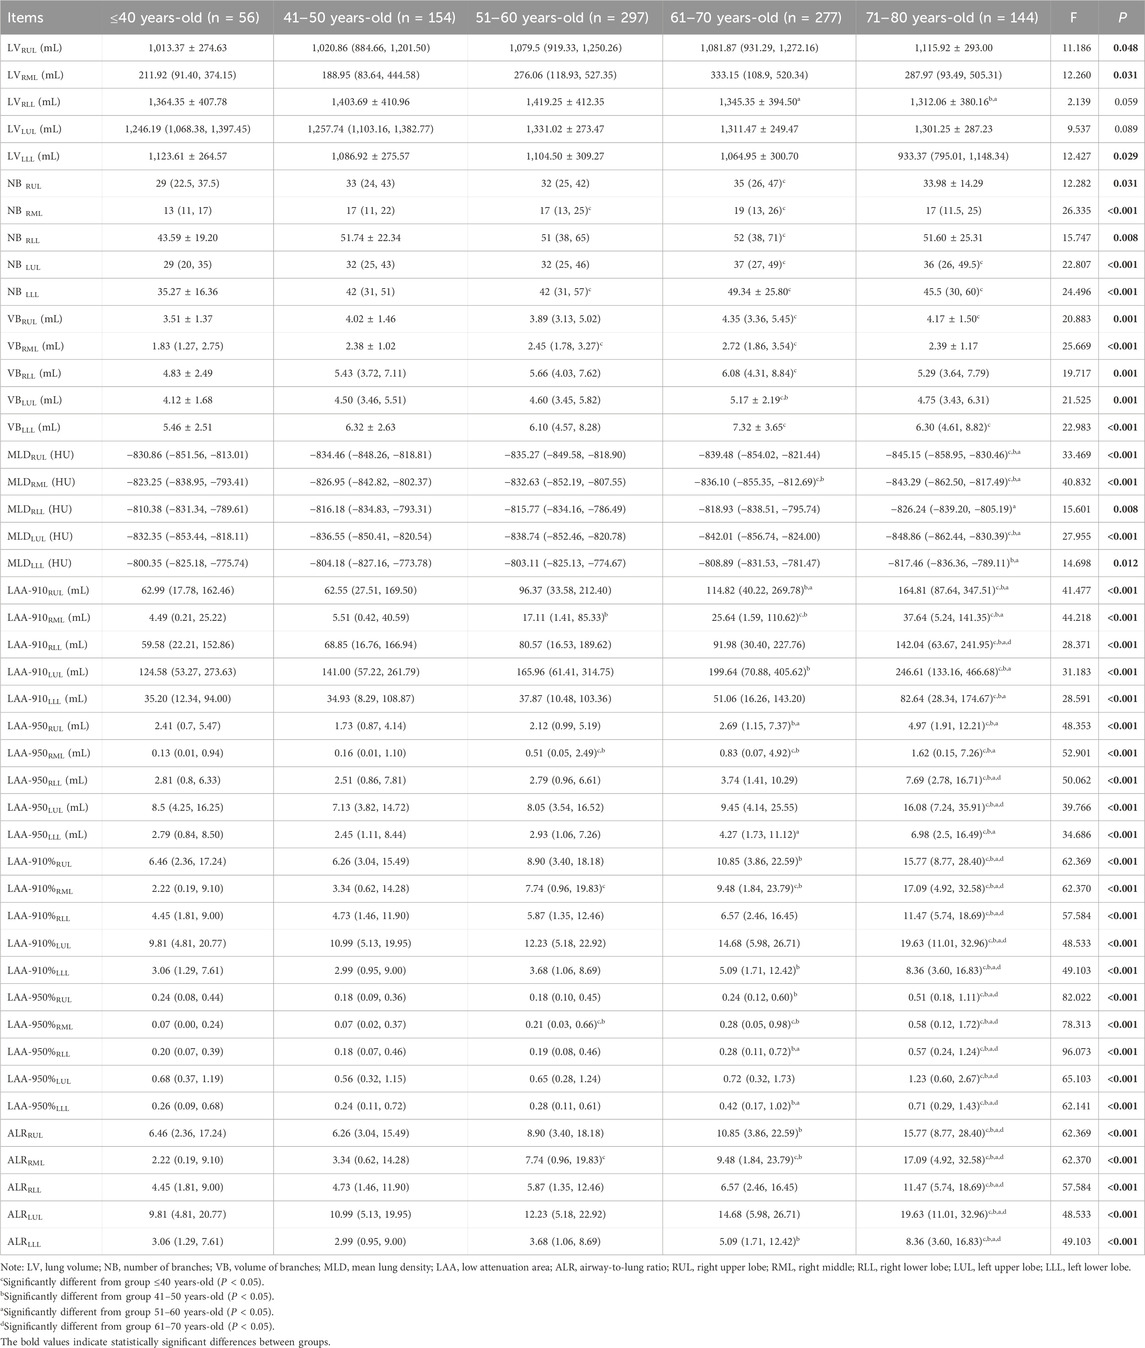
Table 3. The comparisons of quantitative parameters for the individual lobes.
VB and NB in all five lobes of the lungs increased gradually with age and peaked in the group of 61–70 years. The NB and VB in all five lobes of the 61–70 years-old were greater than those of the ≤40 years-old significantly (P < 0.05) (as shown in Table 3).
MLD of the bilateral upper lobes and the RML was diminished with age, and the significance was observed between the group of 71–80 years-old and the groups of ≤40 years-old, 41–50 years-old, and 51–60 years-old (P < 0.05). The MLD of the bilateral lower lobes decreased, and a significant difference was observed between the groups of 71–80 years-old and 51–60 years-old (P < 0.05) (as shown in Table 3).
LAA-910, LAA-950, LAA-910%, LAA-950%, and ALR increased gradually with age in all five lobes (all P < 0.05). The LAA-910%, LAA-950%, and ALR of the 71–80 years-old in all five lobes were higher than those of the other four groups (P < 0.05) (as shown in Table 3).
The ridge plot was used for illustration of age-related lung changes at the lobe level, see as Figure 3.
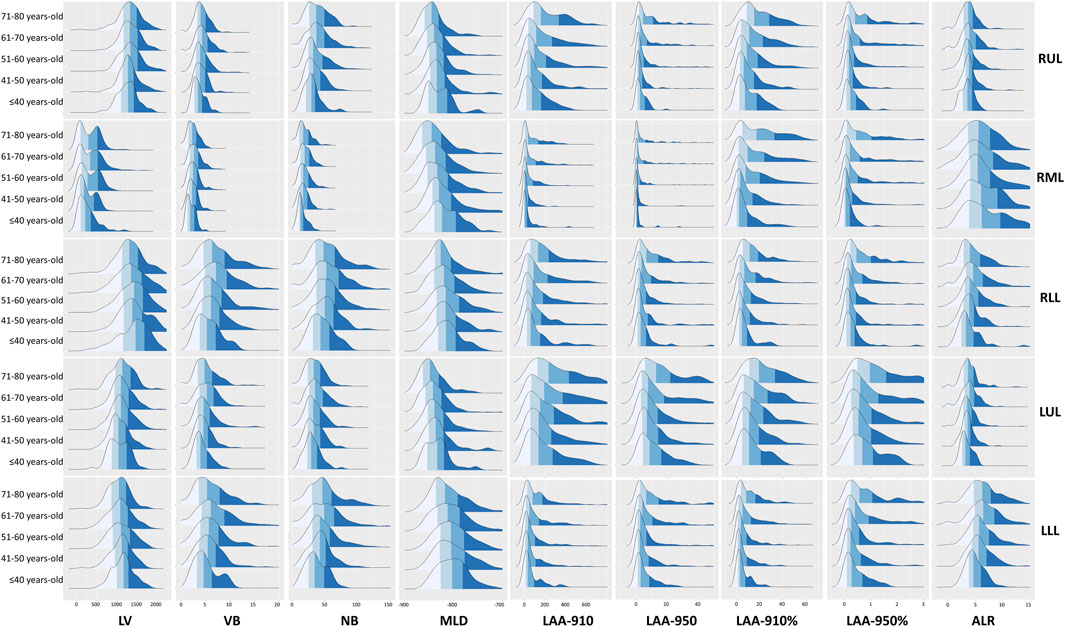
Figure 3. The ridge plot of the quantitative parameters of each lobe. Abbreviations: LV, lung volume; LAA-910, lower attenuation area than −910 Hounsfield unit; LAA-950, lower attenuation area than −950 Hounsfield unit; MLD, mean lung density; NB, number of bronchi; VB, volume of bronchi; RUL, right upper lobe; RML, right middle; LUL, left upper lobe; LLL, left lower lobe.
3.3 Curve fitting of the quantitative parameters
The fitted curves helped to reveal the trajectories of the quantitative parameters (see Figure 4). LV of TL, RL, LL and LUL peaked at about 60 years-old. LV of RUL exhibited a monotonic increase without decline, whereas LV of bilateral lower lobes demonstrated progressive reduction. Both VB and NB reached their peak values between 61-70 years of age.
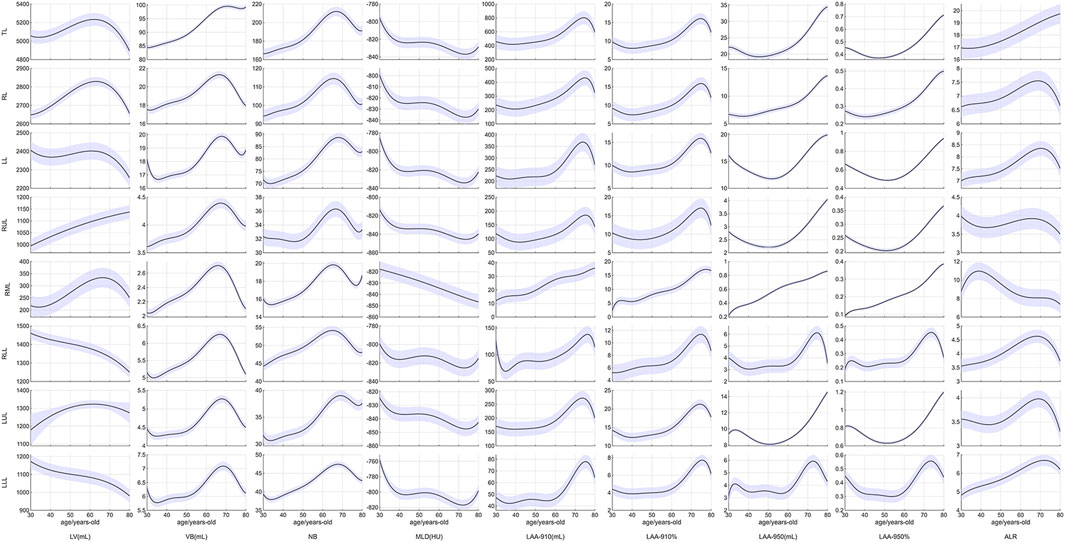
Figure 4. Curve fitting of the quantitative parameters. Abbreviations: LV, lung volume; LAA-910, lower attenuation area than −910 Hounsfield unit; LAA-950, lower attenuation area than −950 Hounsfield unit; MLD, mean lung density; NB, number of bronchi; VB, volume of bronchi; RUL, right upper lobe; RML, right middle; LUL, left upper lobe; LLL, left lower lobe.
The MLD showed a rapid decline from the age of 30–40 years-old, remained stable or slightly increased during 40–50 years-old, then began to decline again after 50 years-old. A final turning point occurred at 70 years-old, after which MLD exhibited a slight upward trend. However, the MLD of the RML consistently demonstrated a decreasing trend throughout.
LAA-910 and LAA-910% exhibited a mild decrease during ages 30–40, followed by a sustained increase until 60 years, after which a rapid increase and a downward trend were observed. LAA-950 and LAA-950% of TL decreased during ages 30–50, and then progressively increased with aging, and a similar trend of LAA-950 and LAA-950% can be seen in LL, RUL and LUL. However, the LAA-950 and LAA-950% of RLL and LLL displayed a steeper increase began at 60 years old, and finished at the 71–80 years old.
3.4 Main changes between two adjacent age groups
We compared the differences in the quantitative parameters between the two adjacent age groups. Using binary logistic regression, we identified the most significant changes between one age stage and the previous age stage, as shown in Table 4. The increase in ALR of LLL was the most significant characteristic between the age group ≤40 and 41–50 years old [OR = 1.315, 95% CI (1.094, 1.580), P = 0.003]. The most important lung structural changes from the age of 51–60 years-old to the age of 61–70 years-old pointed to LAA-910 of LLL and LAA-910% of LLL. The most important lung structural changes from the age of 61–70 years-old to the age of 71–80 years-old were the emphysema indexes.
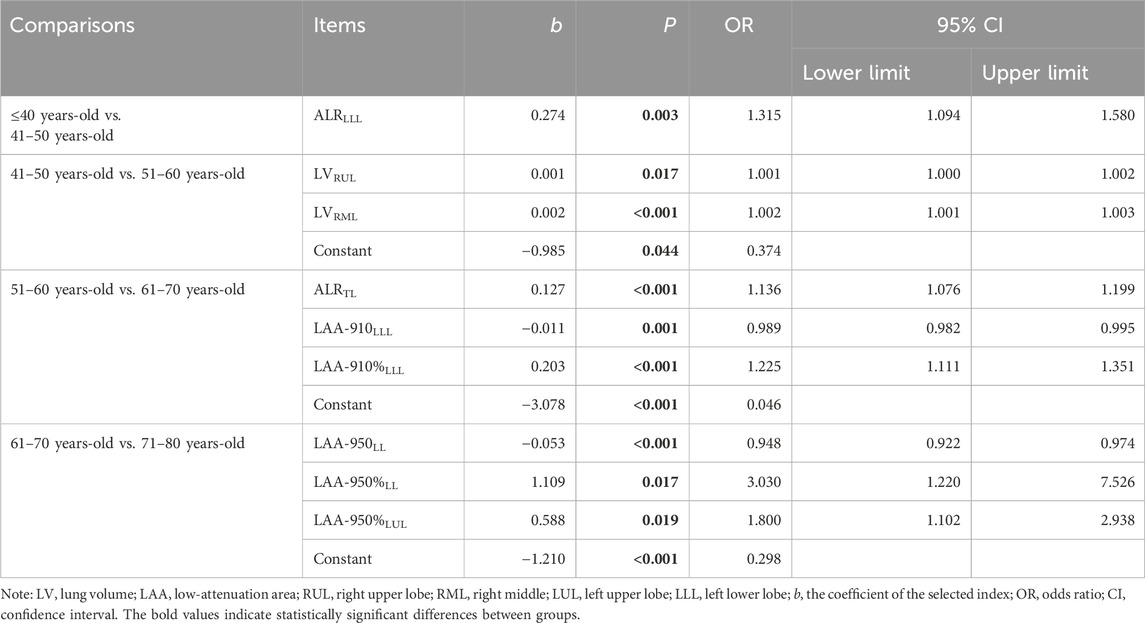
Table 4. The most significant quantitative parameters between two adjacent age groups.
3.5 The LungAge score
Spearman correlation was firstly used to identify the related parameters during lung aging (see Supplementary Table). The selected parameters in the GAM and their importance were shown in Figure 5A. The fitted value vs. the response value were shown in Figure 5B. The MSE, RMSE, MAE, and MAPE were 89.789, 9.475, 7.478, and 13.76%. In the 5-fold cross-validation, the average R2 in the training group was 0.408, the average R2 in the testing group was 0.148, see as Figure 5C. The residual plot showed normal distribution, see as Figures 5D,E. Finally, the potential confounders, smoking intensity, height, weight, and BMI, were analyzed to determine their effect on the LungAge score, as shown in Figures 5F–I.
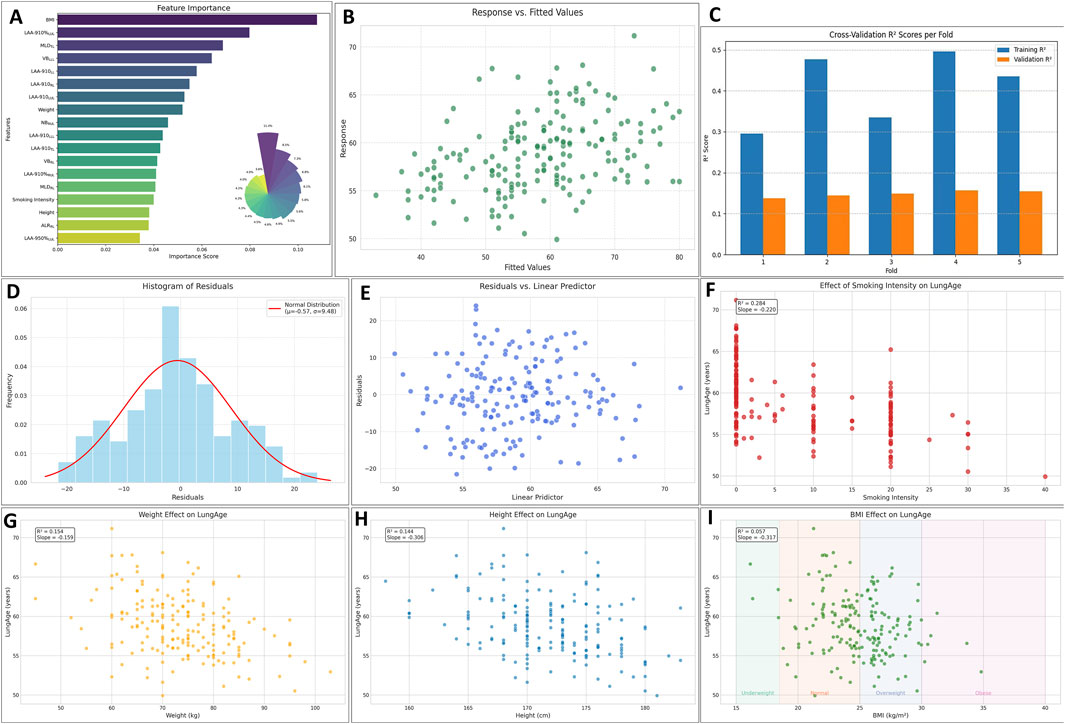
Figure 5. The evaluation of the lungAge Score. The selected parameters and their importance were shown in (A). The fitted value vs. the response value was shown in (B). In the 5-fold cross-validation, the average R2 in the training group was 0.408, and the average R2 in the testing group was 0.148, as shown in (C). The residual plot showed normal distribution, as shown in (D, E). The potential confounders, smoking intensity, height, weight, and BMI, were analyzed to determine their effect on the LungAge score, as shown in (F-I). Abbreviations: LV, lung volume; LAA-910, lower attenuation area than −910 Hounsfield unit; LAA-950, lower attenuation area than −950 Hounsfield unit; MLD, mean lung density; NB, number of bronchi; VB, volume of bronchi; RUL, right upper lobe; RML, right middle; LUL, left upper lobe; LLL, left lower lobe.
4 Discussions
By the time we are in our second or third decade, biological aging and chronological aging do not proceed in step (Bowdish, 2019). We hypothesized that this inconsistency can be measured by some predictors that are related to the lungs. This study analyzed age-related structural changes of the aging lung in a relatively large dataset. The patterns were analyzed not only at the level of the entire lung and bilateral lungs but also at the level of individual lobes.
These quantitative parameters (LV, NB, VB, MLD, LAA-910, LAA-950, LAA-910%, LAA-950% and ALR) reflect age-related lung changes from different angles. LV and MLD are both comprehensive measurements of the composition and proportion of pulmonary vessels, gas, and lung tissues. VB can be seen as part of the anatomical dead space, which reflects, in part, the residual volume in the lung function test. The increase in NB also attributed to the increase in residual volume in the lungs with age, and can be viewed as a biomarker of small airways (Verleden et al., 2020). LAA-910, LAA-910%, LAA-950 and LAA-950% were mainly pointed to the emphysematous changes. ALR was proved to be a biomarker of impaired pulmonary function in COPD (Maetani et al., 2023; Tanabe et al., 2019). All the quantitative parameters were used to assess the effect of aging, and several novel findings were identified.
First, lung aging is not a linear process in quantitative analysis. LV peaked at about 60 years old, and VB and NB reached their peak values between 61 and 70 years of age. The MLD declined from 30 to 40 years of age with minor fluctuations during the fifth decade (40–50 years), and turned a slight upward trend at 70 years. LAA-910 and LAA-910% exhibited a mild decrease during ages 30–40, followed by a sustained increase until 60 years, after which a downward trend was observed. These data suggest compensatory structural changes in the lungs to maintain ventilation function at the age of 50–60 years old. However, as age exceeds 70 years-old, this compensatory mechanism may gradually fail. Data from the lung function showed that both the forced vital capacity (FVC) and forced expiratory volume for one second (FEV1) peaked at 20–30 years old, and then declined (Erelund et al., 2023; Sahebi et al., 2022). A recent study found that aging is not a linear process (Shen et al., 2024), and a notable decrease in oxygen carrier activity around age 60.
Second, lung aging shows different change patterns between the upper lobes and the lower lobes. For the LV, RUL increased without a decline trend, but the bilateral lower lobes declined throughout the ages. The pattern of the LV of bilateral lobes is consistent with the lung function parameters; this can be explained by the bilateral lower lobes being more correlated with lung function. The paired inspiratory-expiratory chest CT quantitative results from Wu et al. (2021) showed that the volumetric change of the lower lobes was larger than the upper lobes. They also showed that the CT quantitative indexes derived from LLL and RUL gave a strong correlation with TLC and FVC. However, the CT quantitative indexes derived from the right lung (RUL and RML) were associated with Li et al. (2024). Also discovered that the LLL plays the largest role in ventilation among the five lobes, reminding us that the LLL is more sensitive to lung function decline than the other four lobes. For the LAA-950 and LAA-950%, a turning point was observed at approximately 60 years old in the bilateral lower lobes, but not in the bilateral upper lobes. These data suggest that the bilateral upper lobes were predominantly affected by emphysema (Li et al., 2023), while the bilateral lower lobes were predominantly affected by interstitial disease (Choi et al., 2022).
Third, the most obvious changes between one age stage and the previous age stage were identified using binary logistic regression. A previous study found that emphysema increased with age, ranging from 0.01% at age 40–50 years to 0.4% at age 70–80 years (Martinez et al., 2017). Our findings are consistent with previous studies. This accelerated lung aging, considered as a normal age-related senile emphysema, may be part of COPD pathogenesis (Yoon et al., 2019). Studying lung structure in normal subjects provides a basis for detecting abnormalities at an early stage (Cheng et al., 2019; Jacob et al., 2019; Ritchie et al., 2024). We have also developed a LungAge score, which can be used to assess the structural lung aging features.
However, this study has several limitations. First, despite the relatively large size of the dataset, the sample size is not equally distributed in each age group. The sample size of the age ≤40 years old and >70 years old was relatively small. Thus, the present findings are subject to confirmation in males aged ≤40 years and >70 years. It is recommended that the sample size be further expanded in future studies. Second, this is a cross-sectional study; tracking individuals longitudinally over longer periods will be required to observe these trajectories at an individual level. Third, all the subjects were from a single center, which may limit the applicability of the results in the external sample. Fourth, the quantitative parameters used in the study are limited when calculating a more precise LungAge score. More sensitive biomarkers need to be defined or designed to help us understand the changes of the aging lung. Fifth, a previous study from our team has confirmed that the low-dose CT scan (compared to the standard-dose) and the traditional reconstruction technique (filtered back projection) will lead to higher LAA and higher noise (Huang et al., 2020). In clinical practice, most health management centers or hospitals prefer a low-dose CT scan for lung nodular screening; therefore, advanced image reconstruction should be considered to decrease noise and achieve optimal LAA values (Ferri et al., 2022; Bak et al., 2020). Sixth, the lack of lung function data limits our consideration to older individuals who maintain their functionality despite illnesses and diseases. As we were trying to display the age-related changes of lung structure with regard to the “healthy aging” population. Finally, there is a lack of data on pulmonary function. We would collect pulmonary function data to better interpret the trajectories of the quantitative parameters.
5 Conclusion
In summary, our findings demonstrated that lung aging is not a linear process, with peak ages for LV and VB occurring at 51–60 and 61–70 years-old, respectively, while the progression of emphysema becomes particularly pronounced after 70 years of age. Age-related lung structural alterations in the upper and lower lobes exhibit significant heterogeneity, with the upper lobes predominantly demonstrating volume expansion accompanied by marked emphysema progression, whereas the bilateral lower lobes primarily show volume reduction with interstitial fibrotic proliferation after 60 years-old. This study identifies the parameters and lobes exhibiting the most significant changes between adjacent age groups, and we provide a computational formula, LungAge Score, for the assessment of the structural lung aging features.
Data availability statement
The raw data supporting the conclusions of this article will be made available by the authors, without undue reservation.
Ethics statement
The studies involving humans were approved by The First Affiliated Hospital of Xi’an Jiaotong University, Xi’an, Shaanxi. The studies were conducted in accordance with the local legislation and institutional requirements. The participants provided their written informed consent to participate in this study.
Author contributions
MS: Methodology, Formal Analysis, Data curation, Writing – original draft. YG: Validation, Funding acquisition, Resources, Project administration, Writing – review and editing. CJ: Conceptualization, Writing – review and editing, Methodology. CS: Writing – review and editing, Supervision, Conceptualization, Investigation, Software, Visualization.
Funding
The author(s) declare that no financial support was received for the research and/or publication of this article.
Conflict of interest
The authors declare that the research was conducted in the absence of any commercial or financial relationships that could be construed as a potential conflict of interest.
Generative AI statement
The author(s) declare that no Generative AI was used in the creation of this manuscript.
Publisher’s note
All claims expressed in this article are solely those of the authors and do not necessarily represent those of their affiliated organizations, or those of the publisher, the editors and the reviewers. Any product that may be evaluated in this article, or claim that may be made by its manufacturer, is not guaranteed or endorsed by the publisher.
Supplementary material
The Supplementary Material for this article can be found online at: https://www.frontiersin.org/articles/10.3389/fragi.2025.1624233/full#supplementary-material
References
Bak, S. H., Kim, J. H., Jin, H., Kwon, S. O., Kim, B., Cha, Y. K., et al. (2020). Emphysema quantification using low-dose computed tomography with deep learning-based kernel conversion comparison. Eur. Radiol. 30, 6779–6787. doi:10.1007/s00330-020-07020-3
Bowdish, D. M. E. (2019). The aging lung: is lung health good health for older adults? Chest 155, 391–400. doi:10.1016/j.chest.2018.09.003
Cheng, T., Li, Y., Pang, S., Wan, H., Shi, G., Cheng, Q., et al. (2019). Normal lung attenuation distribution and lung volume on computed tomography in a Chinese population. Int. J. Chron. Obstruct Pulmon Dis. 14, 1657–1668. doi:10.2147/COPD.S187596
Cho, S. J., and Stout-Delgado, H. W. (2020). Aging and lung disease. Annu. Rev. Physiol. 82, 433–459. doi:10.1146/annurev-physiol-021119-034610
Choi, J., Chae, K. J., Lin, C. L., Laroia, A. T., Hoffman, E. A., Lee, C. H., et al. (2022). CT-based lung motion differences in patients with usual interstitial pneumonia and nonspecific interstitial pneumonia. Front. Physiol. 13, 867473. doi:10.3389/fphys.2022.867473
Erelund, S., Karp, K., Arvidsson, S., Johansson, B., Sundström, N., and Wiklund, U. (2023). Pulmonary function in a cohort of heart-healthy individuals from Northern Sweden-a comparison with discordant reference values. BMC Pulm. Med. 23, 110. doi:10.1186/s12890-023-02403-w
Ferri, F., Bouzerar, R., Auquier, M., Vial, J., and Renard, C. (2022). Pulmonary emphysema quantification at low dose chest CT using Deep Learning image reconstruction. Eur. J. Radiol. 152, 110338. doi:10.1016/j.ejrad.2022.110338
GBD 2019 Chronic Respiratory Diseases Collaborators, Moghaddam, S. S., Ghamari, S. H., Rad, E. M., Rezaei, N., Shobeiri, P., et al. (2023). Global burden of chronic respiratory diseases and risk factors, 1990-2019: an update from the Global Burden of Disease Study 2019. EClinicalMedicine 59, 101936. doi:10.1016/j.eclinm.2023.101936
Han, M. K., Agusti, A., Celli, B. R., Criner, G. J., Halpin, D. M. G., Roche, N., et al. (2021). From GOLD 0 to pre-COPD. Am. J. Respir. Crit. Care Med. 203, 414–423. doi:10.1164/rccm.202008-3328PP
Huang, X., Xinhua, Q. I., Wang, L., Zhao, F., Yanjin, Z. H. U., Wenxiu, L. I. U., et al. (2020). Effect of KARL iterative reconstruction on quantitative measurement of emphysema under low-dose CT scan of COPD. J. Xi 'an Jiaot. Univ. Med. Sci. Ed. 41, 410–414. doi:10.7652/jdyxb202003017
Jacob, J., Pienn, M., Payer, C., Urschler, M., Kokosi, M., Devaraj, A., et al. (2019). Quantitative CT-derived vessel metrics in idiopathic pulmonary fibrosis: a structure-function study. Respirology 24 (5), 445–452. doi:10.1111/resp.13485
Jiang, D., Wang, Z., Yu, N., Shen, C., Deng, L., and Guo, Y. (2018). Airway remodeling in asthma: evaluation in 5 consecutive bronchial generations by using high-resolution computed tomography. Respir. Care 63, 1399–1406. doi:10.4187/respcare.06050
Jiao, L., Shen, R., Li, M., Liang, Y., Guo, Y., and Shen, C. (2024). Determination of pulmonary vessel alteration in Chinese male smokers by quantitative computed tomography measurements: a retrospective study. Quant. Imaging Med. Surg. 14, 3289–3301. doi:10.21037/qims-23-1758
Kasmani, M. Y., Topchyan, P., Brown, R. J., Wu, X., Chen, Y., Brown, A. K., et al. (2023). A spatial sequencing atlas of age-induced changes in the lung during influenza infection. Nat. Commun. 14, 6597. doi:10.1038/s41467-023-42021-y
Kim, Y., Kim, S. H., Rhee, C. K., Lee, J. S., Lee, C. Y., Kim, D. K., et al. (2022). Air trapping and the risk of COPD exacerbation: analysis from prospective KOCOSS cohort. Front. Med. (Lausanne) 9, 835069. doi:10.3389/fmed.2022.835069
Koo, M. C., Tan, W. C., Hogg, J. C., Bourbeau, J., Hague, C. J., Leipsic, J. A., et al. (2023). Quantitative computed tomography and visual emphysema scores: association with lung function decline. ERJ Open Res. 9 (2), 00523–02022. doi:10.1183/23120541.00523-2022
Li, T. Z., Hin Lee, H., Gao, R., Dawant, B. M., Maldonado, F., Xu, K., et al. (2023). Quantifying emphysema in lung screening computed tomography with robust automated lobe segmentation. J. Med. Imaging (Bellingham) 10 (4), 044002. doi:10.1117/1.JMI.10.4.044002
Li, W., Meng, H., Huang, S., Lin, H., and Chen, H. (2024). Computed tomography (CT) quantitative assessment of single lobe emphysema correlates with chronic obstructive pulmonary disease (COPD) severity: a cross-sectional study with retrospective data collection. Quant. Imaging Med. Surg. 14, 4540–4554. doi:10.21037/qims-23-1496
MacNee, W. (2016). Is chronic obstructive pulmonary disease an accelerated aging disease? Ann. Am. Thorac. Soc. 13, S429–S437. doi:10.1513/AnnalsATS.201602-124AW
Maetani, T., Tanabe, N., Terada, S., Shiraishi, Y., Shima, H., Kaji, S., et al. (2023). Physiological impacts of computed tomography airway dysanapsis, fractal dimension, and branch count in asymptomatic never smokers. J. Appl. Physiol. 134, 20–27. doi:10.1152/japplphysiol.00385.2022
Martinez, C. H., Diaz, A. A., Meldrum, C., Curtis, J. L., Cooper, C. B., Pirozzi, C., et al. (2017). Age and small airway imaging abnormalities in subjects with and without airflow obstruction in SPIROMICS. Am. J. Respir. Crit. Care Med. 195, 464–472. doi:10.1164/rccm.201604-0871OC
Miller, M. R. (2010). Structural and physiological age-associated changes in aging lungs. Semin. Respir. Crit. Care Med. 31, 521–527. doi:10.1055/s-0030-1265893
Pu, J., Fuhrman, C., Sciurba, F. C., Good, W. F., and Gur, D. (2011). A differential geometric approach to automated segmentation of human airway tree. IEEE Trans. Med. Imaging 30, 266–278. doi:10.1109/TMI.2010.2076300
Pu, J., Leader, J. K., Meng, X., Whiting, B., Wilson, D., Sciurba, F. C., et al. (2012). Three-dimensional airway tree architecture and pulmonary function. Acad. Radiol. 19 (11), 1395–1401. doi:10.1016/j.acra.2012.06.007
Pu, J., Zheng, B., Leader, J. K., Knollmann, F., Klym, A., Fuhrman, C., et al. (2009). Pulmonary lobe segmentation in CT examinations using implicit surface fitting. IEEE Trans. Med. Imaging 28, 1986–1996. doi:10.1109/TMI.2009.2027117
Ritchie, A. I., Donaldson, G. C., Hoffman, E. A., Allinson, J. P., Bloom, C. I., Bolton, C. E., et al. (2024). Structural predictors of lung function decline in young smokers with normal spirometry. Am. J. Respir. Crit. Care Med. 209 (10), 1208–1218. doi:10.1164/rccm.202307-1203OC
Sahebi, L., Rahimi, B., Shariat, M., Mousavy, S. H., and Hosseini, M. (2022). Normal spirometry prediction equations for the Iranian population. BMC Pulm. Med. 22, 472. doi:10.1186/s12890-022-02273-8
San José Estépar, R., Barr, R. G., Fain, S. B., Grenier, P. A., Hoffman, E. A., Humphries, S. M., et al. (2025). The use of computed tomography densitometry for the assessment of emphysema in clinical trials: a position paper from the fleischner society. Am. J. Respir. Crit. Care Med. 211 (5), 709–728. doi:10.1164/rccm.202410-2012SO
Schneider, J. L., Rowe, J. H., Cet, G. A., Kim, C. F., Sharpe, A. H., and Haigis, M. C. (2021). The aging lung: physiology, disease, and immunity. Cell 184, 1990–2019. doi:10.1016/j.cell.2021.03.005
Shen, C., Yu, N., Zhou, J., Sheng, J., Liu, K., Zhou, H., et al. (2020). Quantitative computed tomography analysis for stratifying the severity of Coronavirus Disease 2019. J. Pharm. Anal. 10, 123–129. doi:10.1016/j.jpha.2020.03.004
Shen, R., Guo, Y., and Shen, C. (2025). Quantitative assessment of lung structure changes in low-intensity smokers: a retrospective study in a Chinese male cohort. Quant. Imaging Med. Surg. 15, 287–298. doi:10.21037/qims-24-1171
Shen, X., Wang, C., Zhou, W., Hornburg, D., Wu, S., Zhou, X., et al. (2024). Nonlinear dynamics of multi-omics profiles during human aging. Nat. Aging. 4, 1619–1634. doi:10.1038/s43587-024-00692-2
Silveyra, P., Fuentes, N., and Rodriguez Bauza, D. E. (2021). Sex and gender differences in lung disease. Adv. Exp. Med. Biol. 1304, 227–258. doi:10.1007/978-3-030-68748-9_14
Skloot, G. S. (2017). The effects of aging on lung structure and function. Clin. Geriatr. Med. 33, 447–457. doi:10.1016/j.cger.2017.06.001
Tanabe, N., Sato, S., Shima, H., Sato, A., Muro, S., Oguma, T., et al. (2019). Associations of airway tree to lung volume ratio on computed tomography with lung function and symptoms in chronic obstructive pulmonary disease. Respir. Res. 20, 77. doi:10.1186/s12931-019-1047-5
Tanabe, N., Vasilescu, D. M., Kirby, M., Coxson, H. O., Verleden, S. E., Vanaudenaerde, B. M., et al. (2018). Analysis of airway pathology in COPD using a combination of computed tomography, micro-computed tomography and histology. Eur. Respir. J. 51, 1701245. doi:10.1183/13993003.01245-2017
Terada, S., Tanabe, N., Shiraishi, Y., Sakamoto, R., Shima, H., Maetani, T., et al. (2023). Association of age with computed tomography airway tree morphology in male and female never smokers without lung disease history. Respir. Med. 214, 107278. doi:10.1016/j.rmed.2023.107278
Verleden, S. E., Vanstapel, A., Weynand, B., Boone, M., Let, D. S., Verbeken, E., et al. (2020). Quantitative analysis of airway obstruction in lymphangioleiomyomatosis. Eur. Respir. J. 56, 1901965. doi:10.1183/13993003.01965-2019
Wu, F., Chen, L., Fan, W., Yang, J., Zhang, X., et al. (2021). Total lung and lobar quantitative assessment based on paired inspiratory–expiratory chest CT in healthy adults: correlation with pulmonary ventilatory function. Diagn. (Basel) 11, 1791. doi:10.3390/diagnostics11101791
Yang, H., Yang, Y., Wang, F., Miao, C., Chen, Z., Zha, S., et al. (2025). Clinical and prognostic differences in mild to moderate COPD with and without emphysema. Chest 167 (3), 724–735. doi:10.1016/j.chest.2024.10.020
Yin, N., Shen, C., Wang, J., Dong, F., Guo, Y., and Bai, L. (2019). Computer-aided identification of interstitial lung disease based on computed tomography. J. Xray Sci. Technol. 27, 591–603. doi:10.3233/XST-180460
Keywords: age-related changes, lung structures, quantitative assessment, LungAge score, lung aging
Citation: Shi M, Guo Y, Jin C and Shen C (2025) Age-related lung structure changes by quantitative assessment: a cross-sectional study in a Chinese male cohort. Front. Aging 6:1624233. doi: 10.3389/fragi.2025.1624233
Received: 07 May 2025; Accepted: 03 July 2025;
Published: 23 October 2025.
Edited by:
Elisavet Stavropoulou, Centre Hospitalier Universitaire Vaudois (CHUV), SwitzerlandReviewed by:
Cheng Sheng Yin, Yijishan Hospital of Wannan Medical College, ChinaYanmei Wang, Sichuan Academy of Chinese Medicine Sciences Institute of TCM Clinical Foundation and Literature Information, China
Copyright © 2025 Shi, Guo, Jin and Shen. This is an open-access article distributed under the terms of the Creative Commons Attribution License (CC BY). The use, distribution or reproduction in other forums is permitted, provided the original author(s) and the copyright owner(s) are credited and that the original publication in this journal is cited, in accordance with accepted academic practice. No use, distribution or reproduction is permitted which does not comply with these terms.
*Correspondence: Cong Shen, c2hlbmNvbmcxMDAyMTdAeGp0dWZoLmVkdS5jbg==
†ORCID: Meijuan Shi, orcid.org/0000-0001-8410-5974; Cong Shen, orcid.org/0000-0001-5521-1612