 Matthew R. Graham
 William D. Flint
 Alexsis M. Powell1
 Victor Fet
 Thomas K. Pauley
- 1Department of Biology, Eastern Connecticut State University, Willimantic, CT, United States
- 2Department of Biology, James Madison University, Harrisonburg, VA, United States
- 3Department of Biological Sciences, Marshall University, Huntington, WV, United States
Although many studies have examined how taxa responded to Pleistocene climate fluctuations in the Appalachian Mountains, impacts on high-elevation endemics of Central Appalachia are not yet understood. We use mitochondrial (ND4 & Cytb) and nuclear (GAPD) DNA sequences to investigate the phylogeography of the Cow Knob Salamander (Plethodon punctatus), a woodland species from Central Appalachian highlands thought to have origins in the Pleistocene. Data from 72 tail tips representing 25 sites revealed that the species comprises two geographically cohesive mitochondrial clades with a narrow, putative contact zone on Shenandoah Mountain. Molecular clock estimates indicate the clades diverged in the Middle Pleistocene. The population size of the Southern clade appears to have remained stable for at least 50,000 years. Despite spanning several isolated mountain systems, the Northern clade has exceptionally low genetic diversity, probably due to recent demographic expansion. Palaeodemographic hypothesis testing supported a scenario in which a founder effect characterized the Northern clade as it diverged from the Southern clade. Species distribution models predicted no suitable habitat for the species during the Last Glacial Maximum. Ultimately, Pleistocene glacial climates may have driven the species from the northern half of its current range, with recolonization events by members of the Northern clade as climates warmed. Density dependent processes may now maintain a narrow contact zone between the two clades.
Introduction
Sky islands have garnered much attention in biogeography (i.e. Brown, 1971; Brown, 1978; Masta, 2000; Moore et al., 2013). The term is applied to isolated patches of montane habitats surrounded by non-analogous environments at lower elevations, thus acting as isolated “islands in the sky” for mountain-dwelling taxa (reviewed in McCormack et al., 2009). Early work exploring the connectivity among taxa endemic to sky island systems largely centered on mountain ranges associated with the Chihuahuan, Sonoran, and Great Basin deserts, where islands of montane pine forests provide a stark contrast to the lower elevation deserts, semi-deserts, and grasslands that surround them. This region, especially the Madrean sky island system, has been much studied (i.e. Warshall, 1994; Masta, 2000; McCormack et al., 2008; Ober et al., 2011; Mitchell & Ober, 2013; Moore et al., 2013; Manthey & Moyle, 2015; Wiens et al., 2019). Taxa inhabiting these sky islands have been shown to exhibit various degrees of connectivity, ranging from Pleistocene-level associations among sky islands (Masta, 2000; McCormack et al., 2008), to scorpions that have been isolated in their respective habitats since the Miocene (Bryson et al., 2013). More mesic sky island systems have been studied as well, and some, such as the cloud forests of the neotropics, are remarkably complex with ancient lineages and cryptic species (i.e. Castoe et al., 2009; Doan et al., 2016).
In this contribution, we focus on the mountaintops of the Central Appalachians in eastern North America. Although not usually considered sky islands, montane habitats of the region are fragmented and possess characteristics similar to those of sky island complexes. High mountains and low-elevation valleys provide steep elevational gradients, resulting in high habitat heterogeneity over short distances. Most of the Central Appalachians did not receive glacial coverage during the Pleistocene, but were drier and colder during glacial episodes (Springer et al., 2009). Thus, organisms endemic to Central Appalachian highlands may have experienced significant distributional shifts as they tracked suitable climates while they fluctuated during the Pleistocene. Alternatively, endemics may have been forced to adapt in place as climates changed around them, or a combination of both. These processes could either promote diversification in montane taxa via natural selection, sexual selection, and drift, or inhibit lineage formation by promoting gene flow when displaced from their high-elevation habitats. Both of these patterns have been observed for sky island complexes in western North America (McCormack et al., 2009), but much less is known about responses to Pleistocene climate in fragmented mountains of central Appalachia (but see Mulder et al., 2019).
We assessed the phylogeography of Plethodon punctatus Highton, 1972 (Caudata: Plethodontidae), a medium-bodied salamander endemic to central Appalachia. Like other woodland salamanders, P. punctatus spend most of their time underground and only come to the surface at night to feed on invertebrates when conditions are sufficiently wet. Plethodon punctatus was identified as a separate species from P. wehrlei due to both physical and ecological differences (Highton, 1972). Plethodon punctatus occurs in high-elevation (>850 m) forest habitats where they live among rocks and talus throughout the Shenandoah and Great North mountain ranges, and several adjacent mountaintops. Its range forms a narrow and patchy strip, approximately 150 km in length, in the Ridge and Valley Physiographic Province (Figure 1). Plethodon wehrlei occurs throughout a greater range of elevations and habitats within much of the Allegheny Plateau physiographic province from central West Virginia through southern New York and portions of the western Ridge and Valley Province in Virginia. Small plethodontid salamanders with narrow distributions have been demonstrated to have poor acclimation ability and lower thermal tolerances to temperature extremes in lab experiments (Markle & Kozak, 2018), so we suspect P. punctatus may have been influenced by fluctuating Pleistocene climates.
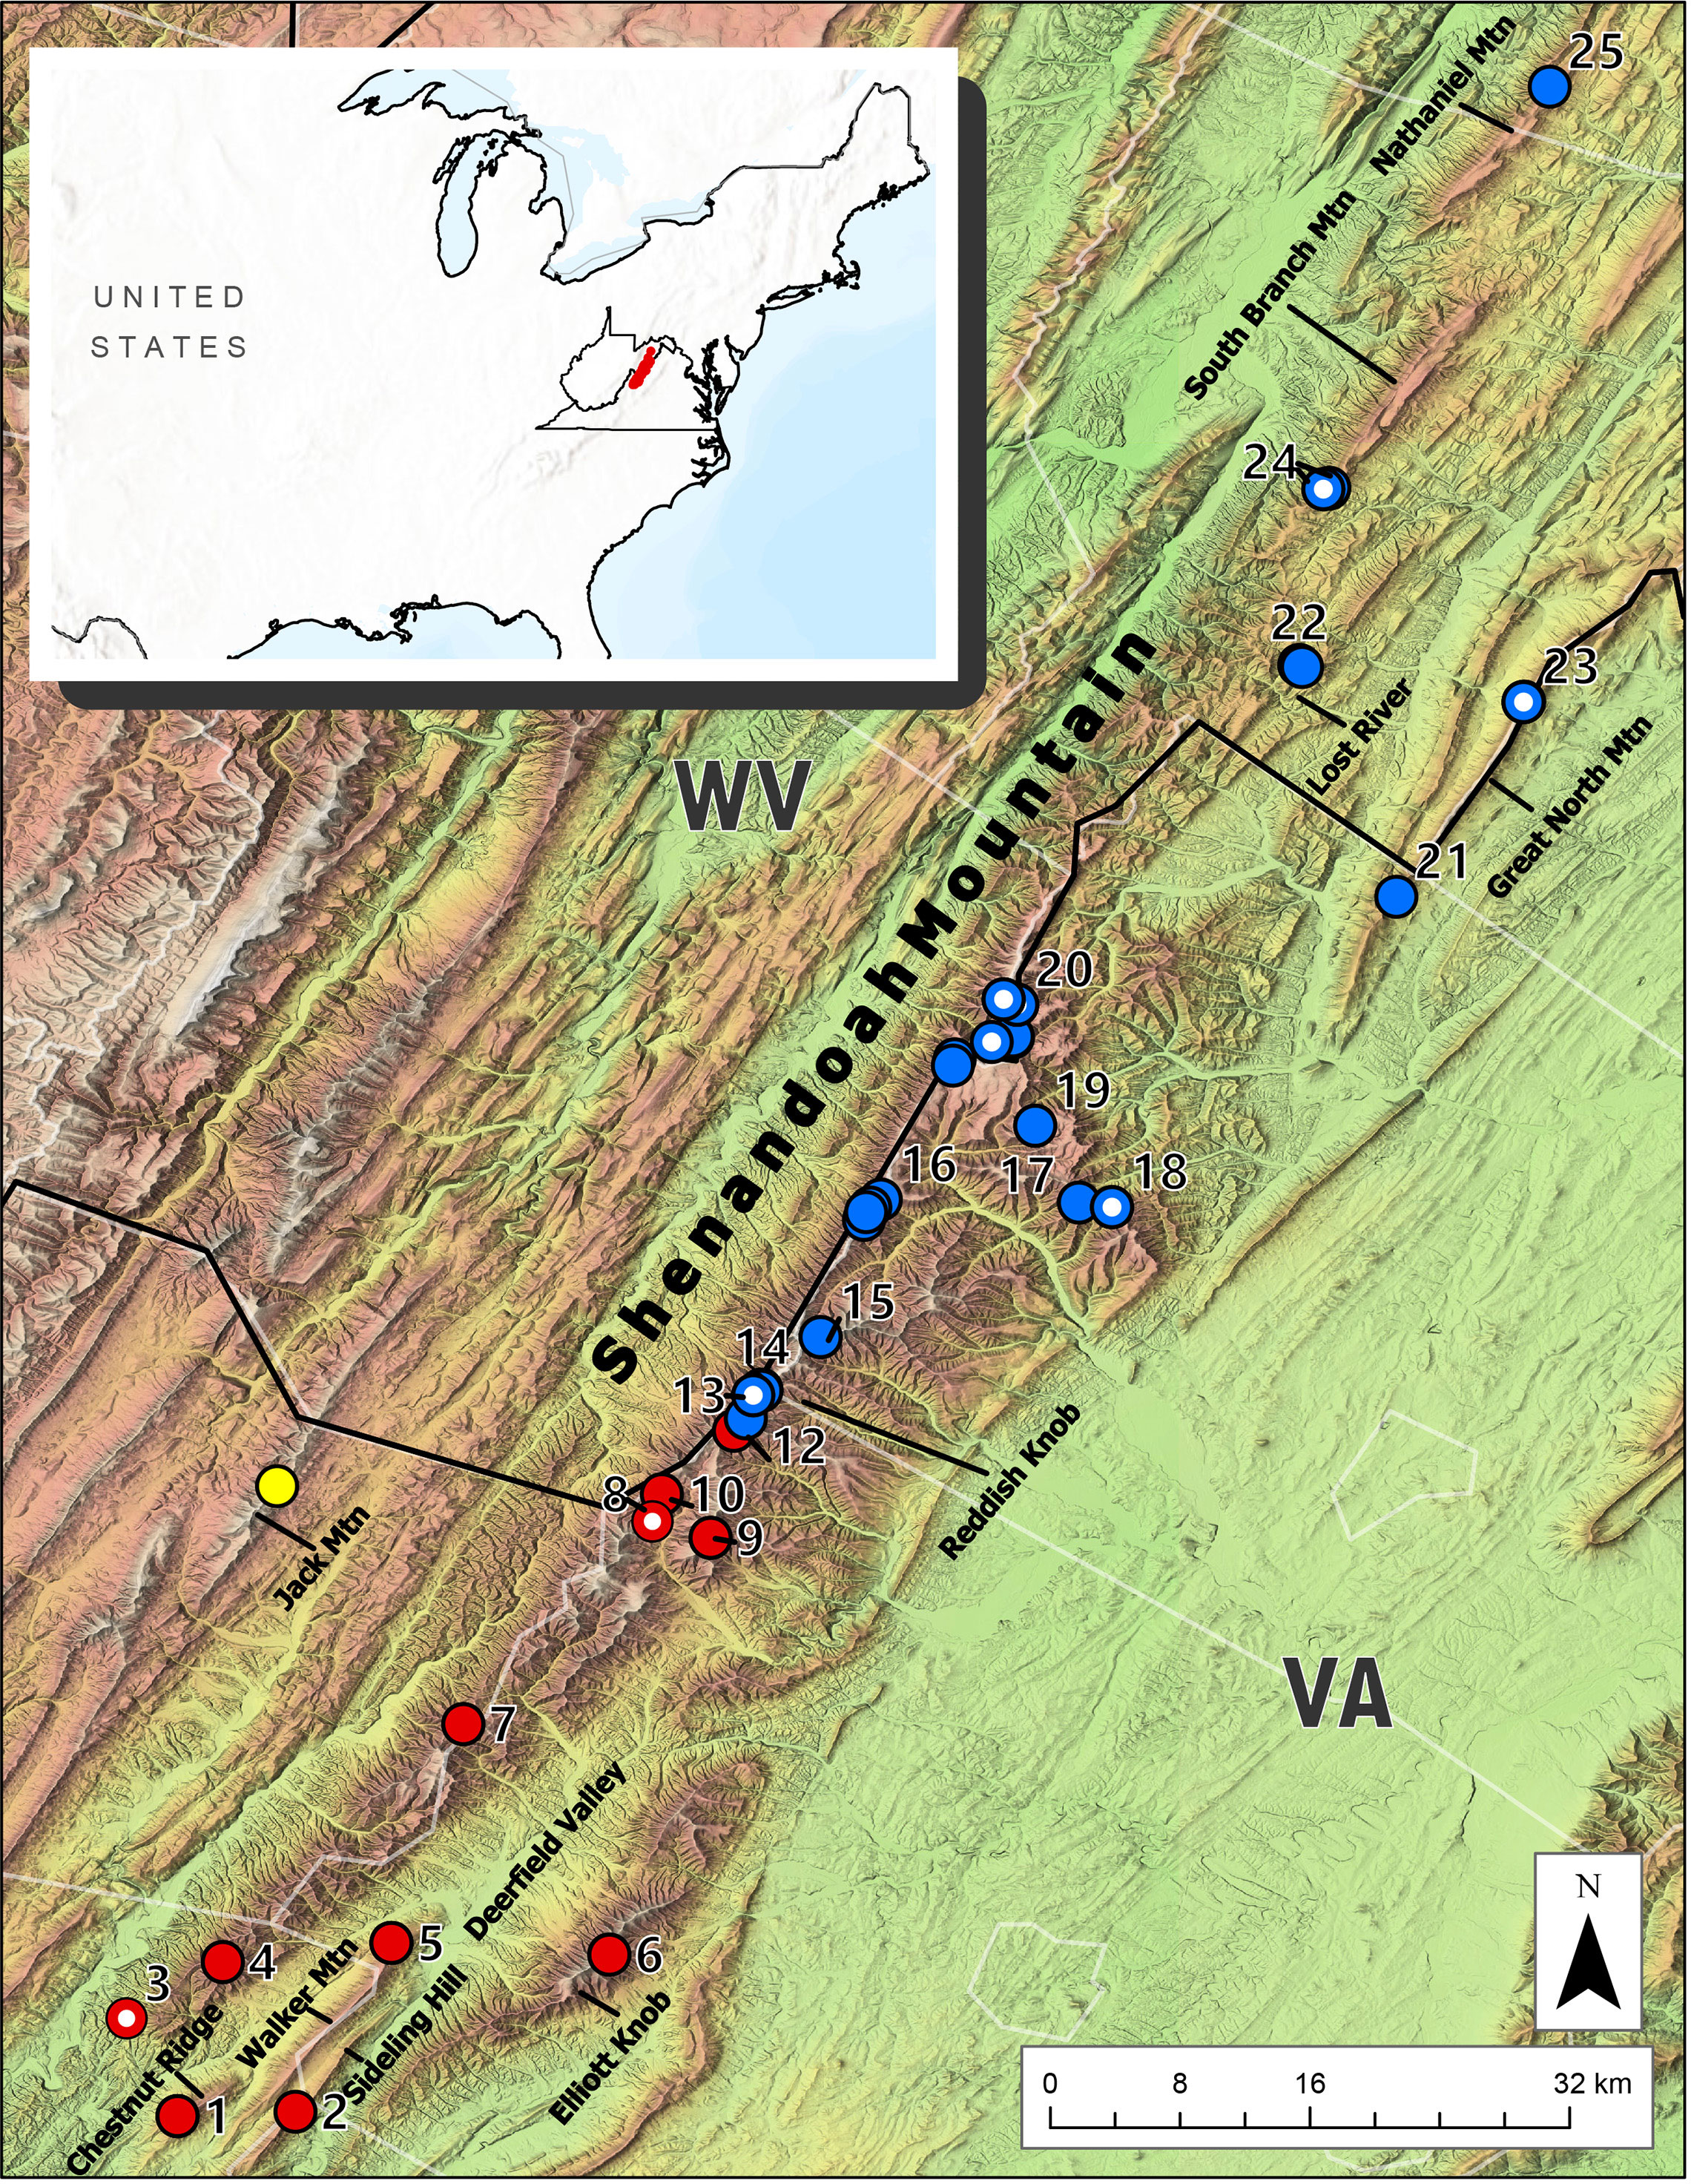
Figure 1 Map of the Central Appalachian region inhabited by Plethodon punctatus. Red circles indicate samples belonging to the Southern clade. Blue circles represent the Northern clade. Circles with white dots denote samples from Kuchta et al. (2018). The species’ known range is depicted in red in the inset.
Early genetic studies using allozymes posited that P. punctatus is closely related to P. wehrlei Fowler and Dunn, 1917, from which it diverged during the Pleistocene (Highton, 1972; Highton, 1995). Together the two species comprised the P. wehrlei species complex. A recent molecular genetic study, however, revealed that P. wehrlei is represented by several distinct genetic lineages that originated in the Middle Miocene, with P. punctatus deeply nested within the complex (Kuchta et al., 2018). These patterns were confirmed using data from restriction site-associated DNA sequencing (RADseq), with several distinct lineages elevated to species status (Felix et al., 2019). Of the species in the complex, only P. punctatus is restricted to high elevations. In a previous study (Kuchta et al., 2018), samples from this species collected from several isolated mountains recovered two main mitochondrial lineages that spanned seemingly unsuitable habitat, indicating that disjunct populations may not be genetically differentiated.
Using these studies as a foundation, we assessed genetic structure across the range of P. punctatus to determine if populations inhabiting unsampled isolated mountaintops represent additional genetic lineages. We then explored the genetic data to ascertain the influence of Pleistocene climate fluctuations on P. punctatus populations by estimating divergence times and population size changes with molecular clock-based analyses. Finally, we used results from these analyses to generate palaeodemographic hypotheses for the species’ Pleistocene history, which we tested using Approximate Bayesian computation.
Materials and methods
Sampling and molecular techniques
We collected 72 tail tips from P. punctatus, representing 25 general sites, throughout the species’ range (Figure 1; Table 1) using nighttime visual encounter surveys (Flint and Harris, 2005) and by flipping rocks and cover objects. Sterilized razors and scissors were used to remove 1–2 cm tail tips from each animal before they were released where found. Tail clipping has been demonstrated to be a low-impact method for collecting tissue samples from salamanders (i.e. Polich et al., 2013). Tail tips were stored in 95% ethanol at 20°C until DNA extractions were performed using a DNeasy Tissue Kits (Qiagen, Valencia, CA, USA). We amplified and sequenced regions of mitochondrial genes coding for cytochrome b gene (Cytb) and NADH dehydrogenase 4 (ND4), as well as the nuclear gene coding for glyceraldehyde-3-phosphate dehydrogenase (GAPD). Primers Pglut-F1b and PThr-R2b were used to amplify a 1072 bp fragment of Cytb. ND4(F) and Ephist primers were used to amplify a 655 bp region of ND4. Primers GAPD-F and GAPD-R were used to generate a 594 bp of GAPD. Amplified PCR products were purified using ExoSAP-IT (GE Healthcare, Piscataway, NJ, USA) and sent to the DF/HCC DNA Resource Core (Harvard Medical School, Boston, MA, USA) for bidirectional sequencing. Primer sequences and citations are provided in Table S1. We edited the double-stranded DNA fragments manually in Geneious v.7.1.9 (Biomatters Ltd, Auckland, New Zealand), and aligned each gene separately in Geneious using MUSCLE (Edgar, 2004). As an outgroup, we also collected a tail tip from P. wehrlei, and sequenced both mitochondrial markers.
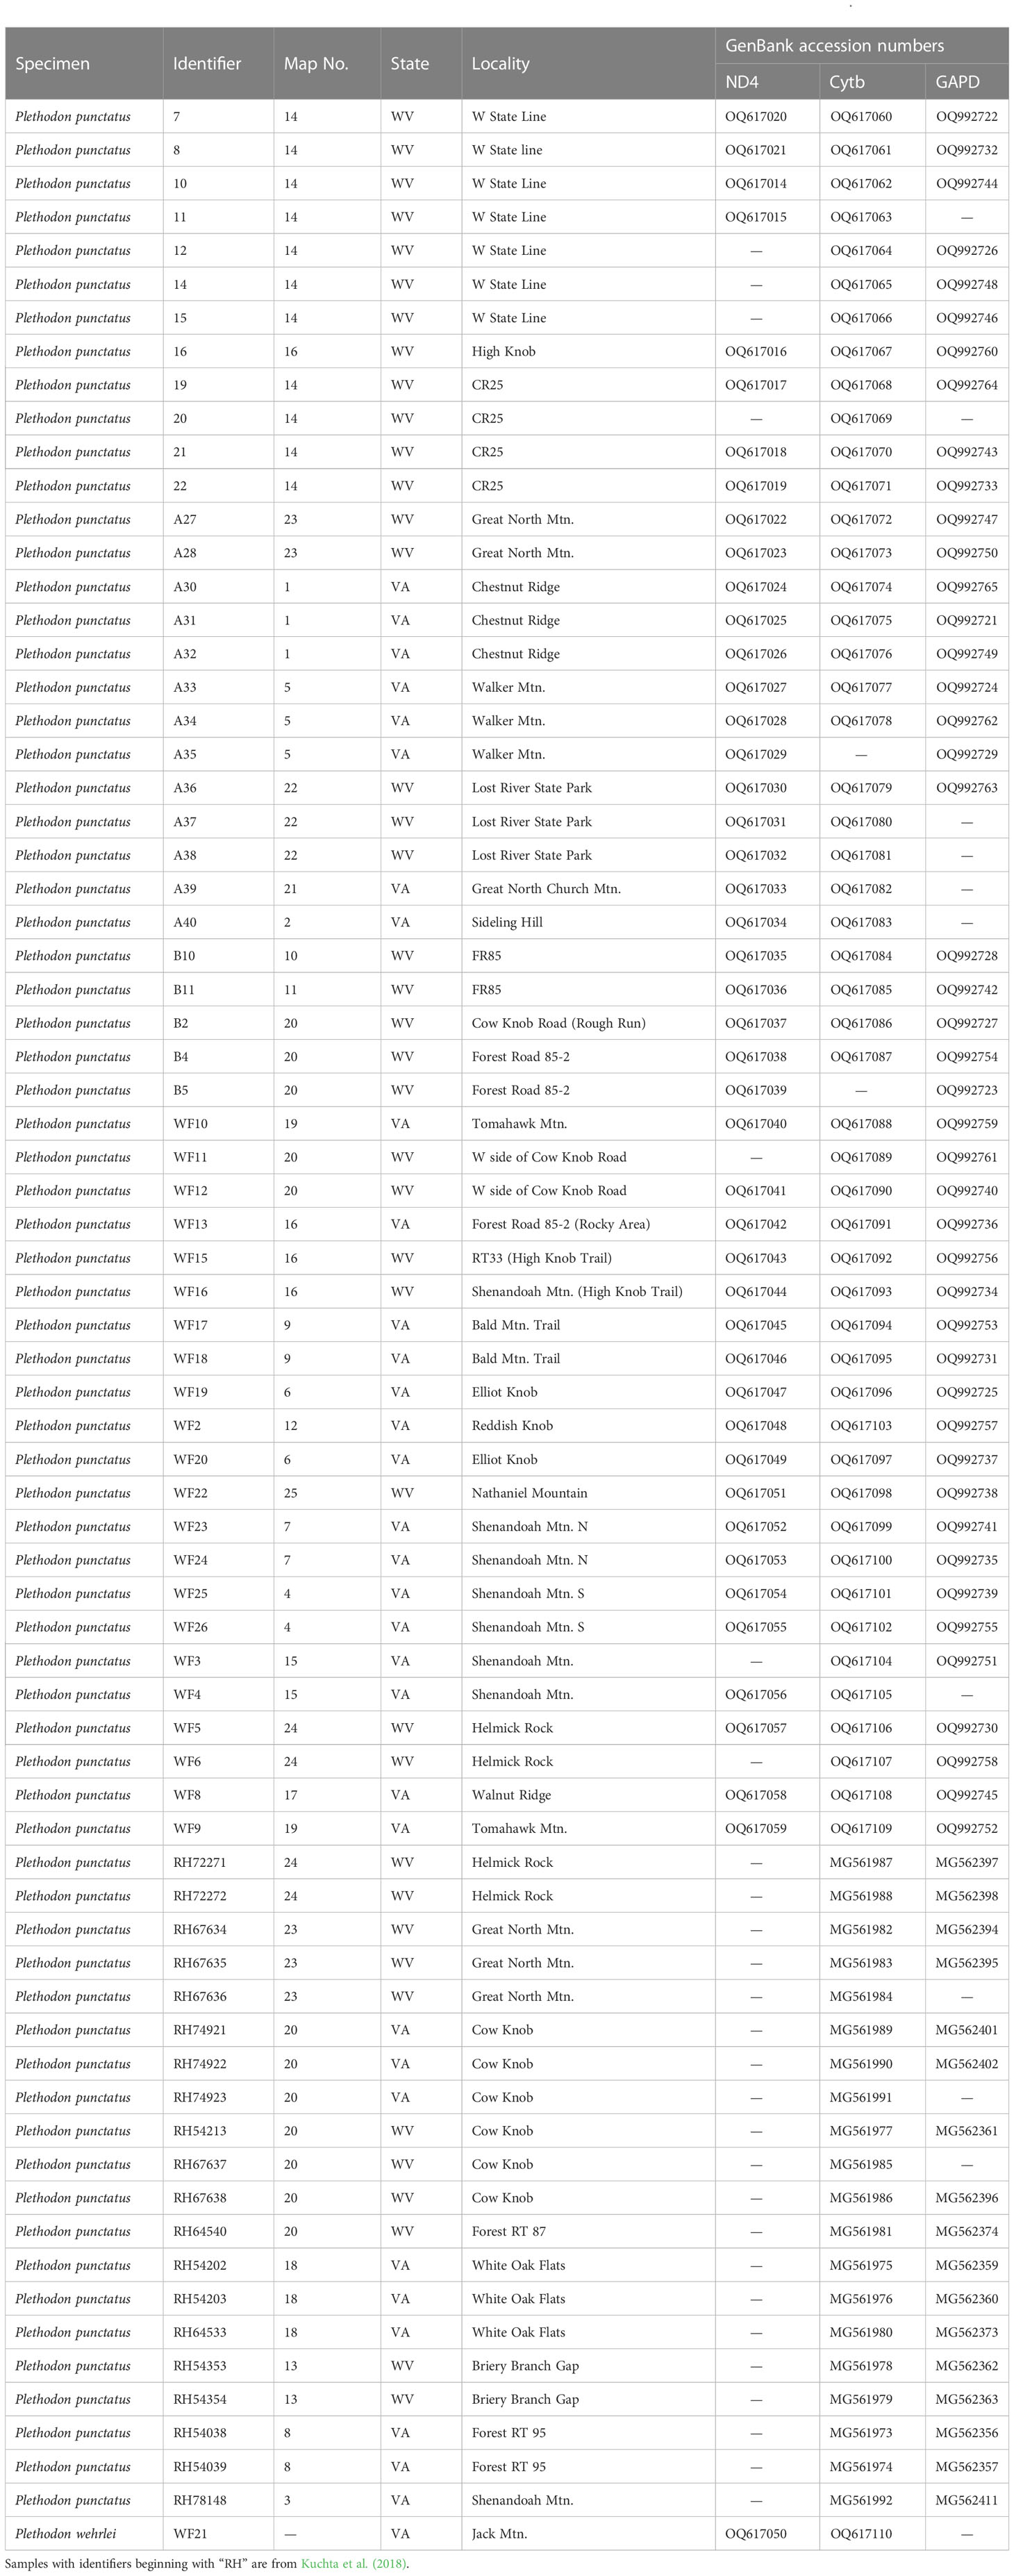
Table 1 Sampling localities, clade designations, and GenBank accession numbers for Plethodon punctatus samples in Figure 1.
The new data consisted of 51 Cytb sequences, 46 ND4 sequences, and 45 GAPD sequences. These were combined with recently published Cytb data (Kuchta et al., 2018) to generate a final data set consisting of 72 samples of P. punctatus, plus the individual outgroup sample. Final alignment lengths were 1,072 bp for Ctyb, 655 bp for ND4, and 594 for GAPD. The GAPD alignment did not contain any heterozygous sites. All sequences have been accessioned in GenBank (Table 1).
Phylogenetics and divergence dating
Phylogeny and divergence dates were simultaneously estimated for 77 individuals using all three gene datasets in a concatenated 2,321 bp alignment with Bayesian inference analysis conducted in BEAST v. 1.10.4 (Drummond et al., 2012). We calculated the best-fit substitution models and partitioning schemes using PartitionFinder2 (Lanfear et al., 2016) for the ingroup samples, which indicated the alignment should be partitioned by gene (but not codons) with the following substitution models: GTR+G for Cytb, GTR+I for ND4, and HKY for GAPD. We used these models, a lognormal relaxed clock for each gene, and the Coalescent constant size tree prior to generate an.xml file in BEAUTi (BEAST package). We calibrated the analysis with a normal clock rate prior and a mean rate (ucld.mean) of 0.00623 and standard deviation (ucld.stdev) of 0.00149 for the Cytb locus, identical to studies on related plethodontids (Kuchta et al., 2016; Kuchta et al., 2018). This rate assumes a crown age of 66 Ma for Plethodontidae, which is based on the oldest known fossil of the presumed sister family Amphiumidae (Gardner, 2003; Wiens et al., 2006). We ran the.xml file in BEAST as two independent Markov Chain Monte Carlo (MCMC) runs each conducted for 100 million generations and sampled every 10,000 generations. We verified stationarity and convergence of Markov chains and appropriate effective sample sizes in Tracer v.1.7 (Rambaut et al., 2018). The two runs were combined, and we rendered a maximum clade credibility tree using TreeAnnotator (BEAST package) and visualized the tree in FigTree v.1.4.4 (http://tree.bio.ed.ac.uk/software/). We assessed the phylogenetic position and divergence dates for P. punctatus within the P. wehrlei species group in an additional, broader BEAST analysis using a combination of Cytb data from our study and Kuchta et al. (2018). We used identical parameters for this analysis, except two independent MCMC analyses were run for 60 million generations and sampled every 6,000 generations.
Haplotype networks
We explored relationships among haplotypes by creating simple (ϵ = 0) median-joining networks in POPART v.1.7.2 (Leigh and Bryant, 2015) for all three gene partitions. The software omits all sites with missing data, so the Cytb alignment was trimmed by removing 45 bp from the 5’ end and 69 bp from the 3’ end, resulting in 958 bp alignment. Six samples that still contained missing data were removed from the Cytb alignment prior to analysis. One sample with missing data from the ND4 alignment. No trimming was required for the ND4 and GAPD alignments. The median-joining approach is ideal for intraspecific haplotype comparisons because it favors short connections and combines minimum-spanning trees into a single network. Individual haplotypes were assigned to the two clades identified in the phylogenetic analyses (Southern and Northern clades), and we colorized nodes in each network by clade designation.
Demographic history
We calculated molecular diversity statistics, such as nucleotide diversity, and tested for evidence of recent demographic changes using Tajima’s D (Tajima, 1989) and Fu’s FS (Fu, 1997) with the mitochondrial data in Arlequin v.3.5 (Excoffier et al., 2005). Significance of Fu’s FS and Tajima’s D values were assessed using 5,000 coalescent simulations. Several samples with incomplete sequences were omitted from these analyses.
In addition, we inferred changes in effective population size for the Southern clade (see Results) using the Bayesian skyline method (Ho and Shapiro, 2011) implemented in BEAST. Time and population size were calibrated using the same substitution models and mutation rates as the divergence dating analysis. Analyses were run for 50 million steps, sampled every 5,000 steps. We let the software automatically optimize all operators. Effective sample size (ESS) values were low for multiple runs, so we re-ran the analysis using the simpler HKY+I model. Results of the analyses were visualized using Tracer. The Northern Clade did not possess enough variable sites to inform coalescent-based analyses, so we omitted it from this analysis.
Palaeodemographic hypothesis testing
We tested different demographic scenarios using Approximate Bayesian Computation (ABC) implemented in DIYABC v.2.1.0 (Cornuet et al., 2014). The software uses coalescent-based simulations with random draws from prior distributions to generate simulated datasets with the same number of samples and loci as the observed data. Similarity is calculated using Euclidean distances between summary statistics from the simulated and observed datasets (Beaumont et al., 2002). We used the Cytb data set, the partition with the most samples, in DIYABC to test nine scenarios in two different series that represent various combinations of bottlenecks and expansions for the Northern and Southern clades (Figure 2). Large numbers of scenarios can negatively influence ABC results (Pelletier and Carstens, 2014), so we performed the analyses in two series, where the best-fit scenario in the first series was compared against new scenarios in the second series, similar to hierarchical approaches use in other studies (Stone et al., 2017; Hyseni and Garrick, 2019).
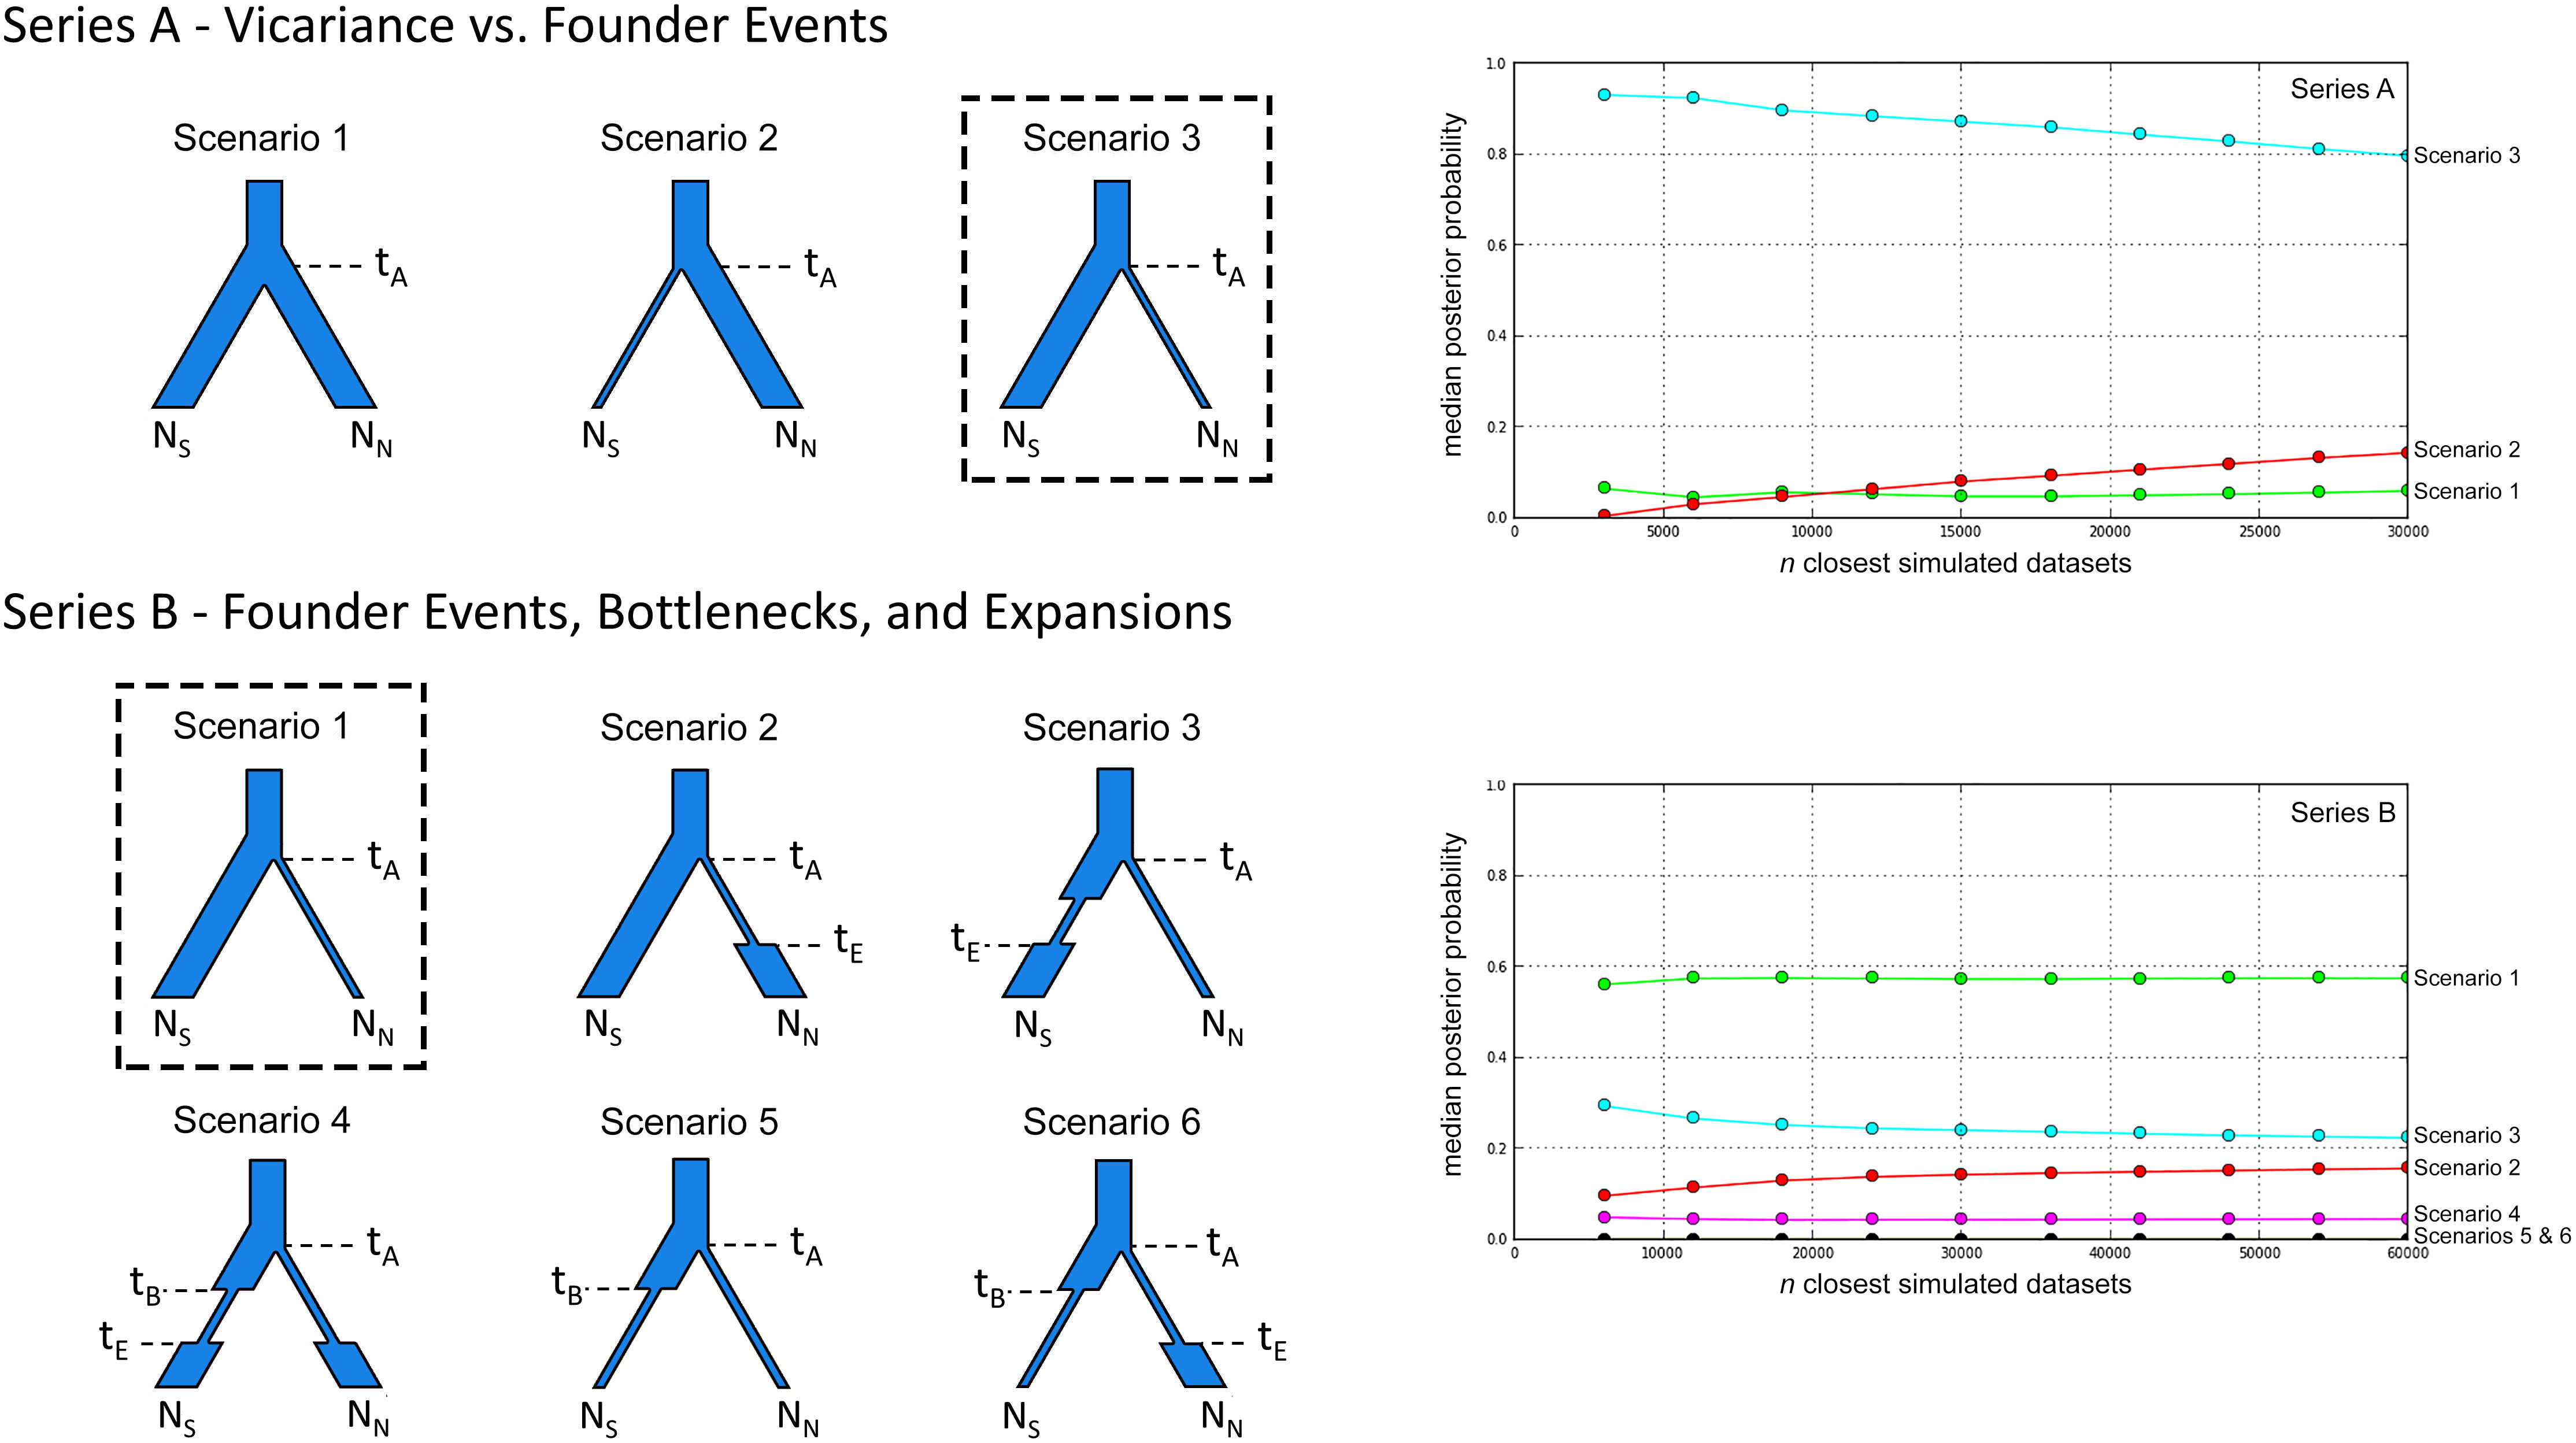
Figure 2 Alternative scenarios for the population history of Plethodon punctatus tested using DIYABC. Branch widths are relative to population size. Times and population size changes are indicated with dashed lines. The effective population sizes of the Southern and Northern clades are represented by NS and NN, respectively. The best-fit demographic scenario is outlined for each series. Logistic regression results comparing the posterior probabilities of the different scenarios used in each series of DIYABC analyses are presented on the right. The number of simulated datasets (n) closest to the observed data are presented on the x-axis.
The first series compared a scenario of vicariance (Scenario 1) to two scenarios with founder events; one where members of the Northern clade founded the Southern clade (Scenario 2), and the other with the Northern clade founded by members of the Southern clade (Scenario 3). We then compared the scenario with the strongest support to five similar scenarios with different combinations of bottlenecks and expansions. We chose to include these because the BEAST analysis indicated the Northern and Southern clades shared a common ancestor in the Middle Pleistocene, so we wanted to know if fluctuating Pleistocene climates influenced population sizes. Because of the significant phylogenetic differentiation between the two clades at the Cytb locus (Figure 3), and their lack of any observed geographical overlap (Figure 1), we did not consider gene flow between populations in our simulations.
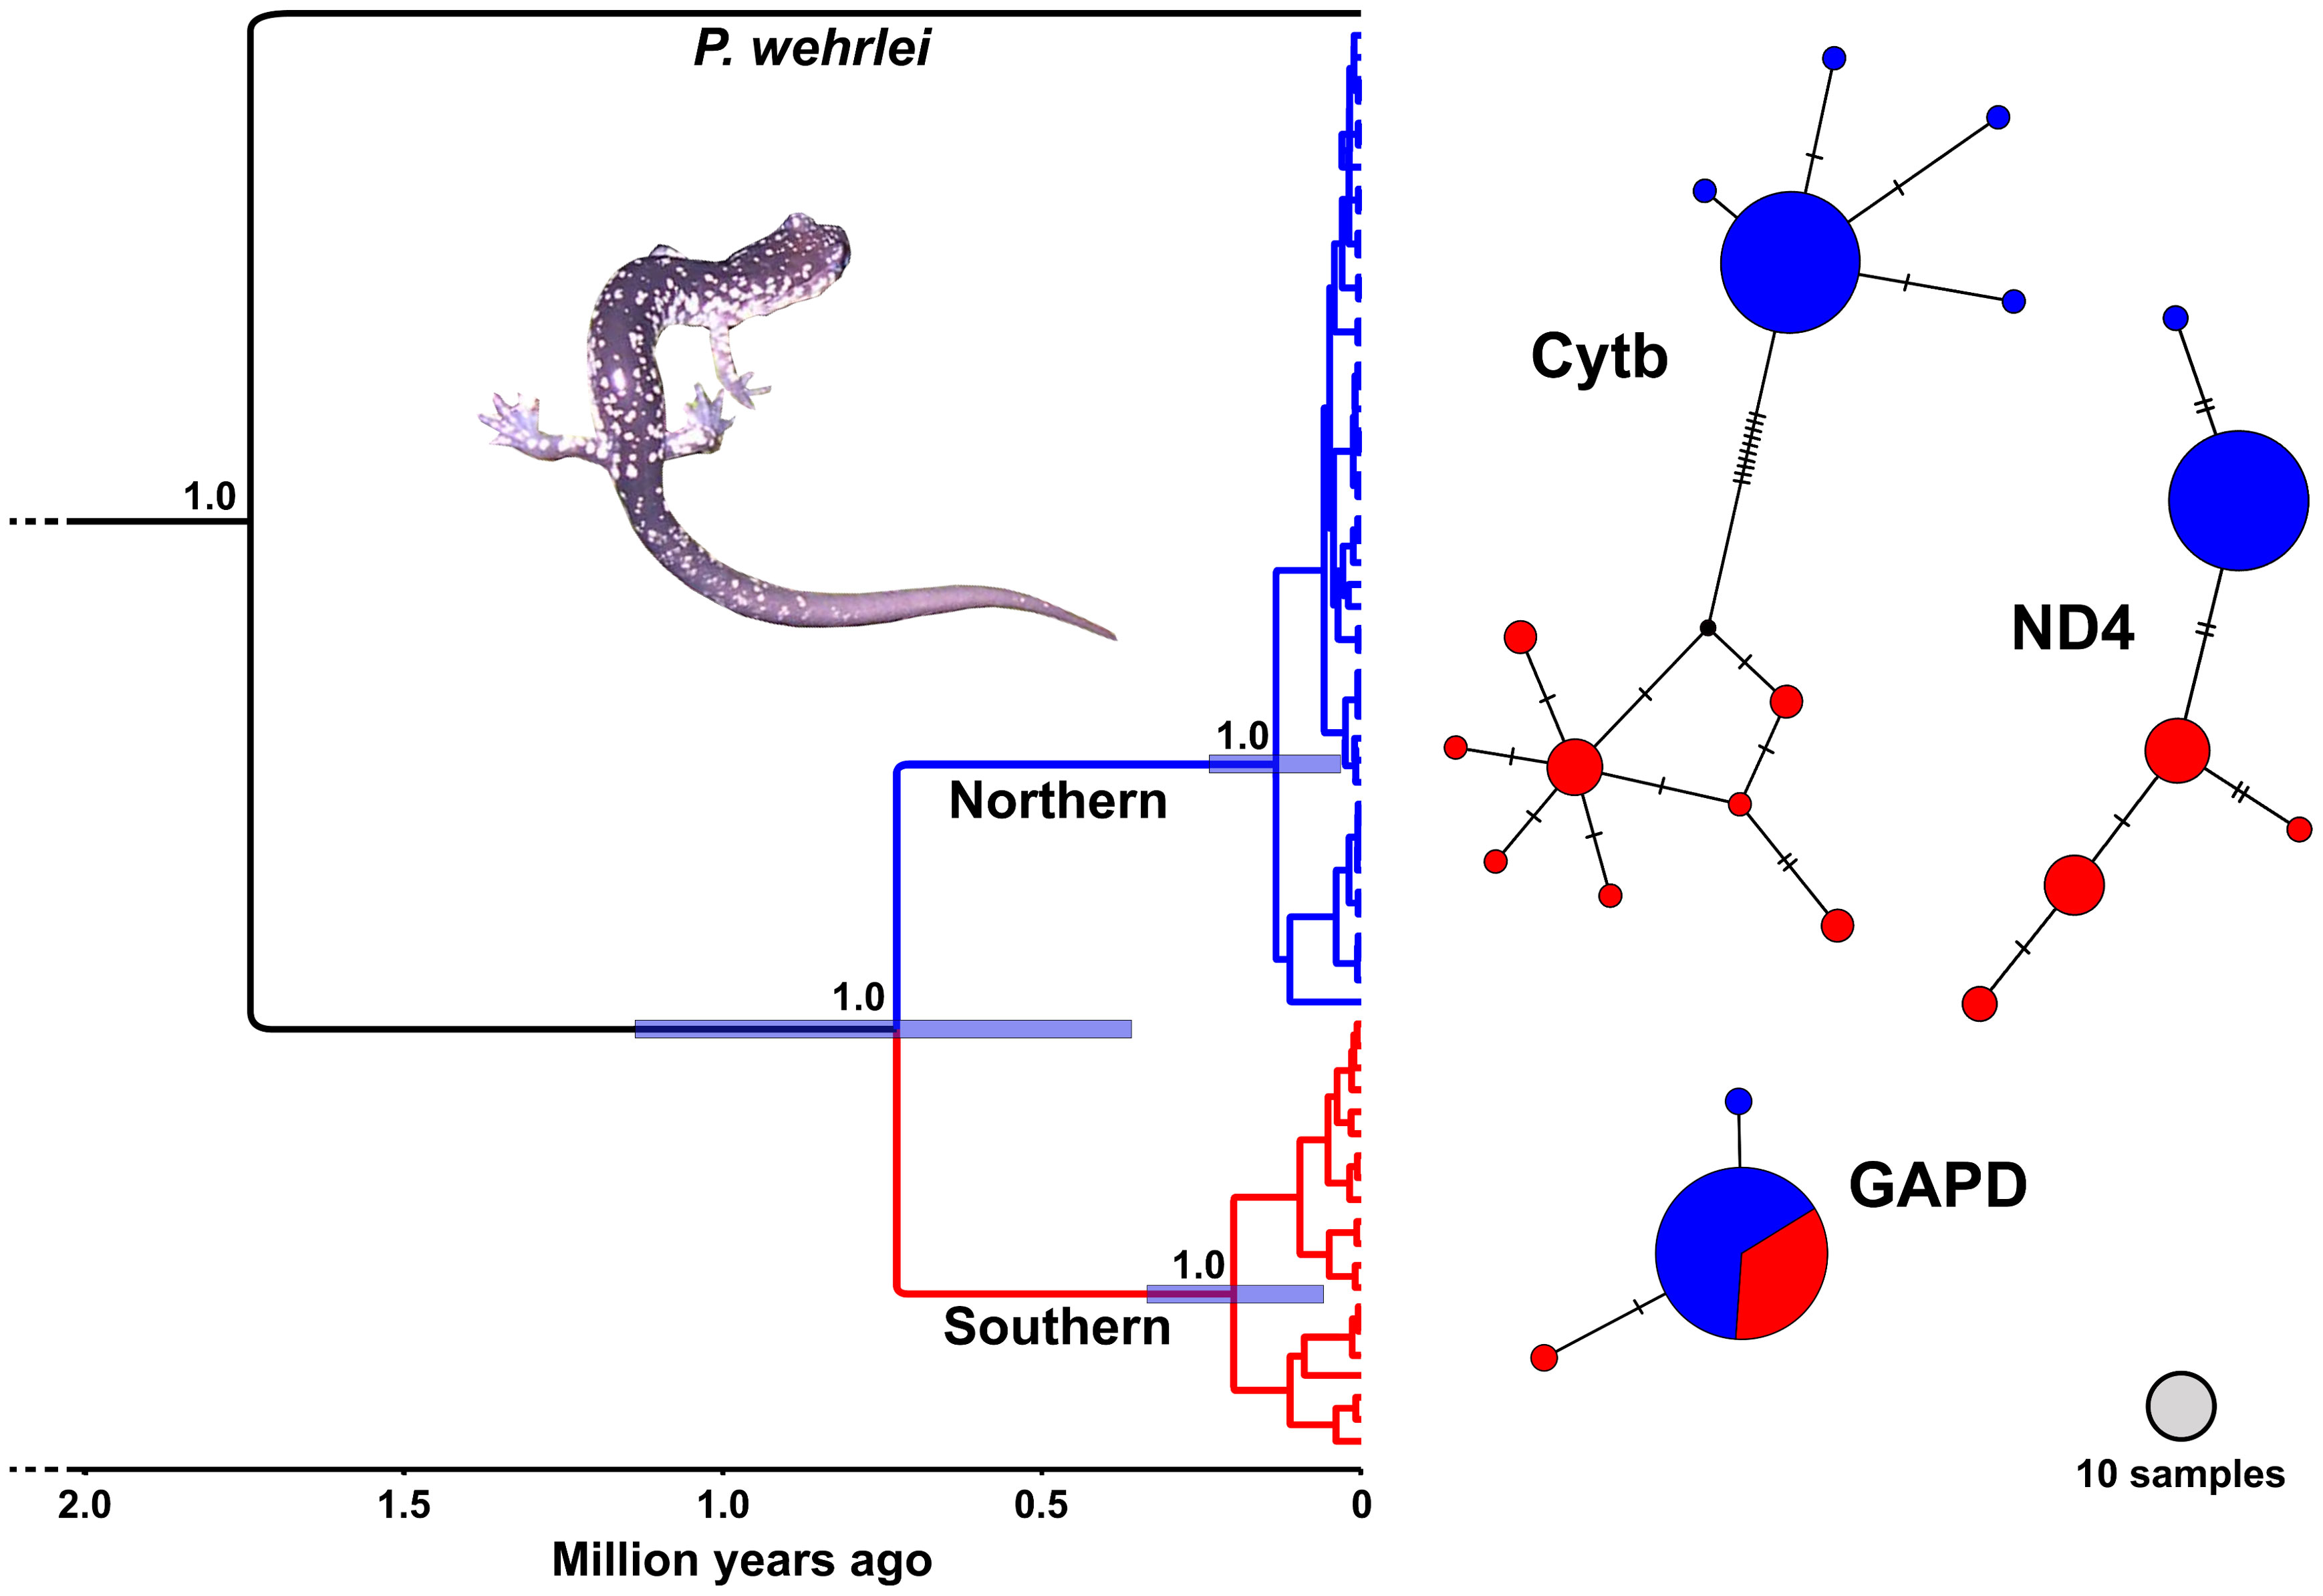
Figure 3 BEAST chronogram (left) and haplotype networks (right) generated using genetic data from Plethodon punctatus. The chronogram was generated using a concatenated 2,321 bp alignment partitioned by gene. Numbers at nodes indicate posterior probabilities. Bars represent 95% HPD ranges for the three main nodes. Haplotype networks were generated using a Cytb alignment of 59 samples trimmed to 958 bp, a 655 bp ND4 alignment of 49 samples, and a 594 bp GAPD alignment of 45 samples.
Before comparing the scenarios in both series, we first conducted an analysis with only the simple vicariance model using broad priors. We conducted a pre-evaluation of prior and summary statistics using the first series of scenarios with narrower priors as suggested by the previous run (Table S2). We then compared scenarios in each series using the narrow priors and 10 of the 13 possible summary statistics based on results of the pre-evaluation.
We used DIYABC to generate one million simulations per scenario for each series, as suggested by Cornuet et al. (2014). We used the same mutation rate as the BEAST analysis but scaled to a generation time of 4.5 years. Plethodon punctatus are known to reach sexual maturity in 4 years (Tucker, 1998) so we used 4.5 years as the generation time to account for the fact that not all individuals are likely to produce offspring the first year they are sexually mature. We applied a uniform prior distribution to the mutation rate and ran analyses using the HKY substitution model. We estimated the posterior probabilities for modeled scenarios by using DIYABC to run logistic regression on linear discriminant analysis components of the summary statistics (Estoup et al., 2012). One percent of simulated datasets possessing the smallest Euclidian distances to the observed dataset were used for this approach. Goodness-of-fit between the simulated and real data was then assessed using principal component analysis (PCA) in the software.
Species distribution modeling
We used coordinates from locations where P. punctatus have been collected, along with climatic layers, to develop species distribution models (SDMs). We chose to exclude location data associated with museum samples and literature records, which are sometimes vague and can have georeferencing errors, and conducted the analyses using coordinate data we collected in the field. Furthermore, our sampling covered the entire known range of the species and using a reduced data set reduces the chances of overfitting the models to clustered occurrence records.
We constructed the SDMs using bioclimatic data representing current (1950–2000), Middle Holocene, Last Glacial Maximum (LGM), and Last Interglacial (LIG) periods, downloaded from the WorldClim database (Hijmans et al., 2005). Layers were downloaded at 30’ (ca 1 x 1 km) resolution for all but the LGM data, which were available at 2.5′ (4 x 4 km) resolution. We clipped the layers to an area encompassing the entire known range of P. punctatus, as well as adjacent, potentially accessible Appalachian habitats (between 36.2–40.5° N and 77.2–82.0° W).
We used Maxent v.3.4.1 (Phillips et al., 2006) to construct a present-day logistical SDM. We then projected it to the three paleo climatic conditions. We ran the analysis using cross-validation with five replicates (equivalent to 20% testing), the maximum number of iterations set to 10,000, a random seed, and application of the fade by clamping. We displayed the geographic distribution of climatic suitability in ArcGIS v.10.1 (ESRI, Redlands, CA, USA).
Results
Phylogenetics and divergence dating
Results from the BEAST analysis using the three gene data identified two geographically structured clades with varying levels of support (Figure 3.). We refer to these as the Southern and Northern clades, which do not overlap, but appear to come in contact on the Shenandoah Mountain near Reddish Knob (Figure 1). The Southern clade consists of 20 individuals representing 17 different haplotypes distributed from Chestnut Ridge, VA to near Reddish Knob, WV. The Northern clade is comprised of 55 individuals and 27 haplotypes, found from Reddish Knob, WV to South Branch Mountain, WV (Figure 1). Molecular dating estimates using all three genes suggest that P. punctatus and P. wehrlei diverged during the Late Pleistocene (95% HPD = 0.37–1.15 Mya; mean = 0.74 Mya). Each clade also has TRMCA estimate in the late Pleistocene, with estimates for the Southern clade (95% HPD = 350–70 Kya; mean = 211 Kya) slightly older than those for the Northern clade (95% HPD = 250–40 Kya; mean = 145 Kya). The larger analysis of Cytb from the entire P. wehrlei species complex produced similar divergence date estimates (Figure S1). In this analysis, P. punctatus was positioned as sister to three P. wehrlei haplotypes, which is potentially the result of an ancient introgression event (see Discussion).
Haplotype networks
Haplotype network analyses using mitochondrial markers each showed a distinction between the Southern and Northern clades, with no shared haplotypes. Southern clade portions of these networks were more diverse, whereas most individuals shared the same haplotype in the Northern clade sections. The two clades did not segregate in the nuclear network, in which members of both clades shared the most common haplotype. None of the networks formed a clear star-shaped pattern, which can be indicative of recent spatial or demographic expansion. However, the nuclear network and the Northern clade sections of the mitochondrial networks all revealed a common haplotype shared by the large majority of individuals with one or two uncommon haplotypes unique to only a few individuals.
Demographic history
Haplotype diversity was three times greater for the Southern than the Northern clade for both mitochondrial genes. Nucleotide diversity was an order of magnitude greater for the Southern clade (Table 2). Tajima’s D was negative for all four tests, but only significantly negative for the Northern Clade. Fu’s FS was also negative in all assessments, but only significantly negative for the Northern clade with the Cytb data set (Table 2). Significantly negative D and FS values indicate that the null hypothesis of neutrality can be rejected, and that populations have undergone demographic expansion. The Bayesian skyline plot for the Southern clade depicts a slow and slight increase in effective population size beginning about 58 Kya, but constant population size over this time period cannot be rejected due to wide confidence intervals (Figure S2).
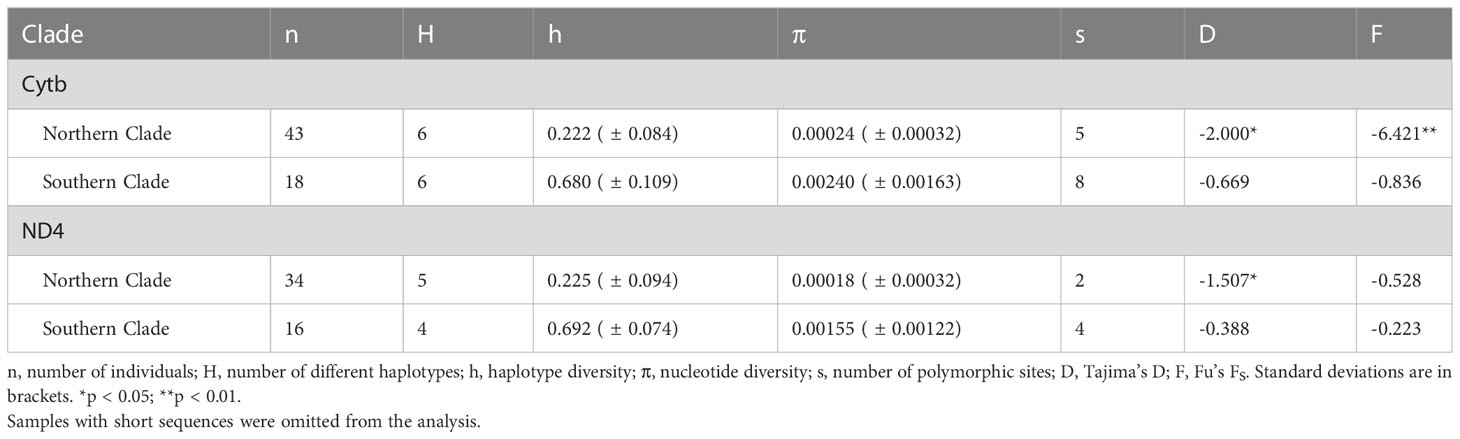
Table 2 Summary statistics for Cytb (1,072 bp) and ND4 (655 bp) data for two main clades of Plethodon punctatus.
Palaeodemographic hypothesis testing
In our first ABC analysis (Series A), Scenario 3 was identified as the most likely. Our second ABC analysis (Series B) identified the same scenario as the most likely, this time called Scenario 1 (Figure 4; Table S4). In this scenario, the Southern and Northern clades are estimated to have shared a common ancestor 662 Kya when the Northern clade was founded by members of the Southern clade. Effective population sizes for each clade are similar, with the mean estimate for the Northern clade (N = 227,000) slightly higher than the Southern clade (N = 202,000) (Table S3).
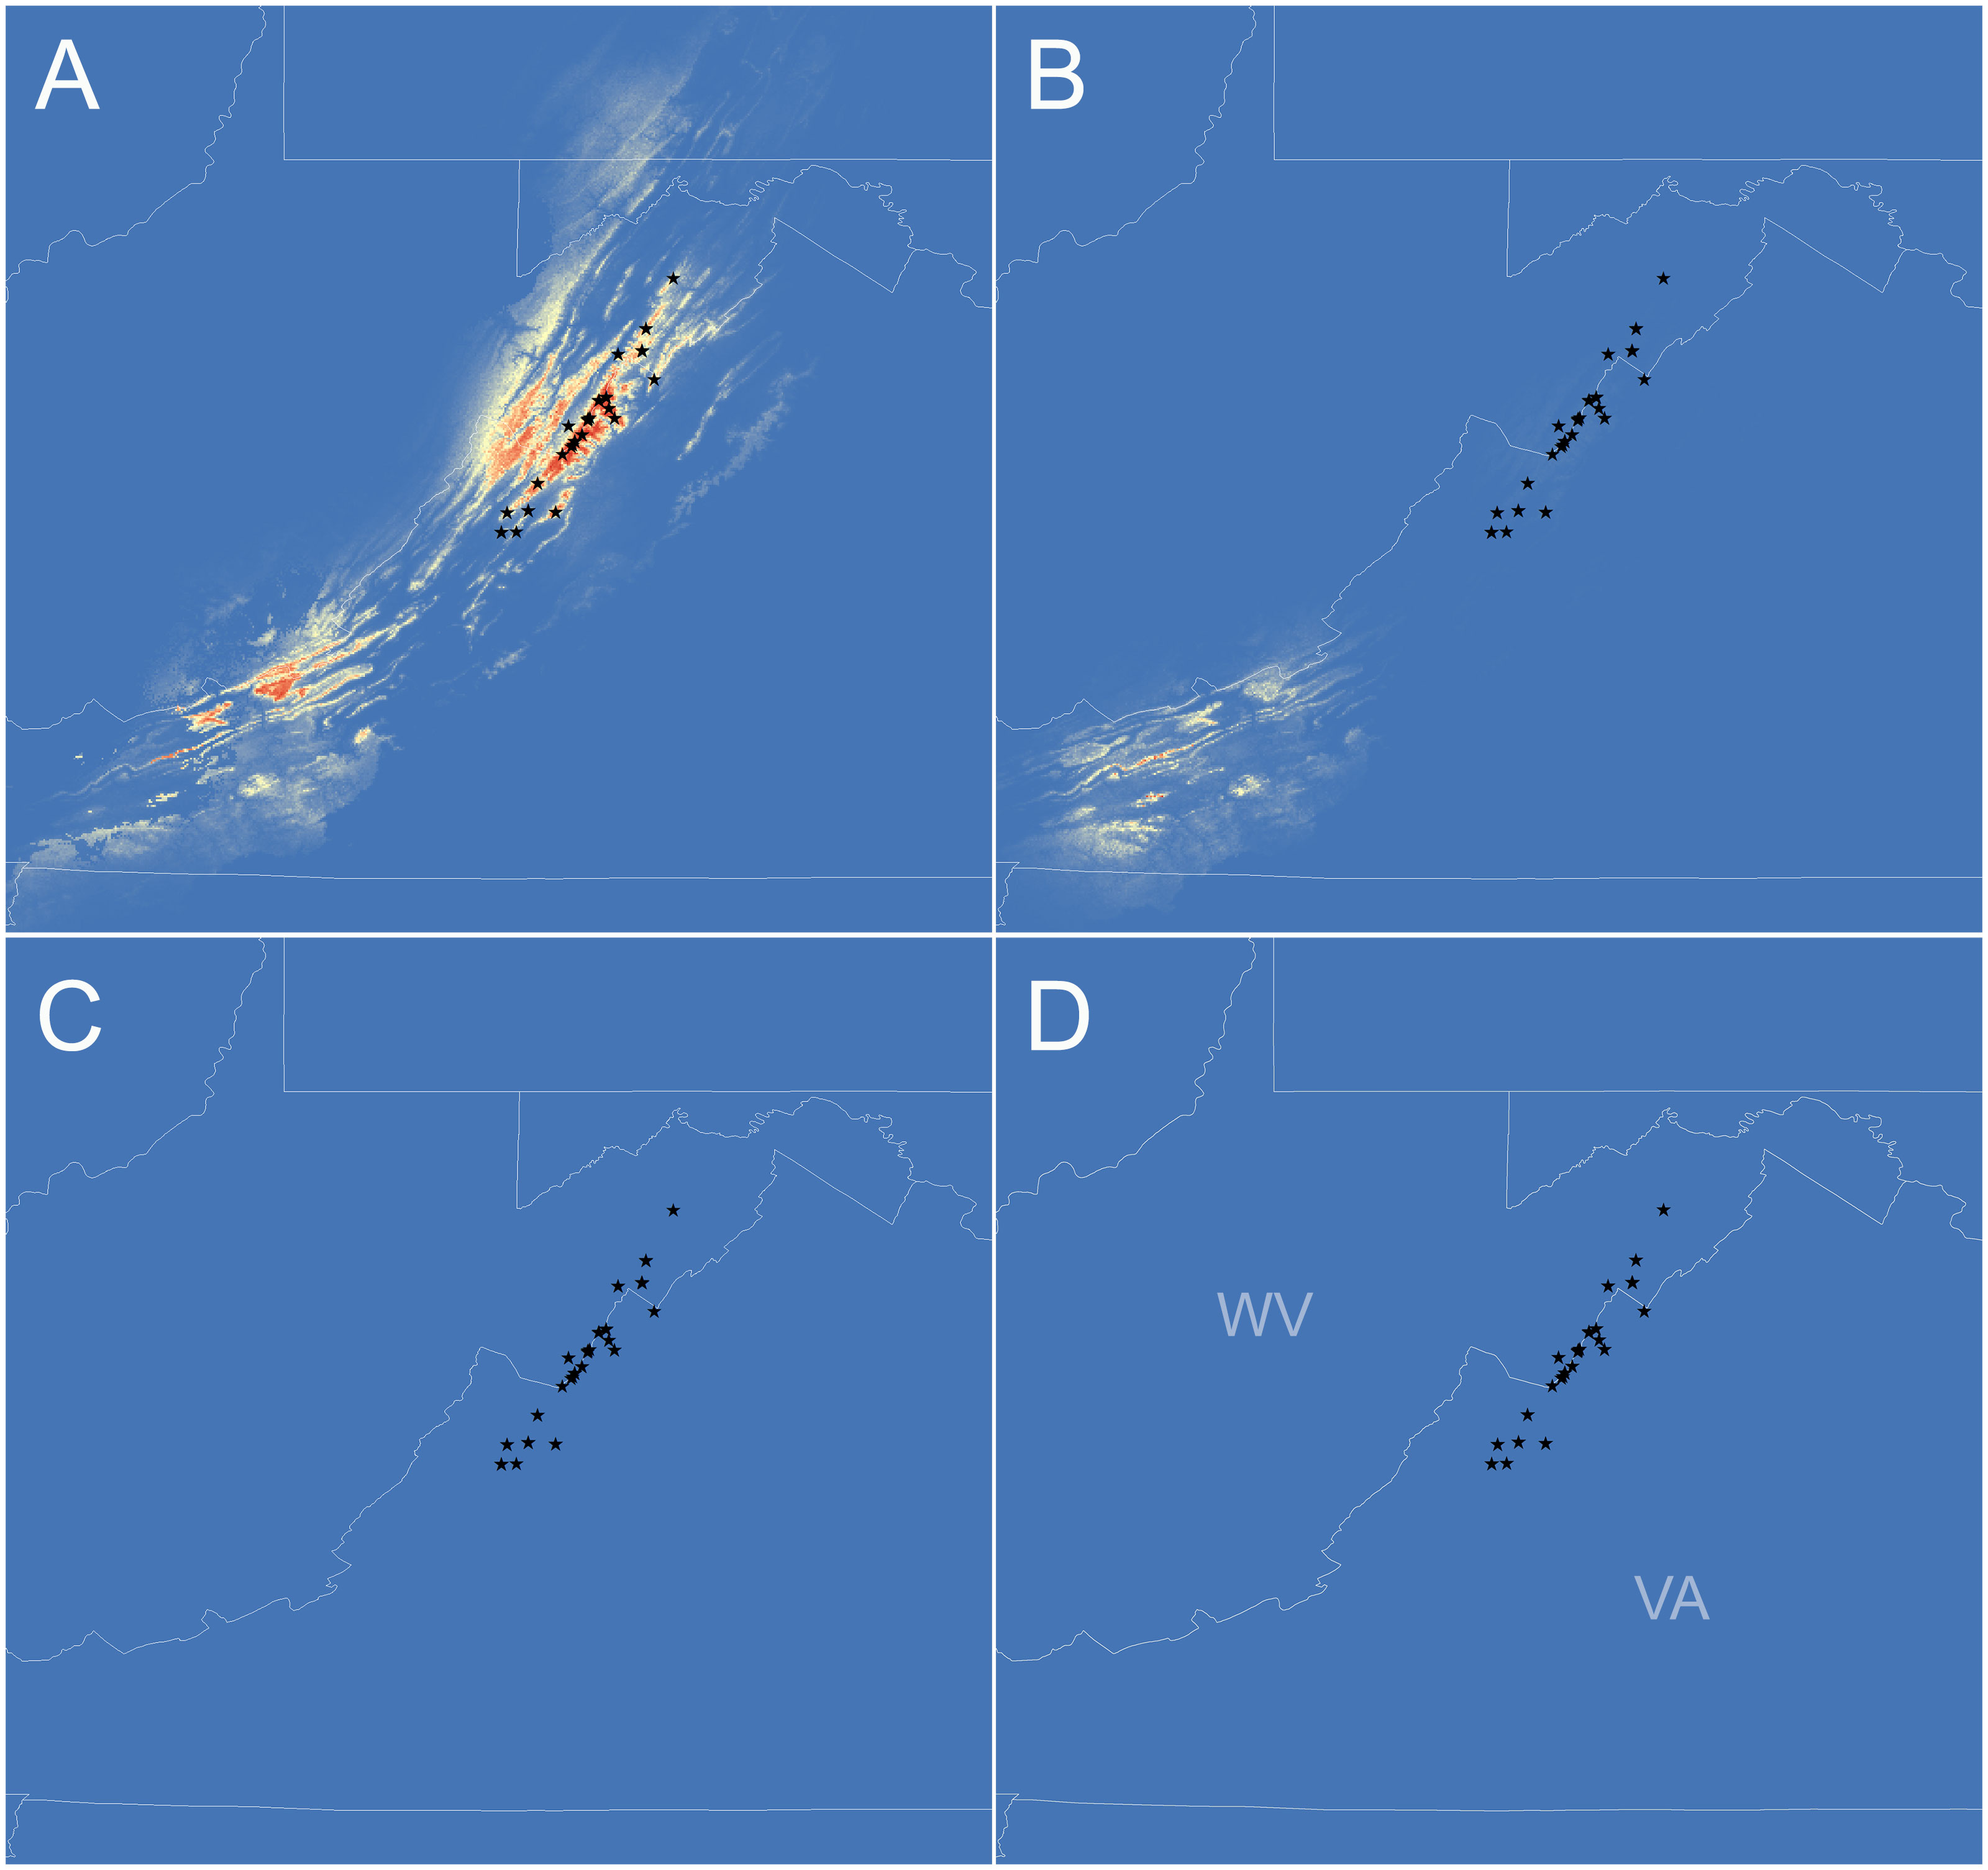
Figure 4 Species distribution models for Plethodon punctatus developed under current (A), Holocene (B), last glacial maximum (LGM) (C), and last interglacial (LIG) (D) climatic conditions. Red to yellow shading indicates areas with suitable climate. Black stars represent sample sites used to generate the models.
Species distribution modeling
The species distribution model performed significantly better than random (AUC score = 0.98). When projected onto current climatic conditions, the model identified suitable habitats arranged in two clusters. The northernmost cluster of suitable habitats is found throughout the known range of P. punctatus in the Ridge and Valley Province, to the west of the known range in high elevations of the Allegheny Plateau Province. The other cluster to the southwest occurs in high elevations of the Allegheny Plateau and Ridge and Valley Provinces in southern West Virginia and western Virginia. The Holocene model includes the southern cluster of suitable habitats, but somewhat reduced. The northern cluster of suitable habitats does not occur in the Holocene model. The LGM and LIG models did not identify any suitable habitat for P. punctatus. All four model projections are presented in Figure 4.
Discussion
General phylogeographical patterns
The distribution of Plethodon punctatus is centered on Shenandoah Mountain, but extends into nearby and seemingly isolated montane habitats as well. Several of these peripheral populations were sampled and sequenced in previous studies (Kuchta et al., 2018; Felix et al., 2019), and despite their insularity, they did not represent unique lineages. Our sampling of several additional isolated populations–such as Elliot Knob, Sideling Hill, and South Branch Mountain (Figure 1)–did not uncover any new genetic lineages either. Instead, results suggest P. punctatus is comprised of two clades: a Southern clade ranging from Chestnut Ridge in Bath County, VA (Site 1) to near Reddish Knob on the West Virginia and Virginia border on Shenandoah Mountain (Site 11), and a Northern clade occurring from Reddish Knob (Site 12) to South Branch Mountain in Hampshire County, WV (Site 25). Interestingly, the range of each clade spans presumably unsuitable low-elevation habitats. Southern clade samples, for instance, are found in different mountain ranges that flank Deerfield Valley in Augusta County, Virginia (Figure 1). Samples from some of the smallest fragments of mountain habitats found in and adjacent to Deerfield Valley [Walker Mountain (Site 1), Chestnut Ridge (Site 2), and Sideling Hill (Site 5)] possessed the most differentiated haplotypes in the Southern clade. Consequently, the valley appears to be influencing phylogeographic structure in the Southern clade to some extent. The Northern clade samples also span presumably unsuitable habitats, but haplotypes are less differentiated. A disjunct sample from South Branch Mountain, for instance, is almost 27 km north of any other Northern clade populations, yet possesses a haplotype shared by individuals across the northern half of the species’ range.
Perhaps the most striking result from our analyses is the two clades are not allopatric and probably come into contact in the Reddish Knob area of Shenandoah Mountain. Although we sampled this area heavily, none of the sites we surveyed contained both haplotypes, but they came close. The northernmost Southern clade haplotype was sampled less than 1 km away from the southernmost Northern clade haplotype. There is not disjunction in suitable climate between these sites according to the current SDM (Figure 4A). More detailed sampling could elucidate whether the two clades do make contact, but we find it interesting that the clades are not both found throughout the Shenandoah Mountain range. What could have caused this lack of shared haplotypes?
We predict the observed pattern can be explained by two factors, recent (postglacial) colonization and high-density blocking. Phylogeographical analyses of taxa from temperate latitudes often reveal species colonized new areas as climates warmed following the last glacial period (i.e. Hewitt, 1999; Hewitt, 2000; Hewitt, 2004). Expansion routes are often inferred by patterns of genetic diversity, as diversity is expected to be lower in areas that have been recently colonized. In P. punctatus, Northern clade samples from the Reddish Knob area show low genetic diversity, supporting the hypothesis that the area was recently colonized. If recent enough, then there might not have been adequate time for haplotypes from the two mitochondrial clades to mix along the contact zone. Alternatively, density-dependent processes may be working synergistically to prevent or slow this process.
Specifically, high-density blocking is a process where dispersers are inhibited from colonizing areas because they are already densely occupied (Waters et al., 2013). At the interspecific level, this process has been referred to as “preemptive occupancy” and appears common in salamanders (Good & Wake, 1992; Jockusch & Wake, 2002; Wake, 2006). The entire Shenandoah Mountain ridgeline is likely suitable habitat for P. punctatus (Figure 4), so both clades could have expanded their ranges progressively along the ridgeline until they came into contact near Reddish Knob. They may then have been unable to continue colonization because each clade had already densely populated the area. Or, as in other studies of salamanders, the mitochondrial clades could be connected by nuclear gene flow (i.e. Pereira et al., 2016; Waldron et al., 2019). Unfortunately, the GAPD data from P. punctatus were not variable enough to explore these ideas. Future studies using techniques from genomics could provide further insight.
Timing of diversification and expansion
Recent phylogenetic analyses found that P. wehrlei represents several cryptic species, with P. punctatus deeply nested within the nominotypical P. wehrlei (Kuchta et al., 2018; Felix et al., 2019). Intriguingly, P. punctatus appears to be sister to a P. wehrlei lineage found just west of the P. punctatus Southern Clade. Salamanders from three sites in Bath and Highland counties of Virginia and Pocahontas County of West Virginia [referred to as populations 10–12 in Kuchta et al. (2018)] belong to this sister lineage. Analyses of nuclear DNA aligned these specimens with P. wehrlei, which corroborates their P. wehrlei phenotype. Accordingly, populations 10–12 might represent P. wehrlei with historically introgressed mtDNA from P. punctatus, as suggested by Kuchta et al. (2018). If this is the case, then our molecular clock estimates place this introgression event in the Middle Pleistocene (2.18–0.75 Mya; Figure S1), perhaps while the two species made contact as their distributions shifted in response to fluctuating climates.
If we do not consider the potentially introgressed populations (pops 10–12), then our study suggests P. punctatus diverged from P. wehrlei sometime between the Late Pliocene and Middle Pleistocene (2.84–1.04 Mya; Figure S1). Northern and Southern P. punctatus clades are estimated to have then diverged in the Middle to Late Pleistocene (1.30–0.40 Ma; Figures 3, S2). Given this timeframe, we suspect that two clades diverged when P. punctatus inhabited lower and warmer elevations during glacial maxima. Species distribution modeling supports the idea that climates were not suitable for P. punctatus in its current highland habitats, but also does not reveal any areas that may have been suitable during the Last Glacial Maximum. Instead, the LGM model indicates climate was not suitable for P. punctatus anywhere in the Central Appalachians. If true, then the species must have colonized its current range as climates warmed during the Holocene, and genetic data should contain signatures of the colonization event. Specifically, we would expect genetic diversity to be low in areas that were recently colonized due to the ‘leading-edge’ expansion model (Hewitt, 1999). Under this model, an expansion front would be dominated by recruitment of a subset of genotypes from the leading edge of the source population. Movement of the front would essentially occur as repeated founder events, resulting in diminished genetic diversity in newly inhabited areas.
Lower genetic diversity is precisely what we found in the Northern clade, which had much smaller nucleotide and haplotype diversity values than the Southern clade (Table 2). Additionally, demographic tests using data from the Northern clade support a hypothesis of recent expansion (Table 2), although this result should be interpreted cautiously given limited polymorphic sites. In contrast, models of constant population size could not be rejected for the Southern clade and the Bayesian skyride plot portrays a relatively stable effective population size for the Southern clade over the last 60 Ka (Figure S2; Table 2). As such, the Northern clade probably colonized much of its distribution very recently, maybe following a dramatic range shift during last glacial episode. But where did these two clades come from? Could low diversity in the Northern clade have resulted from a founder event from the Southern clade? Or are the two clades a product of vicariance of a common ancestor?
Approximate Bayesian computation using mtDNA data suggests a palaeodemographic scenario in which Southern clade individuals founded the Northern clade (Figure 2; Table S4). Although additional nuclear data are needed, and patterns only reflect matrilineal history, we hypothesize that the Southern clade may have had a larger distribution that included areas now occupied by the Northern clade. Then, as climates became less suitable, northern populations could have gone extinct while southern populations were able to persist. This would explain the higher genetic diversity and more stable effective population size of the Southern clade. In addition, if a small population of Northern clade individuals was able to persist in or near the mountains north of the Southern clade, then it could have quickly expanded and recolonized habitats as they became available during warmer Holocene climates. High-density blocking would have kept Southern clade individuals from moving north, and the rapid recolonization of northern habitats after the Northern clade bottlenecked would explain its low diversity. However, we found no evidence of divergence between the two clades in the nuclear data that supports this hypothesis.
The fact that mtDNA is haploid, maternally inherited, and usually lacks recombination often results in different phylogeographic patterns than those from the nuclear genome. Thus, several alternative hypotheses could explain the mitonuclear discordance observed in P. punctatus. First, P. punctatus populations could be panmictic across the species’ range and the divergent mtDNA clades are a product of genetic drift. Species with small effective population sizes are more susceptible to the effect of drift. P. punctatus has a small distribution, and although mtDNA can be a poor predictor, our effective population size estimated was well over 400,000 individuals. Second, high-density blocking could be impacting the movement of females more than males, thereby maintaining a sharp mtDNA contact zone despite the exchange of nuclear genes. Finally, and we suspect that this is the case, the two mtDNA clades might reflect real phylogeogeraphic structure also present in the genome, but our nuclear marker was not sensitive enough to detect Pleistocene level divergences. If true, then techniques from genomics, such as analyses of genome-wide SNPs using RADseq (Andrews et al., 2016), should identify two main clades within the species. This approach could also be useful for determining if disjunct populations are genetically differentiated, would allow for assessments of admixture among populations, and could further elucidate routes of population expansion.
Collectively, the results of our study seem to indicate that P. punctatus diverged from P. wehrlei sometime around the onset of the Pleistocene. The species introgressed with a few P. wehrlei populations shortly after (as presented by Kuchta et al., 2018), and then diversified into two mtDNA clades by the Middle Pleistocene. Other than pronounced climate fluctuations, we know of no other Pleistocene events in this area that could have caused vicariance. Therefore, the two clades were likely generated when climate fluctuations shifted the species’ distribution, which caused allopatric divergence and bottlenecking causing a founder event, with subsequent rapid expansion of the bottlenecked population into northern montane habitats throughout the species’ current range. The two clades now meet on Shenandoah Mountain in a tight contact zone with limited exchange of mitochondrial haplotypes, possibly due to high-density blocking.
Conclusions
We used Plethodon punctatus to explore the idea that Pleistocene climate fluctuations impacted phylogeographic patterns of a montane salamander in the Central Appalachians. Results from our phylogeographic analyses and hypothesis testing using Approximate Bayesian computation indicate that the species is comprised of two mitochondrial lineages that diverged when a founder from the southern clade expanded into habitats in the north. Species distribution models showed no suitable climate for P. punctatus in Central Appalachia during the LGM and LIG, indicating that climate might not be the only driver influencing the species’ distribution. Additional research using genomic data such as RADseq would help determine if the mitochondrial lineages should be considered as two separate management units. Although P. punctatus has a small range and is restricted to fragmented mountain habitats, isolated populations do not appear to be genetically divergent.
Data availability statement
The data presented in this study are deposited in the GenBank repository, with accession numbers provided in Table 1.
Ethics statement
The studies involving animals were reviewed and approved by James Madison University Institutional Animal Care and Use Committee.
Author contributions
MG, TP, WF, and VF conceived the ideas and designed methodology; MG, WF, and TP collected the specimens; MG and AP conducted the laboratory work; MG analyzed the data; MG led the writing of the manuscript. All authors contributed to the article and approved the submitted version.
Funding
Funding was provided by the West Virginia Division of Natural Resources, a grant from the Connecticut State University American Association of University Professors (CSU-AAUP), and NSF grant DEB-1754030.
Acknowledgments
Jessica Graham, Joshua Greenwood, Ashley Fisher, Patrick Harmon, and Jeremy Stinson helped in the field. Haley Grimason assisted in the lab. Tereza Jezkova and Guo-Zhang Zhu provided important comments and guidance. Carlos Santibáñez-López assisted with phylogenetic analyses. Two reviewers provided valuable comments that improved the paper. Permits were provided to MG, WF, and TP by the West Virginia Division of Natural Resources. Additional permits the Virginia Department of Game and Inland Fisheries and the United States Forest Service were issued to WF. Methods used in this project were approved by the James Madison University IACUC (A18-12).
Conflict of interest
The authors declare that the research was conducted in the absence of any commercial or financial relationships that could be construed as a potential conflict of interest.
The author MG declared that they were an editorial board member of Frontiers, at the time of submission. This had no impact on the peer review process and the final decision.
Publisher’s note
All claims expressed in this article are solely those of the authors and do not necessarily represent those of their affiliated organizations, or those of the publisher, the editors and the reviewers. Any product that may be evaluated in this article, or claim that may be made by its manufacturer, is not guaranteed or endorsed by the publisher.
Supplementary material
The Supplementary Material for this article can be found online at: https://www.frontiersin.org/articles/10.3389/famrs.2023.1175492/full#supplementary-material
References
Andrews K. R., Good J. M., Miller M. R., Luikart G., Hohenlohe P. A. (2016). Harnessing the power of RADseq for ecological and evolutionary genomics. Nat. Rev. Genet. 17 (2), 81–92. doi: 10.1038/nrg.2015.28
Beaumont M. A., Zhang W., Balding D. J. (2002). Approximate Bayesian computation in population genetics. Genetics 162 (4), 2025–2035. doi: 10.1093/genetics/162.4.2025
Brown J. H. (1971). Mammals on mountaintops: nonequilibrium insular biogeography. Am. Naturalist 105, 467–478. doi: 10.1086/282738
Brown J. H. (1978). The theory of insular biogeography and the distributions of boreal birds and mammals. Great Basin Nat. Memoirs 2, 209–227.
Bryson R. W., Riddle B. R., Graham M. R., Smith B. T., Prendini L. (2013). As old as the hills: montane scorpions in southwestern North America reveal ancient associations between biotic diversification and landscape history. PloS One 8 (1), e52822. doi: 10.1371/journal.pone.0052822
Castoe T. A., Daza J. M., Smith E. N., Sasa M. M., Kuch U., Campbell J. A., et al. (2009). Comparative phylogeography of pitvipers suggests a consensus of ancient Middle American highland biogeography. J. Biogeogr. 36 (1), 88–103. doi: 10.1111/j.1365-2699.2008.01991.x
Cornuet J.-M., Pudlo P., Veyssier J., Dehne-Garcia A., Gautier M., Leblois R., et al. (2014). DIYABC v2. 0: a software to make approximate Bayesian computation inferences about population history using single nucleotide polymorphism, DNA sequence and microsatellite data. Bioinformatics 30 (8), 1187–1189. doi: 10.1093/bioinformatics/btt763
Doan T. M., Mason A. J., Castoe T. A., Sasa M., Parkinson C. L. (2016). A cryptic palm-pitviper species (Squamata: Viperidae: Bothriechis) from the Costa Rican highlands, with notes on the variation within B. nigroviridis. Zootaxa 4138 (2), 271–290. doi: 10.11646/zootaxa.4138.2.3
Drummond A. J., Suchard M. A., Xie D., Rambaut A. (2012). Bayesian phylogenetics with BEAUti and the BEAST 1.7. Mol. Biol. Evol. 29 (8), 1969–1973. doi: 10.1093/molbev/mss075
Edgar R. C. (2004). MUSCLE: multiple sequence alignment with high accuracy and high throughput. Nucleic Acids Res. 32 (5), 1792–1797. doi: 10.1093/nar/gkh340
Estoup A., Lombaert E., Marin J. M., Guillemaud T., Pudlo P., Robert C. P., et al. (2012). Estimation of demo-genetic model probabilities with Approximate Bayesian Computation using linear discriminant analysis on summary statistics. Mol. Ecol. Resour. 12 (5), 846–855. doi: 10.1111/j.1755-0998.2012.03153.x
Excoffier L., Laval G., Schneider S. (2005). Arlequin (version 3.0): an integrated software package for population genetics data analysis. Evolutionary Bioinf. 1, 117693430500100003.
Felix Z. I., Wooten J. A., Pierson T. W., Camp C. D. (2019). Re-evaluation of the Wehrle’s salamander (Plethodon wehrlei Fowler and Dunn) species group (Caudata: Plethodontidae) using genomic data, with the description of a new species. Zootaxa 4609 (3), 429–448. doi: 10.11646/ZOOTAXA.4609.3.2
Flint W. D., Harris R. N. (2005). The efficacy of visual encounter surveys for population monitoring of Plethodon punctatus (Caudata: Plethodontidae). J. Herpetol. 39 (4), 578–585. doi: 10.1670/255-04A.1
Fowler H. W., Dunn E. R. (1917). Notes on salamanders. Proceedings of the Academy of Natural Sciences of Philadelphia 69, 7–28.
Fu Y. X. (1997). Statistical tests of neutrality of mutations against population growth, hitchhiking and background selection. Genetics 147 (2), 915–925. doi: 10.1093/genetics/147.2.915
Gardner J. D. (2003). The fossil salamander Proamphiuma cretacea Estes (Caudata; Amphiumidae) and relationships within the Amphiumidae. J. Vertebrate Paleontol. 23 (4), 769–782. doi: 10.1671/1828-4
Good D. A., Wake D. B. (1992). Geographic variation and speciation in the torrent salamanders of the genus Rhyacotriton (Caudata: Rhyacotritonidae). Univ. California Publications Zoology 126, 1–91.
Hewitt G. M. (1999). Post-glacial re-colonization of European biota. Biol. J. Linn. Soc. 68 (1–2), 87–112. doi: 10.1111/j.1095-8312.1999.tb01160.x
Hewitt G. M. (2000). The genetic legacy of the Quaternary ice ages. Nature 405, 907–913. doi: 10.1038/35016000
Hewitt G. M. (2004). Genetic consequences of climatic oscillations in the Quaternary. Philos. Trans. R. Soc. B: Biol. Sci. 359, 183–195. doi: 10.1098/rstb.2003.1388
Highton R. (1972). “Distributional interactions among eastern North American salamanders of the genus Plethodon,” in The distributional history of the biota of the Southern Appalachians. Part III: Vertebrates: 139–188. Ed. Holt P. C. (Blacksburg, VA: Virginia Polytechnic Institute and State University).
Highton R. (1995). Speciation in eastern North American salamanders of the genus Plethodon. Annu. Rev. Ecol. Systematics 26 (1), 579–600. doi: 10.1146/annurev.es.26.110195.003051
Hijmans R. J., Cameron S. E., Parra J. L., Jones P., Jarvis A. (2005). Very high resolution interpolated climate surfaces for global land areas. Int. J. Climatol. 25, 1965–1978. doi: 10.1002/joc.1276
Ho S. Y., Shapiro B. (2011). Skyline-plot methods for estimating demographic history from nucleotide sequences. Mol. Ecol. Resour. 11 (3), 423–434. doi: 10.1111/j.1755-0998.2011.02988.x
Hyseni C., Garrick R. C. (2019). The role of glacial-interglacial climate change in shaping the genetic structure of eastern subterranean termites in the southern Appalachian Mountains, USA. Ecol. Evol. 9 (8), 4621–4636. doi: 10.1002/ece3.5065
Jockusch E. L., Wake D. B. (2002). Falling apart and merging: diversification of slender salamanders (Plethodontidae: Batrachoseps) in the American West. Biol. J. Linn. Soc. 76 (3), 361–391. doi: 10.1111/j.1095-8312.2002.tb01703.x
Kuchta S. R., Brown A. D., Converse P. E., Highton R. (2016). Multilocus phylogeography and species delimitation in the Cumberland Plateau Salamander, Plethodon kentucki: Incongruence among data sets and methods. PloS One 11 (3), e0150022. doi: 10.1371/journal.pone.0150022
Kuchta S. R., Brown A. D., Highton R. (2018). Disintegrating over space and time: Paraphyly and species delimitation in the Wehrle's Salamander complex. Zoologica Scripta 47 (3), 285–299. doi: 10.1111/zsc.12281
Lanfear R., Frandsen P. B., Wright A. M., Senfeld T., Calcott B. (2016). PartitionFinder 2: new methods for selecting partitioned models of evolution for molecular and morphological phylogenetic analyses. Mol. Biol. Evol. 34 (3), 772–773. doi: 10.1093/molbev/msw260
Leigh J. W., Bryant D. (2015). popart: full-feature software for haplotype network construction. Methods Ecol. Evol. 6 (9), 1110–1116. doi: 10.1111/2041-210X.12410
Manthey J. D., Moyle R. G. (2015). Isolation by environment in White-breasted Nuthatches (Sitta carolinensis) of the Madrean Archipelago sky islands: A landscape genomics approach. Mol. Ecol. 24 (14), 3628–3638. doi: 10.1111/mec.13258
Markle T. M., Kozak K. H. (2018). Low acclimation capacity of narrow-ranging thermal specialists exposes susceptibility to global climate change. Ecol. Evol. 8 (9), 4644–4656. doi: 10.1002/ece3.4006
Masta S. E. (2000). Phylogeography of the jumping spider Habronattus pugillis (Araneae: Salticidae): recent vicariance of sky island populations? Evolution 54 (5), 1699–1711. doi: 10.1111/j.0014-3820.2000.tb00714.x
McCormack J. E., Bowen B. S., Smith T. B. (2008). Integrating paleoecology and genetics of bird populations in two sky island archipelagos. BMC Biol. 6, 28. doi: 10.1186/1741-7007-6-28
McCormack J. E., Huang H., Knowles L. L., Gillespie R., Clague D. (2009). Sky islands. Encyclopedia Islands 4, 841–843.
Mitchell S. G., Ober K. A. (2013). Evolution of Scaphinotus petersi (Coleoptera: Carabidae) and the role of climate and geography in the Madrean sky islands of southeastern Arizona, USA. Quaternary Res. 79 (2), 274–283.
Moore W., Meyer W. M., Eble J. A., Franklin K., Wiens J. F., Brusca R. C. (2013). Introduction to the Arizona Sky Island Arthropod Project (ASAP): systematics, biogeography, ecology, and population genetics of arthropods of the Madrean Sky Islands. in Gottfried G. J., Ffolliott P. F., Bebow B. S., Eskew L. G., eds. Merging science and management in a rapidly changing world: biodiversity and management of the Madrean Archipelago III. U.S. Department of Agriculture RMRS-P-67, 140–164.
Mulder K. P., Cortes-Rodriguez N., Campbell Grant E. H., Brand A., Fleischer R. C. (2019). North-facing slopes and elevation shape asymmetric genetic structure in the range-restricted salamander. Plethodon shenandoah. Ecol. Evol. 9 (9), 5094–5105. doi: 10.1002/ece3.5064
Ober K., Matthews B., Ferrieri A., Kuhn S. (2011). The evolution and age of populations of Scaphinotus petersi Roeschke on Arizona Sky Islands (Coleoptera, Carabidae, Cychrini). ZooKeys 147, 183. doi: 10.3897/zookeys.147.2024
Pelletier T. A., Carstens B. C. (2014). Model choice for phylogeographic inference using a large set of models. Mol. Ecol. 23 (12), 3028–3043. doi: 10.1111/mec.12722
Pereira R. J., Martínez-Solano I., Buckley D. (2016). Hybridization during altitudinal range shifts: nuclear introgression leads to extensive cyto-nuclear discordance in the fire salamander. Mol. Ecol. 25 (7), 1551–1565. doi: 10.1111/mec.13575
Phillips S. J., Anderson R. P., Schapire R. E. (2006). Maximum entropy modeling of species geographic distributions. Ecol. Model. 190 (3–4), 231–259. doi: 10.1016/j.ecolmodel.2005.03.026
Polich R. L., Searcy C. A., Shaffer H. B. (2013). Effects of tail-clipping on survivorship and growth of larval salamanders. J. Wildlife Manage. 77 (7), 1420–1425. doi: 10.1002/jwmg.596
Rambaut A., Drummond A. J., Xie D., Baele G., Suchard M. A. (2018). Posterior summarization in Bayesian phylogenetics using Tracer 1.7. Systematic Biol. 67, 901–904. doi: 10.1093/sysbio/syy032
Springer G. S., Rowe H. D., Hardt B., Cocina F. G., Edwards R. L., Cheng H. (2009). Climate driven changes in river channel morphology and base level during the Holocene and Late Pleistocene of southeastern West Virginia. J. Cave Karst Stud. 71 (2), 121–129.
Stone G. N., White S. C., Csóka G., Melika G., Mutun S., Pénzes Z., et al. (2017). Tournament ABC analysis of the western Palaearctic population history of an oak gall wasp. Synergus umbraculus Mol. Ecol. 26 (23), 6685–6703. doi: 10.1111/mec.14372
Tajima F. (1989). Statistical method for testing the neutral mutation hypothesis by DNA polymorphism. Genetics 123 (3), 585–595. doi: 10.1093/genetics/123.3.585
Tucker R. B. (1998). Ecology and natural history of the cow knob salamander, Plethodon punctatus Highton, in West Virginia. Master's Thesis. (Marshall University, Huntington, WV).
Wake D. B. (2006). Problems with species: patterns and processes of species formation in salamanders. Ann. Missouri Botanical Garden 93 (1), 8–23. doi: 10.3417/0026-6493(2006)93[8:PWSPAP]2.0.CO;2
Waldron B. P., Kuchta S. R., Hantak M. M., Hickerson C. A. M., Anthony C. D. (2019). Genetic analysis of a cryptic contact zone between mitochondrial clades of the Eastern Red-Backed Salamander, Plethodon cinereus. J. Herpetol. 53 (2), 144–153. doi: 10.1670/18-088
Warshall P. (1994). “The Madrean sky island archipelago: a planetary overview,” in Biodiversity and management of the Madrean Archipelago: the sky islands of southwestern United States and northwestern Mexico. Eds. DeBano L., Ffolliott P. F., Ortega-Rubio A., Gottfried G. J., Hamre R. H., Edminster C. B. (Fort Collins, CO: General Technical Report RM-GTR-264, Tucson, AZ. US Department of Agriculture, Forest Service, Rocky Mountain Forest and Range Experiment Station), 408–415.
Waters J. M., Fraser C. I., Hewitt G. M. (2013). Founder takes all: density-dependent processes structure biodiversity. Trends Ecol. Evol. 28 (2), 78–85. doi: 10.1016/j.tree.2012.08.024
Wiens J. J., Camacho A., Goldberg A., Jezkova T., Kaplan M. E., Lambert S. M., et al. (2019). Climate change, extinction, and Sky Island biogeography in a montane lizard. Mol. Ecol. 28 (10), 2610–2624. doi: 10.1111/mec.15073
Keywords: Approximate Bayesian Computation, BEAST, mtDNA, GAPD, glacial, Plethodon wehrlei, Pleistocene, Plethodontidae
Citation: Graham MR, Flint WD, Powell AM, Fet V and Pauley TK (2023) Phylogeography of the Cow Knob Salamander (Plethodon punctatus Highton): populations on isolated Appalachian mountaintops are disjunct but not divergent. Front. Amphib. Reptile Sci. 1:1175492. doi: 10.3389/famrs.2023.1175492
Received: 27 February 2023; Accepted: 21 July 2023;
Published: 10 August 2023.
Edited by:
Anna E. Savage, University of Central Florida, United StatesReviewed by:
Maciej Pabijan, Jagiellonian University, PolandMichael J. Jowers, University of Granada, Spain
Copyright © 2023 Graham, Flint, Powell, Fet and Pauley. This is an open-access article distributed under the terms of the Creative Commons Attribution License (CC BY). The use, distribution or reproduction in other forums is permitted, provided the original author(s) and the copyright owner(s) are credited and that the original publication in this journal is cited, in accordance with accepted academic practice. No use, distribution or reproduction is permitted which does not comply with these terms.
*Correspondence: Matthew R. Graham, Z3JhaGFtbUBlYXN0ZXJuY3QuZWR1