 Shannon E. Wallace1
 John A. Burns
 Ryan R. Kerney
 Cy L. Mott
 Cory D. Bishop
- 1Department of Biology, St. Francis-Xavier University, Antigonish, NS, Canada
- 2Bigelow Laboratory for Ocean Sciences, East Boothbay, ME, United States
- 3Department of Biology, University of North Carolina Asheville, Asheville, NC, United States
- 4Department of Biology, Gettysburg College, Gettysburg, PA, United States
- 5Department of Biological Sciences, Eastern Kentucky University, Richmond, KY, United States
The mutualism between the green alga Oophila amblystomatis (“Oophila”) and egg masses of the spotted salamander Ambystoma maculatum involves acquisition of algal cells from water, followed by their population growth within individual egg capsules of the egg mass. The host range spans over 20 degrees latitude and longitude. High site fidelity and fine scale genetic structure of host populations has been resolved, but genetic diversity of green algal symbionts across this range has not been investigated. We sampled egg capsule fluid harvested from five locales in North America, each separated by ~2° latitude and used both PacBio and Illumina sequencing of the 18S rRNA gene to investigate (i) whether algal symbionts are restricted to the Oophila clade and (ii) examine geographic variation in Oophila diversity. We also re-analyzed 18S (V4) reads from previous work using contemporary denoising protocols, which, along with current data, produced 16.37 million reads. We detected no chlorophytes outside Oophila clade B and detected cercozoan protists and rhizophydialean fungi in some capsules. There was a mean of 10.14 ± 3.40 amplicon sequence variants (ASVs) per sample corresponding to O. amblystomatis, ranging in prevalence from single ponds within a locale to all samples. We observed among-locale variation in unique ASVs, but not in a latitudinal pattern. However, we detected two highly prevalent ASVs (ASVs A and B), which varied in abundance, relative to each other, as a function of latitude. Pairwise alignments of ASVs from the V4 region revealed that, on average, more divergent ASVs were rarer. Haplotype network analysis revealed ASV A as the ancestral variant and amplicon sequence analysis from newly isolated cultures of O. amblystomatis demonstrate that ASVs A and B are intragenomic variants that can segregate. We conclude that, at the scale of the host range, partner specificity in this algal-salamander mutualism is very high and reveal an intriguing effect of latitude on the relative abundance of intragenomic 18S rRNA gene variants.
Introduction
The evolution of stable symbiotic mutualisms, in which two or more phylogenetically disparate lineages interact for reciprocal benefit, involves partner choice. For mutualisms with horizontally acquired symbionts, partner choice is determined by the availability of prospective symbionts, responses to and competition among them for host resources, and sorting mechanisms between prospective symbionts and hosts (Itoha et al., 2019). High specificity in mutualisms, in which one taxon is preferred over another, has been demonstrated to stabilize cooperation (e.g., Aanen et al., 2009) and can result in a high degree of co-evolution (Carlson et al., 2023).
Specificity can be expressed in functional or taxonomic terms. In rhizobia-legume mutualisms, presumptive rhizobial partners do not form a monophyletic clade, but rather are a polyphyletic assemblage of lineages in Alphaproteobacteria and Betaproteobacteria capable of initiating the formation of root nodules and fixing atmospheric nitrogen for host use (Poole et al., 2018). By contrast, and notwithstanding fine-scaled genetic and functional variation among symbionts (Wollenberg and Ruby, 2009, 2012), the mutualism between the bobtail squid Euprymna scolopes and the bacterium Vibrio fischeri is taxonomically specific.
Egg masses of seven amphibians in North America, Europe and Japan form a mutualism with the unicellular green alga Oophila amblystomatis (Lambert, 1905; Wille, 1909; Kerney, 2011; Kim et al., 2014; Muto et al., 2017; Anslan et al., 2021; Vences et al., 2024). Among these, the mutualism between O. amblystomatis and the spotted salamander Ambystoma maculatum (Shaw, 1802) has recently garnered interest because it is characterized by both ectosymbiotic and endosymbiotic cellular arrangements (Kerney et al., 2011). In the ectosymbiotic arrangement, an algal cell population grows inside individual embryonic capsules within the egg mass, but outside the bodies of embryos, where symbionts and hosts engage in a resource exchange mutualism. Algae ameliorate embryonic hypoxia (Tattersall and Spiegelaar, 2008; Hale et al., 2017) by producing more oxygen than they consume in lighted conditions (Pinder and Friet, 1994). The host provides fixed nitrogen, CO2 and an environment in which to reproduce (Small and Bishop, 2020). A small portion of ectosymbiotic algae enter embryos during neurulation and subsequent stages and then enter various tissues and cells of the embryo (Kerney et al., 2011). The function of the endosymbiotic arrangement was hypothesized to involve intergenerational transfer of symbionts, but pond water was later shown to be the principal source of symbionts (Bishop, 2022).
The potential benefit of this intriguing endosymbiosis remains unknown, but reciprocal co-culture experiments between algae and embryos of A. maculatum and those of its congener, the northwestern salamander A. gracile, demonstrated that embryonic invasion depends on a match between symbiont and host (Kerney et al., 2019), suggesting co-evolution. Recent models suggest a positive relationship between partner specificity and co-operation (Carlson et al., 2023), but the relationship between the endosymbiotic arrangement and specificity is unknown. Whereas high site fidelity and the genetic structure of adult salamanders (Zamudio and Savage, 2003) has been reported, evidence for specificity, as a shared species-level trait in the Oophila-Ambystoma mutualism has not been generated at the requisite geographical sampling and sequencing scales.
Current evidence of specificity
The phylogenetic position of O. amblystomatis within Chlorophyta was first determined using nearly full-length 18S and chloroplast 16S rRNA gene sequences (Kerney et al., 2011). Subsequently, Kim et al. (2014) sampled algae from capsules from egg masses of four North American amphibian species and, using a ‘harvest-then-sequence’ approach (i.e., no culturing before sequencing), used nearly full-length 18S rRNA gene sequences to establish a well-supported Oophila clade within the order Chlamydomonadales. The Oophila clade was composed of four sub-clades (I-IV), with three of these sub-clades corresponding to egg masses of the host taxon from which they were harvested, thus demonstrating a degree of host-symbiont co-evolution. The topology of the Oophila clade was supported by subsequent analyses that included 18S rDNA and phylotranscriptomic data from algae found in additional amphibian hosts (Muto et al., 2017; Anslan et al., 2021; Vences et al., 2024) and herbarium specimens (Bishop and Garbary, 2024). This well supported clade is now referred to as Oophila clade B.
Jurga et al. (2020) conducted amplicon sequencing of the V4 region of 18S rDNA, which permitted a semi-quantitative assessment of sequence identity on a per capsule basis. Consistent with Kerney et al. (2011) and Kim et al. (2014), chlorophyte sequence diversity, either among egg capsules within an egg mass or among those from different egg masses of A. maculatum was very low, suggesting high specificity. Intriguingly, although most capsules contained a single operational taxonomic unit (OTU) corresponding to O. amblystomatis (GenBank accession: HM590634.1) 22% of capsules contained, in the aggregate, 13 additional OTUs of very low relative abundance (mean 0.016 ± 0.014%) but which varied in sequence identity by 2% to 7% (mean 4.5 ± 1.83%) from the most prevalent and abundant OTU. Moreover, in 47% of capsules sampled in 2016, sequences most closely matching Chlamydomonas pseudogloeogama, a free-living close relative of O. amblystomatis that nests within the Oophila clade (see Kim et al., 2014; Vences et al., 2024), were detected, although also at very low relative abundance (Jurga et al., 2020). Therefore, it appears that a single lineage of O. amblystomatis is numerically dominant in egg capsules, with co-occurrence of multiple closely related lineages Oophila spp. of undetermined taxonomic status. Because prior work has uniformly harvested algae from capsules of later stage embryos, it is unknown whether this pattern is, at least in part, caused by competition after colonization earlier in development.
Despite the prevailing result of overall low chlorophyte sequence diversity in capsules, the host range of A. maculatum spans most of eastern North America. Sites sampled in Jurga et al. (2020) are at the northeastern end of the range for A. maculatum precluding general conclusions about partner specificity in this mutualism. Moreover, the OTU clustering methods associated with QIIME1 tools (Jurga et al., 2020) would have, by definition, masked fine-scale variation in algal sequences within and among capsules (see Jurga et al., 2020 for QIIME 1 documentation) that might be relevant to our understanding of the evolution or ecology of this mutualism. A broader examination of the Oophila-Ambystoma symbiosis across the host range would answer a number of questions about the history and specificity of the symbiosis. The dominance of O. amblystomatis in capsules throughout the range of A. maculatum and a relatively low abundance or sporadic occurrence other taxa (e.g., C. pseudogloeogama) would indicate a high level of specificity between O. amblystomatis and A. maculatum. Therefore, we hypothesized that the specificity of the mutualism observed in the northern part of the host range would be uniform across more southern locales in the range. More specifically we hypothesized that no chlorophyte lineages outside Oophila clade B would occur among all capsules sampled. We also hypothesized that there are no differences in Oophila sp. richness in hospite (viz. within the egg capsule membranes) among sampled locales along a latitudinal transect.
The advent of long-read sequencing has introduced an element of choice in metabarcoding studies, in which the choice of Oxford Nanopore Technology or PacBio Sequel II (for long-reads) or Illumina MiSeq paired-end sequencing (for short reads) requires consideration of, in addition to cost, the trade-off between read length per marker locus and read depth per sample. Taxonomic resolution, primer bias and amplification efficiency can all vary in unpredictable ways, by platform (Biada et al., 2025) and by taxon (Mittelstrass et al., 2025). We estimated algal diversity in capsules using both the V4 region of the 18S rRNA gene and PacBio sequencing of the (nearly) full-length 18S rRNA gene and report on the utility of each.
Methods
Field sampling and intracapsular fluid harvesting
Collections were conducted with permission from relevant authorities from each of five jurisdictions. Ethical approval was not required for this study involving animals in accordance with the local legislation and institutional requirements because unhatched embryos are exempted for ethics approval from institutional animal care committees. Egg masses or egg mass fragments were collected from ponds at each of three (except two in Pennsylvania) different sites from each of five locales in eastern North America: Nova Scotia (Canada), Maine (USA), Pennsylvania (USA), Kentucky (USA) and North Carolina (USA) (Supplementary Table 1 for collection details). Intracapsular fluid (IF) was collected as in Jurga et al. (2020). Briefly, embryos at stages ranging from 34-40 (Harrison, 1969) were manually de-jellied before rinsing individual egg capsules three times in a 12-well sterile tissue culture plate in dechlorinated tap water. After the final rinse capsules were transferred to a glass dish with minimal water. A 30-gauge sterile needle mounted on a 1 mL sterile plastic syringe was used to puncture the capsule membranes and draw out the IF. The IF from six capsules were pooled into a single microcentrifuge tube, constituting a sample. Cells were then pelleted in a microcentrifuge on maximum speed for 5 minutes. Supernatant was removed and then 100% ethanol was added and samples were stored at -20C until shipment to the corresponding author’s laboratory. Thus, each sample represents one egg mass and three egg masses (see exceptions in Supplementary Table 1) were collected from each of three sites within a locale.
DNA was extracted from all samples using either the Power Fecal Pro® kit (Qiagen) or the PureLink® DNA mini kit (Thermofisher), both of which use chaotropic salts during lysis. For some samples, the quantity of DNA extracted did not meet the minimum concentration required for library preparation (see Supplementary Table 1), so all samples were subjected to a pre-amplification step using the same primers used by the sequencing center for PacBio Sequel II amplicon sequencing. Jurga et al. (2020) tested, and found no evidence, for systemic PCR bias under similar PCR conditions. All amplicons were gel purified, quantified and submitted to Integrated Microbial Resource at Dalhousie University (IMR-Dal). We initially subjected all samples to PacBio Sequel II amplicon sequencing and a subset of these samples (~1/3) to Illumina paired-end MiSeq amplicon sequencing. A preliminary comparison revealed more ASVs detected by Illumina MiSeq V4 sequencing than PacBiO Sequel II, so we subjected all remaining samples to Illumina sequencing, which permitted a sample-to-sample comparison between sequencing platforms. Primers for PacBio Sequel II amplicon sequencing of the full-length 18S rRNA gene were NS4/18 and EukR (Medlin et al., 1988; Hendriks et al., 1989) and for Illumina MiSeq paired-end sequencing (2 X 300bp) of the V4 region of the 18S rRNA gene were E572F and E1009R (Comeau et al., 2011).
Data analysis
Raw reads were subjected to the MicrobiomeHelper protocol (Comeau et al., 2017), which relies primarily on QIIME2 tools (Bolyen et al., 2019; see Supplementary File 1 for commands and parameters for all workflows and Supplementary Table 2 for details of DADA2 denoising statistics). After primer trimming with cutadapt, reads were denoised with DADA2, and then taxonomies were assigned to ASVs using the full-length 16S/18S SILVA classifier (i.e., silva-138-99-nb-classifier.qza). Rare ASVs (<0.1% of mean sample depth) were filtered out. Our initial completion of this workflow for Illumina MiSeq V4 reads revealed 108 ASVs, many of which were of very low read count and prevalence, suggesting errors. DADA2 denoising protocols are a superior method of accurately identifying variants while outputting few incorrect sequences (Callahan et al., 2016). In benchmarking tests DADA2 error rates (per merged read) were in the range of 10-6 - 10–8 for datasets derived from mock bacterial communities. Assuming similar error rates for our data (~3.3 x 10⁻⁶ million merged reads) we could expect that ~101 ASVs were due to sequencing errors. Therefore, singletons were filtered out, reducing to negligible levels the probability of rare ASVs arising from error. Owing to higher quality scores for PacBio Sequel II reads, singletons were not removed, but unexpected ASVs, corresponding to terrestrial flowering plants, were removed from final feature tables. These contaminants were not present in feature tables from Illumina V4 reads, which were derived from the same input DNA as for PacBio reads. Illumina MiSeq 18S V4 reads from Jurga et al. (2020), which were originally analyzed with an open reference OTU clustering protocol, were reanalyzed as above to generate ASVs.
Haplotype networks were generated using the Templeton, Crandall, and Sing algorithm (Clement et al., 2002), as implemented in PopArt (v 1.7) (Leigh and Bryant, 2015).
Our initial analysis revealed that all chlorophyte reads corresponded to O. amblystomatis, so we did not subject reads to ‘core diversity metrics’ calculations in QIIME2 because they rely upon Linnean taxonomies as feature identifiers, which were uniform. Moreover, subsequent cell culture work invalidated the assumption of biological independence among ASVs assigned as O. amblystomatis. Therefore, regression analyses and statistical tests were conducted in R Studio (4.3.0) (R Core Team, 2023; Posit team, 2024), using data from feature tables. For regression of ASV A and B abundance against latitude, data were first filtered for a minimum ASV count of 4, a minimum prevalence of 10% of samples and a 10% low variance filter, based upon the interquartile range and then filtered data were subject to a centered log-ratio transformation using MicrobiomeAnalyst (Dhariwal et al., 2017). Graphs and montages were constructed using ggplot2 (Wickham, 2016) and patchwork (Pedersen, 2022) packages or with Inkscape (v 1.3).
Cell culturing
On May 16th, 2024 an egg mass was collected from Connor’s Mountain Road pond, Antigonish, NS. Embryos were staged at 34 or 35 (Harrison, 1969). The next day, twelve capsules were removed from the egg mass and surface sterilized by suspending them in 70% ethanol in water for 30s. Capsules were rinsed 3X in sterile pond water and then IF was harvested from each capsule as described above, pooled in a microcentrifuge tube and centrifuged at 1500 RPM for 2 minutes. The supernatant was removed, and the pellet was resuspended in 2 mL of sterile-filtered pond water and then split into two microfuge tubes. Centrifugation was repeated and each pellet was then resuspended in 500 µL sterile-filtered pond water. Aliquots of 100 µL or 500 µL were transferred into 50 mL of sterile-filtered pond water in conical tubes, for a 500X or 100X dilution, respectively, and then vacuum filtered on 2 µm Nucleopore® polycarbonate filters. An additional 50 mL of sterile-filtered pond water was added to the filter apparatus and vacuum filtered. Filters were placed with cells facing up on solid AF6-M media (Kato, 1982) and plates were placed upside down in an incubator where they were held at 13°C on a 14:10 light cycle under ~200 µE light from Barrina® full-spectrum LED grow lights. After 3 weeks, colonies began to appear. Under a laminar flow hood colonies with good separation from neighboring colonies were identified with a dissecting microscope and then transferred to 5 mL of liquid AF6-M media using a sharpened toothpick. Twenty-four such liquid cultures were generated; growth occurred in twenty. Three mL of liquid culture were subjected to DNA extraction with a DNeasy DNA extraction kit (Qiagen). Extracts were subjected to amplicon sequencing of the V4 region (Illumina) or nearly full-length (PacBio Sequel II) and analyzed as above.
Results
PacBio v. Illumina
There were substantial differences between PacBio and Illumina read depth and, as a result, ASV discovery (see Supplementary Table 3 for details of filtering, rarefaction, read counts and summary statistics for ASVs). The sum of sequencing reads from all samples was 19.19X higher for Illumina than for PacBio. Although MiSeq read depth is nominally 2-5X greater than PacBio, we retained only ~50% of our PacBio reads during DADA2 denoising, which can occur for low diversity data. Prevalence is a measure of the number or percentage of samples in which an ASV occurs. Although both platforms recovered the same high prevalence ASV (described further below), Illumina detected a second high prevalence ASV (97.6% of samples) that was detected at a much lower prevalence (14.0% of samples) with PacBio. The sum of ASVs discovered was 10.4X higher for Illumina, with mean ASVs/sample 7.9X higher. Illumina sequencing also revealed an average 1.82X increase in prevalence per ASV. However, within platforms ASV detection was unrelated to read depth.
We analyzed chlorophyte and non-chlorophyte eukaryotic diversity separately. For non-chlorophyte eukaryotes, read counts, ASVs counts and mean ASVs per sample were 50.25X, 6.33X, 10.83X higher for Illumina, whereas mean ASV prevalence per sample was not different. For non-chlorophytes there was a moderate to strong correlation between ASV detection and read depth. Based upon these comparisons, we only report analyses from the Illumina dataset for patterns of sequence variation for samples from capsules but include feature tables from PacBio Sequel II sequencing. For cell cultures, we report on both Illumina and PacBio data. Supplementary Table 4 includes feature tables for all analyses listed in Supplementary Table 3.
Patterns of variation in Oophila and non-chlorophyte eukaryotes
All 3.3 million chlorophyte sequences were assigned to Oophila amblystomatis (Supplementary Table 3), with high confidence (mean = 0.989 ± 0.010; min = 0.946). Seventy-three ASVs were detected. After rarefaction to 33619 to normalize read depth 72 ASVs and all samples were retained with a mean of 10.14 ± 3.40 ASVs/sample. The prevalence of ASVs was highly variable: 40/72 (54.79%) were present in one or more samples from a single locale, 28/72 (38.8%) were present in samples from > 1 locale, 5/72 (6.94%) were present in at least one sample in all locales and 1/72 (1.38%) was present in all samples (Figure 1A). Samples from ME had the highest number of unique ASVs, with other locales being comparable (Figure 1B).
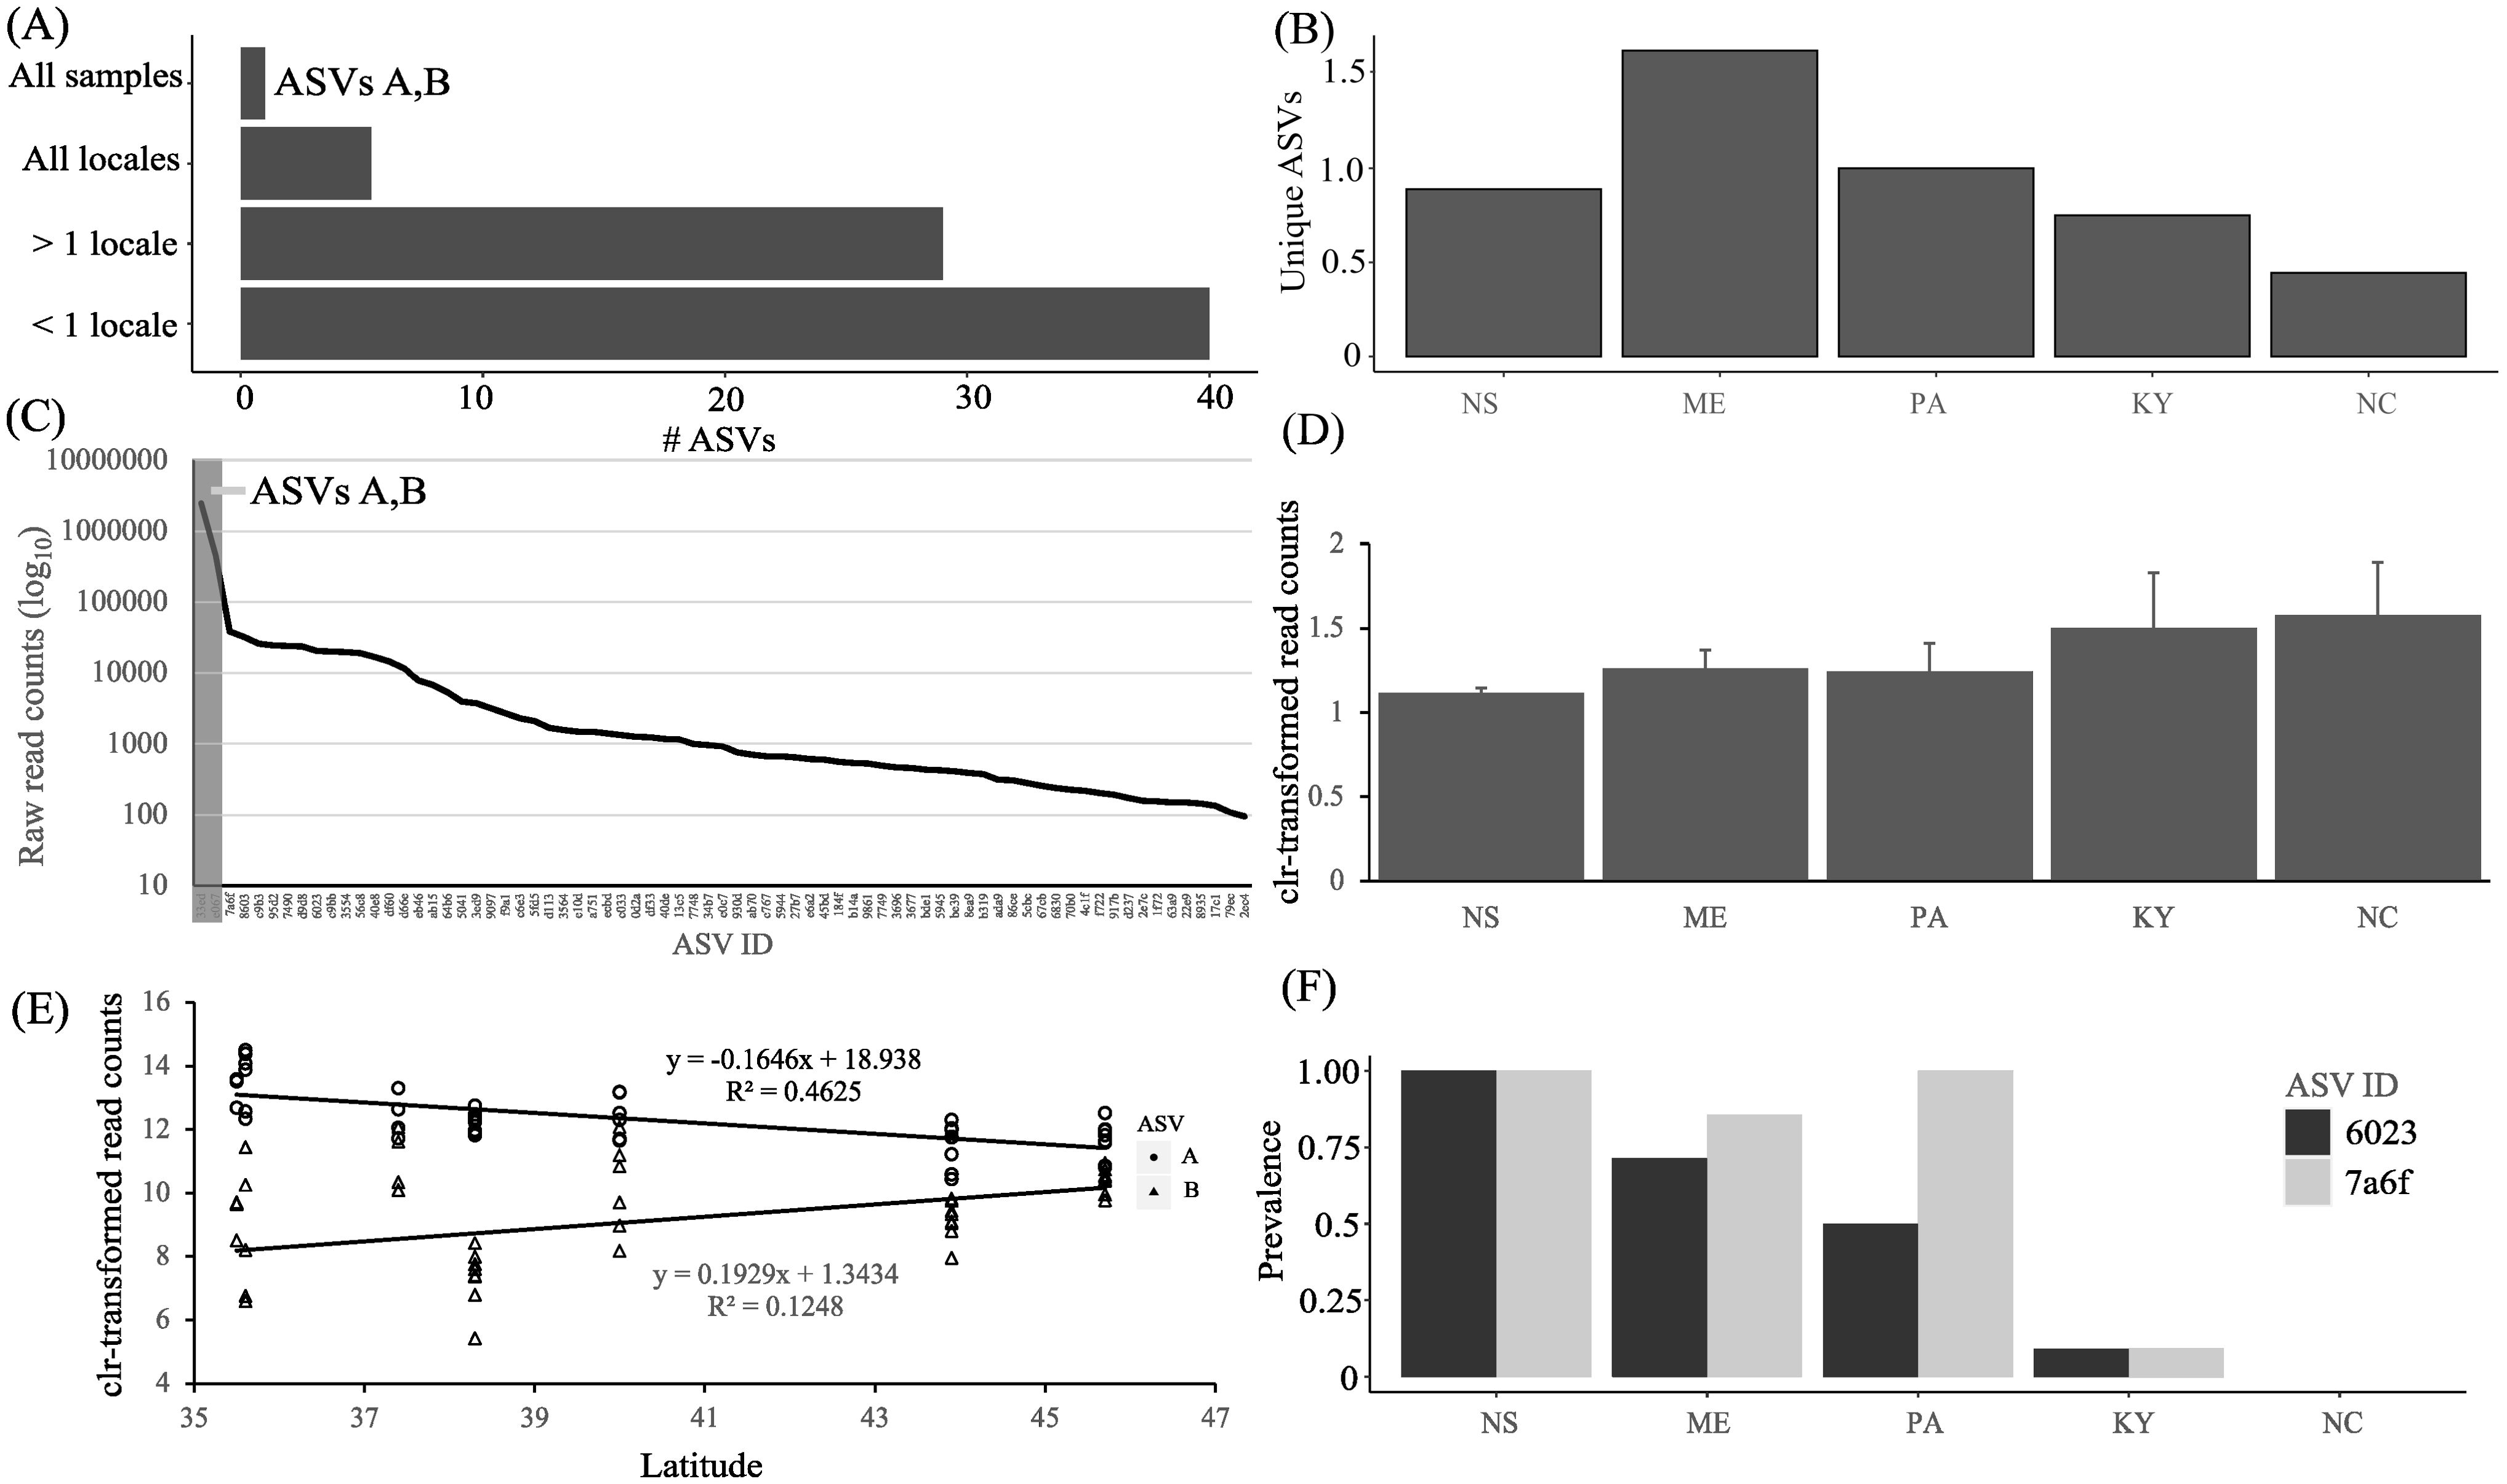
Figure 1. Distribution and read counts for ASVs corresponding to O. amblystomatis detected from the V4 region of 18S rRNA gene. (A) Distribution of ASV prevalence. < 1 locale = ASVs detected in fewer than all samples from a locale. > 1 locale = ASVs detected in at least one sample from more than one locale. All locales = ASVs detected in at least one sample from all locales. All samples = ASVs detected in all samples. (B) Number of ASVs endemic to each locale. (C) Distribution of read counts for all ASVs detected. ASVs A and B are in gray. (D) Change in proportion of the two most prevalent ASVs (A and B) by locale, after a centered log-ratio transformation of read count data. (E) Regression of relative abundance of ASVs A and B against latitude, after a centered log-ratio transformation of read count data. (ASV A, Pearson correlation coefficient -0.6801, p = 3.8X10⁻⁷; ASV B, Pearson correlation coefficient 0.3533, p = 0.02) (F) Prevalence of two ASVs of intermediate prevalence by locale.
Two ASVs were particularly numerically dominant and prevalent. In the feature table (Supplementary Table 4), these ASVs are identified by their 32-character alphanumeric hash. For simplicity we refer to them in the text as A and B (where A = 33ed7e8f59180dedc0e8ae8cc2574d93 and B = Ba9198eacbcd2864ffd025f25a196) and in figures we represent all ASVs with the first four digits of this hash (i.e., ASV A = 33ed).
ASV A was detected in all samples and ASV B was detected in all samples except one from NC. Together, these two ASVs constituted a mean of 89.1 ± 5.38% of reads per sample (Figure 1C). One interesting feature of this pair of ASVs was that, in all samples, read counts for A were numerically dominant over B. We therefore refer to ASV A, for some analyses, as dominant and all other ASVs (including B) as subdominant. We examined the mean proportion of A and B by locale and found a decrease in the proportion of read counts of A to B from Nova Scotia to North Carolina (Figure 1D). A regression of the mean read counts of each of these prevalent ASVs against latitude reveals a significant relationship (Figure 1E). We then ranked all ASVs other than A and B by their prevalence and examined these individually for latitudinal patterns. Among five ASVs having intermediate prevalence (33% - 52.3% of samples or present in at least 3/5 locales) two demonstrated a latitudinal pattern in prevalence (Figure 1F). The sum of raw read counts for these two ASVs (59,231) is, respectively, one and two orders of magnitude lower than for ASV B (454,613) and A (2,489,594).
Non-chlorophyte eukaryotes
Approximately 10% of all read counts from the Illumina dataset corresponded to non-chlorophyte eukaryotes (Supplementary Table 3). A total of 19 ASVs corresponding to 9 eukaryote lineages were detected, the majority of which were of low prevalence and read count (Supplementary Table 4). The most prevalent (33/42 samples) and abundant ASV (74.87% of non-chlorophyte reads) matches with 100% sequence identity to a cercozoan protist (Class Glissomonadida) that was detected from NS samples in 2016 and 2017 (Jurga et al., 2020). Four additional lineages of glissomonadids were detected but these were of much lower abundance and prevalence, collectively constituting 2.4% of non-chlorophyte reads, with a mean prevalence of 5.95 ± 2.38%. The taxon having the next highest read counts was a fungus in the genus Rhizophydium (Class Chytridomycete, Order Rhyzophydiales). There were three ASVs present from that genus, collectively corresponding to 22.57% of the non-chlorophyte reads, and were restricted to 5/9 samples from ME corresponding to 2/3 sites and one sample each from NS and NC. No samples from PA or KY contained these fungi. Consistent with the above results for cercozoans, the most prevalent such ASV was a 100% match to rhizophydialean fungi detected from NS samples in 2016 and 2017 (Jurga et al., 2020). The remainder of the seven eukaryotic lineages constituted 2.56% of the non-chlorophyte reads, scattered among samples with very low (1–2 samples/ASV) prevalence.
Relationships among ASVs corresponding to O. amblystomatis
ASVs A and B are minimally divergent, having only 1 nucleotide divergence in the V4 region and otherwise identical along the nearly full-length sequence (99.94% identity). We therefore wondered about the sequence identity of the remaining ASVs with the most prevalent and abundant ASVs and specifically whether more divergent ASVs were less abundant. We first calculated pairwise nucleotide divergences for all ASVs of O. amblystomatis that were 400 bp in the non-rarefied dataset (NASVs=68; Npairwise = 2346; mean nucleotide divergences = 4 ± 0.024) and then plotted the relative abundance of nucleotide divergences for all locales (Figure 2A). For all locales except ME, the most frequent number of divergences in pairwise comparisons was 2; for ME it was 3. We then plotted nucleotide divergences as a function of their relative abundance and found a log-linear correlation (Figure 2B), indicating that, on average, pairwise distances are greater for rarer ASVs. To gain greater insight into the relationship among subdominant ASVs relative to ASV A we calculated mean nucleotide divergences between ASV A and all other ASVs (1.94 ± 1.89) and the mean pairwise divergences among all subdominant ASVs (3.71 ± 2.44), for a difference of 1.91X. Therefore, mean pairwise divergences among subdominant ASVs are significantly greater than mean pairwise divergences between subdominant ASVs and ASV A (Mann-Whitney normal approximation Z = -13.567, p = 0, effect size = 0.300).
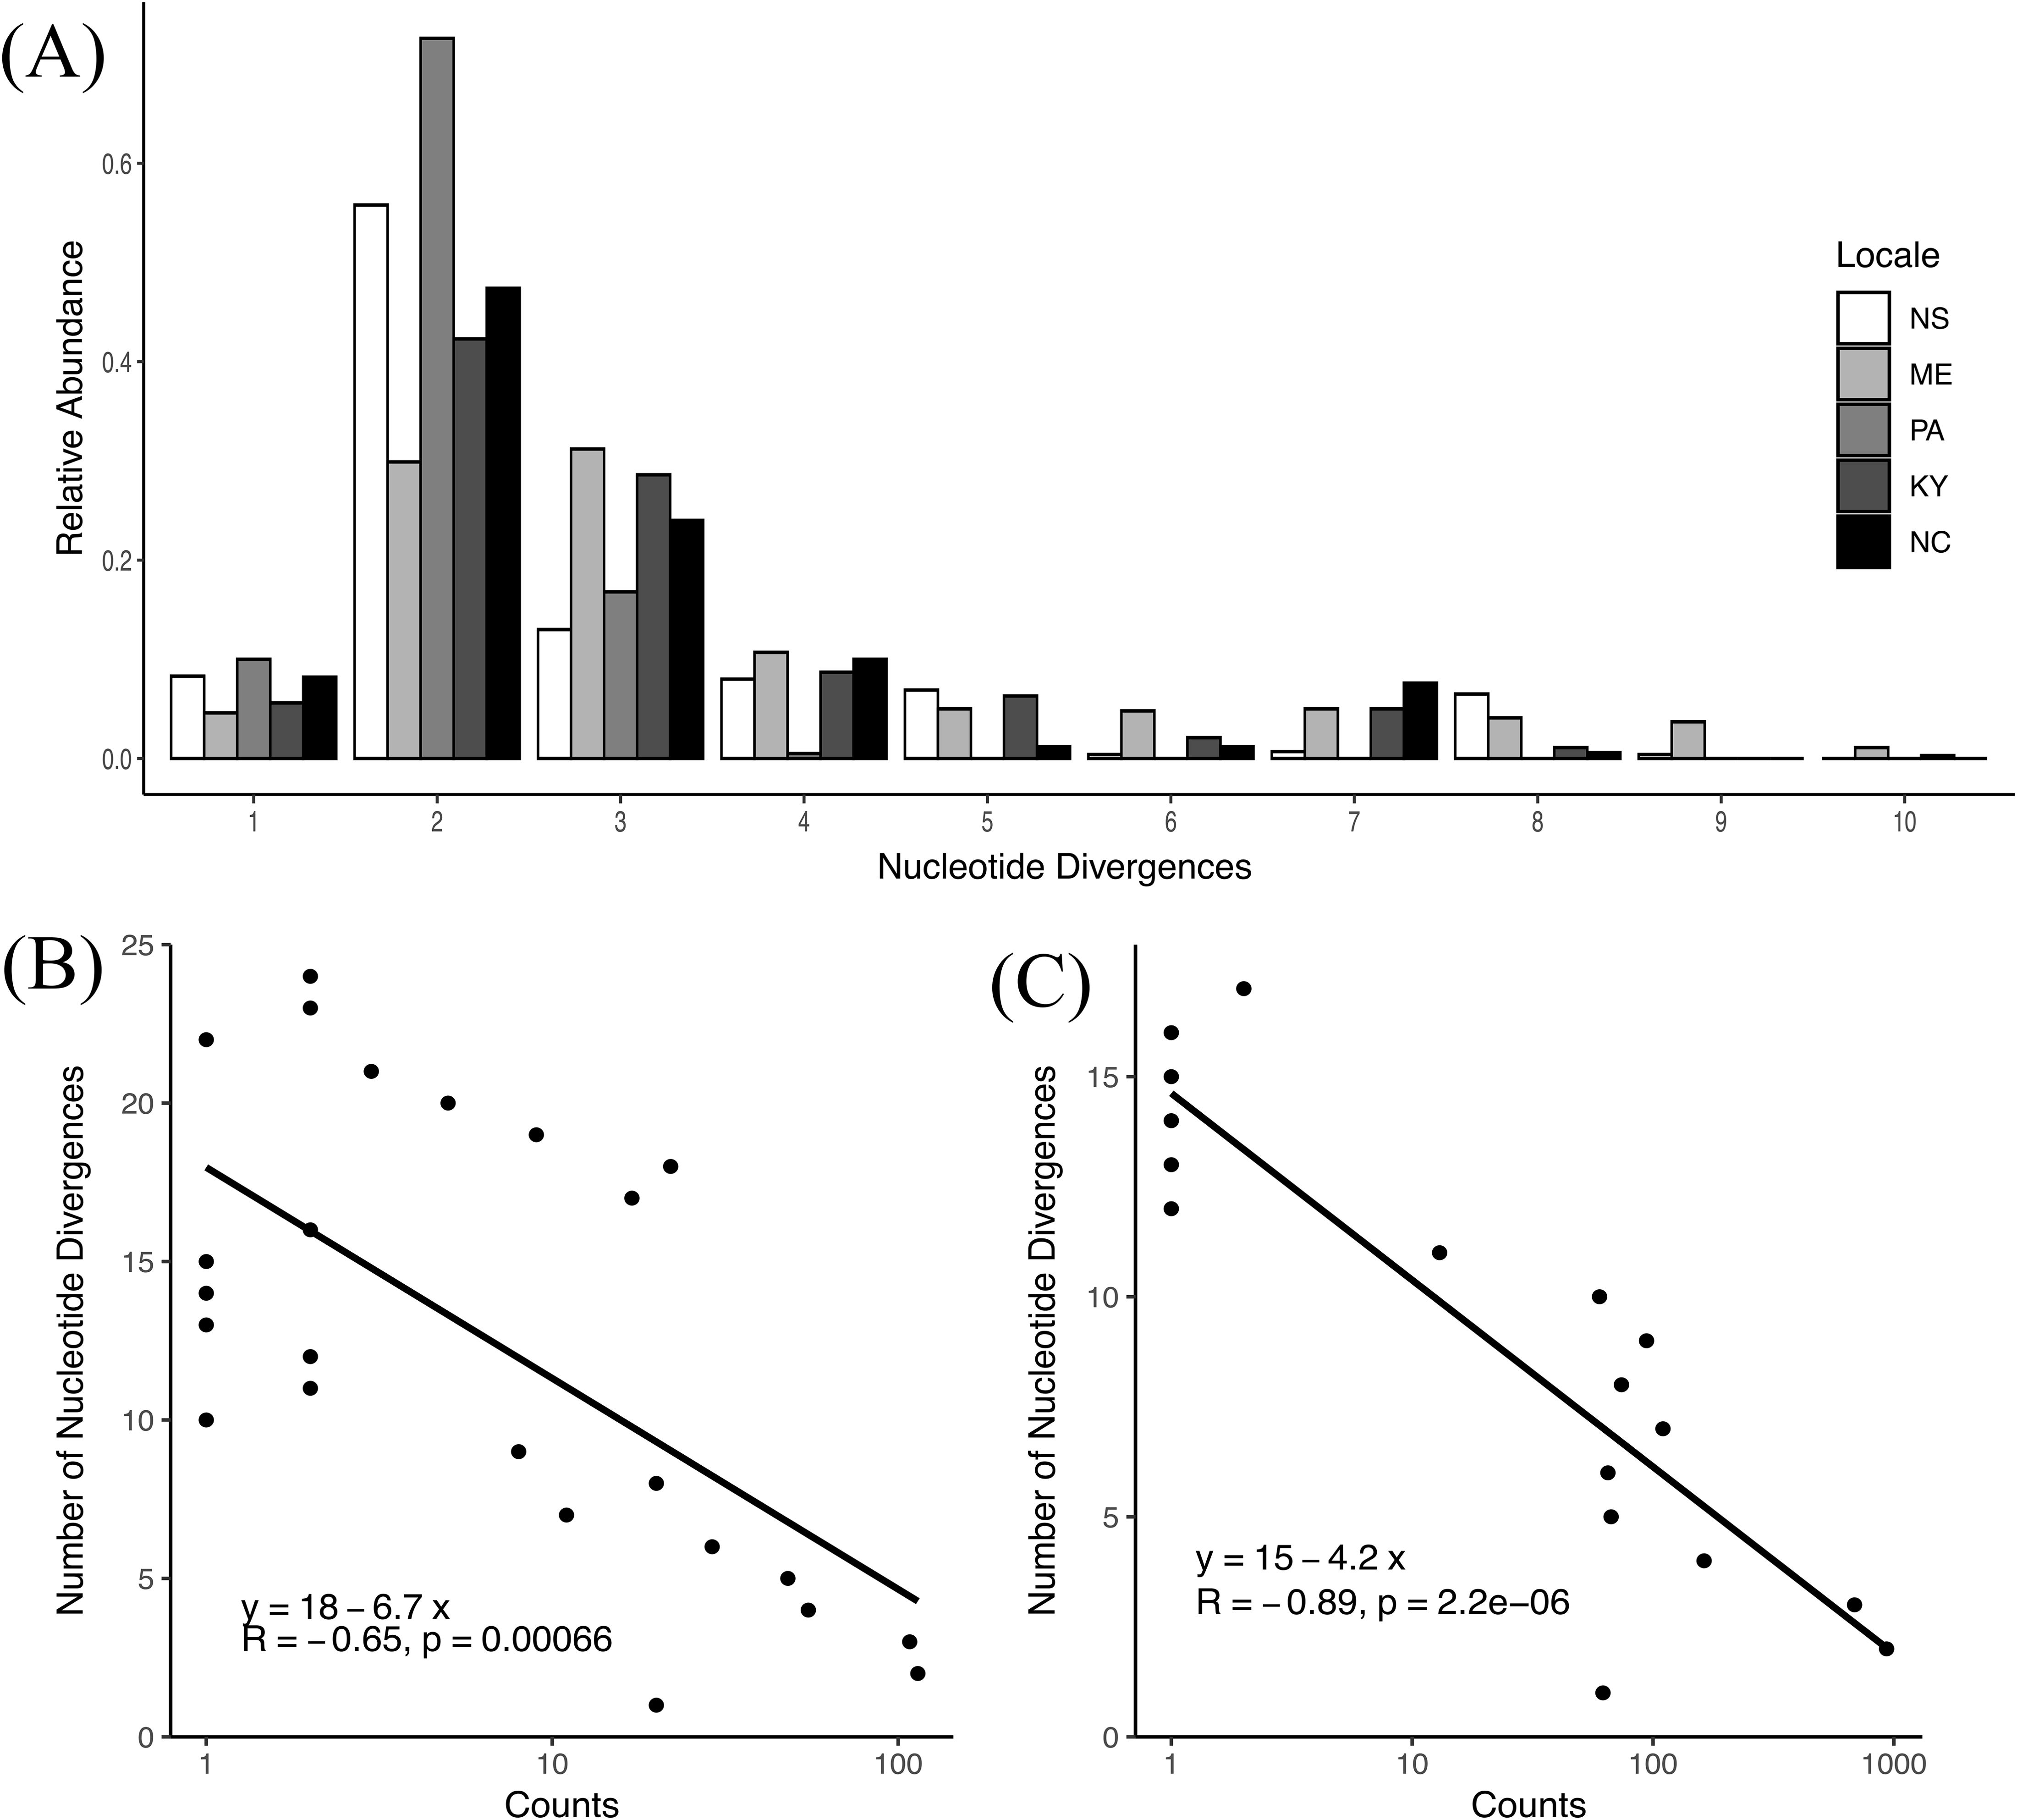
Figure 2. An analysis of nucleotide divergences of ASVs and identity-abundance relationships. (A) The distribution and relative abundance of nucleotide divergences among locales derived from a fully permuted pairwise sequence comparison of ASVs from 2022 data. (B, C) Pairwise nucleotide divergences among ASVs plotted as a function of their relative abundance for data from (B) NS to NC (2022) and (C) Nova Scotia (2016, 2017; see Jurga et al., 2020).
To assess the temporal stability of results from 2022 sampling we re-analyzed amplicon sequence data from Jurga et al. (2020). We subjected those reads to DADA2 denoising and then classified them, filtered out non-chlorophytes and singletons as above. In order to focus on sequences classified as O. amblystomatis we also removed 2 ASVs corresponding to Chlamydomonas pseudogloeogama, a closely related species in the Oophila clade (Kim et al., 2014), that were detected in the 2016, but not the 2017 sample set from Jurga et al. (2020). We detected 31 ASVs with a mean of 10.00 ± 3.38 ASVs per capsule, a result highly consistent with the NS samples from 2022 data (25 ASVs, mean per capsule = 10.11 ± 1.94). Further, the same two ASVs (i.e., ASV A and B) identified from the 2022 data were most prevalent and numerically abundant in the Jurga data. In two capsules ASV B was numerically dominant over ASV A, but on average, A was dominant over B (mean ratio per capsule = 2.16 ± 0.79), a result consistent with 2022 data for NS (mean ratio per sample = 2.37 ± 0.51). We also discovered the same relationship between identity and relative abundance as we did for the 2022 data (Figure 2C). Finally, as above, we calculated both the mean nucleotide divergences between ASV A and all other ASVs (2.81 ± 3.99) and the mean pairwise divergences among all subdominant ASVs (5.48 ± 5.42), for a 1.95X difference. Therefore, consistent with 2022 data, mean pairwise divergences among subdominant ASVs are significantly greater than mean pairwise distances between subdominant ASVs and ASV A (Mann-Whitney normal approximation Z = -6.867, p = 6.549 X 10⁻⁹, effect size = 0.340).
To visualize the relationships of all ASVs we generated a haplotype network map. Consistent with the numerical analysis above, most haplotypes cluster around the dominant ASV A, with a minor cluster around ASV B and its four derived haplotypes (Figure 3A). We decomposed the all-locales haplotype network into locale-specific networks and again all haplotypes cluster around ASV A (Supplementary Figure 1).
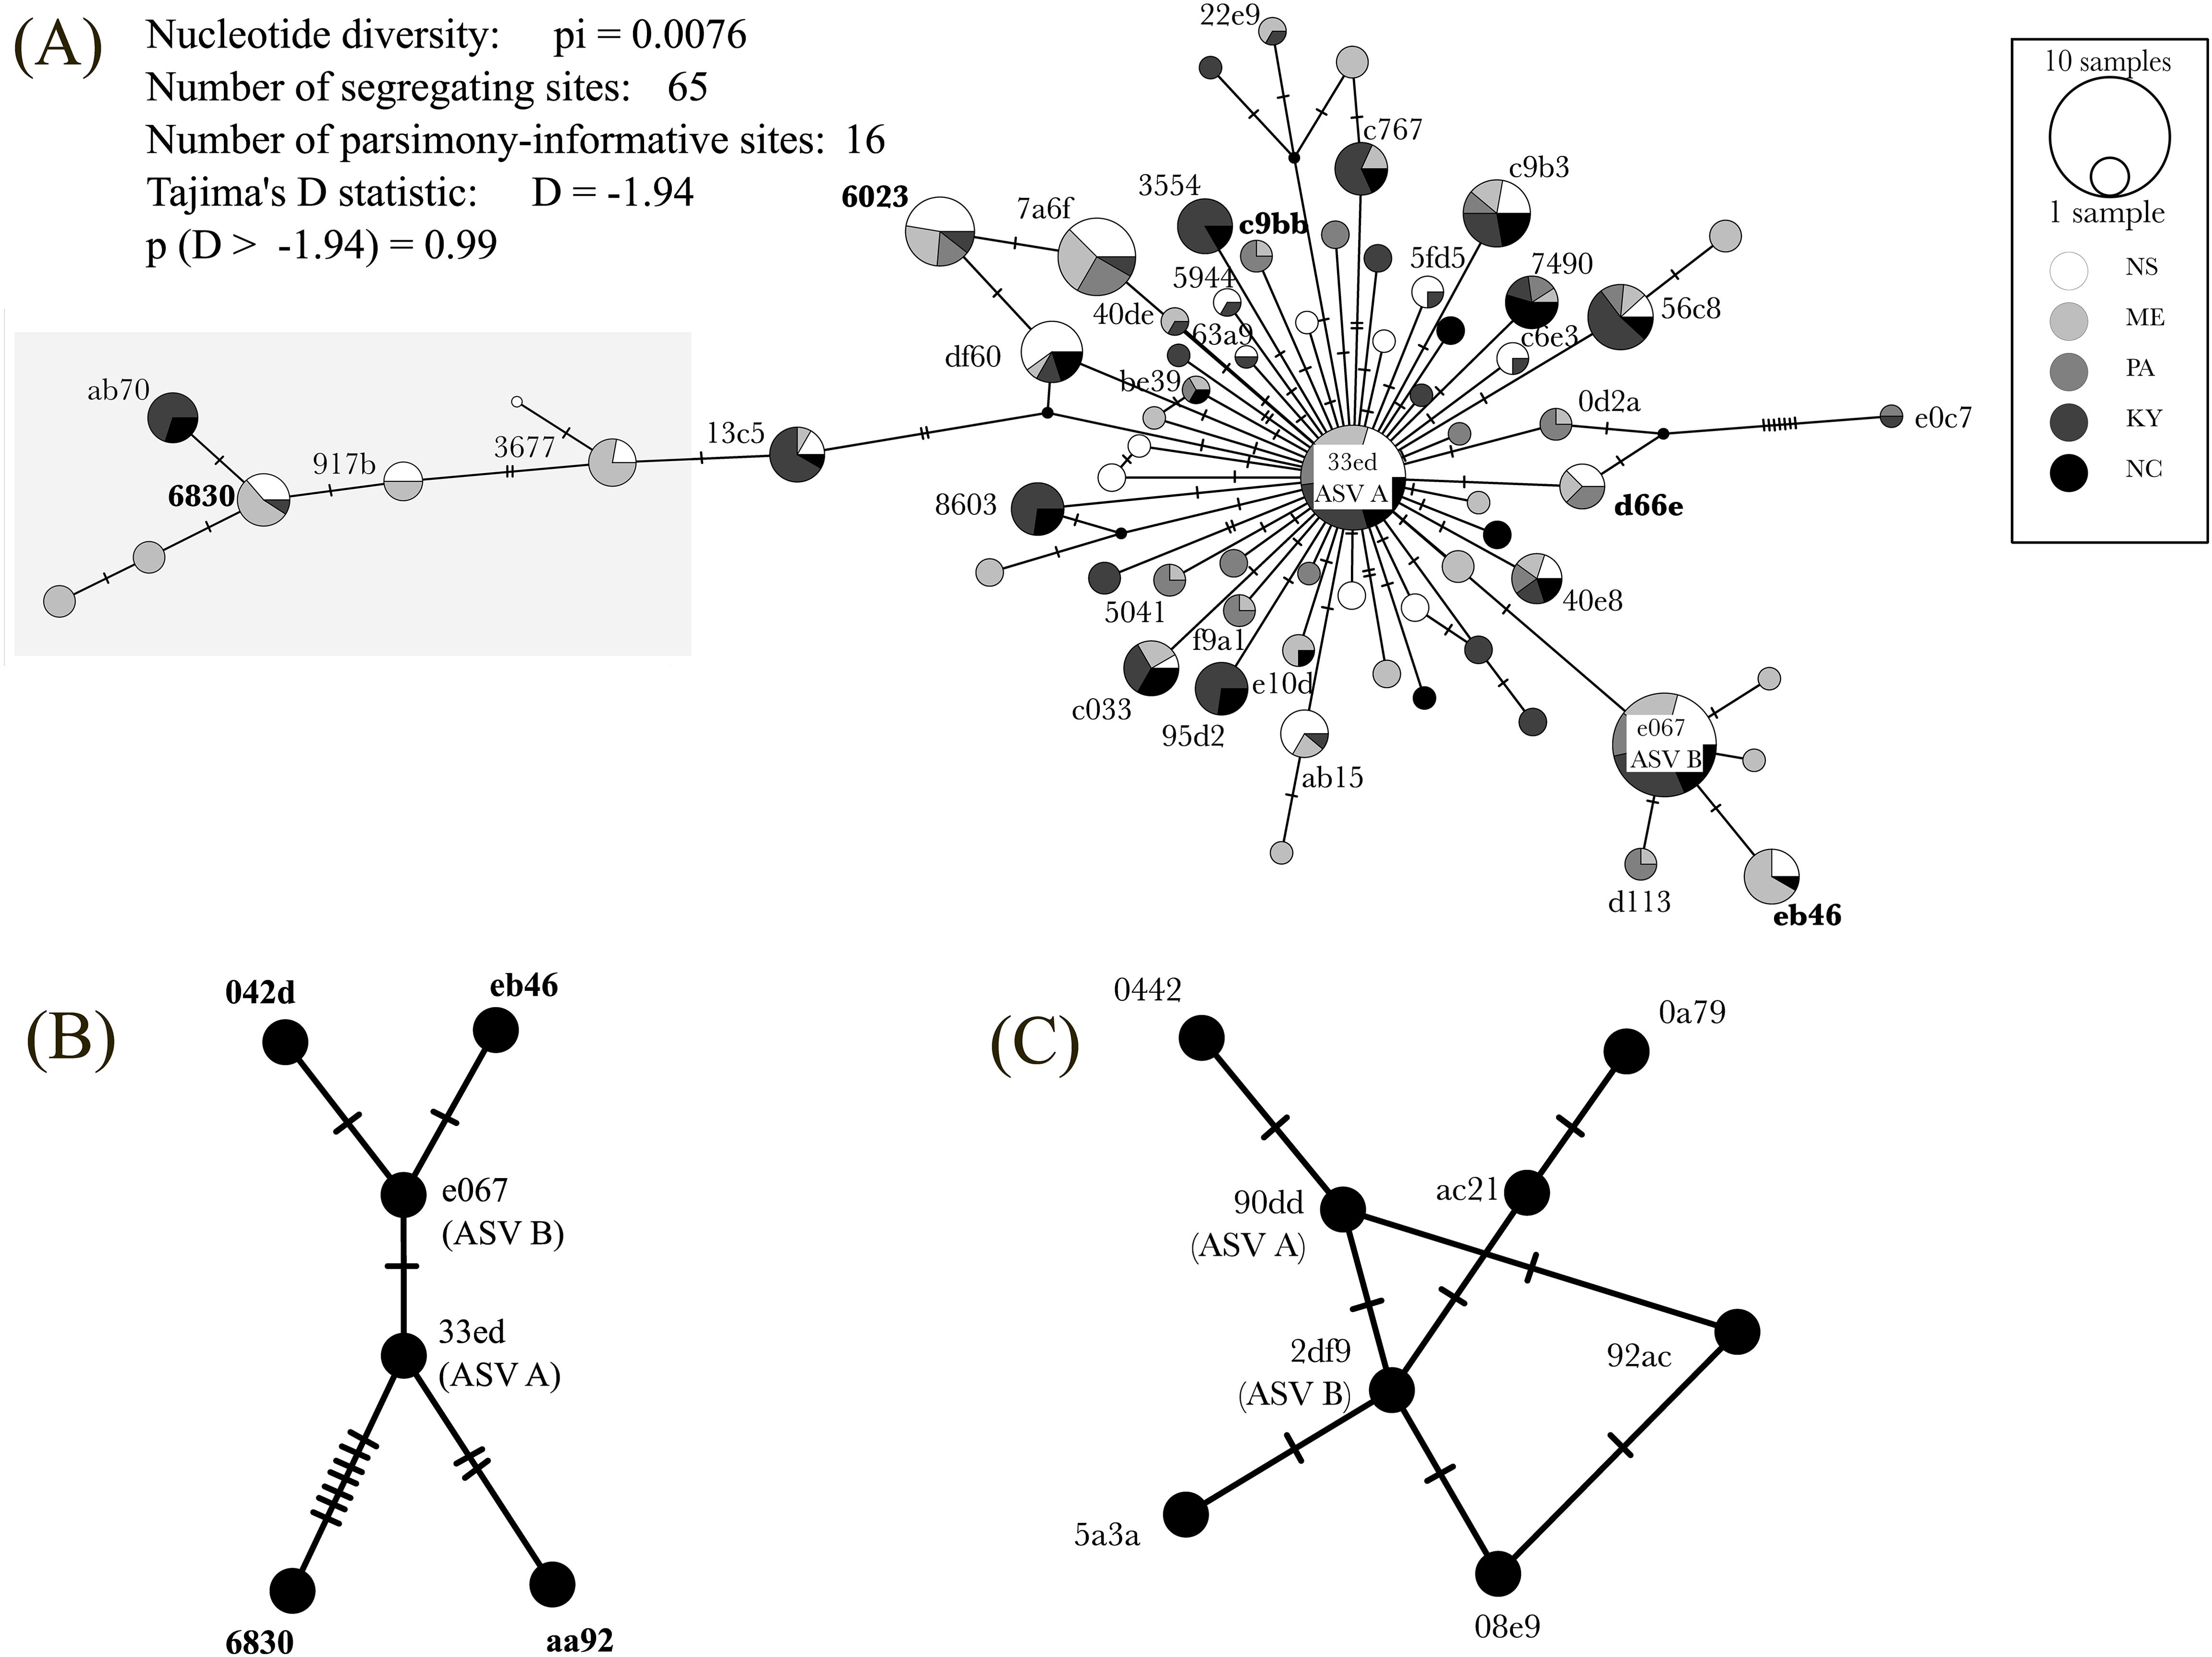
Figure 3. Haplotype maps of ASVs detected from IF and cultures. (A) Haplotype map of ASVs detected in 42 samples from 2022. Circles are labelled with the first four digits of the alphanumeric hash corresponding to their sequence (Supplementary Table 4). For clarity haplotypes present in only one locale are depicted but not labelled. Haplotypes in the gray box have <99% sequence identity with ASV (A) Statistics do not incorporate read depth for each ASV. (B) Haplotype map of ASVs from 18S rRNA V4 sequence detected from cultures of O. amblystomatis derived from single colonies. ASV A was present in all 20 cultures and in 1/20 cultures was the sole ASV detected; the remaining 5 ASVs were present in 19/20 cultures. (C) Haplotype map of ASVs from nearly full-length PacBio 18S rRNA sequence detected from cultures of O. amblystomatis derived from single colonies. The amplicon with an exact sequence match to 33ed (ASV A) from V4 sequence was present in all 20 cultures and was the sole ASV detected in 1/20 cultures; the remaining 7 ASVs were present in 19/20 cultures. Each hatch mark = 1 mutation. See Supplementary Figure 1 for locale-specific haplotype maps.
Cell culturing reveals intra-genomic variants
Pairwise sequence analysis revealed that greater than 99% of the ASVs had greater than 99% identity and, among subdominant ASVs (i.e., all but ASV A), only 0.25% of the reads had less than 99% identity with ASV A. This pattern is consistent with variation among intragenomic 18S rDNA copies in the marine diatom genus Chatoceros (de Luca et al., 2021), suggesting that some and perhaps all ASVs within a sample in the current study represent intragenomic variation. To test this, we isolated algae from capsules in Spring 2024 and then used these isolates to inoculate solid media. We then generated liquid cultures derived from single well-isolated colonies. We generated twenty such cultures and then subjected DNA extracts to Illumina and PacBio amplicon sequencing, as above.
Sequencing of the V4 region revealed a mean of 6.05 ± 0.69 ASVs per isolate and 19/20 isolates contained ASVs A and B (1/20 contained only ASV A), demonstrating both that these two core ASVs are intragenomic variants and that they can segregate. Importantly, this number of intragenomic variants accounts for ~60% of the mean number of ASVs detected in capsules, which confirms the non-independence of many of the ASVs detected corresponding to O. amblystomatis. Mean percentage of read counts for ASVs A and B in colony isolates (94.9 ± 1.3%) was significantly higher (Mann-Whitney two sample Z = 4.76, p = < 0.000002; effect size 0.57) than for all NS samples from capsules (92.13 ± 2.17%). Among all isolates, read counts for ASV B were uniformly higher than that of ASV A (Figure 4A; Supplementary Table 4) for a mean ratio of read counts for ASV B/A = 2.812 ± 0.242. This is surprising because it is the opposite of sequencing results from IF for NS samples, in which B was (nearly) always lower in read count than ASV A for a mean ratio of ASV B/A = 0.421 ± 0.216 (for 2022 samples) and 0.462 ± 0.364 (for 2016/2017 samples).
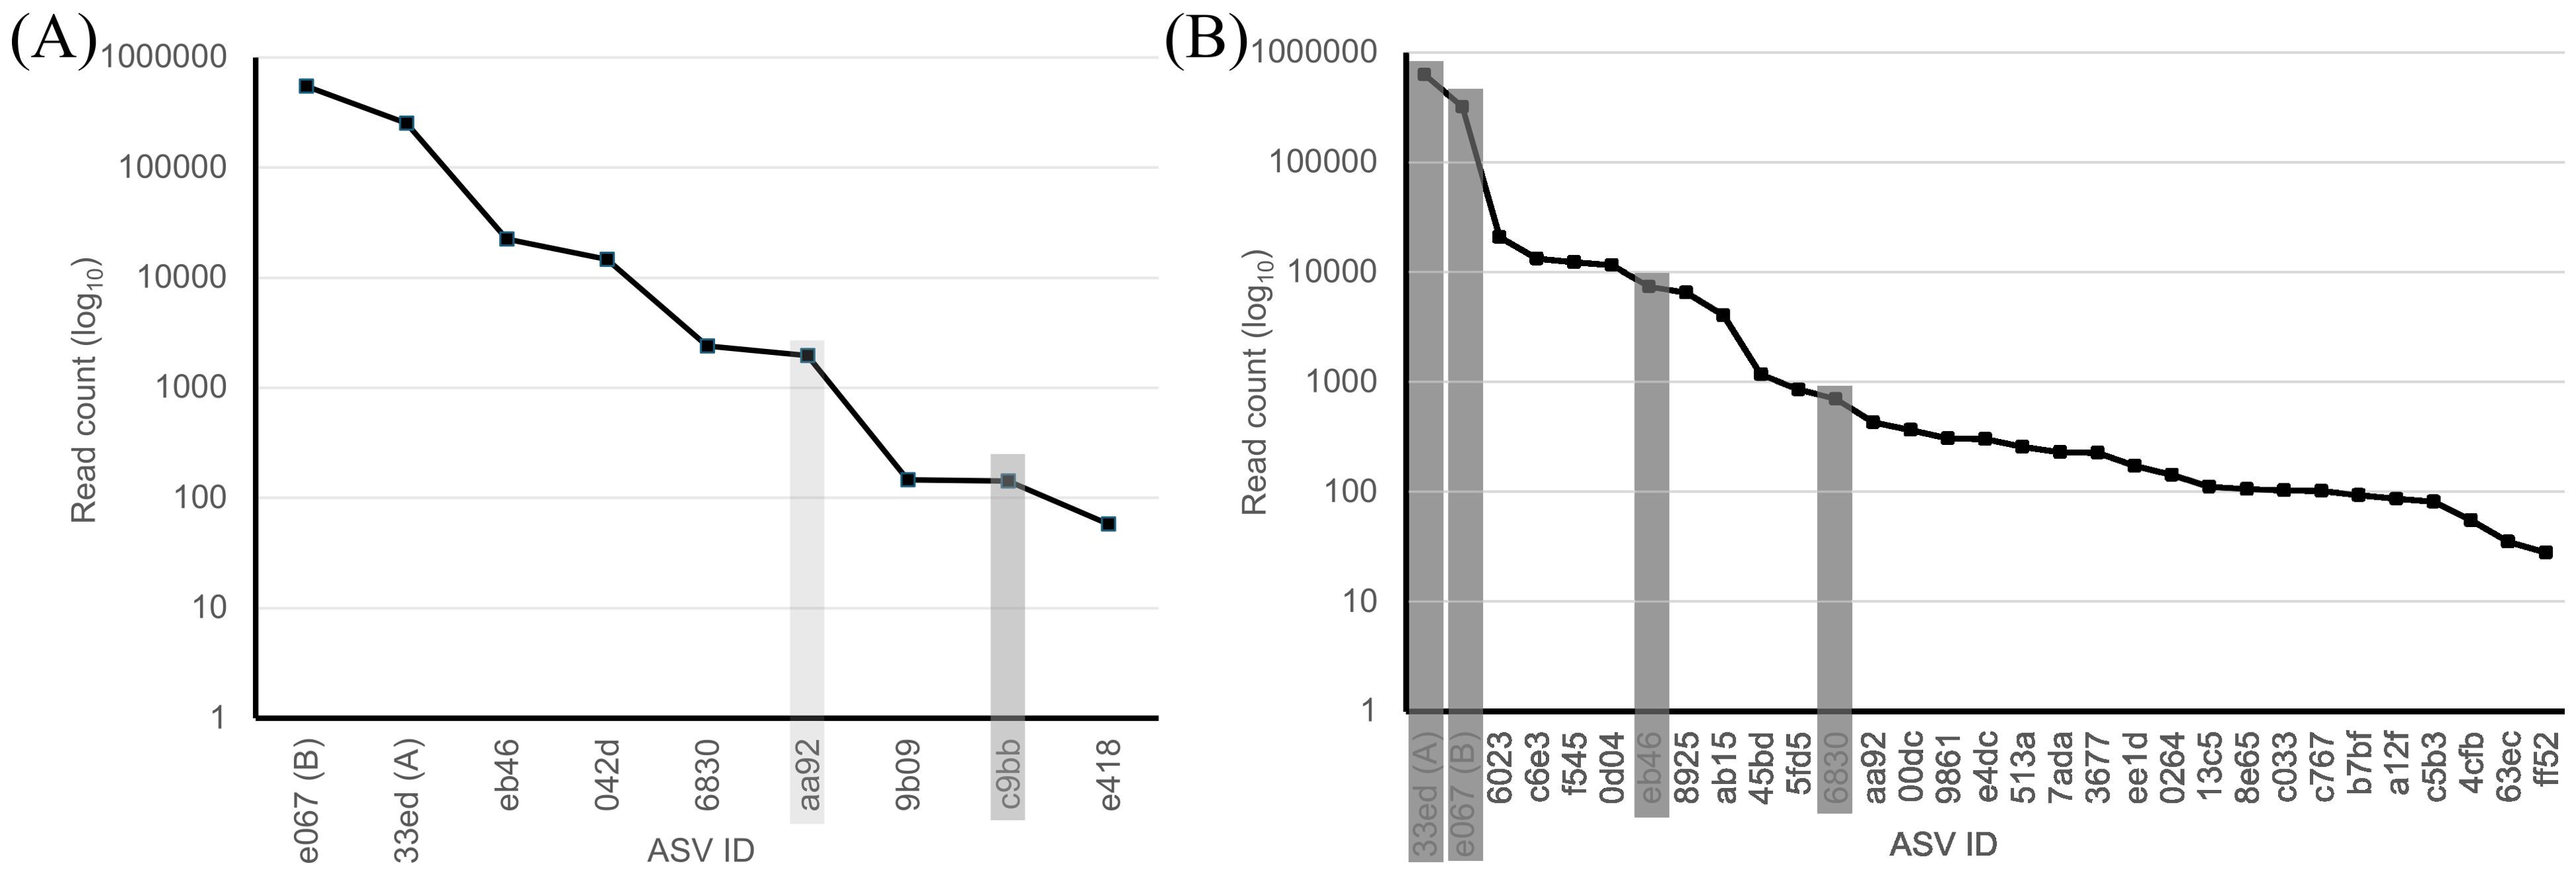
Figure 4. Abundance plots for ASVs detected from cultures and capsules. (A) ASVs identified from cultures of O. amblystomatis derived from single colonies in 2024. The light gray bar corresponds to an ASV identified from NS samples from 2016 and 2017 and the dark gray bar corresponds to ASVs in ME and PA from 2022. (B) ASVs identified from NS samples from 2022. Gray bars correspond to ASVs identified in 19/20 cultures of O. amblystomatis derived from colonies.
Four additional ASVs were detected in 19/20 cultures. These ASVs occurred in pairs, with one pair (eb46 and 042d) having ~10X and the other (6830 and aa92) having ~100X lower mean read counts than ASVs A and B (Supplementary Table 4). Three ASVs were present in 2/20 cultures, one of which (c9bb) was detected in samples from ME and PA in 2022 and (aa92) in NS samples from 2016 and 2017 (Figure 4B). ASV 042d from cultures was not detected in any IF samples. Pairwise sequence comparisons of ASVs from culture isolates revealed that 9/28 (32%) comparisons have lower than 99% sequence identity for a mean sequence identity of 98.9 ± 0.725%. ASV 6830, which was recovered in samples from NS (2016, 2017, 2002), ME and KY, has identities as low as 97.75% with ASV aa92 and 98.5% and 98.25% identity, respectively, with ASVs A and B. A haplotype map of these intragenomic variants (Figure 3B; Supplementary Figure 1) is consistent with those from samples from capsules: eb46 appears to be derived from ASV B (e067) and both 6830 and aa92 from ASV A (33ed). Because our protocol filtered out singletons, we manually examined minor ASVs detected in the one isolate that lacked ASV B. Two ASVs (d66e and 6023) were detected in IF samples from 2022, 2016 and 2017, indicating they are bona fide variants; six were not.
To verify the results from Illumina V4 amplicon sequencing, we subjected extracts from our cultures to PacBio Sequel II sequencing. We detected a total of 42 ASVs, 8 of which were prevalent in 19/20 isolates (2df9) and one was present in a single isolate (90dd) (Figure 3C). Along the V4 region 2df9 and 90dd were exact matches to ASVs B and A, respectively, from Illumina V4 sequencing. In support of this correspondence, the mean ratio of read counts for 2df9/90dd was 3.45 ± 0.642, which was not different from the mean ratio of ASV B/A from Illumina V4 sequencing (Welch’s T-test; T = 1.615, p = 0.115, effect size = 0.53).
Discussion
Specificity in the mutualism
We used 18S rRNA gene sequence diversity from cells in hospite as a proximate measure of specificity in the algal-salamander mutualism. Among 3.3 million reads from the V4 region and 0.17 million PacBio reads all chlorophytes detected in egg capsules of A. maculatum are O. amblystomatis, which are nested in Oophila clade B (Nema et al., 2019; Anslan et al., 2021; Vences et al., 2024). Along with previous work (Kim et al., 2014; Jurga et al., 2020) these results constitute mounting evidence that a narrow subset of lineages in subclade B have the capacity to access the inside of capsules. On the basis of sequence variation at the 18S rDNA locus and increasingly broad spatial and temporal sampling, it is clear that the mutualism between O. amblystomatis and A. maculatum has evolved a very high degree of partner specificity.
Jurga et al. (2020) detected 18S rRNA gene sequences in egg capsules corresponding to C. pseudogloeogama, an algal lineage isolated as a free-living species (Ettl and Gärtner, 1995) that nests in Oophila clade (Kim et al., 2014; Vences et al., 2024). Over the V4 region, C. pseudogloeogama and ASV A in the current study have a sequence identity of 95.5%. Similarly, more ASVs were observed in IF samples than observed from cultures of O. amblystomatis derived from single colonies, and some ASVs varied by as much as 5% in pairwise alignments, indicating that variation in capsules exceeds intragenomic variation from culture isolates. Our samples from 2022 were derived from up to six capsules from a single egg mass but NS samples from 2016 and 2017 corresponded to single capsules. Therefore, it may be that each capsule is invaded by more than one founder cell. A previous study (Kim et al., 2014) generated 18S rDNA sequences by cloning nearly full-length amplicons and then subjecting these to Sanger sequencing. ASV A in the present study was a 100% match to the V4 region of several of those clones (e.g., KJ711190.1) collected from IF from egg masses in the Greenbrook Sanctuary, NJ, USA and ASV B was a 100% match to the same region of other clones from Kim et al. (2014).
Using culture-based methods (which biases fast-growing lineages), Schultz (2016) and Nema et al. (2019) detected non-Oophila taxa associated with capsules. Based on all sequences derived thus far from IF, it seems plausible that those non-Oophila taxa were not inside capsules, but rather within the capsule membrane itself, or on the outside of those membranes, such that they were included in the population of culture inoculants. If so, this suggests that there may be host benefits that are attractive to potential partners but that, relative to the diversity of photosynthetic eukaryotes in breeding habitat (see Jurga et al., 2020) a low diversity of lineages is successful at detecting and accessing them. Similarly, a recent study by Anslan et al. (2021) used metabarcoding to examine green algal diversity associated with clutches of the agile frog Rana dalmatina. The authors did not separate IF from egg mass jelly outside the capsules, which revealed 50 OTUs (based upon the 18S rRNA gene) found on or inside clutches, including lineages in Oophila clade B.
Current evidence indicates that (most or all) symbionts are horizontally transmitted after females lay egg masses (Bishop, 2022), so there are multiple steps at which prospective symbionts must succeed in order to be represented in the pool of symbionts in hospite. First prospective symbionts must be present in the vicinity of egg masses. Lin and Bishop (2015) documented that this was true, but their methods relied on cloning amplicons and then subjecting them to Sanger sequencing so the presence and relative abundance in pond water of variants of O. amblystomatis detected here remains unknown. Secondly, all prospective symbionts must be able to detect and find egg masses and then penetrate the overlying jelly layer and individual capsule membranes before reproducing in the capsule. Third, once in capsules, the existence of a range of ASVs larger than that detected as intragenomic variants here suggests that more than one lineage of O. amblystomatis can invade capsules, invoking the possibility of competition. There is nothing known about these latter two processes so in order to interpret the patterns of variation we report here and to apply these results to theoretical predictions about co-existence in mutualisms (e.g., Johnson and Bronstein, 2019), future work will need to test the relative contribution of the pool of prospective variants, their differential invasion success and whether there is competition among variants in capsules.
Recent work on Rana temporaria in Finnoscandia (Eriksson et al., 2025) demonstrated that egg masses from this species associate with green algae, the seventh documented example of such an association. The authors generated 13 nearly full-length sequences of 18S rRNA gene sequences corresponding to either O. amblystomatis (Oophila clade B, sub-clade I) or Oophila sp. (Oophila clade B, sub-clade III). We conducted a pair wise sequence comparison between PacBio Sequel II sequences generated in this study against their sequences and found an exact match between 90dd (the cognate sequence to ASV A from the V4 region) and one of their sequences. This provides further evidence that 90dd/ASV A corresponds to both an ancestral and geographically widespread variant of the 18S rRNA gene in O. amblystomatis.
Oophila diversity and latitude
As a result of the very high specificity discussed above and the significant extent to which the non-prevalent ASVs are likely intragenomic variants, our data did not permit an estimation of interspecific diversity. Samples from Maine contained the highest number of unique ASVs but there was no latitudinal pattern. It is possible that there are multiple closely related lineages contributing to the pattern of variation that we observed, but no fine-scale taxonomic descriptions are yet available that would permit such distinctions and one of the most divergent ASVs (6830; see below) we detected is an intragenomic variant. Notwithstanding the limitations of taxonomic resolution, our results are similar to those of Harrison et al. (2024), who found no differences in richness of symbionts in a rhizobial-legume mutualism, but did detect differences in richness of non-rhizobial taxa.
There was a clear latitudinal pattern in the proportion of ASVs A and B with no comparable latitudinal pattern of non-prevalent ASVs. As above, this may suggest differential success (whether in breeding habitat, during invasion or growth inside capsules) of cells having ASVs A or B. Here, however, there is an important caveat to our results. In order for our results to be comparable to previous work, we sampled capsules containing embryos in stages 34-40; diversity could be higher earlier in development and become reduced later, as was observed for bacterial diversity in capsules of A. maculatum (Burgess and Bishop, 2023). Also, capsule membranes begin degrading as host embryos approach hatching (Harrison, 1969; stage 46). It would therefore not be surprising to discover an increase in microbial diversity as embryos approach hatching.
Intragenomic variants of 18S rDNA genes
A second element of variation was revealed by the relationship between identity and relative abundance of symbionts. The relative abundance and prevalence of ASVs decreased, on average, as nucleotide divergence from ASV A increased. This identity-abundance relationship, which was consistent between the 2022 and 2016 + 2017 datasets is reminiscent of a fitness landscape: prevalent and highly abundant ASVs have, by definition, the highest fitness. However, this analysis and interpretation assumed that ASVs are biologically independent entities. We tested this assumption by generating isolates derived from single colonies; founding cells were likely diploid zygotes, although in one case, in which only ASV A was detected, a founding cell could have been haploid. Amplicon sequence data from these cultures of O. amblystomatis partially, but clearly, demonstrates that many variants with low read count and prevalence in samples from capsules are likely to be haplotypes of low repeat number within 18S rDNA gene arrays. By contrast, whereas our isolates contained (with minimal variation) an average of 6 haplotypes, samples from individual capsules contained, on average, ~10 haplotypes, (ca. 40% more than isolates). This suggests that (i) the population of symbionts in capsules at the time of sampling is composed of mitotic descendants from more than one cell and (ii) there is fine-scale variation in prospective symbionts within and among host breeding pools.
A recent examination of concerted evolution in the 18S rDNA region of species in the marine diatom genus Chaetocerus revealed evidence for efficient, but incomplete, homogenization of gene copy variants (de Luca et al., 2021). In that study haplotypes of minor frequency occurred in their dataset, but such haplotypes varied by less than 0.5% from, and were at least 10X less abundant than, the dominant haplotype. In contrast to de Luca et al. (2023), we found two dominant haplotypes instead of one, which were recovered in all (ASVs A) or all but one (ASV B) of our IF samples. Secondly, we found four additional haplotypes common to all isolates, which were distinguished as pairs by their closely matching read counts that were ~10X and ~100X lower than the dominant haplotypes. In this case, however, haplotypes having ~10X lower read counts were 99.5-99.75% similar to the dominant haplotypes, but haplotypes having ~100X lower read counts were more divergent than expected under a regime of concerted evolution (~2% divergence) and in one case (6830) was geographically widespread, being present in three locales separated by 8 degrees of latitude. This pattern suggests that these minor haplotypes might be evolving under a different model than concerted evolution or drift. Alternatively, since not all rDNA copies are transcribed (Conconi et al., 1989) the more divergent copies detected here might be pseudogenes or otherwise not transcribed.
If we assume that the haplotype having the lowest mean read counts among our isolates (aa92) is present as a single copy and that the ratio of mean read counts for other ASVs reflects their relative copy number abundance, this suggests a haploid copy number of 18S rRNA genes of 213 ± 99. The existence of two dominant haplotypes suggests that, like Chlamydomonas reinhardtii (Payne et al., 2023) there may be two unlinked rDNA arrays in the O. amblystomatis genome. Whatever the genomic arrangement of these two dominant haplotypes, three results suggest they can segregate: (i) the ratio of ASVs A and B varied relative to each other with latitude (ii) the ratio of read counts for ASV A to B from our cultures of O. amblystomatis was ~1:3, for a ~6X difference compared to IF samples from NS and (iii) one of our cell culture isolates contained only ASV A.
Conditions in capsules and cultures may select for traits that are linked to ASVs A and ASV B, respectively, thereby increasing their frequency in the population of symbionts or cultures. A more speculative hypothesis, for which there is precedent, is that these rRNA gene variants may themselves be under selection. Intragenomic variation in rRNA gene copies (median of two variants/isolate) has been documented for yeast and several other eukaryotes (Sultanov and Hochwagen, 2022 and references therein) and differential expression of rRNA gene clusters was observable (De Capoa et al., 1985a) and inducible (De Capoa et al., 1985b) in humans. In bacteria, nutrient-limitation stress caused differential expression of rRNA alleles, with consequences both for expression of stress-response genes and several phenotypes (Kurylo et al., 2018). Therefore, we cannot exclude the possibility that ASVs A and B are functionally distinct intragenomic variants. Given the latitudinal pattern in their observed relative abundance in IF, temperature might be the selective agent, a hypothesis that is directly testable by culturing new cultures of O. amblystomatis at different temperatures and examining the resulting ratio of ASVs A and B.
Non-chlorophyte eukaryotes
We detected the presence of the same cercozoans protists and rhyzophydialean fungi detected in Jurga et al. (2020). Along with microscopical observations from Gilbert (1944), which likely corresponded to cercozoans, these results indicate that cercozoans are spatially and temporally consistent denizens of egg capsules of A. maculatum. By contrast, the prevalence of rhizophydialean fungi was lower and uneven, being detected most in ME. When detected, their relative abundance was high. The function of both eukaryotes in the mutualism, if any, remains unknown, but their unevenness within egg masses suggests that tests of their effects are suited to a comparative analysis. It is unknown if these taxa are exclusively found in egg capsules of A. maculatum, but if they are algal predators (Hess and Melkonian, 2013) and pathogens (Ibelings et al., 2004), respectively, then one might expect to find them in other amphibian taxa that associate with Oophila sp.
Conclusions
It is evident that the mutualism between unicellular algae and amphibian egg masses has evolved specificity at both the level of the Oophila B clade (Kim et al., 2014; Vences et al., 2024) and, in this report, at the species level between O. amblystomatis and A. maculatum. By definition this degree of specificity precluded evidence for locale or latitudinal effects on richness at the species level, but rather, revealed some locale effects on mean ASVs and an intriguing latitudinal effect on the relative abundance of two dominant ASVs. The vast majority of new isolates of O. amblystomatis derived from single colonies demonstrated that these two ASVs are intragenomic haplotypes and that their abundance relative to each other was reversed, compared to IF samples. These dominant haplotypes appear to be able segregate from each other, suggesting the possibility of fitness-linked traits associated with each haplotype or direct selection on them. This report sets a foundation for future comparative analyses of partner specificity for the six other known algal-egg mass mutualisms.
Data availability statement
Raw sequence reads and metadata files have been deposited in the SRA (BioProject: PRJNA1101545).
Ethics statement
The manuscript presents research on animals that do not require ethical approval for their study.
Author contributions
SW: Formal analysis, Funding acquisition, Writing – original draft. JB: Formal analysis, Resources, Writing – review & editing. RH: Resources, Writing – review & editing. RK: Resources, Writing – review & editing. CM: Resources, Writing – review & editing. CB: Resources, Writing – review & editing, Conceptualization, Data curation, Formal analysis, Funding acquisition, Investigation, Methodology, Project administration, Supervision, Writing – original draft.
Funding
The author(s) declare that financial support was received for the research and/or publication of this article. This work was funded by a Discovery Grant (RGPIN-2015-05040) and a Discovery Development Grant (DDG-2023-00003) from the Natural Sciences and Engineering Research Council of Canada (NSERC)to CB, an Undergraduate Student Research Award from NSERC to SW, and Gordon and Betty Moore Foundation #5604 to RK and JB.
Conflict of interest
The authors declare that the research was conducted in the absence of any commercial or financial relationships that could be construed as a potential conflict of interest.
Generative AI statement
The author(s) declare that no Generative AI was used in the creation of this manuscript.
Publisher’s note
All claims expressed in this article are solely those of the authors and do not necessarily represent those of their affiliated organizations, or those of the publisher, the editors and the reviewers. Any product that may be evaluated in this article, or claim that may be made by its manufacturer, is not guaranteed or endorsed by the publisher.
Supplementary material
The Supplementary Material for this article can be found online at: https://www.frontiersin.org/articles/10.3389/famrs.2025.1609494/full#supplementary-material
References
Aanen D. K., de Fine Licht H. H., Debets A. J. M., Kerstes N. A. G., Hoekstra R. F., and Boomsma J. J. (2009). High symbiont relatedness stabilizes mutualistic cooperation in fungus-growing termites. Science 326, 1103–1106. doi: 10.1126/science.1173462, PMID: 19965427
Anslan S., Sachs M., Rancilhac L., Brinkmann H., Petersen J., Küznel S., et al. (2021). Diversity and substrate-specificity of green algae and other micro-eukaryotes colonizing amphibian clutches in Germany, revealed by DNA metabarcoding. Sci. Nat. 108, 29. doi: 10.1007/s00114-021-01734-0, PMID: 34181110
Biada I., Santacreu M. A., González-Recio O., and Ibáñez-Escriche N. (2025). Comparative analysis of Illumina, PacBio, and nanopore for 16S rRNA gene sequencing of rabbit’s gut microbiota. Front. Microbiomes 4. doi: 10.3389/frmbi.2025.1587712
Bishop C. D. (2022). Pond water is the principal source of algae that form a symbiosis with embryos of the spotted salamander Ambystoma maculatum: an experimental test. Symbiosis 87, 107–120. doi: 10.1007/s13199-022-00857-w
Bishop C. D. and Garbary D. G. (2024). Taxonomy and nomenclature of Oophila amblystomatis Chlorophyceae, Chlamydomonadales). J. Phycol 60, 380–386. doi: 10.1111/jpy.13430, PMID: 38224483
Bolyen E., Rideout J. R., Dillon M. R., Bokulich N. A., Abnet C. C., Al-Ghalith G. A., et al. (2019). Reproducible, interactive, scalable and extensible microbiome data science using QIIME 2. Nat. Biotech. 37, 852–857. doi: 10.1038/s41587-019-0209-9, PMID: 31341288
Burgess W. and Bishop C. D. (2023). Bacterial diversity in egg capsular fluid of the spotted salamander Ambystoma maculatum decreases with embryonic development. Microb. Ecol. 86, 1789–1798. doi: 10.1007/s00248-023-02228-4, PMID: 37148310
Callahan B. J., McMurdie P. J., Rosen M. J., Han A. W., Johnson A. J. A., and Holmes S. P. (2016). DADA2: high-resolution sample inference from Illumina amplicon data. Nat. Methods 13, 581583. doi: 10.1038/nmeth.3869, PMID: 27214047
Carlson C., Akçay E., and Morsky B. (2023). The evolution of partner specificity in mutualisms. Evolution 77, 881–892. doi: 10.1093/evolut/qpac056, PMID: 36745019
Clement M., Snell Q., Walker P., Posada D., and Crandall K. (2002). “TCS: Estimating gene genealogies,” in Parallel and Distributed Processing Symposium, Ft. Lauderdale, USA. 7. doi: 10.1109/IPDPS.2002.1016585
Comeau A. M., Douglas G. M., and Langille M. G. I. (2017). Microbiome Helper: a custom and streamlined workflow for microbiome research. mSystems 2, e00127–e00116. doi: 10.1128/mSystems.00127-16, PMID: 28066818
Comeau A. M., Li W. K. W., Tremblay J-É., Carmack E. C., and Lovejoy C. (2011). Arctic ocean microbial community structure before and after the 2007 record sea ice minimum. PloS One 6, e27492. doi: 10.1371/journal.pone.0027492, PMID: 22096583
Conconi A., Widmer R. M., Koller T., and Sogo J. (1989). Two different chromatin structures coexist in ribosomal RNA genes throughout the cell cycle. Cell 57, 753–761. doi: 10.1016/0092-8674(89)90790-3, PMID: 2720786
De Capoa A., Baldini A., Marlekaj P., Natoli C., Rocchi M., Archidiacono N., et al. (1985b). Hormone-modulated rRNA gene activity is visualized by selective staining of the NOs. Cell Biol. Intl Rep. 9, 791–796. doi: 10.1016/0309-1651(85)90097-9, PMID: 2412710
De Capoa A., Marlekaj P., Baldini A., Archidiacono N., and Rocchi M. (1985a). The transcriptional activity of individual ribosomal dna gene clusters is modulated by serum concentration. J. Cell Sci. 74, 21–35. doi: 10.1242/jcs.74.1.21, PMID: 4030908
De Luca D., Wiebe H. C. F., Kooistra D. S., Biffali E., and Piredda R. (2021). Empirical evidence for concerted evolution in the 18S rDNA region of the planktonic diatom genus. Chaetoceros Sci. Rep. 11, 807. doi: 10.1038/s41598-020-80829-6, PMID: 33437054
Dhariwal A., Chong J., Habib S., King I. L., Agellon L. B., and Xia J. (2017). MicrobiomeAnalyst: a web-based tool for comprehensive statistical, visual and meta-analysis of microbiome data. Nucl. Acids Res. 45, W180–W188. doi: 10.1093/nar/gkx295, PMID: 28449106
Eriksson P. F., Kerney R., Larson-Pollock R., Vickers E., and Laugen A. T. (2025). Evidence of Holarctic distribution: common frog Rana temporaria eggs in Fennoscandia host photosymbiotic green algae (Oophila sp.). Oikos 2025, e10752. doi: 10.1111/oik.10752
Ettl H. and Gärtner G. (1995). Syllabus der Boden-, Luft- und Flechtenalgen (New York: Stuttgart, Jena), 722.
Gilbert P. W. (1944). The alga-egg relationship in Ambystoma maculatum, a case of symbiosis. Ecology 25, 366–369. doi: 10.2307/1931284
Hale H. E., Kennedy C., Winkleman D., and Brown C. (2017). An advantage of clear over white egg mass morphs in metabolically demanding microhabitats suggests a role of symbiotic algae in the maintenance of a polymorphism in the spotted salamander (Ambystoma maculatum). Evol. Ecol. Res. 18, 637–650.
Harrison R. G. (1969). “Harrison stages and description of the normal development of the spotted salamander, Amblystoma punctatum (Linn.),” in Organization and development of the embryo. Ed. Wilens S. (Yale University Press, New Haven, CT, USA), 44–66.
Harrison T. L., Parshuram Z., Frederickson M. E., and Stinchcombe J. R. (2024). Is there a latitudinal diversity gradient for symbiotic microbes? A case study with sensitive partridge peas. Mol. Ecol. 33, e17191. doi: 10.1111/mec.17191, PMID: 37941312
Hendriks L., Goris A., Neefs J.-M., Van De Peer Y., Hennebert G., and De Wachter R. (1989). The nucleotide sequence of the small ribosomal subunit RNA of the yeast Candida albicans and the evolutionary position of the fungi among the eukaryotes. Syst. Appl. Microbiol. 12, 223–229. doi: 10.1016/S0723-2020(89)80066-9
Hess S. and Melkonian M. (2013). The mystery of clade X: Orciraptor gen nov and Viridoraptor gen nov are highly specialized, algivorous amoebo-flagellates (Glissomonadida, Cercozoa). Protist 164, 706–747. doi: 10.1016/j.protis.2013.07.003, PMID: 23994723
Ibelings B. W., De Bruin A., Kagami M., Rijkeboer M., Brehm M., and van Donk E. (2004). Host parasite interactions between freshwater phytoplankton and chytrid fungi (Chytridiomycota). J. Phyc 40, 437–453. doi: 10.1111/j.1529-8817.2004.03117.x
Itoha H., Jangb S., Takeshitac K., Ohbayashid T., Ohnishie N., Mengf X.-Y., et al. (2019). Host–symbiont specificity determined by microbe–microbe competition in an insect gut. Proc. Natl. Acad. Sci. 116, 22673–22682. doi: 10.1073/pnas.1912397116, PMID: 31636183
Johnson C. A. and Bronstein J. L. (2019). Coexistence and competitive exclusion in mutualism. Ecology 100, 1–8. doi: 10.1002/ecy.2708, PMID: 30924140
Jurga E., Graham L., and Bishop C. D. (2020). Oophila is monophyletic within a three-taxon eukaryotic microbiome in egg masses of the salamander Ambystoma maculatum. Symbiosis 81, 187–199. doi: 10.1007/s13199-020-00693-w
Kato S. (1982). Laboratory culture and morphology of Colacium vesiculosum Ehrb. (Euglenophyceae). Jpn J. Phycol 30, 63–67.
Kerney R. (2011). Symbioses between salamander embryos and green algae. Symbiosis 54, 107–117. doi: 10.1007/s13199-011-0134-2
Kerney R., Kim E., Hangarter R. P., Heiss A., Bishop C., and Hall B. K. (2011). Intracellular invasion of green algae in a salamander host. Proc. Natl. Acad. Sci. 108, 6497–6502. doi: 10.1073/pnas.1018259108, PMID: 21464324
Kerney R., Leavitt J., Hill E., Zhang H., Kim E., and Burns J. (2019). Co-cultures of Oophila amblystomatis between Ambystoma maculatum and Ambystoma gracile hosts show host–symbiont fidelity. Symbiosis 78, 7385. doi: 10.1007/s13199-018-00591-2
Kim E., Lin Y., Kerney R., Blumenberg L., and Bishop C. (2014). Phylogenetic analysis of algal symbionts associated with four North American amphibian egg masses. PloS One 9, e108915. doi: 10.1371/journal.pone.0108915, PMID: 25393119
Kurylo C. M., Parks M. M., Juette M. F., Zinshteyn B., Altman R. B., Thibado J. K., et al. (2018). Endogenous rRNA sequence variation can regulate stress response gene expression and phenotype. Cell Rep. 25, 236–248. doi: 10.1016/j.celrep.2018.08.093, PMID: 30282032
Leigh J. W. and Bryant D. (2015). PopART: Full-feature software for haplotype network construction. Methods Ecol. Evol. 6, 1110–1116. doi: 10.1111/2041-210X.12410
Lin Y. and Bishop C. D. (2015). Identification of free-living Oophila amblystomatis (Chlorophyceae) from yellow spotted salamander and wood frog breeding habitat. Phycologia 54, 183–191. doi: 10.2216/14-076.1
Medlin L., Elwood H. J., Stickel S., and Sogin M. L. (1988). The characterization of enzymatically amplified eukaryotic 16S-like rRNA-coding regions. Gene 71, 491–499. doi: 10.1016/0378-1119(88)90066-2, PMID: 3224833
Mittelstrass J., Heinzelmann R., Eschen R., Hartmann M., Kupper Q., Schneider S., et al. (2025). Metabarcoding with Illumina and Oxford Nanopore Technologies provides complementary insights into tree seed mycobiota. Env. Microbiome 20, 1–18. doi: 10.1186/s40793-025-00712-7, PMID: 40390141
Muto K., Nishikawa K., Kamikawa R., and Miyashita H. (2017). Symbiotic green algae in eggs of Hynobius nigrescens, an amphibian endemic to. Jpn Phycol Res. 65, 171–174. doi: 10.1111/pre.12173
Nema M., Hanson M. L., and Müller K. M. (2019). Phylogeny of the egg-loving green alga Oophila amblystomatis (Chlamydomonadales) and its response to the herbicides atrazine and 2,4-D. Symbiosis 77, 23–29. doi: 10.1007/s13199-018-0564-1
Payne Z. L., Penny G. M., Turner T. N., and Dutcher S. K. (2023). A gap-free genome assembly of Chlamydomonas reinhardtii and detection of translocations induced by CRISPR-mediated mutagenesis. Plant Comms 4, 100493. doi: 10.1016/j.xplc.2022.100493, PMID: 36397679
Pedersen T. (2022). patchwork: The composer of plots. R package version 1.1.2. Available online at: https://CRAN.R-project.org/package=patchwork.
Pinder A. W. and Friet S. C. (1994). Oxygen transport in egg masses of the amphibians Rana sylvatica and Ambystoma maculatum: convection, diffusion and oxygen production by algae. J. Exp. Biol. 197, 17–30. doi: 10.1242/jeb.197.1.17, PMID: 9317252
Poole P., Ramachandran V., and Terpolilli J. (2018). Rhizobia: from saprophytes to endosymbionts. Nat. Rev. Microbiol. 16, 291–303. doi: 10.1038/nrmicro.2017.171, PMID: 29379215
Posit team (2024). RStudio: Integrated Development Environment for R (Boston, MA: Posit Software, PBC). Available online at: http://www.posit.co/.
R Core Team (2023). R: A Language and Environment for Statistical Computing (Vienna, Austria: R Foundation for Statistical Computing). Available online at: https://www.R-project.org/.
Schultz N. (2016). The symbiotic green algae, Oophila (Chlamydomonadales, Chlorophyceae): a heterotrophic growth study and taxonomic history. University of Connecticut, Mansfield (CT.
Shaw G. (1802). General Zoology or Systematic Natural History, vol. 3, Amphibians. Ed. Kearsley G. (UK: Kearsley).
Small D. and Bishop C. D. (2020). Physiological benefits and latent effects of an algal-salamander symbiosis. Comp. Biochem. Phys. 246, 110715. doi: 10.1016/j.cbpa.2020.110715, PMID: 32320756
Sultanov D. and Hochwagen A. (2022). Varying strength of selection contributes to the intragenomic diversity of rRNA genes. Nat. Comm 13, 7245. doi: 10.1038/s41467-022-34989-w, PMID: 36434003
Tattersall G. J. and Spiegelaar N. (2008). Embryonic motility and hatching success of Ambystoma maculatum are influenced by a symbiotic alga. Can. J. Zool 86, 1289–1298. doi: 10.1139/Z08-115
Vences M., Sachs M., Irisarri I., Bartels F., Eriksson P. F., Künzel S., et al. (2024). Phylotranscriptomic relationships of Oophila, a genus of green algae associated to amphibian egg clutches. Mol. Phyl Evol. 200, 108165. doi: 10.1016/j.ympev.2024.108165, PMID: 39117294
Wickham H. (2016). ggplot2: Elegant graphics for data analysis (New York: Springer-Verlag). Available online at: https://ggplot2.tidyverse.org.
Wille N. (1909). “Conjugatae unde Chlorophyceae,” in VII Abteilung Chlorophyceae Syllabus der Pflanzenfamilien Band, 6, ed. Eds. Engler A. and Prantl K. (Gebr̈der Borntraeger, Berlin), 1–96.
Wollenberg M. S. and Ruby E. G. (2009). Population structure of Vibrio fischeri within the light organs of Euprimna scolopes squid from two Oahu (Hawaii) populations. Appl. Env. Micro 75, 193–202. doi: 10.1128/AEM.01792-08, PMID: 18997024
Wollenberg M. S. and Ruby E. G. (2012). Phylogeny and fitness of Vibrio fischeri from the light organs of Euprymna scolopes in two Oahu Hawaii populations. ISME J. 6, 352–362. doi: 10.1038/ismej.2011.92, PMID: 21776028
Keywords: symbiosis, mutualism, Oophila amblystomatis, amplicon sequencing, 18S (SSU) rRNA gene, Ambystoma maculatum
Citation: Wallace SE, Burns JA, Hale RE, Kerney RR, Mott CL and Bishop CD (2025) High partner specificity in an algal-salamander mutualism at continental scale. Front. Amphib. Reptile Sci. 3:1609494. doi: 10.3389/famrs.2025.1609494
Received: 10 April 2025; Accepted: 17 July 2025;
Published: 15 August 2025.
Edited by:
Liang Liang Xu, Neijiang Normal University, ChinaReviewed by:
Santosh Mogali, Karnatak University, IndiaMarius Wenzel, University of Aberdeen, United Kingdom
Copyright © 2025 Wallace, Burns, Hale, Kerney, Mott and Bishop. This is an open-access article distributed under the terms of the Creative Commons Attribution License (CC BY). The use, distribution or reproduction in other forums is permitted, provided the original author(s) and the copyright owner(s) are credited and that the original publication in this journal is cited, in accordance with accepted academic practice. No use, distribution or reproduction is permitted which does not comply with these terms.
*Correspondence: Cory D. Bishop, Y2Jpc2hvcEBzdGZ4LmNh