 Madison E. A. Harman1*
 Nicole R. Fuller2
 Benjamin Baiser1
 Jason K. Blackburn3,4
 Xiaolong Li1,4
 Andrea F. Currylow5†
 Amy A. Yackel Adams6
 Bryan G. Falk5,7†
 Christina M. Romagosa1
- 1Department of Wildlife Ecology and Conservation, College of Agricultural and Life Sciences, University of Florida, Gainesville, FL, United States
- 2Florida Museum of Natural History, University of Florida, Gainesville, FL, United States
- 3Spatial Epidemiology and Ecology Research Laboratory, Department of Geography, College of Liberal Arts and Sciences, University of Florida, Gainesville, FL, United States
- 4Emerging Pathogens Institute, University of Florida, Gainesville, FL, United States
- 5U.S. Geological Survey, Fort Collins Science Center – South Florida Field Station, Homestead, FL, United States
- 6U.S. Geological Survey, Fort Collins Science Center, Fort Collins, CO, United States
- 7National Park Service, Daniel Beard Center, Homestead, FL, United States
Invasive species are a widely recognized threat to ecosystems, where they can negatively affect native species through mechanisms such as predation, competition, and ecosystem modification, including altering seed dispersal. Quantifying these effects is essential to properly assess risk and inform management efforts. In Florida, USA, where introductions are numerous and frequent, one prominent invasive species is the Argentine black and white tegu (Salvator merianae). This large omnivorous lizard likely contributes to ecosystem disruption through all three mechanisms. To better understand the role of invasive tegus in Florida ecosystems, we analyzed the diet of two disjunct tegu populations: Miami-Dade County (established in approximately 2011) and Charlotte County (established in 2018). We identified gastrointestinal contents from 275 tegus caught between 2016 and 2021. Diet items spanned a vast range of vertebrates, invertebrates, and plants, representing 12 classes, 63 orders, and 126 families across a mix of native, invasive, and agricultural species. The most common diet groups were insects (in 97% of diets), mammals (81%), fruit (77%), and snails (60%). Vertebrate consumption was substantially more frequent in the invasive Florida populations relative to tegus in their native range. Tegus also demonstrated a tolerance for “toxic” plant and wildlife species. We used distance-based redundancy analyses to examine the influence of size, sex, capture month, habitat, and spatial autocorrelation on diet composition within each population. In both Florida populations, larger tegus and individuals captured earlier in the year tended to have more diverse diets, including higher frequencies of invasive gastropods and various vertebrates. Smaller tegus and those caught in later months exhibited lower dietary diversity and a greater reliance on fruits and insect groups, such as orthopterans. Our findings corroborate the generalist nature of tegus, whose broad and opportunistic diets likely expose a wide range of native species to predation and may facilitate the dispersal of invasive plants. Tegus’ ability to forage in both natural and degraded habitats likely increases the difficulty of extirpation and therefore supports the need for swift removal efforts in response to new introductions.
1 Introduction
The establishment and subsequent spread of invasive species is one of the greatest threats to biodiversity, behind habitat loss and climate change (Mainka and Howard, 2010). Invasive species can have negative effects on ecosystems through various mechanisms. The most common effects on native species include predation, competition for resources, and the spread of pathogens and parasites. Invasives can also alter the ecosystem structure via seed dispersal and extirpation of native predators or ecosystem engineers (Giery et al., 2017; Linders et al., 2019; Rogers et al., 2017; Woodward et al., 1990). Invasive species are detrimental to the health of the ecosystem as a whole and especially to vulnerable species (Simberloff, 2011). In addition to environmental threats, consequences of invasive species may extend to economic, social, and public heath sectors when invaders establish in urban or agricultural zones (Sementelli et al., 2008; Zanuncio-Junior et al., 2018).
The context of an introduction and the life history of the introduced species are important factors when evaluating potential effects and, therefore, whether it should be classified as invasive or simply non-native (Iannone et al., 2020; Lockwood et al., 2013; Wallach et al., 2015). For instance, a non-native species introduced to anthropogenically disturbed areas may not have substantial ecological consequences because biodiversity is already reduced (Cadotte et al., 2017; Ibáñez-Álamo et al., 2017). However, the same species could be financially costly in an agricultural setting where it feeds on crops (Zanuncio-Junior et al., 2018) or ecologically important in a natural habitat if it preys on threatened and endangered species (López-Darias et al., 2024). The latter cases would then be classified as “invasive” because they exert a negative influence in their introduced range (Iannone et al., 2020; Lockwood et al., 2013; Simberloff, 2011). Within each habitat, aspects of natural history such as behavioral differences between males and females, ontogenetic shifts in diet, or seasonal changes in activity patterns may determine or contribute to a non-native species’ degree of influence on its environment.
The same traits that make invasive species successful can simultaneously increase the severity of their impacts. The most successful invasives are typically generalists and r-strategists (e.g., highly fecund, rapid generational turnover, etc.), affording them the plasticity to quickly adapt to novel environments as they become established and disperse over short time periods (Crowder and Snyder, 2010; Norf et al., 2010). In the process, carnivorous or omnivorous generalists may prey on species from multiple trophic levels and cause trophic cascades (Crowder and Snyder, 2010). Invasive species may reduce native predator populations in a system, allowing prey species to multiply disproportionately with trickle down effects (Doody et al., 2015; O’Dowd et al., 2003; Walsh et al., 2016). Invaders can also destabilize the age structure of prey populations by removing reproductive adults or excessively depredating eggs and juveniles (Crowder and Snyder, 2010; Hixon et al., 2014). This influence may be subtle, as with long-lived organisms like turtles and tortoises where a decline in recruitment can go undetected for many years (Stanford et al., 2020). Alternatively, cases such as the brown treesnake in Guam demonstrate that invasives can result in stark ecological changes. The extinction and extirpation of Guam’s native birds has resulted in a “silent forest,” while the complete loss of native frugivores has drastically altered the plant composition of the forests by disrupting seed dispersal (Rogers et al., 2017).
The Argentine black and white tegu (Salvator merianae, hereafter tegu) is another example of an invasive generalist reptile with the potential to be highly destructive. These large, intelligent lizards can reach nearly half a meter snout to vent (Mercolli and Yanosky, 1994; Meshaka et al., 2019) and are considered strongly interacting species in their native range in South America, exerting broad influence on the environment as both predators and seed dispersers (Castro and Galetti, 2004; Paixão and Venticinque, 2020). They forage both actively and opportunistically, consuming a broad diet of small vertebrates, invertebrates, fruits, and carrion (Castro and Galetti, 2004; Kiefer and Sazima, 2002; Sazima and D’Angelo, 2013). Tegus mature within three years, live up to 20 years, and lay clutches of roughly 30 eggs, typically biennially (Meshaka et al., 2019). Their combination of high fecundity, omnivorous diet, and tolerance to various environmental conditions suggests that invasive tegus may readily adapt to novel environments and prey sources, exhibit rapid population growth, and be resilient to removal efforts (Currylow et al., 2021; Goetz et al., 2021; Lenz et al., 2011). Because of this, the introduction of tegus to Fernando de Noronha Archipelago in Brazil (Gaiotto et al., 2020) and to both Florida and Georgia in the United States (Haro et al., 2020; Offner et al., 2021; Quinn et al., 2022) has raised concerns. In fact, Florida’s wildlife management agency (Florida Fish and Wildlife Conservation Commission, FWC) has promulgated statute to limit movement and possession of Argentine black and white tegus (Chapter 68.5, Florida Administrative Code), due to threats of predation on and competition with native wildlife, as well as the consumption of agricultural crops. Invasive tegus in Florida have been reported pillaging nests of American alligators (Alligator mississippiensis) and consuming juvenile gopher tortoises (Gopherus polyphemus) (Mazzotti et al., 2015; Offner et al., 2021). This makes tegus a threat to other protected species such as the American crocodile (Crocodylus acutus), Eastern indigo snake (Drymarchon couperi), and the ground-nesting Cape Sable Seaside sparrow (Ammospiza maritima mirabilis; Mazzotti et al., 2015).
Tegu sightings in Florida began in 2006, and as of 2024 there have been intermittent reports in 40 counties throughout the state (Enge, 2007; EDDMapS). Due in part to its tropical climate, Florida is a hub for the live reptile trade. As a result, Florida also has a substantial problem with invasive herpetofaunal species due to multiple introductions through intentional and/or accidental releases by importers, breeders or hobbyist keepers (Krysko et al., 2016; Meshaka, 2011; Oliver et al., 1993; Quinn et al., 2022). Tegus are particularly popular in the international pet trade due to their intelligence and temperament (Jarnevich et al., 2018). There are now four distinct established tegu populations within Florida (Figure 1). The oldest and largest populations are located in Hillsborough/Polk Counties (first reported in 2006) and Miami-Dade County (sightings began in 2007; population confirmed in 2011, Pernas et al., 2012). The smallest, yet rapidly growing, population is in Charlotte County (established by 2018, Quinn et al., 2022). And the newest population is in St. Lucie County (established by 2020, EDDMapS).

Figure 1. Map of established invasive tegu populations in Florida and Georgia, USA, with insets showing study populations with analysis sample sizes. Points represent tegu capture locations color-coded by dominant habitat type within their home range buffer zone (500-m, excluding area across canals). Maps were created in ArcGIS Pro Version 10 (ESRI, Redlands, CA) using Florida Natural Areas Inventory Cooperative Land Cover v3.6.
This study aims to assess the context-dependent patterns of the tegu invasion by analyzing diet composition within the Miami-Dade County and Charlotte County populations. We investigate the predictive utility of environmental, spatial, temporal, and morphological factors on overall diet composition. This process of enumerating the tegu’s prey species in various conditions will also allow us to better assess threats to specific taxa. This information may assist managers both within and outside of Florida to allocate management efforts when and where they will be most efficacious and aid policymakers confronted with decisions to limit ownership or movement of tegus.
2 Materials and methods
2.1 Study areas
The Miami-Dade County tegu population (MDC) has been established along a system of canals adjacent to Everglades National Park (ENP) since at least 2011 (Pernas et al., 2012) and began encroaching into ENP in 2017 (Xiong, 2025). Habitats within the study area are variable. Pine rockland is scarce Florida habitat with high plant and wildlife endemism; it is characterized by exposed limestone, shrubby understory, and an open pine canopy. Natural areas to the south into Southern Glades Wildlife Management Area (WMA) are mostly hydric, open areas such as Jamaica swamp sawgrass (Cladium jamaicense) marshes or as prairies dominated by muhly grass (Muhlenbergia sericea). Freshwater forested wetlands are composed largely of pond apple (Annona glabra), coco plum (Chrysobalanus icaco), and other broad-leaved trees. Upland areas adjacent to the levees contain Florida poisontree (Metopium toxiferum), white bully (Sideroxylon salicifolium), dense palmettos (Sabal palmetto, Serenoa repens), and live oaks (Quercus spp.). Further from ENP, levees border agricultural land with field crops, row crops, fallow fields, and plant nurseries, which may include native and invasive species (Florida Natural Areas Inventory Cooperative Land Cover, FNAI CLC, Version 3.6). Common agricultural crops include squash and zucchini (Cucurbitaceae) and tomatoes (Solanum spp.). Although not well-represented in this study, MDC tegus are also prevalent in rural and urban areas within the nearby city of Homestead (Barraco, 2015).
Established in 2018, the Charlotte County tegu population (CHC) currently occupies a much smaller area. Although the full extent of the population is still unknown, trapping has focused on a mixture of natural and disturbed habitats just north of Fred C. Babcock/Cecil M. Webb WMA. In contrast to the open wetlands or forest hammocks of MDC, natural habitats in CHC are mostly mesic flatwoods with open, sandy areas, scrubby undergrowth, and sporadic pines (FNAI CLC, Version 3.6). Much of this study area consists of cattle ranches with improved pasture, where the land has been cleared and planted with preferred grasses (e.g., bahiagrass, Paspalum notatum) for cattle grazing. Ranchland is accompanied by orchards, groves, rural housing, and several businesses including an exotic reptile zoo (Quinn et al., 2022).
2.2 Tegu trapping and sample collection
Tegus were trapped and euthanized as part of control efforts by collaborating agencies, including the National Park Service (NPS), U.S. Geological Survey (USGS), and the Florida Fish and Wildlife Conservation Commission (FWC), between 2016 and 2021. Trapping occurred from February to October each year as tegus brumate through colder months (Currylow et al., 2021). Multiple trap types and baits were tested, with the most common method using a metal mesh trap baited with a raw chicken egg (Udell et al., 2022). Trap lines in MDC were primarily set along the canal and levee system outside ENP with limited traps following roads within park boundaries (Figure 1). Trapping in CHC occurred along roads bordering and north of Babcock Webb WMA (Figure 1).
We recorded capture and morphology data for all trapped tegus, including capture date, capture location coordinates (Universal Transverse Mercator, UTM), sex, snout-vent length (SVL; cm), tail length (cm), full body length (cm), tail condition (intact or broken/regenerated), and weight (g). A subset of tegus was necropsied to collect additional data on coelomic fat weight (CFW), reproductive status, parasites, and gastrointestinal contents. We collected gastrointestinal (GI) contents, hereafter called “diet samples,” from the entire GI tract and froze them until processing. Due to time constraints, we chose to examine a subset of diet contents that focused on mature tegus (>28 cm SVL), represented roughly equal numbers of males/females per month, and with an even distribution throughout the study area.
2.3 Diet contents
We examined gastrointestinal contents from tegus caught between 2016 and 2021 from the Miami-Dade County population and in 2021 from the Charlotte County population. Diet samples were thawed and gently rinsed in tap water through nested soil sieves (10/35/60 mesh = 2000/500/250 microns = 2/0.5/0.25 mm). We sorted contents visually using a Bausch and Lomb StereoZoom Microscope and stored items dry, in ethanol (95%), or in permanent slide-mounts depending on the material.
We identified diet items morphologically to the lowest taxonomic level possible using an Olympus CX23 light microscope, comparative specimens, and consultation with numerous subject-matter experts from the University of Florida, Florida International University, Florida Museum of Natural History, Smithsonian National Museum of Natural History, and Fairchild Botanical Gardens (see Acknowledgements). The specificity of identification depended on the taxa, the availability of literature or subject-matter experts, and the condition of the diet items themselves. Tegus chew or crush their prey, even ripping off chunks of larger items (Sazima and D’Angelo, 2013), which, coupled with digestive enzymes, meant that diet items were often highly fragmented. Identifications relied heavily on the shape, size, color, and texture of remaining pieces. More detail can be found in the Supplementary Material, but distinctive features are summarized here: Vertebrates were identified based on gross examination of scales, teeth, bones, claws, and skin, along with microscopy of hair and feathers. Arthropods were identified by available exoskeleton segments such as the head, thorax, abdomen, and wings. Gastropods were characterized by shell, periostracum, and radula. Plants were mainly identified by their seeds and sometimes by fruit, leaves, or sepals. When possible, we distinguished avian and reptilian eggs by the roundness, texture, and color of the shell. Most traps were baited with chicken eggs, though not all traps employed bait cages to prevent tegus from accessing the eggs. To account for this, we removed unknown eggshell pieces and those resembling chicken eggs from diet analyses; however, this may underrepresent predation on eggs of large ground-nesting birds, such as Muscovy ducks (Cairina moschata).
We summarized diet composition by tallying the number of tegus that consumed diet items in each order and dividing these by the total number of tegu diets examined to calculate frequency of occurrence (FO). We calculated FO values at the tegu population level and for the entire study. Although many diet studies present counts or biomass of diet items, we chose to record and analyze only presence or absence data due to our sampling methods, the types of prey items involved, and the way in which tegus consume their food (e.g., chewing). Digestion time varied between individual MDC tegus because they were held, unfed, for up to four days in captivity before euthanasia. Defecation was uncommon during this time, though it is possible some diet contents were passed prior to collection during necropsy. Additional factors influencing the degree of digestion—and thus our ability to identify or quantify dietary contents—included the composition and size of food items. For instance, soft-bodied organisms like caterpillars digest more quickly and thoroughly than the sclerotized chitinous exoskeleton of beetles or the keratinous scutes of turtles. Similarly, a large prey item like a cane toad will take longer to digest than a tiny oak toad, making the former easier to recognize even if their composition is similar and digestion time was held constant. Furthermore, the fragmented state of items like snail shells or insect segments prevented us from confidently determining a count of individual prey items.
To prepare for diet composition analysis, we created 34 summary categories, typically at the level of class or order, and converted diet data into binary values for presence (1) or absence (0) for each category. Diet items that could not be identified to at least class or into one of these categories were removed from the matrix. Plants were categorized as either fruits and fruit seeds, non-fruit seeds (e.g., grasses, sedges, asters), or miscellaneous vegetation (e.g., unidentifiable leaves and sticks). Small non-fruit seeds and miscellaneous vegetation were likely incidental, either stuck to or previously ingested by an intended prey item, such as a rodent. Even so, any potentially viable seed is important to consider given that tegus may be dispersing native and non-native plants within their environment; therefore, this category was included in the analyses. Similarly, although small insects (ants or beetles <2 mm long) have been excluded from previous studies due to their likely being incidental diet items (Barraco, 2015; Offner et al., 2021), we chose to include all insects because these species are still being consumed and contributing calorically to the tegus’ diets.
2.4 Environmental data
We imported tegu capture locations into ArcGIS Pro 10 (ESRI, Redlands, CA) to extract environmental data about where tegus were feeding. A single MDC tegu was missing coordinates and removed (n = 1/214, 0.5% of MDC tegus). We sourced habitat types from the Florida Natural Areas Index Cooperative Land Cover Map (FNAI CLC, Version 3.6), a land cover map developed by the Florida Fish and Wildlife Conservation Commission (FWC). This map has a 30-m accuracy level.
Telemetry data from Florida indicate that an invasive tegu’s average home range size is up to roughly 500 m in diameter and that tegus frequently use roads and levees as movement corridors and rarely cross canals (Klug et al., 2015; Mason et al., 2022). Therefore, we created a 500-m buffer around each tegu capture location, then excluded any portion on the opposite side of a canal. We used the “summarize within” tool to extract the spatial plurality value for FNAI’s “Name_State” variable within each tegu’s buffer zone. We also created a 500-m dissolved buffer encompassing all capture locations to represent the extent of the study area for each population (Figure 1).
The “Name_State” variable originally contains 77 unique habitat types, though not all of these were present within our study area. Extracted habitat types in MDC (n = 213) initially included Cropland/Pasture, Freshwater Forested Wetlands, High Intensity Urban, Marshes, Orchards/Groves, Pine Rockland, Prairies and Bogs, and Vineyard and Nurseries; in CHC (n = 61) habitat types included Improved Pasture, Mesic Flatwoods, Orchards/Groves, Rural, and Shrub and Brushland.
2.5 Analysis
2.5.1 Data cleaning and imputation
Prior to analysis, we explored and proofed data for outliers, missing values, and discrepancies, then imputed values for missing morphological data in R (Version 4.3.2, R Core Team, 2023). In total, 27 tegus (12.6% of 214) were removed from the MDC population prior to analysis: one tegu (0.5%) was missing capture coordinates and therefore habitat type; one tegu (0.5%) had incomplete diet records; 22 tegus (10.3%) had no neighbors in the spatial weights matrix described in Section 2.5.4; and 3 tegus (1.4%) represented single observations of categorical variables with insufficient sample size for analysis. None of the 61 CHC tegus were missing data.
We only used data from the MDC population to impute missing values for MDC tegus (n = 187 post-removals). Two MDC tegus were missing snout-vent length (SVL; n = 2/187, 1.1%), the second of which was also missing tail length and, consequently, total length (n = 1, 0.5% each). All MDC tegus captured in 2017 and 2020 were missing CFW (n = 31, 16.6%).
We imputed SVL, tail length, and CFW using predictive mean matching (PMM) in the “mice” package (Buuren and Groothuis-Oudshoorn, 2011). “Mice,” which stands for multivariate imputation by chained equations, was designed for use with multivariate datasets, leveraging relationships between variables to estimate missing values more accurately. Predictive mean matching preserves the distribution and variance of observed data by selecting donor values from cases with similar predicted values, which reduces the risk of pseudoreplication or over-smoothing.
We used the “quickpred” function to require a minimum pairwise correlation of 0.3 for a variable to be included in the imputation predictor matrix, as recommended in the “mice” package vignette (Buuren and Groothuis-Oudshoorn, 2011). Relevant variables provided to “mice” included: month, sex, weight, SVL, tail length, tail completeness, total length, and CFW. To prevent circularity, total length was not used as a predictor of SVL or tail length and was itself passively imputed as the sum of SVL and tail length. After applying the 0.3 cutoff, the predictor matrix for SVL included month, weight, tail length, and CFW; for tail length it included weight, SVL, tail completeness, and CFW; and for CFW it included weight, SVL, tail length, and total length.
Following vignette recommendations, we assessed plausibility by plotting the first 40 iterations of each imputation scenario using the “plot” method for “mids” objects, generated by the “mice.mids” function, to confirm stable convergence and retention of natural variation. We then compared observed and imputed values via “stripplot” function density and scatterplots. Although multiple imputation typically involves pooling results across several completed datasets to incorporate between-imputation variance, there is no standard pooling approach for our primary analysis method, the distance-based redundancy analysis, due to its complexity (Buuren and Groothuis-Oudshoorn, 2011). Therefore, we retained the first completed dataset from the final iteration for downstream analyses. Although this approach does not capture the full variability introduced by the imputation process, we expect any influence on ecological patterns detected to be minimal given the stability of our diagnostic plots and the relatively low proportion of missing data.
2.5.2 Tegu morphology
We ran two-way ANOVAs and post-hoc Tukey tests on tegu morphology (SVL and weight, separately) in R (Version 4.3.2, R Core Team, 2023) to check for inherent variation between populations and sexes among tegus in this study. We then repeated these analyses for all tegus necropsied in the 2021 trapping season to determine whether tegus selected for use in the diet study were representative of morphological patterns in the broader populations. This comparison was limited to a single season because all CHC tegu diets were collected in 2021 and therefore we were unable to investigate potential change over time. We assumed that equivalent results for diet study tegus and broader populations would suggest no sampling bias.
2.5.3 Explanatory variable selection
We removed tegu weight, tail length, total body length, and tail condition as explanatory variables due to their high correlation (>0.70) with SVL and/or CFW. Capture year could not be included as it was not comparable across populations. We chose to use capture month rather than a biologically relevant season due to the differences in tegu activity patterns across age and sex (Currylow et al., 2021; Fitzgerald, 1994; Winck and Cechin, 2008). In total, we retained 2 continuous variables (SVL and CFW) and 3 categorical variables (sex, month, and habitat type). From the latter, we removed tegus from categories with only a single observation (n = 3, 1.6%), including the month of January and the habitats Orchards/Groves and High Intensity Urban in MDC.
Before analysis, we assessed the normality of continuous variables after imputation using visual inspection of histograms, coefficient of variation, and Shapiro–Wilk tests. SVL was approximately symmetric in distribution, though the Shapiro–Wilk test indicated a deviation from strict normality (W = 0.951, p < 0.001). CFW was strongly right-skewed due to many tegus having no fat stores (weight of 0.0g). We log +1 transformed CFW, which reduced skewness of CFW but did not produce perfect normality (W = 0.944, p < 0.001). Given that distance-based redundancy analysis (db-RDA) does not require normally distributed predictors, these deviations were not expected to bias results, but the CFW transformation and standardization of both SVL and CFW were applied to improve model stability and comparability of effect sizes. Explanatory data were stored in a tegu-by-attribute matrix combined with the tegu-by-Moran’s Eigenvector Maps (MEM) matrix of significant spatial predictors described below.
2.5.4 Spatial autocorrelation
To measure and account for potential spatial autocorrelation within each population, we used the interactive “listw.explore” tool from the “adespatial” package to code two distance-based spatial weighting matrices (db-SWM), then used the “mem” function in the “adespatial” package to calculate MEMs based on these db-SWMs (Dray et al., 2023).
A spatial weighting matrix describes the strength of relatedness between points, here tegu capture coordinates, via the element-wise product of a connectivity matrix and a weights matrix. The connectivity matrix is composed of binary values denoting whether pairs of points are considered “neighbors” (1) or not (0). The weights matrix then describes the strength of each connection on a scale of 0-1. We used an ecologically informed approach, setting 500 m as the maximum distance (d) between neighbors and weighting by an inverse distance relationship (1-d/max(d)). This employs a distance decay hypothesis, where tegus caught closer together are assumed to have a higher likelihood of consuming similar diet items, and vice versa (Taylor, 1983). Therefore, as distance between two capture locations increases (up to a maximum of 500 m), the weight of their neighbor link declines toward 0. We jittered capture coordinates by 1 m using the “jitter” function from base R so that tegus with identical coordinates were correctly identified as neighbors but not moved enough to measurably decrease weights. Tegus further than 500 m apart were not considered neighbors and received a weight of 0. We removed 22 MDC tegus from the matrix and subsequent analyses due to having no neighbors. All tegus from CHC had at least one link and were included.
Moran’s Eigenvector Maps summarize spatial patterns by using eigen-decomposition to create orthogonal vectors, called eigenvectors, and their corresponding eigenvalues. Each MEM contains an eigenvector representing a spatial pattern in the data (e.g., quantifying the degree of relatedness between nearby points), and its eigenvalues, which are scaling factors indicating the amount of variation explained by that eigenvector. Higher absolute eigenvalues typically indicate significant global patterns, while lower values may describe local variation or weak autocorrelation. The utility of these MEMs as spatial predictors can be evaluated using the Moran’s I statistic to test for significant autocorrelation. We calculated MEMs based on the db-SWMs and initially kept all MEMs with positive autocorrelation; MEMs with negative autocorrelation patterns were not considered as spatial predictors in the db-RDA models. We used the “moran.randtest” function, also from the “adespatial” package, to perform a robust test with 999 permutations and an alpha of 0.05, then retained only significant positive MEMs (Dray et al., 2023). We also tested spatial autocorrelation in our continuous explanatory variables, SVL and CFW, using the same method.
2.5.5 Response data selection
Response data for each population consisted of a tegu-by-diet matrix composed of binary presence (1) or absence (0) values for each diet category. We also calculated the frequency of occurrence (FO) values of these diet categories for each population and stored values in a separate matrix. To prevent a disproportionate influence on the constrained ordination, we removed overly common (found in >95% diets) or overly rare (found in <5% diets) diet categories. We then transformed the remaining binary response data into Jaccard dissimilarity matrices for both populations using the “vegdist” function from the “vegan” package (Oksanen et al., 2024).
2.5.6 Distance-based redundancy analysis
To determine composition of diet categories for each tegu population given their size, sex, month of capture, and other covariates, we conducted db-RDAs using the “dbrda” function from the “vegan” package (Oksanen et al., 2024). We analyzed tegu populations separately due to their disjunct geography, lack of overlap in habitat types, and the presence of spatial autocorrelation in tegu capture locations, tegu size, and/or diet response data within one or both populations (Declerck et al., 2011). The response variables were diet categories. We initially examined spatial (MEMs) and non-spatial predictor variables (SVL, CFW, sex, month, and habitat) separately, conducting global tests and forward model selection on each set of variables before conditioning the best fit non-spatial model by significant MEMs in the final analysis (Borcard et al., 2011).
We began with a db-RDA of diet against MEMs, then tested the significance of the global model using vegan’s “anova.cca” function. If a significant global test indicated the presence of spatial autocorrelation in the data, we proceeded with forward model selection using the “ordiR2step” function. This function employs a double-stopping criterion described by Blanchet et al. (2008) to retain significant predictors (p < 0.05) and maximize the adjusted R2 value without exceeding that of the global model. We repeated this process to select significant non-spatial predictors. We then ran this best fit db-RDA and conditioned our predictors by the selected MEMs (Borcard et al., 2011). We checked the significance of the best fit model and its terms using the “anova.cca” function with 999 permutations. We also implemented partial db-RDAs to assess the relative contributions of the combined MEMs and each significant non-spatial predictor variable. This method quantifies the amount of variation attributed to one or more variables by conditioning for all other variables. Finally, we created triplots to visualize the results for each population. All data used in the analyses are published (Harman et al., 2025).
3 Results
3.1 Tegu sampling and morphology
We examined diet samples from 275 tegus, including 214 from MDC and 61 from CHC, with a focus on mature individuals (>28-cm SVL). Tegu captures over time and tegu morphology are summarized in Supplementary Figure 1 and Supplementary Table 1, respectively. Main effects of two-way ANOVAs and post-hoc Tukey tests after tegus with unknown sex (n = 5) were removed showed that males and females used in this diet study had comparable SVL (F = 0.000, p = 0.985) and comparable mass (F = 0.000, p = 0.995). We found that tegus from CHC were significantly, if not substantially, longer than tegus from MDC (F = 5.986, p = 0.015*), but had comparable mass (F = 0.809, p = 0.369). Similar analysis of all tegus necropsied in 2021 (n = 630 before removing n = 32 unknown sex) identified additional sex based and population level differences, discussed in Supplementary Table 2, indicating the subset of tegus used in this diet study may not be fully representative of invasive tegu morphology in the broader MDC and CHC populations. Asterisks indicate significant p-values (≤0.05).
3.2 Diet contents
We identified a total of 3,781 diet items across all samples, not including duplicates within an individual tegu. Each tegu consumed, on average, 13.5 ± 6.6 unique diet items. Prey items were counted as one unique item even if they were represented by multiple specimens of the same item (e.g., five lubber grasshoppers within the same tegu’s diet sample would count as one unique item).
Tegus from both populations consumed a diverse range of items including at least 44 unique vertebrates, 58 families of arthropods, and 4 families of gastropods (Table 1, Supplementary Table 3). Mammals were the most common vertebrate prey group (consumed by 81% of all tegus), followed by amphibians (37%), reptiles (36% excluding eggs), birds (13% excluding eggs), and fish (5%). Broadly, top vertebrate prey were rodents (52%), anurans (frogs and toads, 37%), reptile eggs (20%), lizards (19%), and snakes (18%). Most vertebrates were too digested to identify with high specificity. However, of those that were sufficiently intact, native prey included long-lived species like the Florida box turtle (Terrapene carolina bauri), striped mud turtle (Kinosternon baurii), and American eel (Anguilla rostrata). We found a variety of invasives, including but not limited to the black rat (Rattus rattus), house mouse (Mus musculus), Cuban treefrog (Osteopilus septentrionalis), cane toad (Rhinella spp.), Cuban brown anole (Anolis sagrei), brown hoplo catfish (Hoplosternum littorale), and Asian swamp eel (Monopterus albus cf.).

Table 1. Argentine black and white tegu (Salvator merianae) diet items in the Kingdom Animalia identified to Order level.
Nearly 97% of tegu diets contained one or more insects, making them by far the most frequent prey group among invertebrates (Table 1, Supplementary Table 4). Many additional arthropod taxa were present, including arachnids (22%), diplopods (millipedes, 4%), crustaceans (2%), and chilopods (centipedes, <1%). Within insects, hymenopterans (78%), orthopterans (77%), and coleopterans (59%) were the most common orders. Coleopterans were the most diverse group, containing at least 15 families and at least 31 species. Additional diverse orders included hemipterans (23%), lepidopterans (24%), and orthopterans, which were each represented by six families. Within orthopterans, the eastern lubber (Romalea microptera) was present in 41% of all tegu diets, making it the most prevalent insect species in the dataset. We identified several invasive pest species, such as the Pharoah ant (Monomorium pharaonis), brown marmorated stink bug (Halyomorpha halys), maize weevil (Sitophilus zeamais), and diaprepes root weevil (Diaprepes abbreviatus).
Gastropods, the only molluscan prey items, were another major food source (60%; Table 1, Supplementary Table 4). Nearly all snails with enough material to identify were the same species, an invasive known as the Cuban garden zachrysia (Zachrysia provisoria). However, we identified one instance of a second invasive snail species, Subulina octona.
Plant matter included fruits and seeds from 18 orders (Table 2, Supplementary Table 5). We documented at least 26 unique fruiting plants, including agricultural fruits and vegetables, ornamentals, natives, and invasives. We also observed numerous species and morphotypes of small non-fruit seeds, mostly within the order Poales (grasses and sedges, 37%). In total, 77% of tegus consumed fruits and/or fruit seeds and 71% of tegu diets included non-fruit seeds. The most prevalent native fruits were Florida figs (Ficus aurea) and shortleaf figs (F. citrifolia, 25% combined). Additional native fruits included coco plums (Chrysobalanus icaco), Florida poisontree (Metopium toxiferum), corky passionflower (Passiflora suberosa), pond apple (Annona glabra), and various palms and palmettos (Arecaceae, 7%), including the threatened Florida royal palm (Roystonea regia). Tegus foraged on families containing agricultural crops such as cucurbits (Cucurbitaceae, 15%), grapes (Vitaceae, 10%), and nightshades (Solanaceae, 5%). We also found several species of unidentified epizoochorous beggarticks (Bidens spp., 34%) that may include both native and invasive species. Balsam pear (Momordica charantia) and Brazilian peppertree (Schinus terebinthifolia) are examples of confirmed invasive plant seeds.
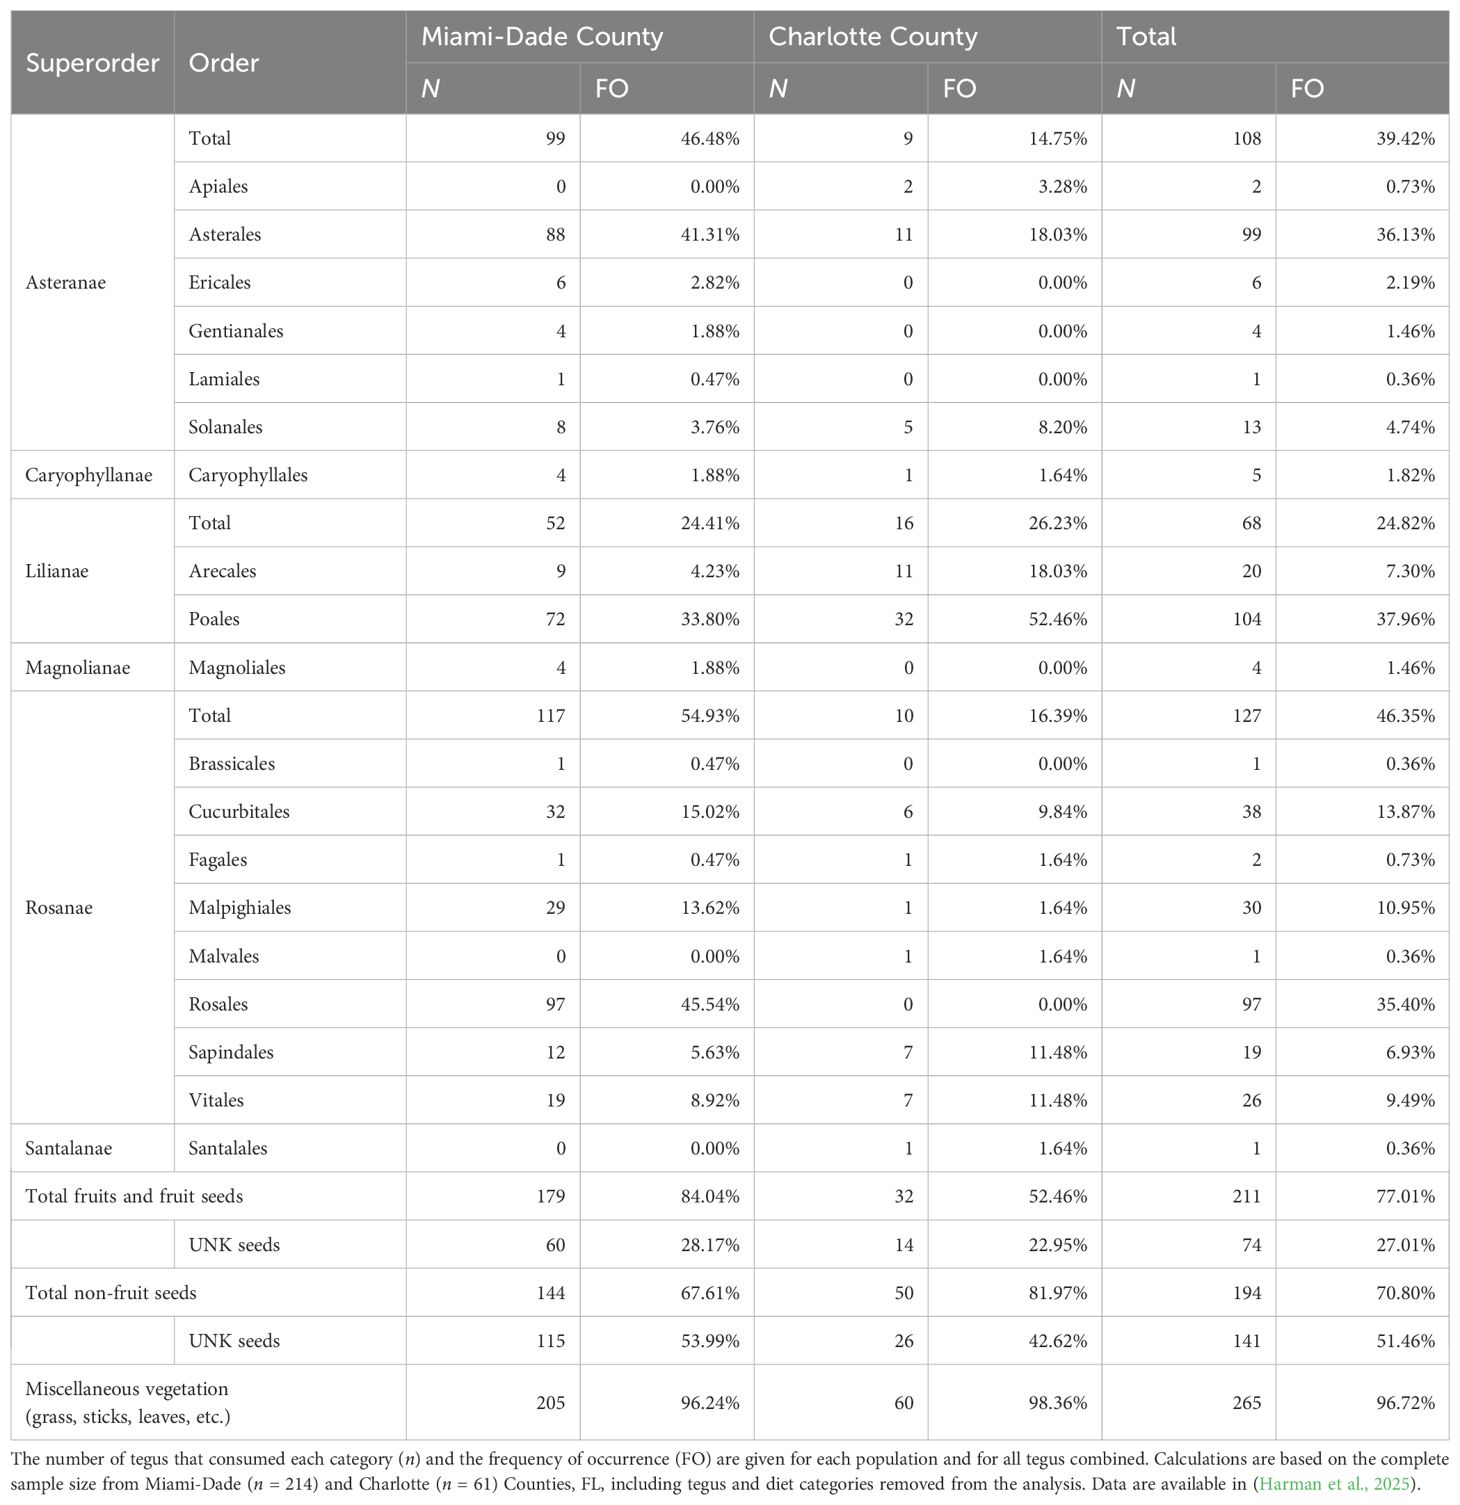
Table 2. Argentine black and white tegu (Salvator merianae) diet items in the Kingdom Plantae identified to Order level.
3.3 Environmental data
Dominant habitat types within the two study populations did not overlap after tegus with missing or rare data and those without spatial neighbors were removed from the analysis. The majority of tegus in MDC (n = 187 post-removal; Figure 1, right inset) occurred in Cropland/Pasture (n = 99, 53%), followed by Prairies and Bogs (n = 37, 20%), Marshes (n = 22, 12%), Freshwater Forested Wetlands (n = 21, 11%), Pine Rockland (n = 4, 2%), and Vineyards and Nurseries (n = 4, 2%). Tegus in CHC (n = 61; Figure 1, left inset) occupied mostly Rural areas (n = 23, 38%), then Improved Pasture (n = 19, 31%), Mesic Flatwoods (n = 10, 16%), Orchards/Groves (n = 7, 11%), and Shrub and Brushland (n = 2, 3%).
3.4 Spatial autocorrelation
Tegu captures showed significant spatial autocorrelation in both populations. Based on the spatial weighting matrices, we calculated 27 MEMs with positive autocorrelation for MDC and 9 for CHC (Supplementary Table 6). The Moran’s I test statistic was significant for all 27 MDC MEMs and for 8 of the CHC MEMs, indicating non-random distribution of tegu captures.
Among the continuous explanatory variables, we did not find significant positive spatial autocorrelation for CFW in MDC (p = 0.142) or within CHC for SVL (p = 0.181) or CFW (p = 0.210), supporting the null hypothesis that data were randomly distributed rather than spatially influenced (Supplementary Table 6). However, SVL in MDC was significantly autocorrelated (p = 0.001), indicating that similarly sized tegus were captured more closely together than would be expected at random. Although CFW in CHC also showed a significant spatial pattern (p = 0.003), this relationship was negative at short distances. Because our MEM-based modeling framework retained only significant positive spatial predictors, and CFW was included as a candidate variable in the non-spatial model selection process, this pattern was ultimately not incorporated into the final model.
3.5 Diet composition analysis
After removing overly common (>95%) and rare (<5%) diet categories from the analysis, MDC had 22 response variables and CHC had 25. Categories unique to CHC were fish, rabbits, and decapods.
Tegu captures were spatially structured in both populations, but diet composition showed spatial structure only in MDC. Global tests on spatial db-RDAs confirmed significant spatial autocorrelation in MDC (DF = 27, SS = 9.682, F = 1.711, p = 0.001*) and no significant autocorrelation in CHC diet composition (DF = 8, SS = 1.989, F = 1.213, p = 0.114). In MDC, forward selection identified nine significant MEMs, which were included in the best-fit model; no MEMs were selected for CHC. Global tests on non-spatial db-RDAs were significant for both populations. Model selection found that tegu diet in MDC was predicted by month, habitat, and SVL, while diet in CHC was predicted by month and SVL. Both models and each of their terms were significant (p < 0.05). This final best fit db-RDA for CHC (DF = 8, SS = 2.65 = 48, F = 4.721, p = 0.001*) constrained 20.94% of variation in the dataset, with the first two axes describing 6.16% and 5.50%, respectively (aR2CHC = 0.088). The final db-RDA for MDC contained the selected variables month, habitat, and SVL conditioned by the nine MEMs (DF = 14, SS = 5.514, F = 2.024, p = 0.001*). Combined MEMs conditioned 13.42% of variation within the data (aR2MDC = 0.090). Combined non-spatial predictors constrained another 12.82% of variance in the dataset, with the first two axes describing 5.52% and 2.91%, respectively (aR2MDC = 0.068).
Partial db-RDAs demonstrated that month was the most influential single contributor to the model for both populations, accounting for 7.09% of total variation in MDC (aR2 = 0.038, p = 0.001) and 16.46% in CHC (aR2 = 0.059, p = 0.003). Habitat described 2.58% in MDC (aR2 = 0.004) but was not significant after accounting for spatial autocorrelation (p = 0.357). Tegu size (SVL) described 1.80% in MDC (aR2 = 0.015, p = 0.001) and 4.50% in CHC (aR2 = 0.034, p = 0.003).
Although most diet categories were observed to some extent throughout the datasets, triplots demonstrate the temporal and ontogenetic patterns detected in the models (Figures 2A, B). Diet composition varied over time for both populations, with temporal trends predominantly described by the first axes and, to a lesser extent, dispersed around the second axes. Within each month, we found a gradient in diet composition corresponding to tegu SVL, though the vectors’ direction varied by population. In CHC, tegus caught from March to May occur in positive space along the first axis, while those from June through October have negative values (Figure 2B). On the second axis, March and August are set apart from April, June, and October. Small vertebrates like young rabbits, birds, and squamates, as well as both avian and reptilian eggs were all more common in the spring. In contrast, fall diets contained more fruits, anurans, and a greater variety of invertebrates (Figure 2B). In MDC, tegu diets show more overlap across months and the axis direction is switched, but diets show a similar pattern with earlier months (February through June) having negative values and later months (July through October) having positive values (Figure 2A). Additionally, February and March are positioned lower on the second axis and are furthest from May. In this population, tegus in the spring consumed a variety of insects and small vertebrates, then dietary diversity drops over time to rely on later-maturing fruits and orthopterans (Figure 2A).

Figure 2. (A) Triplot showing relationships between diet composition and significant predictors capture month (7.09% of model variance) and snout-vent length (SVL, 1.80%) for Miami-Dade County Florida tegus (n = 187). Silhouettes correspond to diet categories used in the analysis (Supplementary Table 7) and color density indicates concentration of data, where each data point corresponded to an individual tegu. Temporal differences occur primarily along distance-based redundancy analysis (db-RDA) axis 1 and, to a lesser extent, along axis 2; earlier months generally have lower or negative values and later months have higher values. Size-related differences (black arrow) corresponded strongly with axis 1, with SVL increasing in negative space. Tegus have highly seasonal activity patterns and prey availability changes throughout the year. Although we found a high degree of overlap, larger tegus and tegus captured earlier in the year had more diverse diets, while smaller individuals and those caught in later months exhibited less diversity and a greater reliance on fruits and insect groups, such as orthopterans. After positive spatial autocorrelation was accounted for by conditioning the effects of nine significant Moran’s Eigenvector Maps (combined MEMs, 13.42%), the effects of habitat were no longer significant. Additionally, despite the dataset including tegus of various sizes (SVL ranged from 13.2 - 43.0 cm), the majority of tegus in this study were mature (SVL averaged 29.5 ± 5.9 cm) and therefore our results may underestimate ontogenetic shifts in diet. (B) Diet composition triplot for Charlotte County (CHC) Florida tegus (n = 61), displaying significant predictors capture month (16.46% of model variation) and tegu snout-vent length (SVL) (4.50%). Silhouettes correspond to diet categories used in the analysis (Supplementary Table 8) and color density indicates concentration of data, where each data point corresponded to an individual tegu. Time of year aligns closely with distance-based redundancy analysis (db-RDA) axis 1, with earlier months in positive space and later months in negative space. Tegu SVL (black arrow) is predominantly described by axis 2 where it increases in positive space. Young rabbits, bird eggs, and reptilian eggs were more common in the spring, whereas anurans, fruits, and invertebrates were more prevalent and diverse in the fall. Larger tegus were more likely to ingest most vertebrate groups except amphibians. However, tegus in CHC ranged from 21.5 - 43.5 cm SVL with an average of 31.7 ± 4.9 cm. If smaller tegus were examined in higher numbers, the effects of SVL could be greater than those detected here. Spatial autocorrelation was not a significant contributor to this dataset.
Size related and potentially ontogenetic trends were smaller than temporal patterns but still significant. Overall, smaller tegus appeared to have less diverse diets with more reliance on fruits and invertebrate groups, especially orthopterans, while larger tegus consumed more gastropods and vertebrate prey groups (Figures 2A, B). In CHC, SVL increased with positive values and mainly along the second axis. Larger tegus preyed upon more mammals, while smaller tegus fed on anurans and a greater range of invertebrates (Figure 2B). In MDC, SVL increased with negative values on the first axis. Anurans, rodents, non-fruit seeds, and various invertebrates were more common in larger tegus, whereas diversity in small tegu diets was much lower. Additional dispersion in the MDC triplot stemmed from habitat; tegu diets overlapped substantially across habitat types on both axes, although tegus from Pine Rocklands and Vineyards and Nurseries appeared to have somewhat less diverse diets than tegus in other habitats (Figure 2A). Refer to Supplementary Table 7 for factor loadings for the two major axes.
4 Discussion
Argentine black and white tegus (Salvator merianae) consumed a highly diverse diet of vertebrates, invertebrates, and fruits in their invasive range. Tegus in this study preyed upon at least 44 vertebrate taxa, including mammals, reptiles, amphibians, birds, and fish. Many other taxa were also present, including gastropods, arthropods (insects, arachnids, crustaceans, millipedes, centipedes), and angiosperms (numerous fruits, smaller seeds, and vegetation). Fruiting plants included agricultural fruits and vegetables, ornamentals, natives, and invasives. Diet items contained evidence of cannibalism, scavenging on carrion (e.g., maggots, fly pupae, carrion beetles), and ingestion of human refuse (e.g., fertilizer beads, styrofoam). Tegus also fed on species normally considered toxic to predators, such as native lubber grasshoppers (Romalea microptera) and invasive anurans (i.e., Cuban treefrogs, Osteopilus septentrionalis, and cane toads, Rhinella spp.).
This diversity of prey items matches the omnivorous generalist behavior described by previous literature; however, reports vary for the relative importance of major prey groups within tegu diets (Barraco, 2015; Colli et al., 1998; Diniz et al., 2021; Mercolli and Yanosky, 1994; Offner et al., 2021; Sazima and D’Angelo, 2013). Our study is the largest to date (n = 275) and reports frequency of occurrence (FO) of 88% for vertebrates, 99% for invertebrates, and nearly 100% for plant matter. Approximately 65% of tegu diets contained fruit, though the total occurrence of seed consumption was 90% if grasses, asters, and other non-fruiting species are included. Offner et al. (2021) found similar results within the stomach contents of invasive tegus in Hillsborough County, Florida (n = 93), where FO was 81% vertebrates, 85% invertebrates, and 52% fruits (Offner et al., 2021). However, a previous diet study in Miami-Dade County (MDC, n = 169) observed FO of only 37% vertebrates, 76% invertebrates, and 50% fruits (Barraco, 2015). When split by population, our FO data in MDC (n = 214) was 85% vertebrates, 99% invertebrates, and 68% fruits, while FO in Charlotte County (CHC (n = 61) was 100% vertebrates, 98% invertebrates, and 51% fruits. One potential explanation for the discrepancies between our MDC data and those of Barraco (2015) is that juvenile tegus were better represented in the Barraco study; despite not finding statistically significant evidence for ontogenetic effects on overall diet, adult tegus consumed vertebrates more frequently than juveniles (46% compared to 29%, respectively). Alternatively, tegu diets may have shifted over time since the Barraco (2015) dataset was collected (i.e., 2011-2013) in accordance with prey availability, potentially as a result of ongoing disturbance by invasive species like tegus and Burmese pythons (Dorcas et al., 2012).
Invasive tegus in all three Florida studies consumed vertebrates more frequently than did counterparts in their native range: 44% in Argentina (n = 70) and 27% in Brazil (n = 15) (Barraco, 2015; Colli et al., 1998; Mercolli and Yanosky, 1994; Offner et al., 2021). In Argentina, 27% of tegus ate anurans, while FO was <6% for each of the other vertebrate groups (Mercolli and Yanosky, 1994). Visual observation, rather than gut content analysis, of 53 feeding events in another Brazilian study reported FO of 25% eggs from ground- or aquatic-nesting birds, 8% terrapin eggs, 4% rats, 2% hatchling tegus, 32% carrion fish, and 2% carrion opossum (Sazima and D’Angelo, 2013). In contrast, we found a much higher FO of 80% mammals, 36% anurans, 36% reptiles, 13% birds, and fewer fish (5%). We identified 17% avian eggs and 20% reptilian eggs, though these numbers may be less reliable than visual observations. Sazima and D’Angelo noted that tegus often broke open larger eggs and only ingested the inner contents, which indicates that studies based on gastrointestinal contents likely underestimate egg consumption (Sazima and D’Angelo, 2013). Overall, tegus appear to prey upon vertebrates far more frequently in Florida than in their native range. Nutrient-rich diets have been shown to facilitate rapid growth, reduce age at maturity, and increase reproductive output in reptiles (Avery et al., 1993; Doughty and Shine, 1998; Ford and Seigel, 1994; Madsen and Shine, 2000, 1999). These qualities contribute to establishment success and therefore may compound invasion effects on prey populations (Crowder and Snyder, 2010; Fisher et al., 2021; Winker et al., 2011).
On a broad scale, tegus from our two study populations appear to have similar diet composition; however, their apparent overlap may be an artifact of the higher classification levels necessitated by our analysis, coupled with the sheer number of items consumed by each tegu (average 13.4 ± 6.5 unique items). Upon closer inspection, diet composition in CHC was generally more diverse, with greater frequencies of many vertebrates (rabbits, mesomammals, squamates, birds, and bird eggs) and arthropods (coleopterans, hymenopterans, lepidopterans, arachnids, and crustaceans) than tegus in MDC. Overall, birds, fish, and insectivores (Eulipotyphla, shrews and moles) were relatively uncommon (each <15% of all tegus) yet were twice as likely to be found in CHC than MDC. Out of the 35 tegus that ate rabbits, 33 were from CHC. In contrast, anurans and turtles were found more frequently in MDC (12 out of 14 testudine observations). Squamates and their eggs were a frequent food source in both locations, although snakes were more common in CHC and lizards were more common in MDC. Snails were also much more prevalent in MDC than CHC (74% as opposed to 16%).
We found that the diet composition of tegus from both populations was best predicted by month and tegu size. Habitat was initially a useful predictor in MDC, but the effects were neutralized once we accounted for spatial autocorrelation within the response data. Since tegus are generalists and appear to feed opportunistically (e.g., scavenging on carrion, fruit, etc.), it follows that diet composition may be largely determined by prey availability (Barraco, 2015; Kiefer and Sazima, 2002; Offner et al., 2021; Sazima and D’Angelo, 2013). Environmental conditions and seasonality play a major role in determining which prey are present in a given area. For instance, many vertebrates have young in the spring, birds migrate in spring and fall, and many south Florida fruits ripen in late summer into fall. Tegus also have highly seasonal activity patterns that likely influence their feeding habits (Tattersall et al., 2016; Winck and Cechin, 2008). Tegus brumate for up to six months through the winter, emerge to feed and breed in spring, then adults remain active and juveniles hatch in late summer to early fall (Currylow et al., 2021; Enge, 2007;Meshaka et al., 2019). Unlike males, female tegus build and guard their nests after breeding (Fitzgerald, 1994; Winck and Cechin, 2008).
Foraging behaviors and hunting abilities are likely also influenced by life stage and, by proxy, size (Kiefer and Sazima, 2002). Tegus and other teiids are known to experience ontogenetic shifts in tooth shape and diet composition within their native range, where juveniles consume more arthropods and adults prey upon more vertebrates (Kiefer and Sazima, 2002; Presch, 1974; da Silva et al., 2020). Although tegus are not strictly gape limited (e.g., they often crack open eggs or rip off chunks of larger prey items), larger sizes would still enable predation on larger prey items and therein increase accessibility to a more varied diet (Sazima and D’Angelo, 2013). Unlike other studies in Florida (Barraco, 2015; Offner et al., 2021), our size-related findings more closely matched these native range descriptions. However, we did frequently observe small lizard eggs in the diet of younger tegus in MDC and small quantities of mesomammal hair (mostly raccoons, Procyon lotor, and Virginia opossums, Didelphis virginiana) in CHC. These findings may indicate successful scavenging efforts rather than hunting, as carrion feeding is common within the literature and these mammals are commonly hit along roadways (Kiefer and Sazima, 2002; Sazima and D’Angelo, 2013). Similarly, previous studies have suggested that tegus forage in or around water bodies, scavenging on dead fish that could have been dropped by birds or humans, and hunting for fish, crustaceans, and snails in shallow water (Kiefer and Sazima, 2002; Mercolli and Yanosky, 1994; Sazima and D’Angelo, 2013). The combination of fish and crayfish (Cambaridae) in several of our samples supports this assertion.
Among the two prior studies on invasive tegu diet in Florida, neither study found evidence of ontogenetic dietary changes, and only one study identified seasonal patterns (Barraco, 2015; Offner et al., 2021). Our study may have greater statistical power to identify these patterns due to its larger sample size. Additionally, our focus on mature individuals may cause the effects of SVL to be understated in our data relative to a survey that was more representative of smaller, younger individuals.
The invasive tegu populations of Miami-Dade County and Charlotte County experience different conditions, stemming from both the time since invasion and the environment in each location. Given that tegus reach maturity within three years and have been established in MDC for over two decades, this population is composed of multiple generations (Enge, 2007). Tegus in MDC are densely populated and have expanded well outside the initial introduction area. They also coexist with invasive Burmese pythons (Python molurus bivittatus), which have been established since at least the 1980s. Pythons have significantly altered Everglades ecosystems by preying on mammals, wading birds, and alligators (Dove et al., 2011; McCleery et al., 2015; Romagosa et al., 2023). As such, even MDC tegus living in “natural” habitats exist in a perturbed and potentially destabilized system (Sovie et al., 2016). In contrast, CHC prey communities are likely more intact because this population lies just north of the established range of Burmese pythons (Guzy et al., 2023). Our findings support this distinction, showing that CHC tegus consumed small mammals and mesomammals more frequently than MDC tegus. Although tegu capture numbers are increasing each year, the CHC tegu population is still relatively new and established over a small area. This may indicate that the diet of CHC tegus provides a more accurate picture of their potential to influence new areas if introduced elsewhere.
One of the main concerns surrounding invasive tegus is the threat of predation on imperiled species and their eggs, such as American crocodiles, Cape Sable seaside sparrows, and gopher tortoises. While these species are not prevalent within our study areas, we documented predation on numerous bird and reptile eggs that could not be specifically identified. Additional related prey items included both terrestrial and aquatic juvenile turtles (e.g., Terrapene carolina bauri, Kinosternon baurii) and various birds (e.g., Geothlypis trichas, Dumetella carolinensis, Rallidae). These results, coupled with other studies documenting predation on juvenile gopher tortoises (Gopherus polyphemus), indicate that invasive tegus are indeed a threat to vulnerable ground-nesting birds and reptiles (Offner et al., 2021). In fact, our findings suggest elevated risk to many small and medium terrestrial vertebrates if tegus were introduced to new areas. The Florida Keys, for example, host the federally endangered Key Largo woodrat (Neotoma floridana smalli), Key Largo cotton mouse (Peromyscus gossypinus allapaticola), Lower Keys marsh rabbit (Sylvilagus palustris hefneri), and many others (FWC, 2022). Half of all tegus in this study consumed at least one rodent, and over half of CHC tegus consumed a rabbit. Marsh rabbits nest aboveground, leaving young exposed to predation until they become independent (Holler and Conaway, 1979). Burrowing animals are not exempt from risk however; a previous study documented tegus emerging from gopher tortoise burrows and on another occasion digging up and depredating a mole (Enge, 2007). We corroborate this finding with insectivores (shrews and moles) in the diet of both tegu populations, although twice as common in CHC than MDC.
Another major concern related to tegu diets is their propensity to consume and disperse viable seeds, which could alter the composition of both native and invasive plants in these areas (Campagnoli and Christianini, 2024; Castro and Galetti, 2004). In MDC, prevalent fruits included native coco plums (Chrysobalanus icaco) and figs (Ficus aurea and F. citrifolia), as well as agricultural crops like cucurbits (Cucurbitaceae) from nearby fields. Tegus in CHC consumed a greater diversity of domestic and invasive fruits, including palms (Arecaceae), grapes (Vitis spp.), and occasionally invasive Brazilian peppertree (Schinus terebinthifolia). Notably, multiple MDC tegus ate Florida royal palm seeds (Roystonea regia), which are considered endangered by the FL Department of Agriculture and Consumer Services. Non-native knight anoles (Anolis equestris) in FL are known to feed on and pass viable Florida royal palm seeds, suggesting a rare instance where introduced lizards may benefit a native species’ recovery (Giery et al., 2017). Antithetically, tegu diets from both populations also contained invasive plant seeds like balsam pear (Momordica charantia). Tegus in their native range were found to enhance germination rates for species such as Eugenia uniflora (Campagnoli and Christianini, 2024), which is also considered invasive in Florida and was documented in the Barraco (2015) tegu diet study. How tegus may be altering seed dispersal dynamics in this system by dispersing these and other seed species is unknown and could be a focus of future work.
Although diet composition varied somewhat depending on the context, nearly all tegus in this study had recently consumed a meal and appeared healthy during necropsies (but see Woytek et al., 2023). Tegus demonstrated a resilience to toxic plants and wildlife that might otherwise serve as natural “controls” on population growth. Tegus also exhibited increased predation on vertebrates relative to their native range. These findings are especially concerning in light of recent findings that, unlike many invasive reptiles, tegu range expansion may not be limited by freezing temperatures (Goetz et al., 2021). A suspected breeding population of tegus was documented in two counties in Georgia in 2018 (Haro et al., 2020), and distributional modeling suggests that tegus could survive throughout much of the southeastern United States (Jarnevich et al., 2018) with predicted expansion under climate change warming scenarios of 2–4 °C (Kissel et al., 2025). These omnivorous predators have drawn increasing concern from management agencies in recent years for their potential to prey upon vulnerable native species in Florida and other invaded ranges. The results of our study validate these concerns, provide support for removal efforts to mitigate current and future damage, and underscore the importance of early detection and rapid response to new introductions. Although we identified useful predictors of diet composition – month and tegu size – the overall complexity of their diet indicates substantial flexibility and resilience regardless of contributing factors.
Data availability statement
The datasets presented in this study can be found in the ScienceBase repository: https://doi.org/10.5066/P1CJ29AG (Harman et al., 2025).
Ethics statement
Ethical approval was not required for the study involving animals in accordance with the local legislation and institutional requirements. The research was conducted on deceased animals, and therefore did not need IACUC approval from the University of Florida. The invasive tegus were euthanized as part of mitigation management, but methods for safe euthanasia were developed in consultation with the NPS Wildlife Health Team. Specimens were originally collected under permits and ethical oversight by personnel from the National Park Service (NPS), U.S. Geological Survey (USGS), and the Florida Fish and Wildlife Conservation Commission (FWC), in accordance with their institutional guidelines.
Author contributions
MH: Writing – original draft, Formal Analysis, Visualization, Methodology, Validation, Conceptualization, Data curation, Writing – review & editing, Investigation. NF: Validation, Project administration, Resources, Methodology, Writing – review & editing, Investigation. BB: Software, Visualization, Conceptualization, Writing – review & editing, Validation, Methodology, Formal Analysis, Supervision. JB: Methodology, Validation, Visualization, Supervision, Formal Analysis, Software, Writing – review & editing. XL: Validation, Formal Analysis, Methodology, Writing – review & editing. AC: Resources, Project administration, Writing – review & editing, Funding acquisition, Methodology, Conceptualization. AY: Writing – review & editing, Conceptualization, Funding acquisition, Resources, Project administration. BF: Conceptualization, Writing – review & editing, Methodology, Funding acquisition, Project administration, Resources. CR: Validation, Project administration, Methodology, Funding acquisition, Conceptualization, Writing – review & editing, Resources, Supervision.
Funding
The author(s) declare financial support was received for the research and/or publication of this article. Funding and in-kind support was provided by the U.S. Geological Survey Greater Everglades Priority Ecosystem Sciences (GEPES) Program, National Park Service, National Park Foundation, USGS Biothreats and Invasive Species Program, USGS Fort Collins Science Center, and University of Florida.
Acknowledgments
We thank the staff at the Florida Museum of Natural History collections who assisted with diet identifications based on their specialties, including Dr. V. Mathis (UF Mammal Collections Manager; mammals), Dr. M. Frank (UF Extension Botanist and Associate Collections Manager; seeds), Dr. A. Franck (UF Herbarium Collections Manage; seeds), and Dr. R. Robins (UF Ichthyology Collections Manager; fish). Additionally, we were helped by Dr. C. Dove (Smithsonian National Museum of Natural History Program Manager; feathers), Dr. T. Collins (Florida International University; gastropods), D. Juárez-Sánchez (UF Department of Wildlife Ecology and Conservation, WEC; mammals), A. Zapata (UF WEC; arthropods), J. Edelkind (UF WEC; arthropods), D. Love (UF WEC; arthropods), K. Davis (UF Zoology; seeds and mammals), Dr. A. Figueroa (UF WEC; seeds), and A. Hamersma (UF Biology; seeds). We thank the current and former staff of the Florida Fish and Wildlife Conservation Commission Ft. Myers office for trapping and providing tegus from Charlotte County, including D. Quinn, C. Cunningham, A. Hamilton, and A. Furst (UF WEC). We thank the current and former USGS staff and University of Florida interns at Everglades National Park (NPS and USGS) who managed or were involved in trapping and necropsying tegus, including but not limited to J. Josimovich, C. Robinson, A. Fitzgerald, G. Anderson, and S. Sherburne. We also thank the numerous undergraduate volunteers who helped necropsy tegus and process diet contents, including A. Sutton, G. de Vries, J. Trujillo, K. Mendoza, D. Love, A. Hanna, J. Edelkind, A. Zapata, A. Willer, E. Hobbs, D. Withee, M. Vilchez, E. Martucci, H. Welsh, M. Dixon, S. Summo, A. Anderson, M. Gonzalez, and C. Fernandez. We thank D. Haro and M. Heisey for their valuable feedback on the manuscript’s content, writing, and analysis. We thank T. Dean of NPS and R.N. Reed and N. Aumen of USGS for support in initiating this project.
Conflict of interest
The authors declare that the research was conducted in the absence of any commercial or financial relationships that could be construed as a potential conflict of interest.
Generative AI statement
The author(s) declare that no Generative AI was used in the creation of this manuscript.
Any alternative text (alt text) provided alongside figures in this article has been generated by Frontiers with the support of artificial intelligence and reasonable efforts have been made to ensure accuracy, including review by the authors wherever possible. If you identify any issues, please contact us.
Publisher’s note
All claims expressed in this article are solely those of the authors and do not necessarily represent those of their affiliated organizations, or those of the publisher, the editors and the reviewers. Any product that may be evaluated in this article, or claim that may be made by its manufacturer, is not guaranteed or endorsed by the publisher.
Supplementary material
The Supplementary Material for this article can be found online at: https://www.frontiersin.org/articles/10.3389/famrs.2025.1635085/full#supplementary-material
References
Avery H. W., Spotila J. R., Congdon J. D., Fischer R. U., Standora E. A., and Avery S. B. (1993). Roles of diet protein and temperature in the growth and nutritional energetics of juvenile slider turtles, Trachemys scripta. Physiol. Zool. 66, 902–925. doi: 10.1086/physzool.66.6.30163746
Barraco L. A. (2015). Risk assessment of the nonnative Argentine black and white tegu, Salvator merianae, in South Florida. Master’s Thesis. (Boca, Raton FL: University of Florida).
Blanchet F. G., Legendre P., and Borcard D. (2008). Forward Selection of Explanatory Variables. Ecology. 89 (9), 2623–32. doi: 10.1890/07-0986.1
Borcard D., Gillet F., and Legendre P. (2011). “Spatial analysis of ecological data,” in Numerical Ecology with R. Eds. Borcard D., Gillet F., and Legendre P. (Springer, New York, NY), 227–292. doi: 10.1007/978-1-4419-7976-6_7
Buuren S. and Groothuis-Oudshoorn K. (2011). mice: multivariate imputation by chained equations in R. J. Stat. Software. 45, 1–67. doi: 10.18637/jss.v045.i03
Cadotte M. W., Yasui S. L. E., Livingstone S., and MacIvor J. S. (2017). Are urban systems beneficial, detrimental, or indifferent for biological invasion? Biol. Invasions. 19, 3489–3503. doi: 10.1007/s10530-017-1586-y
Campagnoli M. L. and Christianini A. V. (2024). Tegu lizard (Salvator merianae) disperses the invasive plant Eugenia uniflora. Acta Bot. Bras. 38, e20230211. doi: 10.1590/1677-941x-abb-2023-0211
Castro E. R. and Galetti M. (2004). Frugivoria e dispersão de sementes pelo lagarto teiú Tupinambis merianae (Reptilia: Teiidae). Pap. Avulsos. Zool. 44, 91–97. doi: 10.1590/S0031-10492004000600001
Colli G. R., Péres A. K. Jr., and Cunha H. J. (1998). A new species of Tupinambis (Squamata: Teiidae) from central Brazil, with an analysis of morphological and genetic variation in the genus. Herpetologica 54, 477–492.
Crowder D. W. and Snyder W. E. (2010). Eating their way to the top? Mechanisms underlying the success of invasive insect generalist predators. Biol. Invasions. 12, 2857–2876. doi: 10.1007/s10530-010-9733-8
Currylow A. F., Collier M. A. M., Hanslowe E. B., Falk B. G., Cade B. S., Moy S. E., et al. (2021). Thermal stability of an adaptable, invasive ectotherm: Argentine giant tegus in the Greater Everglades ecosystem, USA. Ecosphere 12, 1-18. doi: 10.1002/ecs2.3579
da Silva O. D., da Costa T. M., Silva-Alves V. D., Fermiano E. C., de Seba M. F. R., Nogueira O. M., et al. (2020). Diet and food ontogeny of the lizard Tupinambis matipu Silva et al., 2018 (Squamata: Teiidae) in Central Brazil. Res. Soc. Dev. 9, e52391110073–e52391110073. doi: 10.33448/rsd-v9i11.10073
Declerck S. A. J., Coronel J. S., Legendre P., and Brendonck L. (2011). Scale dependency of processes structuring metacommunities of cladocerans in temporary pools of High-Andes wetlands. Ecography 34, 296–305. doi: 10.1111/j.1600-0587.2010.06462.x
Diniz H. S., Feio R. N., Assis C. L. D., and Guedes J. J. M. (2021). Diet of Salvator merianae (Squamata: Teiidae): New prey item and review of predation records. North-Western J. Zoo. 17, 309–314.
Doody J. S., Soanes R., Castellano C. M., Rhind D., Green B., McHenry C. R., et al. (2015). Invasive toads shift predator–prey densities in animal communities by removing top predators. Ecology 96, 2544–2554. doi: 10.1890/14-1332.1
Dorcas M. E., Willson J. D., Reed R. N., Snow R. W., Rochford M. R., Miller M. A., et al. (2012). Severe mammal declines coincide with proliferation of invasive Burmese pythons in Everglades National Park. Proc. Natl. Acad. Sci. 109, 2418–2422. doi: 10.1073/pnas.1115226109
Doughty P. and Shine R. (1998). Reproductive energy allocation and long-term energy stores in a viviparous lizard (Eulamprus tympanum). Ecology 79, 1073–1083. doi: 10.1890/0012-9658(1998)079[1073:REAALT]2.0.CO;2
Dove C. J., Snow R. W., Rochford M. R., and Mazzotti F. J. (2011). Birds Consumed by the Invasive Burmese Python (Python molurus bivittatus) in Everglades National Park, Florida, USA. wils 123, 126–131. doi: 10.1676/10-092.1
Dray S., Bauman D., Blanchet G., Borcard D., Clappe S., Guenard G., et al. (2023). adespatial: Multivariate Multiscale Spatial Analysis. doi: 10.32614/CRAN.package.adespatial
Enge K. M. (2007). FWC Bioprofile for the Argentine Black and White Tegu (Tupinambis merianae) (Quincy, FL: Florida Fish and Wildlife Conservation Commission). Available online at: https://bugwoodcloud.org/CDN/floridainvasives/TeguBioprofileSep2006.pdf.
Fisher S., Fisher R. N., Alcaraz S. E., Gallo-Barneto R., Patino-Martinez C., López-Jurado L. F., et al. (2021). Reproductive plasticity as an advantage of snakes during island invasion. Conserv. Sci Pract. 3, e554. doi: 10.1111/csp2.554
Fitzgerald L. A. (1994). The interplay between life history and environmental stochasticity: implications for the management of exploited lizard populations. Am. Zool. 34, 371–381. doi: 10.1093/icb/34.3.371
Ford N. B. and Seigel R. A. (1994). An experimental study of the trade-offs between age and size at maturity: effects of energy availability. Funct. Ecol. 8, 91–96. doi: 10.2307/2390116
FWC (2022). Endangered and Threatened Species Management and Conservation Plan Progress Report (Tallahassee: Florida Fish and Wildlife Conservation Commission), 1–102. Available online at: https://myfwc.com/media/32685/2021-22endangeredspeciesreport.pdf.
Gaiotto J. V., Abrahão C. R., Dias R. A., and Bugoni L. (2020). Diet of invasive cats, rats and tegu lizards reveals impact over threatened species in a tropical island. Perspect. Ecol. Conserv. 18, 294–303. doi: 10.1016/j.pecon.2020.09.005
Giery S. T., Vezzani E., Zona S., and Stroud J. T. (2017). Frugivory and seed dispersal by the invasive knight anole (Anolis equestris) in Florida, USA. Food Webs. 11, 13–16. doi: 10.1016/j.fooweb.2017.05.003
Goetz S. M., Steen D. A., Miller M. A., Guyer C., Kottwitz J., Roberts J. F., et al. (2021). Argentine Black and White Tegu (Salvator merianae) can survive the winter under semi-natural conditions well beyond their current invasive range. PloS One 16, e0245877. doi: 10.1371/journal.pone.0245877
Guzy J. C., Falk B. G., Smith B. J., Willson J. D., Reed R. N., Aumen N. G., et al. (2023). Burmese pythons in Florida: A synthesis of biology, impacts, and management tools. NeoBiota 80, 1–119. doi: 10.3897/neobiota.80.90439
Harman M. E. A., Yackel Adams A. A., Falk B. G., and Romagosa C. M. (2025). Argentine black and white tegu (Salvator merianae) morphometrics and gastrointestinal contents, Florida 2016-2021, U.S. Geological Survey data release.
Haro D., McBrayer L. D., Jensen J. B., Gillis J. M., Bonewell L. R., Nafus M. G., et al. (2020). Evidence for an established population of tegu lizards (Salvator merianae) in southeastern Georgia, USA. Southeastern. Nat. 19, 649-662. doi: 10.1656/058.019.0404
Hixon M. A., Johnson D. W., and Sogard S. M. (2014). BOFFFFs: on the importance of conserving old-growth age structure in fishery populations. ICES. J. Mar. Sci 71, 2171–2185. doi: 10.1093/icesjms/fst200
Holler N. R. and Conaway C. H. (1979). Reproduction of the marsh rabbit (Sylvilagus palustris) in South Florida. J. Mammal. 60, 769–777. doi: 10.2307/1380192
Iannone B., Carnevale S., Main M., Hill J., McConnell J., Johnson S., et al. (2020). Invasive species terminology: standardizing for stakeholder education. J. Extension. 58, 1-15. doi: 10.34068/joe.58.03.27
Ibáñez-Álamo J. D., Rubio E., Benedetti Y., and Morelli F. (2017). Global loss of avian evolutionary uniqueness in urban areas. Global Change Biol. 23, 2990–2998. doi: 10.1111/gcb.13567
Jarnevich C. S., Hayes M. A., Fitzgerald L. A., Yackel Adams A. A., Falk B. G., Collier M. A. M., et al. (2018). Modeling the distributions of tegu lizards in native and potential invasive ranges. Sci. Rep. 8, 10193. doi: 10.1038/s41598-018-28468-w
Kiefer M. C. and Sazima I. (2002). Diet of juvenile tegu lizard Tupinambis merianae (Teiidae) in southeastern Brazil. Amphibian-Reptilia 23, 105–108.
Kissel A. M., Jarnevich C. S., Currylow A. F., and Adams A. A. Y. (2025). Modeling current and future distribution of invasive tegu lizards along geopolitical boundaries in the contiguous United States: Implications for invasion threat. Climate Change Ecol. 10, 100097. doi: 10.1016/j.ecochg.2025.100097
Klug P. E., Reed R. N., Mazzotti F. J., McEachern M. A., Vinci J. J., Craven K. K., et al. (2015). The influence of disturbed habitat on the spatial ecology of Argentine black and white tegu (Tupinambis merianae), a recent invader in the Everglades ecosystem (Florida, USA). Biol. Invasions. 17, 1785–1797. doi: 10.1007/s10530-014-0834-7
Krysko K. L., Somma L. A., Smith D. C., Gillette C. R., Cueva D., Wasilewski J. A., et al. (2016). New verified nonindigenous amphibians and reptiles in Florida 1976 through 2015, with a summary of over 152 years of introductions. Reptiles. Amphibians. 23, 110–143. doi: 10.17161/randa.v23i2.14119
Lenz M., da Gama B. A. P., Gerner N. V., Gobin J., Gröner F., Harry A., et al. (2011). Non-native marine invertebrates are more tolerant towards environmental stress than taxonomically related native species: Results from a globally replicated study. Environ. Res. Invasive. Species. 111, 943–952. doi: 10.1016/j.envres.2011.05.001
Linders T. E. W., Schaffner U., Eschen R., Abebe A., Choge S. K., Nigatu L., et al. (2019). Direct and indirect effects of invasive species: Biodiversity loss is a major mechanism by which an invasive tree affects ecosystem functioning. J. Ecol. 107, 2660–2672. doi: 10.1111/1365-2745.13268
Lockwood J. L., Hoopes M. F., and Marchetti M. P. (2013). Invasion Ecology (West Sussex, UK: John Wiley & Sons).
López-Darias M., López-González M., Padilla D. P., Martín-Carbajal J., and Piquet J. C. (2024). Invasive black rats menacing endangered lizards. Biodivers. Conserv. 33, 2775-2789. doi: 10.1007/s10531-024-02882-1
Madsen T. and Shine R. (1999). The adjustment of reproductive threshold to prey abundance in a capital breeder. J. Anim. Ecol. 68, 571–580. doi: 10.1046/j.1365-2656.1999.00306.x
Madsen T. and Shine R. (2000). Silver spoons and snake body sizes: prey availability early in life influences long-term growth rates of free-ranging pythons. J. Anim. Ecol. 69, 952–958. doi: 10.1111/j.1365-2656.2000.00477.x
Mainka S. A. and Howard G. W. (2010). Climate change and invasive species: double jeopardy. Integr. Zool. 5, 102–111. doi: 10.1111/j.1749-4877.2010.00193.x
Mason B. M., Basille M., Nestler J. H., and Mazzotti F. J. (2022). Dyadic movement in an adult male and female Argentine black and white tegu (Salvator merianae) in South Florida. sena 21, N5–N11. doi: 10.1656/058.021.0104
Mazzotti F. J., McEachern M., Rochford M., Reed R. N., Eckles J. K., Vinci J., et al. (2015). Tupinambis merianae as nest predators of crocodilians and turtles in Florida, USA. Biol. Invasions. 17, 47–50. doi: 10.1007/s10530-014-0730-1
McCleery R. A., Sovie A., Reed R. N., Cunningham M. W., Hunter M. E., and Hart K. M. (2015). Marsh rabbit mortalities tie pythons to the precipitous decline of mammals in the Everglades. Proc. R. Soc. B.: Biol. Sci. 282, 20150120. doi: 10.1098/rspb.2015.0120
Mercolli C. and Yanosky A. (1994). THE DIET OF ADULT TUPINAMBIS TEGUIXIN (SAURIA: TEIIDAE) IN THE EASTERN CHACO OF ARGENTINA. Herpetol. J. 4, 15–19.
Meshaka W. (2011). A Runaway Train in the Making: The exotic amphibians, reptiles, turtles, and crocodilians of Florida. Monograph 1. Herpetol. Conserv. Biol. 6, 1–101.
Meshaka W., Mazzotti F. J., and Rochford M. R. (2019). Ecological plasticity and the future of the Argentine giant tegu (Salvator merianae dumeril and bibron 1839) in the Southeastern US. Southeastern. Nat. 18, 659. doi: 10.1656/058.018.0417
Norf H., Kniggendorf L. G., Fischer A., Arndt H., and Kureck A. (2010). Sexual and reproductive traits of Hypania invalida (Polychaeta, Ampharetidae): a remarkable invasive species in Central European waterways. Freshw. Biol. 55, 2510–2520. doi: 10.1111/j.1365-2427.2010.02481.x
O’Dowd D. J., Green P. T., and Lake P. S. (2003). Invasional ‘meltdown’ on an oceanic island. Ecol. Lett. 6, 812–817. doi: 10.1046/j.1461-0248.2003.00512.x
Offner M.-T., Campbell T. S., and Johnson S. A. (2021). Diet of the invasive Argentine black and white tegu in Central Florida. Southeastern. Nat. 20, 319-337. doi: 10.1656/058.020.0210
Oksanen J., Simpson G. L., Blanchet F. G., Kindt R., Legendre P., Minchin P. R., et al. (2024). vegan: Community Ecology Package. doi: 10.32614/CRAN.package.vegan.
Oliver J. H., Hayes M. P., Keirans J. E., and Lavender D. R. (1993). Establishment of the foreign parthenogenetic tick Amblyomma rotundatum (Acari: ixodidae) in Florida. J. Parasitol. 79, 786. doi: 10.2307/3283624
Paixão V. H. F. and Venticinque E. M. (2020). Fruit consumption by Salvator merianae (Squamata: Teiidae) in the Brazilian Caatinga. Phyllomedusa 19, 283–286. doi: 10.11606/issn.2316-9079.v19i2p283-286
Pernas T., Giardina D. J., McKinley A., Parns A., and Mazzotti F. J. (2012). First observations of nesting by the argentine black and white tegu, Tupinambis merianae, in South Florida. Southeastern. Nat. 11, 765–770. doi: 10.1656/058.011.0414
Presch W. (1974). A survey of the dentition of the macroteiid lizards (Teiidae: Lacertilia). Herpetologica 30, 344–349.
Quinn D. P., Dallas T. R., Cunningham C. C., Hamilton A. S., and Funck S. A. (2022). An incipient population of argentine black and white tegus (Salvator merianae) in Charlotte County, Florida, USA. Herpetol. Conserv. Biol. 17, 539–547.
R Core Team (2023). R: A Language and Environment for Statistical Computing (Version 4.3.2) [Computer software]. Vienna, Austria: R Foundation for Statistical Computing. Available online at: https://www.R-project.org/.
Rogers H. S., Buhle E. R., HilleRisLambers J., Fricke E. C., Miller R. H., and Tewksbury J. J. (2017). Effects of an invasive predator cascade to plants via mutualism disruption. Nat. Commun. 8, 14557. doi: 10.1038/ncomms14557
Romagosa C. M., Mazzotti F. J., Snow R. W., Bartoszek I., Dove C. J., Juárez-Sánchez D. A., et al. (2023). Diet of invasive Burmese Pythons (Python molurus bivittatus) in southern Florida 1995-2020. doi: 10.5066/P9A0V89V
Sazima I. and D’Angelo G. B. (2013). Range of animal food types recorded for the tegu lizard (Salvator merianae) at an urban park in South-eastern Brazil. Herpetol. Notes 6, 427–430.
Sementelli A., Smith H. T., Meshaka W. E., and Engeman R. M. (2008). Just green iguanas?: the associated costs and policy implications of exotic invasive wildlife in South Florida. Public Works. Manage. Policy 12, 599–606. doi: 10.1177/1087724X08316157
Simberloff D. (2011). How common are invasion-induced ecosystem impacts? Biol. Invasions. 13, 1255–1268. doi: 10.1007/s10530-011-9956-3
Sovie A. R., McCleery R. A., Fletcher R. J., and Hart K. M. (2016). Invasive pythons, not anthropogenic stressors, explain the distribution of a keystone species. Biol. Invasions. 18, 3309–3318. doi: 10.1007/s10530-016-1221-3
Stanford C. B., Iverson J. B., Rhodin A. G. J., Paul van Dijk P., Mittermeier R. A., Kuchling G., et al. (2020). Turtles and tortoises are in trouble. Curr. Biol. 30, R721–R735. doi: 10.1016/j.cub.2020.04.088
Taylor P. (1983). Distance decay in spatial interactions. Concepts. Techniques. Modern. Geogr. 2. Geo Books, Norwich.
Tattersall G. J., Leite C. A.C., Sanders C. E., Cadena V., Andrade D. V., Abe A.S., et al. (2016). Seasonal reproductive endothermy in tegu lizards. Science Advances. 2 (1), e1500951. doi: 10.1126/sciadv.1500951
Udell B., Martin J., Waddle H., Johnson F., Falk B., Yackel Adams A., et al. (2022). Open removal models with temporary emigration and population dynamics to inform invasive animal management. Ecol. Evol. 12, e9173. doi: 10.1002/ece3.9173
Wallach A. D., Ripple W. J., and Carroll S. P. (2015). Novel trophic cascades: apex predators enable coexistence. Trends Ecol. Evol. 30, 146–153. doi: 10.1016/j.tree.2015.01.003
Walsh J. R., Carpenter S. R., and Vander Zanden M. J. (2016). Invasive species triggers a massive loss of ecosystem services through a trophic cascade. Proc. Natl. Acad. Sci. 113, 4081–4085. doi: 10.1073/pnas.1600366113
Winck G. R. and Cechin S. Z. (2008). Hibernation and emergence pattern of Tupinambis merianae (Squamata: Teiidae) in the Taim Ecological Station, southern Brazil. J. Natural History. 42, 239–247. doi: 10.1080/00222930701828667
Winker H., Weyl O. L. F., Booth A. J., and Ellender B. R. (2011). Life history and population dynamics of invasive common carp, Cyprinus carpio, within a large turbid African impoundment. Mar. Freshw. Res. 62, 1270. doi: 10.1071/MF11054
Woodward S. A., Vitousek P. M., Matson K., Hughes F., Benvenuto K., and Matson P. A. (1990). Use of the exotic tree Myrica faya by native and exotic birds in Hawai’i Volcanoes National Park. Honolulu, HI: University of Hawaii Press. Available online at: http://hdl.handle.net/10125/1245.
Woytek K., Anderson G., Donmoyer K., Ridgley F., Romagosa C., Adams A. Y., et al. (2023). Testicular abnormalities in the invasive Argentine Black-and-White Tegu (Salvator merianae) in the Florida Everglades. Reptiles. Amphibians. 30, e19517–e19517. doi: 10.17161/randa.v30i1.19517
Xiong P. X. (2025). Sensory Cues to Scent Lures: How Invasive Argentine Giant Tegus Detect and Decide [master’s thesis]. University of Florida.
Keywords: Argentine black and white tegu, Salvator merianae, Everglades National Park, invasion ecology, diet composition, reptiles, distance-based redundancy analysis, Moran’s Eigenvector Maps
Citation: Harman MEA, Fuller NR, Baiser B, Blackburn JK, Li X, Currylow AF, Yackel Adams AA, Falk BG and Romagosa CM (2025) Dietary breadth and ecological plasticity facilitate invasion potential in a large omnivorous lizard. Front. Amphib. Reptile Sci. 3:1635085. doi: 10.3389/famrs.2025.1635085
Received: 25 May 2025; Accepted: 23 September 2025;
Published: 10 December 2025.
Edited by:
Sara L. Ashpole, St. Lawrence University, United StatesReviewed by:
Lei Shi, Xinjiang Agricultural University, ChinaMario Ruiz Monachesi, CONICET Instituto de Ecorregiones Andinas (INECOA), Argentina
Copyright © 2025 Harman, Fuller, Baiser, Blackburn, Li, Currylow, Yackel Adams, Falk and Romagosa. This is an open-access article distributed under the terms of the Creative Commons Attribution License (CC BY). The use, distribution or reproduction in other forums is permitted, provided the original author(s) and the copyright owner(s) are credited and that the original publication in this journal is cited, in accordance with accepted academic practice. No use, distribution or reproduction is permitted which does not comply with these terms.
*Correspondence: Madison E. A. Harman, bWFkaXNvbi5lYS5oYXJtYW5AZ21haWwuY29t
†Present address: Andrea F. Currylow, Department of Biology and Marine Biology, College of Arts and Sciences, University of North Carolina Wilmington, Wilmington, NC, United States
Bryan G. Falk, National Invasive Species Council, U.S. Department of the Interior, Office of the Secretary, Washington D.C., United States