 Yukiko Iida1*
 Takashi Yamamoto2*Kazuharu Iwasaki3Ken-Ichi Yuki1Kentaro Kiri3Hayato Yamashiro3Toshiyuki Toyoguchi1Atsushi Terazono2
- 1Environmental Control Center Co., Ltd, Tokyo, Japan
- 2National Institute for Environmental Studies, Ibaraki, Japan
- 3Japan NUS Co., Ltd, Tokyo, Japan
In this study, we attempted to detect fibers in phase contrast microscope images of actual atmospheric samples using an automatic fiber detection system based on artificial intelligence (AI) models and image processing. In order to detect and correct the release of asbestos fibers due to improper demolition and removal operations of asbestos-containing building materials as early as possible, it is essential to develop a method that can rapidly and accurately measure airborne asbestos fibers. Current rapid measurement method is the combination short-term atmospheric sampling with counting using a phase contrast microscope. However, visual fiber counting takes a reasonable amount of time and is not sufficiently rapid. Additionally, since the counting process relies on visual fiber counting, analytical accuracy can be decreased due to factors such as analyst fatigue. Ambient air samples or air samples collected near demolition sites were observed and acquired using a phase contrast microscope. From the acquired microscopic images and the fiber counting results by the expert analysts, we created a set of 98 training datasets. The Segformer, one of the semantic segmentation models that had achieved good accuracy in previous studies, was adopted as an AI model for automatic fiber detection system. Of the 98 training datasets, 77 datasets were used for training the model, and 21 datasets were used to evaluate the accuracy of the automatic fiber detection system. The achieved detection accuracy by the AI model was 0.90 for recall, 0.68 for precision, and 0.77 for F1 score. Fiber counting accuracy using an automatic fiber detection system based on AI models and image processing was 0.78 for recall, 0.67 for precision, and 0.72 for F1 score. The time required to detect fibers was about one second per image using a graphics processing unit. The counting accuracy by this automatic fiber detection system based on AI model is comparable to that of manual counting by a skilled analyst, yet the time required for fiber counting is 12–50 times faster, significantly reducing the time required for analysis.
1 Introduction
Asbestos is a group of natural fibrous silicate minerals with many excellent properties, and because it was produced in large quantities and was inexpensive, it was used in large quantities as an asbestos-containing building materials (ACBMs). On the other hand, exposure to asbestos fibers caused fatal diseases such as lung cancer and mesothelioma (Morinaga, 2008; World Health Organization, 1986; Dodson and Hammar, 2006). The time between exposure and onset of these diseases is so long, and in Japan, the annual death rates from mesothelioma has remained around 1,500 in recent years, decades after the peak of asbestos use in the 1970s and 1990s (Ministry of Health and Welfare of Japan, 2022). In response to this high incidence of health hazards, the manufacture and use of asbestos products has been gradually regulated in Japan. And in 2006 the manufacture, import, and use of products with asbestos concentrations exceeding 0.1% by weight were banned (Ministry of Health and Welfare of Japan, 2006). Until the total ban of asbestos, the total amount of asbestos used in Japan was approximately 10 million tons.
Nearly 20 years have passed since the total ban on asbestos products, but many buildings that use ACBMs are still in use. The Ministry of Land, Infrastructure, Transport and Tourism estimates that the number of private buildings using ACBMs was approximately 2.8 million in 2009 (Ministry of LandInfrastructureTransport and Tourism of Japan, 2009). Therefore, the main cause of current air emissions of asbestos fibers is thought to be the demolition and renovation works on buildings that use ACBMs. Number of demolitions of buildings using ACBMs is on the rise and is expected to reach a peak of approximately 100,000 buildings per year by 2028 (Ministry of LandInfrastructureTransport and Tourism of Japan, 2009). Damage of buildings caused by earthquakes and other disasters can also cause the release of asbestos fibers into the atmosphere (Terazono et al., 1999; Higashi and Takahashi, 2001). In Japan, the Air Pollution Control Law establishes work standards for the prevention of asbestos emissions during demolition and removal work. However, leakage accidents often occur as a result of improper work. In an asbestos survey conducted at the entrance and exit of a security area at a demolition site, the concentration of asbestos fibers was 54 fibers/L (Ministry of the Environment of Japan, 2022a). A rapid measurement method for airborne asbestos fiber concentration is required to detect and correct such asbestos fiber leakage at an early stage. The current rapid measurement method is a combination of a short air collection time of 30 min or less and a procedure that counts fibers in 100 (or 50) fields of view using a phase contrast microscope (PCM) (Ministry of the Environment of Japan, 2022b). The time required to count 100 fields of view is 25–100 min, depending on the density of fibers on the filter and the analyst’s ability, which is not sufficient to quickly remediate leaks. Furthermore, the number of leak monitoring is expected to increase with the increase in building demolition. The limited number of expert analysts and the time required to train them creates a strong demand for labor savings and automation.
Attempts to automate the process of detecting and counting asbestos fibers in microscopic images have accelerated with the recent remarkable development of artificial intelligence (AI) such as deep learning (Biswas and Biswas, 2021; Cai et al., 2021; Iida et al., 2021; Rabiee et al., 2023). Biswas and Biswas (2021) applied a semantic segmentation model, U-Net, to detect fibers in images taken with a scanning electron microscope (SEM). Of 100 images containing amosite fibers, 80 images were used as a training dataset and 20 images were used as an evaluation dataset to train the model. As a result, the model was able to detect amosite fibers with a precision of 0.95. Cai et al. (2021) applied the object detection model YOLOv4 to detect fibers in images taken with a fluorescence microscope, reporting an average precision of 0.961, which was better than a fiber detection system not using an AI model previously developed by the same author’s group. Iida et al. (2021) compared the fiber counting results of an expert analyst and an AI model for 108 SEM images. AI-SEM can detect 87.9% of fibers with a diameter of 0.06–3 μm. The false negative rate of the AI model compared to the expert analyst’s counting results was 12.1%, and the false positive rate was 21.4%. The time required for fiber counting was significantly reduced from 150 min for the expert analyst to 3 min for the AI model. Rabiee et al. (2023) prepared simulated air samples collected on filter paper and applied the YOLOv5 model to detect fibers in images taken at ×40 magnification using a stereo microscope with transmitted illumination. When the best-trained model was applied, the precision was 0.84 and the F1 score was 0.77.
In this way, by applying an AI model to fiber detection in microscopic images, it may be possible to count fibers with the same accuracy as an expert analyst and in a shorter time. Furthermore, according to HSG248 Asbestos: The Health and Safety Executive. (2021), fiber counting is subject to human error and fatigue. By introducing an AI model, it may be possible to avoid such constraints related to analysts. Analysts also generally tend to underestimate the number of fibers in samples with high dust density and overestimate them in samples with low dust density (World Health Organization, 1997), and there is uncertainty in size discrimination, but this is unlikely to occur with fiber detection by AI. On the other hand, a disadvantage of fiber detection using an AI model is that it is significantly affected by the quality of the microscope image. Given the above background, we created simulated air samples using standard chrysotile and amosite samples and attempted to apply two AI models, Mask R-CNN (He et al., 2018), an instance segmentation model, and MA-Net (Fan et al., 2020), a semantic segmentation model, to fiber detection in PCM images (Yamamoto et al., 2024). As a result, when applying MA-Net, we obtained good accuracy with a recall rate of 0.95 and a precision rate of 0.91. In this study, as the next step towards practical application of this measurement system at demolition and renovation sites of asbestos containing buildings, we conducted the following research. Using atmospheric samples from demolition sites or their vicinity, we aimed to achieve faster and more accurate measurements by employing Segformer (Xie et al., 2021), a new model of semantic segmentation models that showed higher analytical accuracy than previous results.
2 Methods
2.1 Acquisition of phase contrast microscopy images and preparation of training datasets
The five laboratories (A–E) belonging to the Japan Environmental Measurement and Chemical Analysis Association, provided ninety-eight PCM images The process of acquiring PCM images was as follows. Ambient air or air near a demolition site was collected on a filter (made of mixed cellulose ester, pore size 0.8 μm). The filter was placed on a glass slide, made transparent with acetone vapor, dripped with triacetin, and fixed with a cover glass to prepare an observation slide; the PCM was used to observe the observation slide at ×400 magnification. An expert analyst manually focused each field of view and captured images using a digital camera. The actual atmospheric sample image containing at least one fiber which potentially is asbestos fiber, and multiple particles. The length of one pixel in the image was determined by photographing a 10um scale microgauge under identical conditions. The PCM, lens, digital camera, and number of pixels used to capture the images are listed in Table 1.
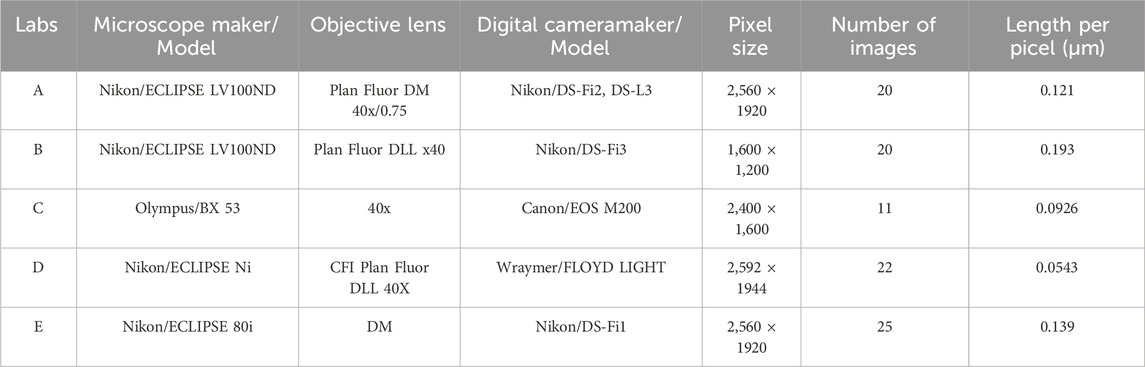
Table 1. List of phase-contrast microscopes, lens, and digital cameras used for acquiring images.
At the same time the images were acquired, an expert analysts counted fibers according to the fiber counting criteria in the ‘Asbestos Monitoring Manual’. The expert analyst was a person who had passed the most advanced rank of the proficiency test for asbestos fiber counting in Japan. Fiber counting criteria were fiber length greater than 5 μm, fiber width less than 3 μm, and aspect ratio greater than 3 (Ministry of the Environment of Japan, 2022b). Skilled and experienced analysts manually performed the annotations. Based on the fiber counting results of the expert analysts, labelme (https://github.com/labelmeai/labelme) was used for annotation (contour extraction of fibrous material and assignment of classes) to create training datasets.
2.2 Used AI model and training method
Although we had incorporated the Mask R-CNN (He et al., 2018), an instance segmentation model, as the model for detecting fibers in images (Yamamoto et al., 2024), we have now employed the Segformer (Xie et al., 2021), a semantic segmentation model; Segformer hierarchically uses Transformer, which is used in large-scale language models, as an encoder. Because the Transformer can capture interactions between distant pixels, it is said to be more accurate than models using only convolutional neural networks (CNN), which are commonly used in semantic segmentation models. In their paper on SegFormer, Xie et al. compare it with traditional models such as FCN and DeeplabV3+, which use ResNet as the encoder. When validated on the ADE20K dataset, the traditional models achieved a mean Intersection over Union (mIoU) of 40%–44%, whereas SegFormer demonstrated a significantly higher accuracy with a mIoU of 51.8%.
Of the 98 provided datasets, 77 were used to train the AI model and 21 were used to evaluate the model’s fiber detection accuracy. The computer specifications used for training are shown in Supplementary Table S1, The used libraries are shown in Supplementary Table S2, and the parameters used during training are summarized in Supplementary Table S3. As noted in Supplementary Table S3, the size of the image to be inferred by the model was set to 800 × 600. If the input image size was larger than this, it was divided and input to the model. The AI model was trained using the Dice Loss function as the loss function and Adam (Diederik and Jimmy, 2014) as the optimization algorithm. The time required to train the model was approximately 30 min using a graphics processing unit (GPU: NVIDIA GeForce RTX 3090. CUDA cores: 10496; VRAM: 24GB).
2.3 Evaluation of the fiber detection accuracy of the automatic fiber detection system
Fibers were predicted as countable fibers if they met both of the following criteria: (1) the pixels of the fibers was counted in the training dataset overlapped with the pixels of the fibers predicted by the AI model, and (2) the fiber length, fiber width, and aspect ratio obtained through image analysis of the fibers predicted by the AI model met the fiber counting criteria specified in the “Asbestos Monitoring Manual.” If it was difficult to accurately determine the fiber length and width due to the shape of the detected fibers, the fibers were judged to be indistinguishable. Hereafter, the AI model that detects fibers and the image processing system that determines the fiber length, fiber width, and aspect ratio from the results to determine the fibers to be counted will be referred to as the automatic fiber detection system.
The accuracy of the automatic fiber detection system was evaluated on two criteria: detection accuracy and counting accuracy. Detection accuracy is judged by determining whether fibers were detected by the AI model, without counting the number of fibers. Overlapping fibers were considered as a single cluster, and differences in the number of fibers were ignored. On the other hand, counting accuracy is calculated by counting each individual fibers even if they overlap. By evaluating based on these two criteria, it is also possible to consider the effects of overlapping fibers.
Two accuracy indices were used; (1) recall and (2) precision. Recall is the ratio of fibers that the automatic fiber detection system was able to estimate out of those that were counted by the expert analyst. Precision is the ratio of fibers that the expert analysts determined to be countable out of those that were determined to be countable by the automatic fiber detection system. They are calculated by the following equations;
Where,
True Positive (TP): Number of fibers estimated by the automatic fiber detection system that were counted by the expert analyst.
False Negative (FN): Number of fibers not detected (missed) by the automatic fiber detection system out of the fibers counted by the expert analyst.
False positive (FP): Number of fibers not detected (overcounted) by the expert analyst out of the fibers detected by the automatic fiber detection system.
In addition, since recall and precision are generally in a trade-off relationship, we also evaluated accuracy using (3) F1 score, which is calculated using the following formula;
Figure 1 shows an example of fiber detection in a PCM image by an automatic fiber detection system. The left side shows the results of detection and counting by the expert analyst, and the right side shows the results of detection and counting by the automatic fiber detection system. Red indicates the fibers that were counted (fibers to be counted by the expert are numbered 1–9), and blue indicates the fibers that were not counted because their size or aspect ratio did not meet the counting criteria. When evaluating detection accuracy, two overlapping fiber clusters (numbered 2, 3, and 6, 7) are not counted as multiple fibers and are counted as one. In this case, the recall was 1.0 because all 7 fiber clusters are detected, and the precision was 0.88 because one of the 8 individuals detected by the system is a false positive. When evaluating by counting accuracy, two fiber clusters (numbers 2, 3, and 6, 7) are counted as four, identifying the individuals. Of the nine fibers to be counted, the automatic detection system could not identify the overlapping fibers and counted seven, resulting in a reproducibility of 0.78. Of the eight fibers detected, one was a false positive, resulting in a conformance rate of 0.88.
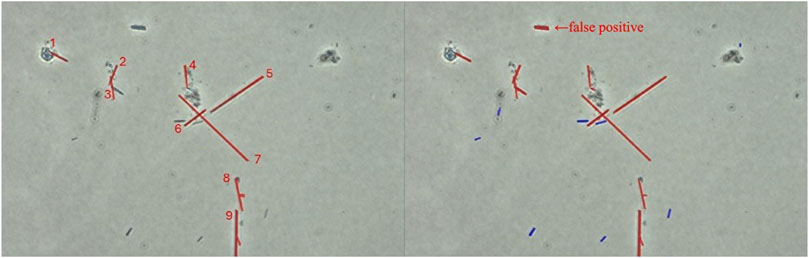
Figure 1. Detection accuracy and counting accuracy.
3 Results
Tables 2, 3 show the number of fibers and clusters detected by the expert analyst and the results of fiber detection by the automatic fiber detection system. When evaluated by detection accuracy, the recall was 0.90, the precision was 0.68, and the F1 score was 0.77. There were 87 of TP, 41 of FP, and 10 FN. Although 4 of the 10 cases treated as oversights were detected by the AI model, they were judged to be indistinguishable in the image processing to count fibrous materials because multiple fibers overlapped and it was difficult to accurately determine the fiber length and fiber width. There were few oversights, and fibers and their clusters were detected with high accuracy.
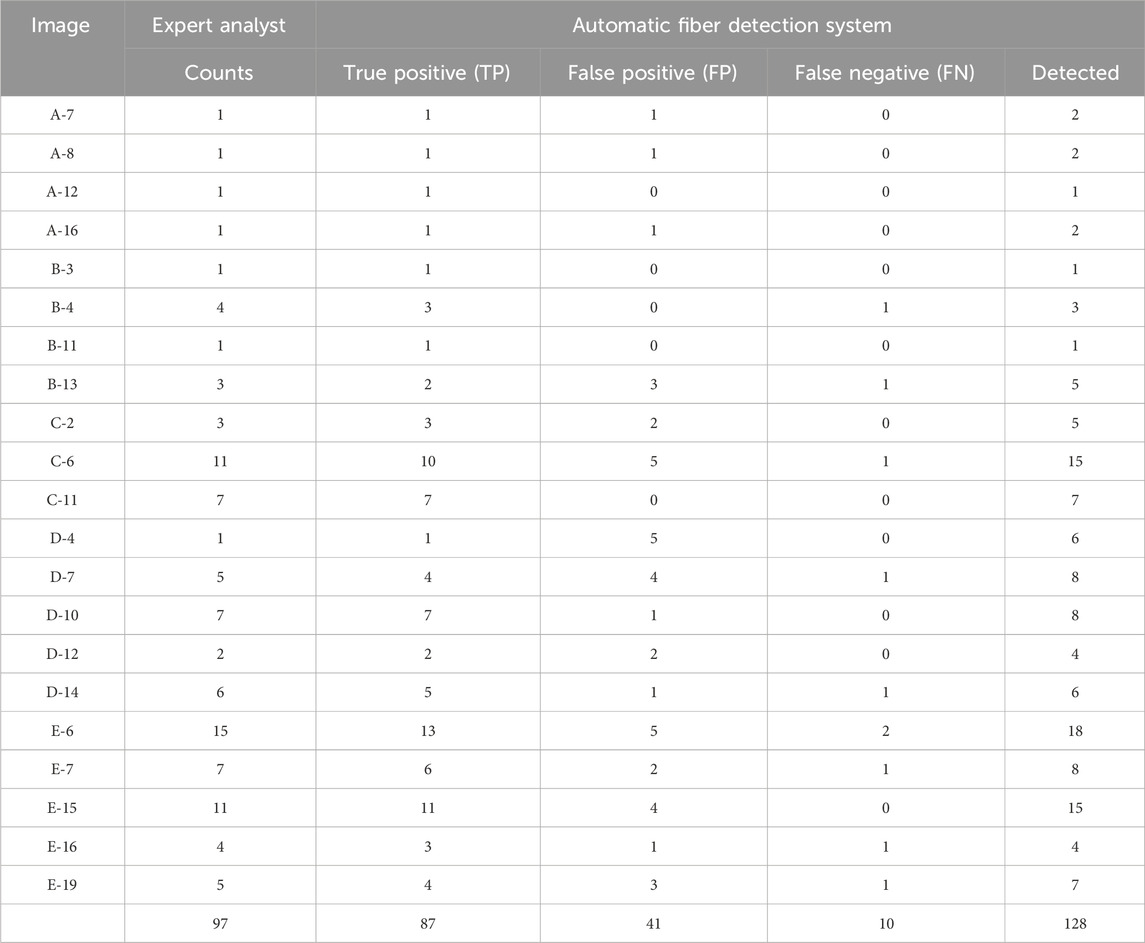
Table 2. Comparison of fiber counts between expert analysts and the AI detection system in PCM images.
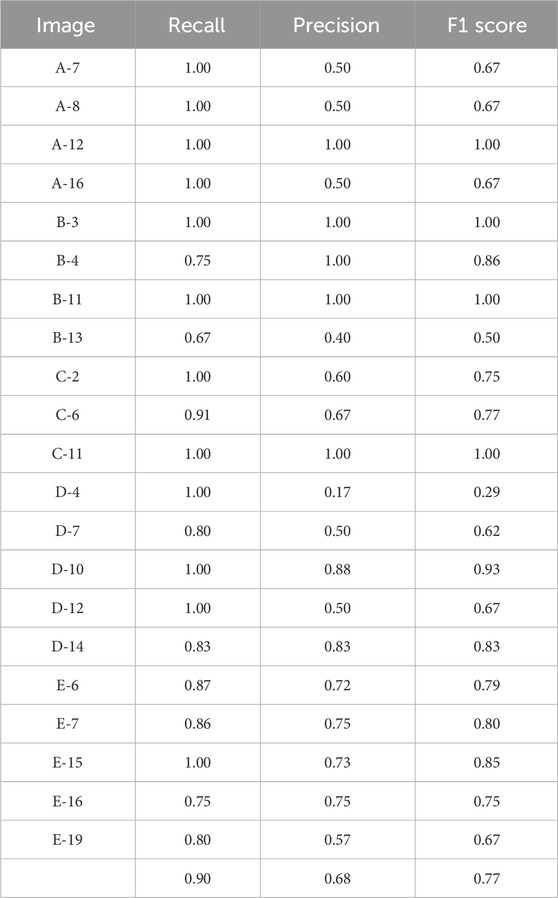
Table 3. Evaluation metrics (recall, precision, F1-score) for fiber detection accuracy.
Tables 4, 5 show the fiber counts by the expert analysts and the fiber counts by the system. The fiber counts by the expert analysts per fiber image ranged from 1 to 16, and the number of fibers detected by the automatic detection system ranged from 1 to 13. The fiber counts by the expert analysts for all images was 110. On the other hand, the number of fibers detected by the system was 129, with 86 of TP and 43 FP. There were also 24 of FN, which was more FP than FN. Regarding the accuracy of fiber counting, the recall of the automatic fiber detection system was 0.78, the precision was 0.67, and the F1 score was 0.72 (Table 5). In a previous report on an attempt to detect fibers using MA-Net, a semantic segmentation model, on PCM images of simulated air samples, the recall was 0.95, the precision was 0.91, and the F1 score was 0.92 (Yamamoto et al., 2024), and the accuracy was reduced in this study. Although it is difficult to make a comparison because the AI models adopted are different, it is believed that the accuracy was reduced because PCM images of real air samples containing particles other than asbestos fibers were used as the training dataset in this study.
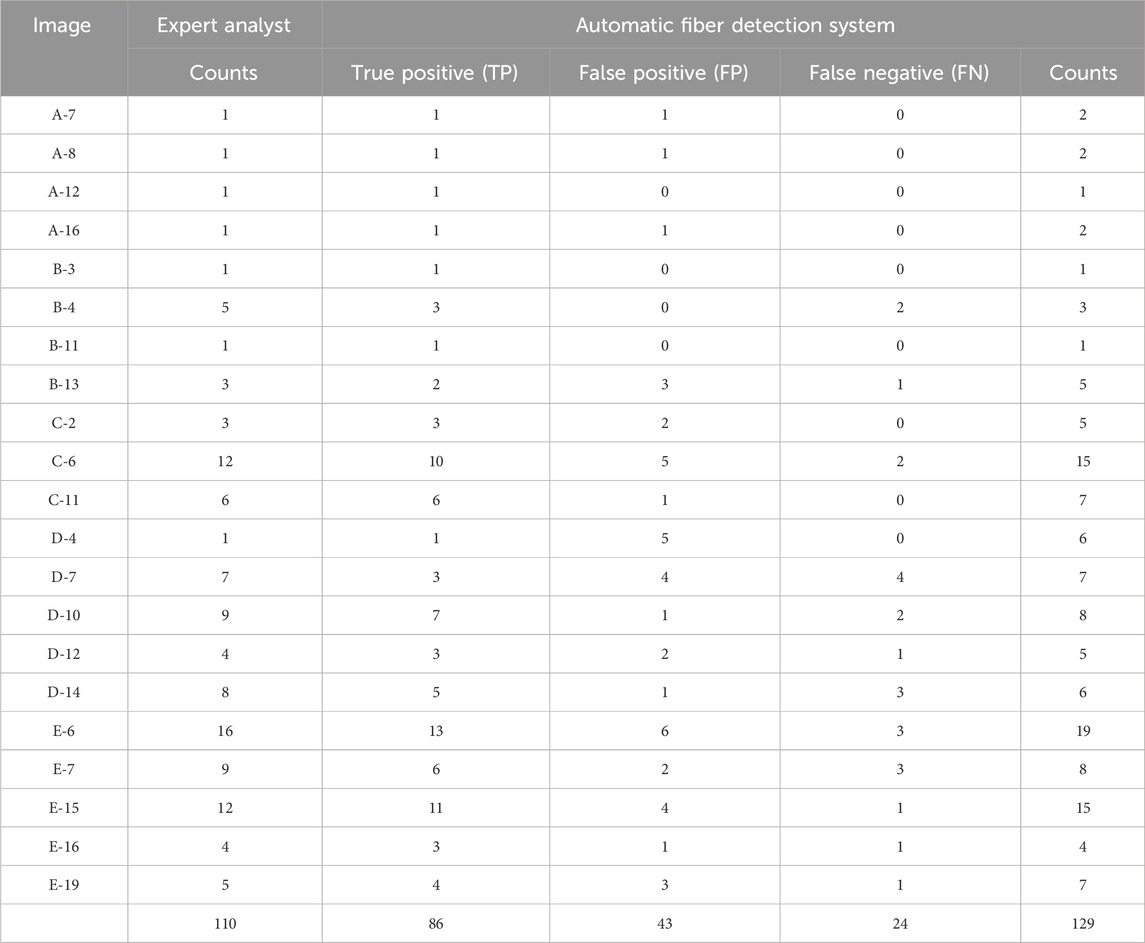
Table 4. Fiber counts by expert analysts and fiber count results by automatic fiber detection system for PCM images of actual atmospheric samples.
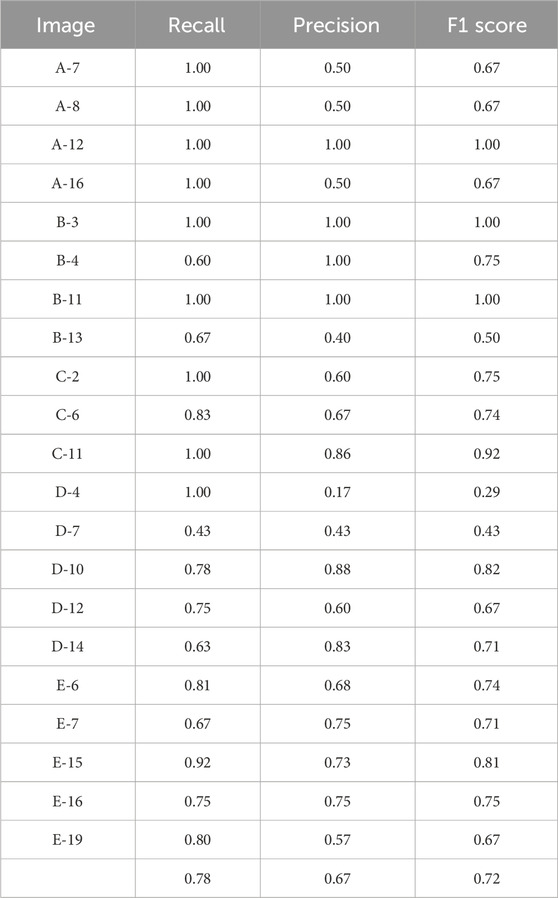
Table 5. Recall, precision, and F1 score of fiber count accuracy for each image and all images.
Below are examples of differences between the inference results of the AI model and the detection and counting results of expert analysts.
Figure 2 shows the fiber detection results for image B-4. In this image, recall was 0.75 and precision was 1.0 for detection accuracy, but recall was 0.6, precision was 1.0, and F1 score was 0.75 for counting accuracy. The expert analyst counted the fiber cluster in the center of the screen as two fibers. On the other hand, the automatic fiber detection system’s algorithm is unable to separate and detect the fiber cluster in the center of the screen, so it detects the cluster as one fiber and overlooks one fiber. Similar examples of fiber clusters not being able to be separated and detected also occurred in images D-7 and C-6. It is difficult to resolve this phenomenon with the current semantic segmentation model, and we believe that analyst intervention is necessary.
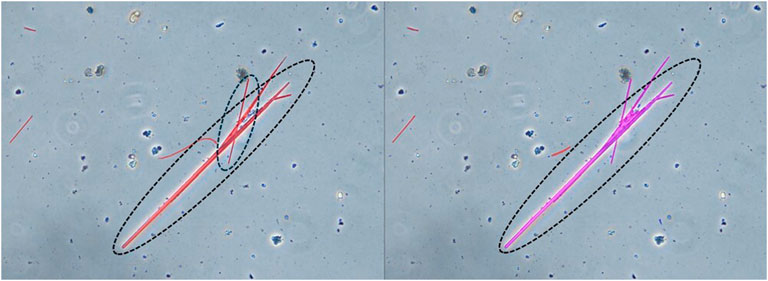
Figure 2. Fiber detection results in image B-4. Left: counting results by the expert analyst, right: prediction results by the automatic detection system. Red: fibers that both the expert analyst and the automatic detection system deemed to meet the counting criteria, purple: Fibers predicted by the AI model, but whose size or aspect ratio was difficult to measure.
Figure 3 shows the fiber detection results for image A-16. The expert analyst counted only one fiber, but the automatic fiber detection system misidentified the impurities in the upper right corner of the screen as fibers. Similar examples also occurred in images A-7, A-8, and B-13. It is natural that substances other than fibers exist in the actual atmospheric samples. One way to reduce false positives is to train the AI model using a larger training dataset. It is also necessary to be careful when preparing the slide for observation, such as not twisting the filter and not introducing air bubbles when placing the cover glass.
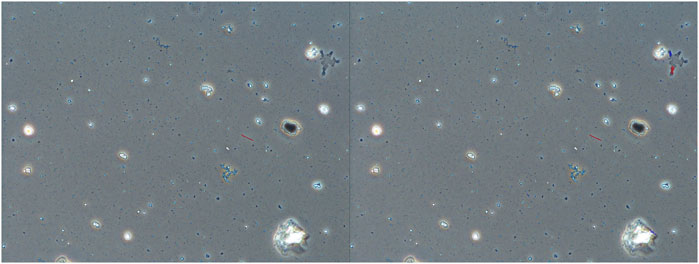
Figure 3. Fiber detection results in images A-16. Left: counting results by the expert analyst, right: predicted results by automatic detection system. Red: fibers that both the expert analyst and the automatic detection system assumed to meet the counting criteria.
The fiber detection results for image D-4 is presented in Figure 4. In this image, recall was 1.00, precision was 0.17, and F1 score was 0.29 for both detection and counting accuracy, the lowest among the 21 evaluation images. The expert analyst counted one fiber in the center of the image. The automatic fiber detection system detected a large fiber and four small fibers around it. The fiber enclosed by dotted line of the image, which was a FP, was estimated to have a length of 8.6 μm. Because the contrast in Figure 4 is weak, the expert analyst may have considered the length of this fiber to be shorter than its actual length and not counted it as it did not meet the fiber counting criteria. It is difficult even for an expert analyst, and even more difficult for a novice analyst, to accurately measure fiber sizes close to the counting criteria. The introduction of an automatic detection system may enable stricter judgment of sizes, especially those close to the counting criteria.
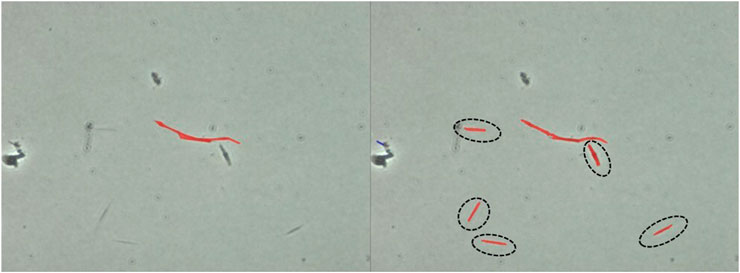
Figure 4. Example of AI detection errors in image D-4. Left: counting results by the expert analyst, right: predicted results by automatic fiber detection system. Red: Fibers that both the expert analyst and the automatic fiber detection system assumed to meet the counting criteria. Dotted line: Fibers that only the automatic fiber detection system assumed to meet the counting criteria.
Figure 5 shows the fiber detection results for image E-7. In this image, recall was 0.86, precision was 0.75, and F1 score was 0.80. In the case of counting accuracy, the recall was 0.67, the precision was 0.75, and the F1 score was 0.71. The brightly shining fiber indicated by the black arrow in the center of the image was counted by the expert analyst, but the automatic fiber detection system was unable to detect it. The PCM images used in this training dataset were taken with positive contrast, and the background is bright and the fibers are observed as dark. We speculate that learning from such a training dataset made it difficult for the AI model to detect the brightly shining fibers. Similar oversights were also confirmed in images B-13 and E-6. It is important to understand how the PCM images used to train the AI model were taken.
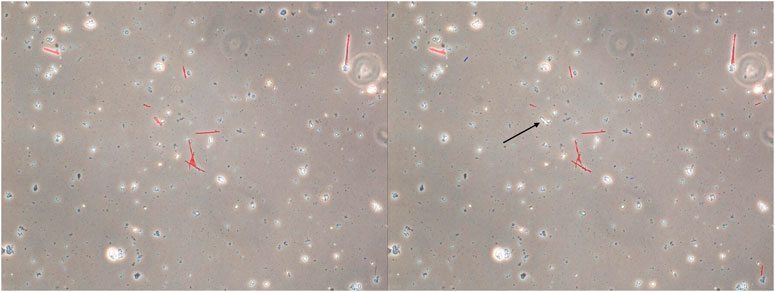
Figure 5. Fiber detection results in image E-7. Left: counting results by expert analyst; right: prediction results by automatic fiber detection system. Red: fibers that both the expert analyst and the automatic fiber detection system assumed to meet the counting criteria. The brightly shining fiber indicated by the black arrow: the fiber was counted by the expert analyst, but the automatic fiber detection system was unable to detect it.
Figure 6 shows the fiber detection results for image C-11. When evaluated based on detection accuracy, both the recall and precision were 1.0, but when evaluated based on counting accuracy, the recall was 1.0, the precision was 0.86, and the F1 score was 0.92. The bent fiber in the upper right is a single fiber, but part of it overlaps with a foreign object, causing it to be separated into two. For this reason, the automatic detection system is unable to recognize it as a single fiber and counts it as two. It is difficult to resolve this phenomenon using a semantic segmentation model, and we believe that analyst intervention is necessary.
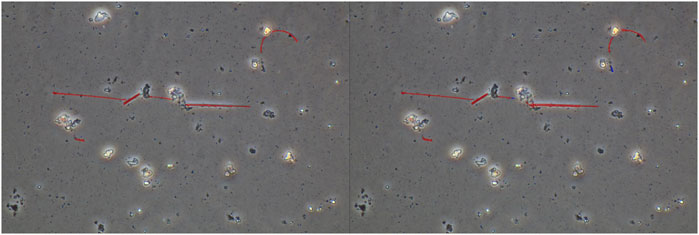
Figure 6. Challenges in fiber segmentation: Case study of image C-11. Red: Fibers that both the expert analyst and the automatic fiber detection system assumed to meet the counting criteria.
4 Discussion
False positives caused by twisting the filter and air bubbles when placing the cover glass can be mitigated by carefully preparing observation slides. However, this issue is not unique to the automatic fiber detection system used in this study; it also applies when an analyst visually counts fibers. Additionally, the current AI model struggles to distinguish between fiber aggregates and bent fibers, necessitating the use of different colors on the user interface to facilitate analyst intervention. Furthermore, detection accuracy might be improved by altering the imaging conditions of PCM images (e.g., the amount of foreign matter, contrast, number of fibers) and training on diverse datasets, or by adopting alternative AI models. However, there is also a risk that these changes could decrease accuracy. The challenge with AI-based systems lies in the lack of a universal solution for generalization and how to reduce human intervention in the future.
The time required for fiber detection in the automatic detection system was about 1.2 s per image when a GPU was used to analyze the AI model. In Japan, the official method requires 25–100 min to count fibers in 100 fields of view using a PCM. Our automatic fiber detection system can detect fibers in 100 fields of view in about 2 min, allowing for faster detection. However, this time does not include the time spent manually adjusting the focus and capturing images. To utilize this system more efficiently, future challenges include automating the creation of images with synthesized depth of focus and the capture of images as the field of view moves. In this study, we demonstrated that an automatic fiber detection system using an AI model trained with a dataset created from PCM images of actual air samples, could detect fibers with reasonable accuracy, indicating that this technology may be useful for early detection and correction of asbestos fiber release into the atmosphere due to improper demolition work.
5 Conclusion
Observation slides were made from the filters collected in ambient air or air near demolition sites, and 98 of training datasets was created from images taken using a PCM and the counting results by the expert analysts. Of these, 77 dataset were used to train a semantic segmentation model Segformer, and 21 datasets were used to evaluate an automatic detection system using the trained AI model. The fiber detection accuracy of the automatic detection system was 0.90 in recall, 0.68 in precision, and 0.77 in F1 score, while the counting accuracy was 0.78 in recall, 0.67 in precision, and 0.72 in F1 score, showing reasonable accuracy. The counting accuracy by this automatic fiber detection system based on AI model is comparable to that of manual counting by a skilled analyst, yet the time required for fiber counting is 12–50 times faster, significantly reducing the time required for analysis. This system, capable of detecting fibers rapidly and with high accuracy, is useful for preventing the atmospheric release of asbestos fibers during the demolition and removal of buildings containing asbestos materials.
The implementation of an AI-based fiber detection system can eliminate human errors related to analyst proficiency and fatigue. However, the accuracy of fiber detection decreases with lower quality microscope images, highlighting the need for high-quality image acquisition as a future challenge. This system comprises two components: one for fiber detection using an AI model and another for verifying whether the fibers meet the counting criteria of the ‘Asbestos Monitoring Manual’. The fiber detection component can be updated with a more advanced AI model as it becomes available. Furthermore, we plan to expand the dataset through ongoing collaboration with analytical companies.
Data availability statement
The original contributions presented in the study are included in the article/Supplementary Material, further inquiries can be directed to the corresponding author.
Author contributions
YI: Conceptualization, Investigation, Methodology, Validation, Visualization, Writing – original draft, Writing – review and editing. TY: Formal Analysis, Investigation, Methodology, Project administration, Supervision, Validation, Visualization, Writing – original draft, Writing – review and editing, Conceptualization, Data curation. KI: Resources, Software, Validation, Writing – original draft, Writing – review and editing, Data curation, Methodology. K-IY: Data curation, Formal Analysis, Investigation, Resources, Validation, Visualization, Writing – original draft, Writing – review and editing. KK: Investigation, Resources, Software, Validation, Writing – original draft, Writing – review and editing. HY: Data curation, Formal Analysis, Investigation, Resources, Software, Validation, Writing – original draft, Writing – review and editing. TT: Conceptualization, Project administration, Supervision, Writing – original draft, Writing – review and editing. AT: Conceptualization, Methodology, Supervision, Writing – original draft, Writing – review and editing.
Funding
The author(s) declare that no financial support was received for the research and/or publication of this article.
Acknowledgments
We would like to thank the Japan Environmental Measurement and Chemical Analysis Association and its member laboratories for providing phase-contrast microscope images and fiber counting results by expert analysts.
Conflict of interest
Authors YI, K-IY, and TT were employed by Environmental Control Center Co., Ltd. Authors KI, KK, and HY were employed by Japan NUS Co., Ltd.
The remaining authors declare that the research was conducted in the absence of any commercial or financial relationships that could be construed as a potential conflict of interest.
Generative AI statement
The author(s) declare that no Generative AI was used in the creation of this manuscript.
Publisher’s note
All claims expressed in this article are solely those of the authors and do not necessarily represent those of their affiliated organizations, or those of the publisher, the editors and the reviewers. Any product that may be evaluated in this article, or claim that may be made by its manufacturer, is not guaranteed or endorsed by the publisher.
Supplementary material
The Supplementary Material for this article can be found online at: https://www.frontiersin.org/articles/10.3389/frans.2025.1571840/full#supplementary-material
References
Biswas, S., and Biswas, D. (2021). Deep learning based asbestos fiber detection. In: 2021 IEEE applied imagery pattern recognition workshop; 2021 October 12–14; Washington, DC. Manhattan, NewYork: IEEE Xplore. doi:10.1109/AIPR52630.2021.9762114
Cai, C., Nishimura, T., Hwang, J., Hu, X.-M., and Kuroda, A. (2021). Asbestos detection with fluorescence microscopy images and deep learning. Sensors (Basel) 21, 4582. doi:10.3390/s21134582
Diederik, P. K., and Jimmy, B. (2014). Adam: a method for stochastic optimization. arXiv:1412.6980. Ithaca, New York, USA: Cornell University Library. doi:10.48550/arXiv.1412.6980
R. F. Dodson, and S. P. Hammar (2006). Asbestos: risk assessment, epidemiology, and health effects. Boca Raton: CRC Press.
Fan, T., Wang, G., Li, Y., and Wang, H. (2020). MA-Net: a multi-scale attention network for liver and tumor segmentation. Manhattan, NewYork: IEEE Access 8. p. 179656–179665. doi:10.1109/ACCESS.2020.3025372
He, K., Gkioxari, G., Dollar, P., and Girshick, R. (2018). Mask R-CNN. arXiv:1703.06870v3 [cs.CV]. doi:10.48550/arXiv.1703.06870
Higashi, T., and Takahashi, K. (2001). Asbestos and environmental health in Japan. Can. Mineral. Spec. Publ. 5, 215–226.
Iida, Y., Watanabe, K., Ominami, Y., Toyoguchi, T., Murayama, T., and Honda, M. (2021). Development of rapid and highly accurate method to measure concentration of fibers in atmosphere using artificial intelligence and scanning electron microscopy. J. Occup. Health 63, e12238. doi:10.1002/1348-9585.12238
Ministry of Health, Labour and Welfare of Japan. (2006). Enforcement of the cabinet order for partial revision of the order for enforcement of the industrial safety and health act and the ministerial order for partial revision of the ordinance on prevention of asbestos hazards. Tokyo, Japan: Ministry of Health, Labour and Welfare of Japan. Available online at: https://www.mhlw.go.jp/new-info/kobetu/roudou/sekimen/hourei/dl/050318-1.pdf (Accessed February 2 2025).
Ministry of Health, Labour and Welfare of Japan. (2022). Annual trends in the number of deaths from mesothelioma by prefecture (1995-2021) from vital statistics. Tokyo, Japan: Ministry of Health, Labour and Welfare of Japan. Available online at: https://www.mhlw.go.jp/toukei/saikin/hw/jinkou/tokusyu/chuuhisyu21/index.html (Accessed February 2 2025).
Ministry of Land, Infrastructure, Transport and Tourism of Japan. (2009). Asbestos countermeasures subcommittee, Building subcommittee of the council for social infrastructure development, 5th Meeting Handout. Tokyo, Japan: Ministry of Land, Infrastructure, Transport and Tourism of Japan. Available online at: https://www.mlit.go.jp/common/000044765.pdf (Accessed February 2 2025).
Ministry of the Environment of Japan. (2022a). Results of the asbestos air concentration survey in FY2021. Tokyo, Japan: Ministry of the Environment of Japan. Available online at: https://www.env.go.jp/content/000080331.pdf (Accessed February 2 2025).
Ministry of the Environment of Japan. (2022b). Asbestos monitoring manual (Version 4.2). Tokyo, Japan: Ministry of the Environment of Japan. Available online at: https://www.env.go.jp/content/000066624.pdf (Accessed February 2 2025).
K. Morinaga (2008). Exposure to asbestos and diseases caused by asbestos. Tokyo, Japan: Sanshin Tosho. 978 4 87921 210 8.
Rabiee, A., Ventura, G. D., Mirzapour, F., Malinconico, S., Bellagamba, S., Lucci, F., et al. (2023). Deep learning for asbestos counting. J. Hazard. Mater 455, 131590. doi:10.1016/j.jhazmat.2023.131590
Terazono, A., Sakai, S., and Takatsuki, H. (1999). Asbestos emission caused by demolition of buildings after the Great Hanshin-Awaji Earthquake. J. Jpn. Soc. At. Environ. 34, 192–210. doi:10.11298/taiki1995.34.3_192
The Health and Safety Executive (2021). Asbestos: the analyst’s guide. 2nd edition. Liverpool, England: The Health and Safety Executive.
World Health Organization (1986). Environmental Health Criteria 53. In: Asbestos and other natural mineral fibers. Geneva, Switzerland: World Health Organization. Available online at: https://apps.who.int/iris/bitstream/handle/10665/37190/9241541938-eng.pdf (Accessed February 2, 2025).
World Health Organization (1997). Determination of airborne fibre number concentrations. A recommended method, by phase-contrast optical microscopy (membrane filter method). Geneva, Switzerland: World Health Organization. Available online at: https://iris.who.int/bitstream/handle/10665/41904/9241544961.pdf?sequence=1 (Accessed February 2, 2025).
Xie, E., Wang, W., Yu, Z., Anandkumar, A., Alvarez, J. M., and Luo, P. (2021). Segformer: simple and efficient design for semantic segmentation with transformers. arXiv 2105, 15203. doi:10.48550/arXiv.2105.15203
Keywords: artificial intelligence, asbestos, phase-contrast microscopy, rapid detection, SegFormer
Citation: Iida Y, Yamamoto T, Iwasaki K, Yuki K-I, Kiri K, Yamashiro H, Toyoguchi T and Terazono A (2025) Development of a rapid fiber-detection system using artificial intelligence in phase-contrast microscope images of actual atmospheric samples. Front. Anal. Sci. 5:1571840. doi: 10.3389/frans.2025.1571840
Received: 06 February 2025; Accepted: 12 June 2025;
Published: 25 June 2025.
Edited by:
Andrey Korchevskiy, Chemistry and Industrial Hygiene, Inc., United StatesReviewed by:
Jesus Gonzalez-Rubio, University of Castilla La Mancha, SpainAkio Kuroda, Hiroshima University, Japan
Copyright © 2025 Iida, Yamamoto, Iwasaki, Yuki, Kiri, Yamashiro, Toyoguchi and Terazono. This is an open-access article distributed under the terms of the Creative Commons Attribution License (CC BY). The use, distribution or reproduction in other forums is permitted, provided the original author(s) and the copyright owner(s) are credited and that the original publication in this journal is cited, in accordance with accepted academic practice. No use, distribution or reproduction is permitted which does not comply with these terms.
*Correspondence: Yukiko Iida, eS5paWRhLmlzbEBnbWFpbC5jb20=; Takashi Yamamoto, dHlhbWFAbmllcy5nby5qcA==