 Tatsuya Itoi
 Yuki Iita
 Naoto Sekimura
- School of Engineering, The University of Tokyo, Tokyo, Japan
Recently, especially after the 2011 off the Pacific coast of Tohoku earthquake and the Fukushima Daiichi nuclear power plant accident, the need for treating residual risks and cliff-edge effects in safety-critical facilities has been widely recognized as an extremely important issue. In this article, the sophistication of seismic designs in safety-critical facilities is discussed from the viewpoint of mitigating the consequences of accidents, such as the avoidance of cliff-edge effects. For this purpose, the implementation of a risk-informed defense-in-depth-based framework is proposed in this study. A basic framework that utilizes diversity in the dynamic characteristics of items and also provides additional seismic margin to items important for safety when needed is proposed to prevent common cause failure and to avoid cliff-edge effects as far as practicable. The proposed method is demonstrated to be effective using an example calculation.
Introduction
Natural hazards, including earthquakes, are considered to be one of several possible causes of major accidents in safety-critical facilities such as nuclear power plants. Conventionally, it had been required, when designing safety-critical facilities against earthquakes, that design ground motion must be determined so that risks, e.g., to public health, associated with ground motion hazards are negligible compared with those associated with accidents of internal origins (International Atomic Energy Agency, 1988). It has been occasionally misunderstood that seismic safety of safety-critical facilities can be achieved if design ground motion is set large enough so that seismic risks can be sufficiently reduced. Recently, however, especially after the 2011 off the Pacific coast of Tohoku earthquake and the Fukushima Daiichi nuclear power plant accident, the need for serious consideration and treatment of residual risks has been widely recognized as an extremely important issue. Although the accident was caused due to tsunami, it was also recognized that there exists a room for discussion also for a framework of earthquake engineering.
A framework of performance-based seismic design (Structural Engineers Association of California, 1995) is considered to be one of several reasonable approaches in the practice of seismic design of engineering facilities. Within this framework, as shown in Figure 1, the levels of design ground motion are specified so that several performance objectives are met, and these levels are specified based on the potential severity of consequences when facilities suffer from damage. For safety-critical facilities, it is required to be operational even in the case of very rare earthquakes, i.e., severe earthquakes, and a near collapse state is not acceptable for any level of earthquake. On the other hand, a near collapse state is acceptable for basic facilities in the event of very rare earthquakes. What should be emphasized here is that this framework does not imply that safety-critical facilities do not require a mitigation strategy in dealing with the consequences of failure to the extent where these facilities are severely damaged to the point of collapse. Such a strategy, nonetheless, is considered to be more important for safety-critical facilities than for basic facilities.
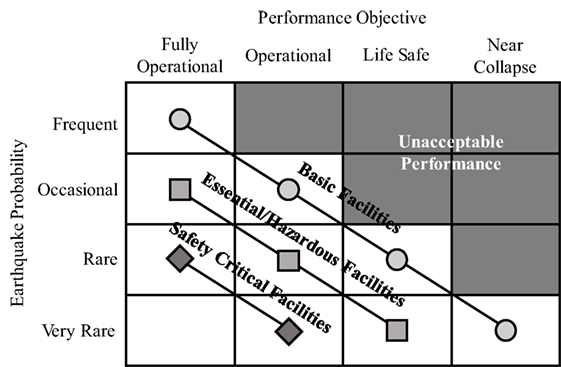
Figure 1. Typical framework for performance-based seismic design (Structural Engineers Association of California, 1995).
In the field of nuclear safety, the “defense-in-depth” concept is considered to be important when dealing with residual risks, i.e., remaining risks after safety measures are introduced, and it is the primary means to prevent and mitigate the consequences of accidents (International Atomic Energy Agency, 1996, 2006). For safety-critical facilities, the defense-in-depth concept is implemented through a combination of consecutive and independent levels of protection (International Atomic Energy Agency, 1996, 2006). The central feature of the defense in depth is the idea of multiple levels of protection of public and workers (International Atomic Energy Agency, 1996). Under seismic excitations, however, it is impossible and unrealistic to assume that each level of protection for defense in depth is completely independent of each other. This is because items corresponding to each level of defense are simultaneously excited by earthquake ground motion in space and time, and this could lead to simultaneous malfunction and/or damage that results in a common cause failure. If items that are important in preventing accidents and mitigating the consequences of accidents simultaneously malfunction and/or suffer from damage, accidents with serious consequences could occur. These kinds of effects in the event of accidents are also known as cliff-edge effects (International Atomic Energy Agency, 2003, 2016a,b). The term “cliff-edge effects” implies a sudden large variation in condition of the facilities in response to a small variation in an input. It is triggered by simultaneous malfunction of these items.
There appears to be, however, no widely accepted approach in implementing the defense-in-depth concept over a wide range of seismic excitations, because the concept of the defense in depth was originally developed for accidents of internal origins. Therefore, this article proposes a basic theoretical framework with respect to seismic design of items important to safety based on a risk-informed concept (United States Nuclear Regulatory Commission, 2012), so that the defense-in-depth concept can be appropriately implemented for the seismic safety of safety-critical facilities.
As mentioned earlier, multiple items in a facility are excited and some of them are damaged by earthquake ground motions simultaneously. Moreover, spatially distributed multiple facilities suffer from damage simultaneously. These characteristics should be taken into consideration when conducting seismic risk assessment (Bazzurro and Cornell, 2002; Wang et al., 2009). Ground motion modeling, which can be applied to such seismic probabilistic risk assessment, has also been developed (Wang and Takada, 2005; Baker and Jayaram, 2008). In this study, a basic implementation method to deal with such characteristics of ground motions, called “risk-informed defense-in-depth-based framework” (Miyano et al., 2015), is developed by using this risk-based framework. The proposed method combines the concepts of diversity and seismic margin for the framework to give a basic insight on how multiple items closely located to each other can be designed to cope with earthquakes by combining multiple barriers.
Proposed Framework of Seismic Design of Items Important to Safety
Background and Assumption
Items important to safety can be simply categorized into items that are important in preventing accidents and items that are important in mitigating the consequences of accidents. Items important to mitigating the consequences of accidents are required to function only after the occurrence of an accident, which essentially means that items important in preventing accident, in the first place, are damaged and/or have malfunctioned. Conventional seismic design procedures, however, do not usually distinguish between the roles of these two items explicitly.
The strategy for items important for safety is considered to be developed by combining diversity, physical separation, and functional independence (International Atomic Energy Agency, 2016a). Implementation of physical separation and functional independence is considered to be straightforward, while implementation of diversity to seismic excitation needs to be discussed further. Therefore, implementation of diversity to seismic excitation is discussed in this article. Diversity is provided by different mechanisms to function. In the seismic design of facilities, diversity is considered to be provided through differences in location of items (such as a plan layout or elevation) and by different dynamic characteristics between items (such as structural type, natural period, and damping characteristics). Providing an additional seismic margin, such as differentiation in classes of required seismic margins to each item based on its role, is another means in avoiding cliff-edge effects (International Atomic Energy Agency, 2016a). Typically, conservative parameters are introduced in the analysis of seismic design to deal with uncertainty, which are based on engineering judgment, the results of structural analysis, etc. These conservative parameters result in conservative designs. Quantification of such conservativeness is important to discuss the performance of facility to ground motions greater than the design ground motion (Budnitz et al., 1985; Haselton et al., 2011). In this study, an appropriate combination of seismic margin and diversity is discussed to implement the defense-in-depth concept to seismic design for safety-critical facility based on the risk-informed approach. A method to assign required additional seismic margins to each item is proposed depending on the characteristics of diversity introduced. As mentioned earlier, diversity is important to implement the defense-in-depth concept under seismic excitations. It is, however, not always possible to introduce it, because of the limitation due to the characteristics of item. Additional seismic margin is considered to be effective as a means of supplementing for such cases. Here, additional seismic margin means that seismic margin is required in addition to the seismic margin that is already introduced in the conventional seismic design.
A Method to Identify the Most Probable Source Characteristics and Associated Ground Motion Parameters That May Cause Accidents at Safety-Critical Facilities
Probabilistic Seismic Hazard Analysis and Ground Motion Prediction Equation
Probabilistic seismic hazard analysis is used to determine design ground motion and to analyze seismic risk of facilities. An example of the annual exceedance probability of design ground motion required for safety-critical facilities is usually ∼10−4 or smaller (Nuclear Regulatory Commission, 1997, 2007). Statistical equations, called ground motion prediction equations, are conventionally used to predict ground motions. In all, 5% damped acceleration response spectra are conveniently used to characterize a variety of frequency contents in different ground motions. A ground motion prediction equation for 5% damped spectral acceleration that is used in this study was initially developed for crustal earthquakes in Japan (Itoi et al., 2015). The functional form of the equation is as follows (Itoi et al., 2015):
where Sa(T) is the 5% damped spectral acceleration at period T. MW, X (km), VS30 (m/s), and Z1500 (m) are the moment magnitude, the shortest distance from fault to site, the 30 m average shear wave velocity, and the depth to shear wave velocity, which is equal to 1,500 m/s, respectively. EINTER(T) and EINTRA(T) are standard normal variables for inter-event and intra-event residuals, respectively, while σINTER(T) and σINTRA(T) are their corresponding standard deviations. a(T) to k(T) are the coefficients obtained by the least-square regression. The coefficients a(T) to k(T), σINTER(T), and σINTRA(T) obtained based on the least-square regression are summarized in Table 1. Period-to-period correlations for inter-event residuals ρINTER(TA, TB) and intra-event residuals ρINTRA(TA, TB) are summarized in Table 2. Correlation of EINTER(T) and EINTRA(T) between different periods T is important when the possibility of simultaneous damage of multiple items, i.e., a common cause failure, is discussed. The applicable range of the equation is 5.1 ≤ MW ≤ 6.9, X ≤ 100 km, 110 m/s ≤ VS30 ≤ 700 m/s, and Z1500 ≤ 3,000 m (Itoi et al., 2015).
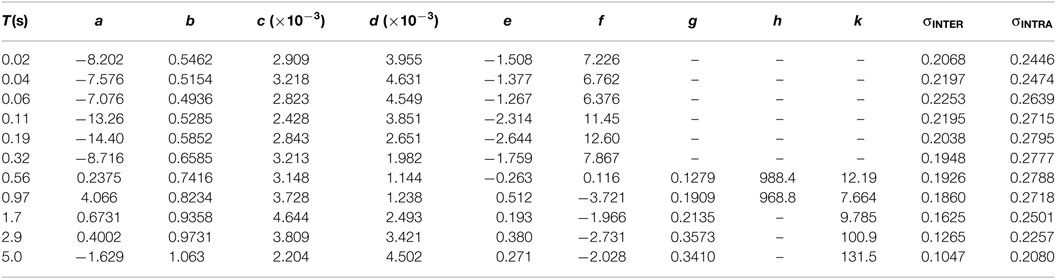
Table 1. The coefficients for the ground motion prediction equation (Itoi et al., 2015).
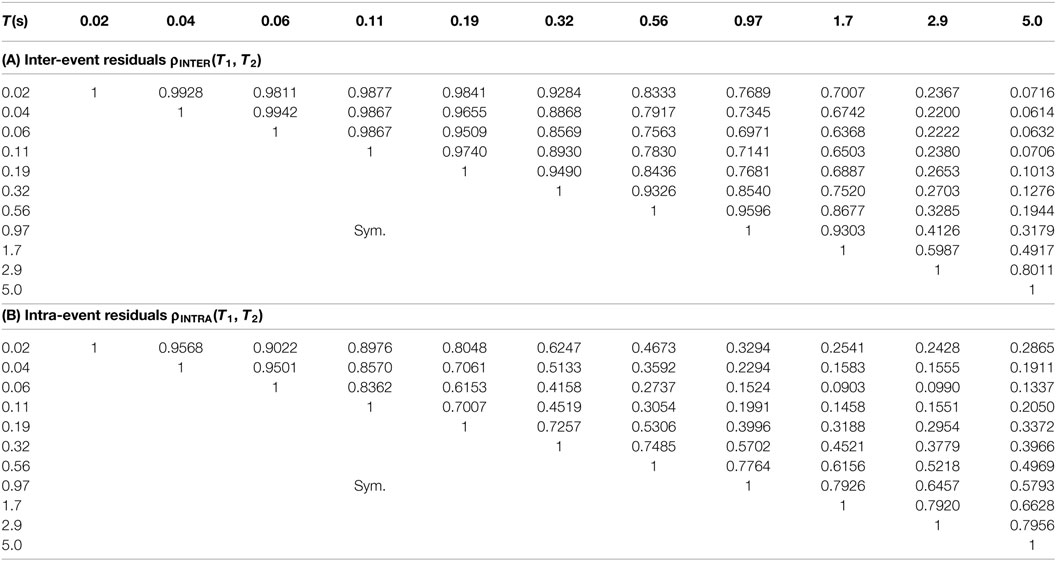
Table 2. Period-to-period correlation for inter-event and intra-event residuals (Itoi et al., 2015).
A Method to Identify the Most Probable Source Characteristics
In this section, a framework is proposed to identify the most probable source characteristics and ground motion parameters that may result in accidents. The most probable source characteristics and ground motion parameters are defined here as the design point that can be obtained by the first-order reliability method (FORM) (Rackwitz and Fiessler, 1978). The design point is defined as the point with the highest probability density in the domain of accident. The FORM (Rackwitz and Fiessler, 1978), probabilistic seismic hazard deaggregation (McGuire, 1995; Takada et al., 2003), and the conditional mean spectrum (Baker, 2011) are used in the proposed framework.
A system that is considered for a simplified case is assumed to contain two items (items A and B) that are located at the same place. It is assumed that an accidental condition occurs if item A fails. Item B is then used to mitigate the consequences of the resulting accident. A fault tree representation of system failure defined by an occurrence of an accident with serious consequences is shown in Figure 2 using the priority-AND gate. Item A is assumed to be a single-degree-of-freedom system that has a natural period TA. The limit state function for failure of item A, GA, is defined as follows:
where RA(TA) is the capacity of item A as a function of the 5% damped spectral acceleration at T = TA and is assumed to have a log-normal distribution. SA(TA) is the maximum seismic action on item A, i.e., 5% damped spectral acceleration at T = TA. The probability distribution of SA(TA) for a certain period of time, which is 1 year in this case, is obtained using the probabilistic seismic hazard analysis. Item A fails if GA is negative, while item A survives if GA is positive. The most probable level of spectral acceleration sA* for SA(TA) is obtained using FORM.
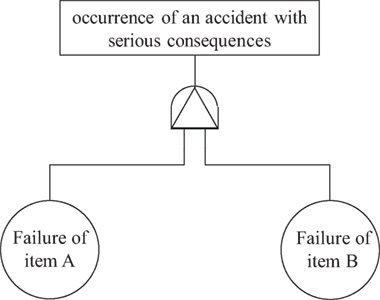
Figure 2. Fault tree representation of the system considered.
Then, the most probable earthquake source parameters and ground motion parameters that may result in accidents are identified. Similar to Eq. 2, a limit state function GHA is defined as follows:
where SCA(TA) is the ground motion given the earthquake occurrence. Based on Eq. 1, SCA(TA) is described as follows:
where MW, X, EINTER(TA), and EINTRA(TA) are random variables representing the moment magnitude, the shortest distance from fault to site, the standard normal variable for inter-event residual, and the standard normal variable for intra-event residual, respectively. νS30S and z1500S are VS30 and Z1500 at the location of the system, respectively.
The most probable values for MW, X, EINTER(TA) and EINTRA(TA), MW*, x*, εINTER* (TA), and εINTRA* (TA) are obtained given that SA (TA) = sA* using FORM. The methodology used is almost identical to that proposed by Takada et al. (2003) and similar to that proposed by McGuire (1995).
Item B is also assumed to be a single-degree-of-freedom system with a natural period TB, which can be different from TA. The most probable earthquake source characteristics under which item B is required to function is an earthquake of magnitude MW*, whose shortest distance from fault to site is x*. The most probable spectral acceleration at period TA is sA*, which is obtained from Eq. 3 using the abovementioned procedure. The most probable spectral acceleration at period TB, , given this condition, is calculated as follows:
where and are the conditional means of the bivariate normal distribution given εINTER* (TA) and εINTRA* (TA), respectively, as follows:
This concept is identical to that of the conditional mean spectrum proposed by Baker (2011). As can be understood from Eqs 6 and 7, and respectively, approach asymptotically to 0 as the difference between TA and TB increases. This is because ρINTER(TA, TB) and ρINTRA(TA, TB) approach 0 as the difference between TA and TB increases as shown in Table 2.
Proposed Framework to Provide Additional Seismic Margins to Items Important in Mitigating the Consequences of Accidents
Item B should be designed based on a different concept from that of item A. It is because a role of item B is different from that of item A. Therefore, it has been proposed in this study that the seismic margin mB(TB|TA), which is additionally required for item B, is a function of the obtained spectral acceleration and is given as follows:
where SBD(TB) is the spectral acceleration at period TB for the original seismic design obtained using the same concept as that for item A. From Eq. 5, it can be found that the additional seismic margin mB(TB|TA) is almost unity if the difference between TA and TB is large enough. This is justified because diversity with respect to dynamic characteristics, such as the natural period, is expected to work effectively. (This will be discussed in the next chapter.). On the other hand, a larger additional margin mB(TB|TA) is required if TA and TB are close to each other, i.e., if the diversity in the characteristics of items is not introduced in the seismic design. The proposed method combines the information on regional seismicity, the characteristics of ground motions, and the vulnerability of the facility to determine the additional seismic margin required for items that are important in mitigating the consequences of accidents.
Seismic Margin Required for Items That are Important in Mitigating the Consequences of Accidents for Area Sources
Simulation Conditions
An area source as shown in Figure 3 is used as an example. Point sources are uniformly distributed within a radius of 100 km, whereby their focal depth is 10 km. The facility is assumed to be located on the ground surface above the center of the area source. The probability distribution of the earthquake magnitude is assumed to be in agreement with the Gutenberg–Richter law. The cumulative distribution function for the magnitude FM(m) is as follows:
where mmax (6.95) and mmin (5.05) are the maximum and minimum magnitudes, respectively. b is assumed to be 0.9. These values are typical for those used for earthquakes without specified source faults in Japan. νS30S and z1500S of Eq. 5 are assumed to be 700 m/s and 100 m, respectively. νS30S and z1500S are the 30 m average shear wave velocity and the depth to shear wave velocity, which is equal to 1,500 m/s at the site, respectively. Seismic hazard curves and uniform hazard response spectra calculated at the facility are shown in Figure 4. The design ground motion for a system is assumed to correspond to the exceedance probability of 10−4/year.
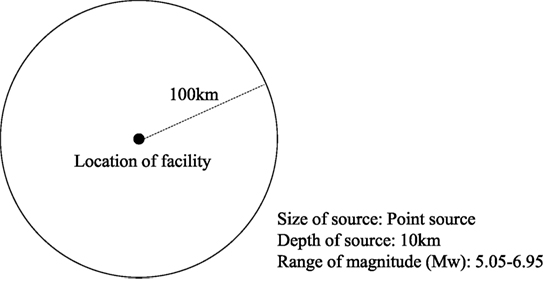
Figure 3. Location of facility and the assumed area source. Size of source: point source; depth of source: 10 km; range of magnitude (Mw): 5.05–6.95.
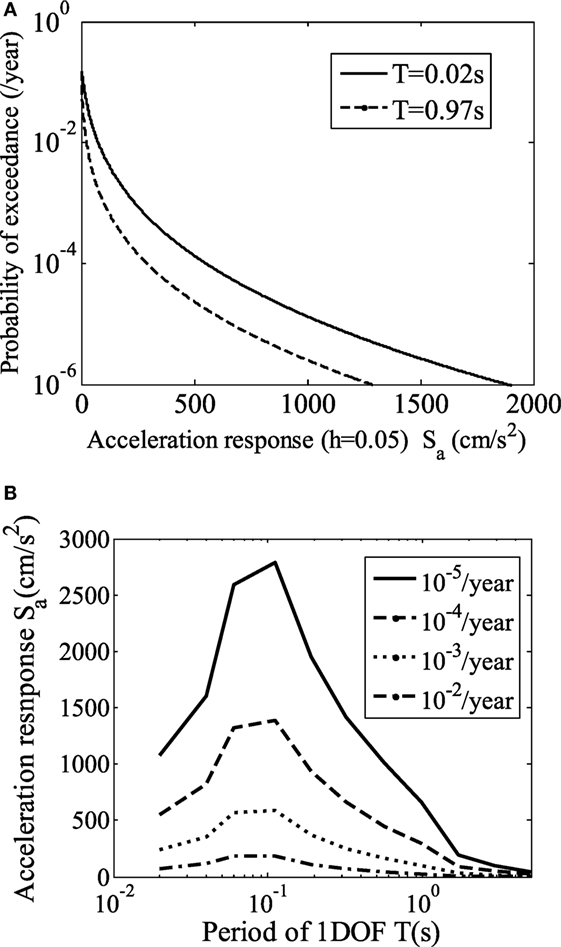
Figure 4. Seismic hazard at the location of the facility. (A) T = 0.02 s and T = 0.97 s and (B) uniform hazard spectra.
The facility is modeled as a system that contains two items, items A and B, as is the case in Section “A Method to Identify the Most Probable Source Characteristics.” The natural period of item A, TA, is assumed to be 0.02 s. As for item B, three alternative options (items B0, BS, and BT) are assumed as listed in Table 3. It is assumed as an example that the logarithmic standard deviation of the capacity of each item is 0.3, while the conditional probability of failure at the level of design ground motion is 0.01. The most probable spectral acceleration and additional seismic margin required for items that are important in mitigating the consequences of accidents (items BS and BT) are obtained based on the proposed method as shown in Figure 5. Seismic fragility curves that show the cumulative distribution function of the capacity as a function of 5% spectral acceleration at the natural period, assumed for items B0, BS, and BT, are shown in Figures 6A,B. The most probable source characteristics and the most probable ground motion parameters that may cause accidents are shown in Table 4. An additional seismic margin of 1.49 for item BS, as compared to item B0, is obtained using Eq. 8 for this example, whereas an additional seismic margin is not required for item BT. If two items have the similar mechanism to resist seismic forces, it is reasonable to assume that the capacities between them are correlated. Therefore, for cases 0 and S, the correlation coefficient ρ between the capacities of A and B is assumed to be 0, 0.3, and 0.6, i.e., for items B0 and BS, where ρ = 0 for reference. Independence between items A and BT is assumed for case T.
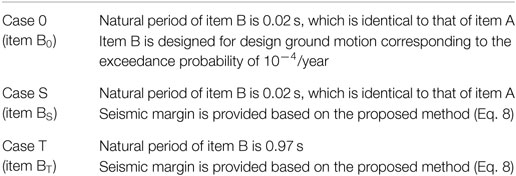
Table 3. Three alternative options for item B.
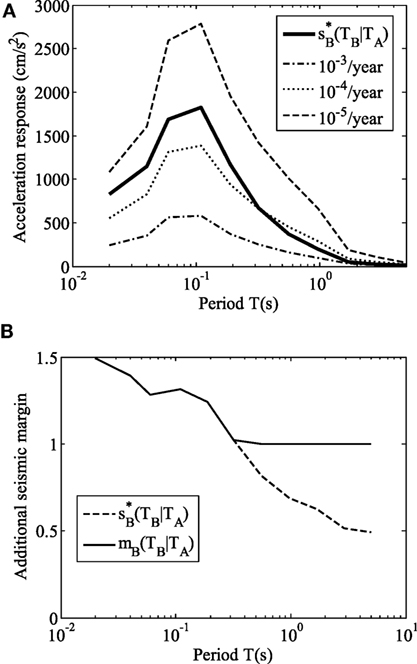
Figure 5. Most probable acceleration response spectrum and the required additional seismic margin required for items important in mitigating the consequences of accidents. (A) Comparison between the most probable acceleration response spectrum and uniform hazard spectra and (B) required additional seismic margin.
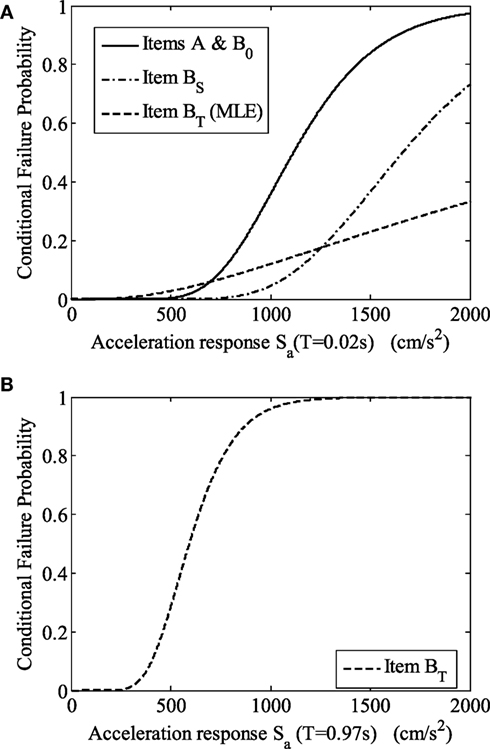
Figure 6. Seismic fragility curves for items B0, BS, and BT. As a function of 5% damped spectral acceleration at (A) 0.02 s (items B0, BS, and BT) and (B) 0.97 s (item BT).

Table 4. Most probable source characteristics and the most probable ground motion parameters that may cause accidents.
Monte Carlo simulations are conducted where the number of samples for the simulation is 108. Samples of hypocenter and magnitude of earthquakes, 5% damped acceleration response spectra, and capacity of items are generated to calculate the fragility curve for failure of the system, i.e., simultaneous malfunction of both items.
Results and Discussions
Seismic fragility curves for item BT as a function of 5% damped spectral acceleration at 0.02 s are estimated based on the simulated samples using the maximum likelihood estimation (Shinozuka et al., 2000), as shown in Figure 6A. The logarithmic standard deviation obtained is 0.93, which includes the effects of uncertainties in the shape of acceleration response spectra and the capacity of the item.
Seismic fragility curves of the system representing the cumulative distribution as a function of 5% damped spectral acceleration at 0.02 s, for the occurrence of a simultaneous malfunction of two items, are also obtained using the maximum likelihood estimation (Shinozuka et al., 2000). These are shown in Figure 7. As for case 0, i.e., item B0, the median capacity of the system is 1.2 times larger than that of item A when ρ = 0, while it is 1.1 times larger when ρ = 0.6. The median capacity decreases as the correlation coefficient ρ increases because of simultaneous damage of two items. As for case S where an additional seismic margin is provided to item B, the median capacity of the system is 1.5 times larger than that of item A when ρ = 0, 0.3, and 0.6. The difference between ρ can be observed for ground motion <2,000 cm/s2. As for case T, the case that the natural period of item B is elongated, the median capacity of the system is 2.1 times larger than that of item A, while the logarithmic standard deviation is 0.47, and this is larger than those in case 0 (0.24–0.28) and case S (0.26–0.30). Case T is more effective for larger ground motion levels as compared to cases 0 and S.
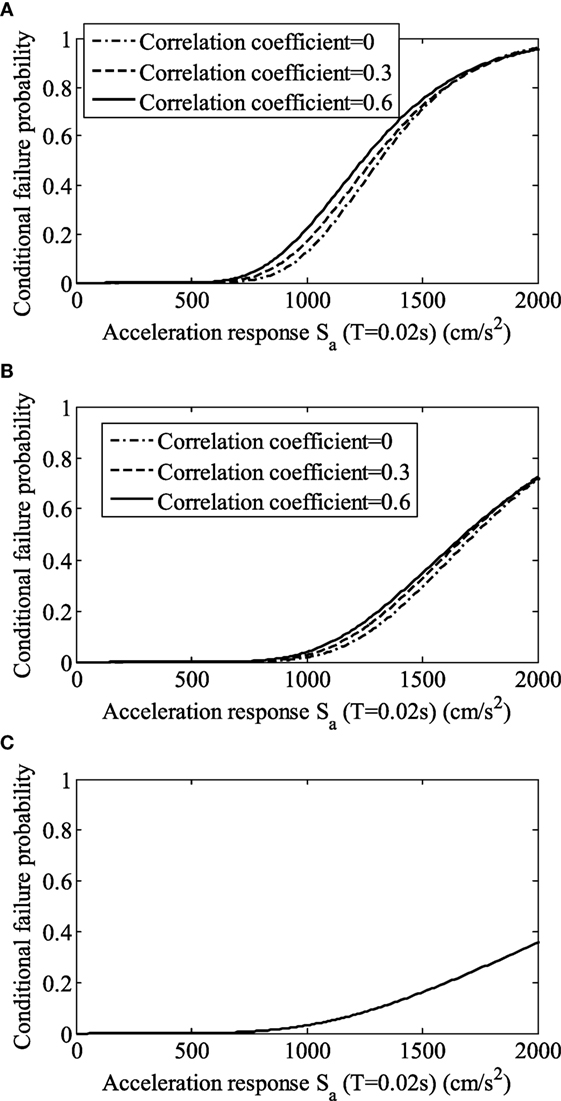
Figure 7. Seismic fragility curves for occurrence of accident with serious consequences. (A) Case 0, (B) Case S, and (C) Case T.
The annual failure probability of the system is numerically calculated to discuss the effectiveness of diversity in the natural period of items and additional seismic margins. The annual failure probability of the system, Pfsys, is calculated as follows:
where fs(s) is the probability density function of the annual maximum 5% damped spectral acceleration at 0.02 s, while FSys(s) is the cumulative distribution function of the capacity of the system.
The results are tabulated in Table 5. For case 0, item B0 is not so much effective to mitigate the consequences of accidents, because the failure probability of the system does not decrease <0.449–0.640 times as compared to that of item A. The failure probability of the system decreases 0.165–0.213 times as compared to that of item A for case S, and it decreases 0.14 times as compared to that of item A for case T. Both cases T and S are effective in mitigating the consequences of accidents, while case 0 is not because of the effects of common cause failure.
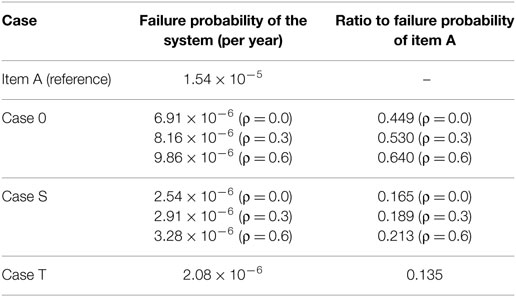
Table 5. Calculated failure probabilities for the system.
It still remains a room for discussion how this framework can be applied to the design of actual safety-critical facility. One of typical examples where the framework can be applied is the case when an emergency operations facility is additionally constructed in the vicinity of the facility. Whether a base-isolated structure is better than an earthquake-resistant structure for the emergency operations facility should be discussed not only by the performance of a single facility but also based on the performance of a group of facilities. The proposed framework can be used to discuss the latter case.
Conclusion
In this article, the sophistication of seismic design of safety-critical facilities was discussed from the viewpoint of seismic design of items that are important in mitigating the consequences of accidents to avoid cliff-edge effects. The proposed approach is considered to be related to an implementation of risk-informed and performance-based defense in depth.
First, it was pointed out that a strategy in mitigating the consequences of severe accidents to the point of near collapse is more important for safety-critical facilities than for basic facilities. Therefore, a basic framework for ensuring diversity in dynamic characteristics of items and providing additional seismic margin, such as a differentiation in classes of required seismic margins to each item based on its role, was proposed. This framework is meant to prevent a common cause failure and to avoid cliff-edge effects based on a risk-informed systems approach. The framework is proposed by utilizing the concepts of the FORM, probabilistic seismic hazard deaggregation, and the conditional mean spectrum. An appropriate combination of seismic margin and diversity was discussed to implement the defense-in-depth concept to seismic design based on the risk-informed approach. An example was demonstrated to prove that the proposed method was effective. The proposed method is considered to be useful because a defense-in-depth concept can be appropriately implemented under a wide range of seismic excitations.
Further applicability of the proposed method should be discussed using a more realistic system in future study. An actual safety-critical facility is composed of a large number of items and is much more complicated, although cases with two items are investigated in this article as a simplified example. Increasing the redundancy ensures higher level of safety, while total cost increases, including initial and maintenance costs. A framework of cost–benefit analysis should be developed to discuss how safe is safe enough. The effects of diversity in location of items in addition to diversity in dynamic characteristics are also needed to be discussed in the future study.
Author Contributions
TI contributed to develop the framework and to conduct part of simulation study. YI contributed to conduct simulation. NS contributed to develop and elaborate the proposed framework of nuclear safety.
Conflict of Interest Statement
The authors declare that the research was conducted in the absence of any commercial or financial relationships that could be construed as a potential conflict of interest.
Funding
Part of this study is supported by The Center of World Intelligence Project for Nuclear S&T and Human Resource Development of the Ministry of Education, Culture, Sports, Science and Technology (MEXT), Japan (Grant Number: 271104).
References
Baker, J. W. (2011). Conditional mean spectrum: tool for ground motion selection. J. Struct. Eng. 137, 322–331. doi: 10.1061/(ASCE)ST.1943-541X.0000215
Baker, J. W., and Jayaram, N. (2008). Correlation of spectral acceleration values from NGA ground motion models. Earthq. Spectra 4, 299–317. doi:10.1193/1.2857544
Bazzurro, P., and Cornell, C. A. (2002). “Vector-valued probabilistic seismic hazard analysis (VPSHA),” in Proceedings of 7th U.S. National Conference on Earthquake Engineering (Boston, MA).
Budnitz, R. J., Amico, P. J., Cornell, C. A., Hall, W. J., Kennedy, R. P., Reed, J. W., et al. (1985). An Approach to the Quantification of Seismic Margins in Nuclear Power Plants, NUREG/CR-4334. Washington, DC: Lawrence Livermore National Laboratory, U.S. Nuclear Regulatory Commission.
Haselton, C. B., Liel, A. B., Deierlein, G. G., Dean, B. S., and Chou, J. H. (2011). Seismic collapse safety of reinforced concrete buildings. I: assessment of ductile moment frames. J. Struct. Eng. 137, 481–491. doi:10.1061/(ASCE)ST.1943-541X.0000318
International Atomic Energy Agency. (1988). Code on the Safety of Nuclear Power Plants: Siting, Safety Series, No. 50-C-S. Vienna: International Atomic Energy Agency.
International Atomic Energy Agency. (1996). Defence in Depth in Nuclear Safety, INSAG-10. Vienna: International Atomic Energy Agency.
International Atomic Energy Agency. (2003). Seismic Design and Qualification for Nuclear Power Plants, Safety Guide No. NS-G-1.6. Vienna: International Atomic Energy Agency.
International Atomic Energy Agency. (2006). Fundamental Safety Principles, No. SF-1. Vienna: International Atomic Energy Agency.
International Atomic Energy Agency. (2016a). Safety of Nuclear Power Plants: Design, Specific Safety Requirements No. SSR-2/1 (Rev. 1). Vienna: International Atomic Energy Agency.
International Atomic Energy Agency. (2016b). Considerations on the Application of the IAEA Safety Requirements for the Design of Nuclear Power Plants, IAEA-TECDOC-1791. Vienna: International Atomic Energy Agency.
Itoi, T., Murakami, M., and Sekimura, N. (2015). Statistical equations of response spectra of crustal earthquake for assessment of multiple facilities seismic risk. J. Jpn. Assoc. Earthq. Eng. 15, 126–141; (in Japanese with English abstract). doi:10.5610/jaee.15.6_126
McGuire, R. K. (1995). Probabilistic seismic hazard analysis and design earthquakes – closing the loop. Bull. Seismol. Soc. Am. 85, 1275–1284.
Miyano, H., Takada, T., and Itoi, T. (2015). Tsunami resistant engineering for nuclear safety: (No.2) integrated risk-informed earthquake-tsunami protection framework for nuclear safety. J. Atom. Energy Soc. Jpn. 57, 639–645; (in Japanese).
Nuclear Regulatory Commission. (1997). Regulatory Guide 1.165 Identification and Characterization of Seismic Sources and Determination of Safe Shutdown Earthquake Ground Motion (RG 1.165). Washington, DC: United States Nuclear Regulatory Commission.
Nuclear Regulatory Commission. (2007). Regulatory Guide 1.208 A Performance-Based Approach to Define the Site-Specific Earthquake Ground Motion (RG 1.208). Washington, DC: United States Nuclear Regulatory Commission.
Rackwitz, R., and Fiessler, B. (1978). Structural reliability under combined random load sequences. Comput. Struct. 9, 489–494. doi:10.1016/0045-7949(78)90046-9
Shinozuka, M., Feng, M. Q., Lee, J., and Naganuma, T. (2000). Statistical analysis of fragility curve. J. Eng. Mech. 126, 1224–1231. doi:10.1061/(ASCE)0733-9399(2000)126:12(1287)
Structural Engineers Association of California. (1995). Vision 2000 – A Framework for Performance-Based Design. Sacramento, CA: Vision 2000 Committee.
Takada, T., Ochi, S., and Kanda, J. (2003). Basic study on determination of probabilistic controlling earthquakes. J. Struct. Constr. Eng. 68, 53–59; (in Japanese with English abstract). doi:10.3130/aijs.68.App53
United States Nuclear Regulatory Commission. (2012). A Proposed Risk Management Regulatory Framework, NUREG-2150. Washington, DC.
Wang, M., and Takada, T. (2005). Macrospatial correlation model of seismic ground motions. Earthq. Spectra 21, 1137–1156. doi:10.1193/1.2083887
Keywords: seismic design, risk, safety-critical facility, defense in depth, cliff-edge effects
Citation: Itoi T, Iita Y and Sekimura N (2017) A Framework for Seismic Design of Items in Safety-Critical Facilities for Implementing a Risk-Informed Defense-in-Depth-Based Concept. Front. Built Environ. 3:27. doi: 10.3389/fbuil.2017.00027
Received: 17 January 2017; Accepted: 13 April 2017;
Published: 05 May 2017
Edited by:
Katsuichiro Goda, University of Bristol, UKReviewed by:
Taojun Liu, United States Geological Survey, USAChristian Málaga-Chuquitaype, Imperial College London, UK
Copyright: © 2017 Itoi, Iita and Sekimura. This is an open-access article distributed under the terms of the Creative Commons Attribution License (CC BY). The use, distribution or reproduction in other forums is permitted, provided the original author(s) or licensor are credited and that the original publication in this journal is cited, in accordance with accepted academic practice. No use, distribution or reproduction is permitted which does not comply with these terms.
*Correspondence: Tatsuya Itoi, aXRvaUBuLnQudS10b2t5by5hYy5qcA==