 Turki S. Alahmari
 Chris S. Kennedy
 Alain M. Cuaron
 Brad D. Weldon
 David V. Jáuregui
- 1Department of Civil Engineering, College of Engineering, New Mexico State University, Las Cruces, NM, United States
- 2Stubbs Engineering Incorporated, Las Cruces, NM, United States
Recent research has developed mixture proportions for ultra-high performance concrete (UHPC) using materials primary local to New Mexico, United States of America (USA). In 2017, a two-span bridge was constructed in Anthony, New Mexico, USA consisting of prestressed girders using the locally developed non-proprietary UHPC, for span one, and high performance concrete (HPC), for the second span. Field tests were conducted on the bridge ~9 months apart to investigate the performance and behavior of the UHPC and provide baseline data for future studies and condition evaluation of the bridge. The load tests consisted of various load configurations utilizing up to four trucks weighing 267 kN on average. The load paths were designed to maximize strains along the length of the bridge and investigate transverse load distributions between girders. The measured results provide a comparison of the behavior and performance of the UHPC and the HPC girders and were also compared to the American Association of State Highway and Transportation Officials (AASHTO) predicted behaviors. This study is one of the first that compares HPC and non-proprietary UHPC bridge performance subjected to the same environmental conditions and vehicular loading. The findings of the study will aid in the development of recommendations incorporating UHPC into design provisions as well as provide meaningful information of the short and long-term performance between the two materials including durability and load distribution.
Introduction
Ultra-high performance concrete (UHPC) is an increasingly utilized material that provides high compressive strengths and advanced durability properties. Typically including fiber reinforcement, UHPC provides significantly increased post-cracking strength and ductility, allowing for the reduction or elimination of conventional mild steel reinforcement in structural members. The advantages to structural design, offered by the advanced mechanical and durability properties of UHPC, include the potential for longer lifespans and corresponding reductions in lifecycle economic impacts. Additionally, UHPC allows for smaller, lighter structural members that require less structural detailing, and facilitate more rapid construction and reduced service-life maintenance (Ahlborn et al., 2011).
Proprietary UHPC mixture proportions are currently available in the United States of America (USA), however, the lack of standardized domestic design specifications and high material costs have limited the widespread use of UHPC. The USA Federal Highway Administration (FHWA) has fostered research to provide a greater understanding of UHPC material properties and promote the use of this advanced structural material (Graybeal, 2008). Research has been focused primarily on commercially available products, although, the use of non-proprietary mixture proportions in structural applications is being investigated in different states of the USA.
Non-proprietary UHPC mixture proportions utilizing unique mixing procedures, curing regimens, and materials typical of precast production and primarily local to New Mexico (NM) have been developed. The resulting material possesses the superior mechanical and durability properties characteristic of UHPC (Muro-Villanueva et al., 2012; Weldon et al., 2012). More recent research has focused on the experimental testing of full-scale structural components and implementation of the non-proprietary UHPC in a local precast-prestressed bridge (Taylor et al., 2013; Giesler et al., 2016; Manning et al., 2016; Giesler et al., 2018; Visage et al., 2019). Based on the results of an extensive research program, the design and construction of the first non-proprietary UHPC bridge in New Mexico were successfully completed in 2017. The bridge is a two-span structure and is fabricated with non-proprietary UHPC (145 MPa) girders for span 1, and conventional high performance concrete (HPC, 65.5 MPa) girders, typical of bridge construction in New Mexico, for span 2. The design and behavior of this non-proprietary UHPC are being validated through short-term and long-term strain monitoring of the bridge. This study reports on the first load tests conducted on the bridge following construction.
To evaluate the behavior of the two-span bridge, the superstructure was equipped with external strain gauges and load tested. In early 2017, a diagnostic load test under a slow moving truck load was completed and ~9 months later a diagnostic test under incremental, static truck loads was conducted on the bridge in 2018. The diagnostic test using a slow moving load, referred to as stage 1 loading, consisted of one truck moving at ~8 km/h across the bridge along six load paths. Each path was designed to maximize the response of a single girder and was used to gain an initial understanding of the bridge response and provided guidance for the tests under multiple truck loads. The diagnostic test using incremental static loads, referred to as stage 2 loading, involved the application of the maximum feasible load using up to four trucks statically along several load paths to maximize the response of the bridge. This paper presents the results of the stage 1 and stage 2 load tests conducted on the bridge and compares the responses between the UHPC and HPC spans. Additionally, the measured response of the bridge is compared to the design-based estimated behavior.
Background
UHPC is an advanced construction material that provides new opportunities for the future of highway infrastructure. This class of concrete has enhanced properties that address specific problems for highway bridge infrastructure, such as increased service life through improved durability and tensile ductility. Initial material development and structural testing of UHPC began more than two decades ago. The first UHPC traffic bridge was constructed in 2001 in the France's Drome region (Hajar et al., 2004). The first field deployment of UHPC in the USA was the construction of a prestressed concrete girder bridge in Wapello County, Iowa in 2006 (Graybeal, 2008). Since being introduced, more than 100 bridges (motorway and pedestrian) have incorporated UHPC in one or more components including shear keys, overlays, and joint connections (Graybeal, 2010; Brühwiler and Denarié, 2013; Voo et al., 2014; Yuan and Graybeal, 2016).
Proprietary UHPC has been implemented in different applications throughout the world. However, the high cost of the materials, a lack of design code provisions, and low industry familiarization with the material have limited its use, particularly in the USA. With the intention of improving the economic impact and increase sustainability, Weldon et al. (2012) developed and tested non-proprietary UHPC using materials local to New Mexico that has mechanical and durability properties similar to commercially available products. Furthermore, the use of familiar material constituents makes implementation into precast plants, ready-mix applications, and construction practices simpler.
Development of Local UHPC
Mixture Proportions
Allena (2010) investigated the use of material constituents local to New Mexico for the development of UHPC. Mixture proportions included fine aggregate, Type I/II Portland cement, silica fume, high-range water-reducing admixture (HRWRA), and a dosage of steel fibers. To increase sustainability and reduce cost, Lyell (2011) replaced a portion of silica fume with Class F fly ash. Final optimization was conducted by Weldon et al. (2012) by increasing the size and quantity of the aggregates. The final mixture proportions used a fine aggregate with a 4.76 mm nominal top size. Greater economy was achieved by reducing labor costs associated with tedious sieving of fine aggregates without negative effects on the mechanical properties of the UHPC. High strength steel fibers were provided at 1.5% by volume. The UHPC had a design compressive strength of 146 MPa.
Laboratory Testing
Investigation of the flexural behavior of locally developed non-proprietary UHPC began with a parametric study in which small-scale specimens were tested in flexure (Manglekar et al., 2016; Visage et al., 2019). The results showed favorable potential for UHPC made with local materials and research moved to the implementation of UHPC in precast/prestressed applications. Flexural testing of large-scale prestressed beams by Giesler et al. (2016, 2018) was conducted to further verify the flexural behavior of non-proprietary UHPC and continue the development of structural design models. The scope of the research included modifications to the curing regimen and trial batching for implementing UHPC into precast plant production. Three prestressed concrete beam specimens were designed according to AASHTO (2012) for flexure with modifications made for the improved material properties of UHPC including changes to the modulus of elasticity, compressive strength, and tensile strength. Flexural testing validated the designs. Manning et al. (2016) designed two full-scale prestressed girders; one using conventional HPC typical of current New Mexico bridge design, and the second designed using the locally developed UHPC. Both sections were designed to provide equal capacities and thus, flexural investigations of the sections provided a direct comparison of the behavior and performance of the two types of concrete. The UHPC girder, with a reduced cross-section and reduced shear reinforcement, provided the same capacity, equal stiffness, and improved post-cracking behavior compared to the HPC girder.
Field Testing
Load testing is a proven field method to evaluate the structural capacity, construction quality, and effectiveness of new materials used for bridge construction. The American Association of State Highway and Transportation Officials (AASHTO) recommends load testing to evaluate the in-situ bridge response and behavior under loading (AASHTO, 2000). The goal of a load test is to evaluate a bridge's structural response without causing damage to the structure. The measured response can then be compared to theoretical behavior to improve design methods and procedures. Furthermore, load tests can provide information necessary to guide inspections, improve asset management, and identify best repair practices. Load testing is also an effective method for determining load ratings for bridges without plans (Aguilar et al., 2015, 2018; Cuaron et al., 2017). Diagnostic load testing provides an initial measure of the load effects (i.e., moment, shear, deflection, load distribution) in the structure due to applied loads (Phares et al., 2005) and provides a means to identify critical components or load paths for further investigation. Proof load testing determines the magnitude and configuration of loads that cause structural components to approach their elastic limit (Cai et al., 2012), and typically the loads are applied statically using blocks, sandbags, etc. (Lantsoght et al., 2017). In some cases, the proof load test targets critical components rather than testing the full bridge.
Load testing has been used to evaluate and rate bridge response, investigate fatigue life (Alampalli and Lund, 2006) and to evaluate new construction materials and technologies (Hou and Lynch, 2006; Kleinhans et al., 2007). Load testing was used to load rate a bridge in New York, USA that replaced the bridge deck with a fiber reinforced polymer (FRP) deck, that was 80% lower in weight compared to the original concrete deck (Alampalli and Kunin, 2003). Load testing was also used to evaluate the capacity and performance of a bridge strengthened with FRP laminates. Load tests were conducted before and after the installation of the laminates to assess the effectiveness of the strengthening FRP system (Hag-Elsafi et al., 2004). Similarly, in New Mexico a bridge was retrofitted with carbon fiber-reinforced polymer (CFRP) laminates. Load tests were performed before and after retrofitting the bridge and again 9 years after the installation of the laminates to evaluate the immediate and long-term effectiveness of the CFRP retrofit of the bridge (Regalado et al., 2017). The load tests used in this research were used to validate the use of the non-proprietary UHPC using local materials in bridge design.
Description of Bridge 9706
It should be noted that research conducted by Manning et al. (2016) helped to further improve methods of precast production of UHPC prestressed bridge girders in New Mexico and the analyses of specimens cast from UHPC. The research findings of Manning et al. (2016) and Giesler et al. (2016, 2018) were instrumental in the development and design of the first bridge incorporating locally developed UHPC in New Mexico, Bridge 9706.
Bridge 9706 replaced a structurally deficient bridge in Anthony, New Mexico, USA. The bridge has an 18° skew and is comprised of two 7.62 m spans with a rail-to-rail width of 9.14 m (9.75 m out-to-out). The bridge supports two design lanes. The girders in the East span of the bridge were designed with UHPC and the girders in the West span were designed using HPC typically used for prestressed concrete in New Mexico. The UHPC channel girders are 317.5 mm in depth and the HPC channel girders are 381 mm in depth. The resulting span-to-depth ratios are 24:1 for the UHPC span and 20:1 for the HPC span. A stepped abutment was used to accommodate the different depths of the girders. The channel girders are placed directly next to one another and transversely fastened with a threaded rod through the stems at midspan. Embedded 305 mm long steel bearing seats rest on elastomeric bearing pads at the abutments and middle pier. Additionally, there is a 127 mm composite normal strength concrete (NSC) deck (see Figure 2A) and New Mexico Department of Transportation (NMDOT) metal-thrie bridge railings are attached to the edge girders. Overall, the bridge has a length of 15.24 m and carries NM-186 over an irrigation canal. A photo of the Bridge 9706 during construction, completion, and the bridge profile and interior and edge girder cross-sections are shown in Figures 1, 2, respectively. The girders were designed with twelve straight Grade 270, seven wire low relaxation prestressed strands with a diameter of 15.2 mm (area = 140 mm2 per strand). Each strand had a designed pre-stress force of 260.6 kN, for a total force of 3,128 kN per girder. The width of the exterior stem of the edge girder was increased to accommodate the bridge rail connection (see Figures 2D,E).
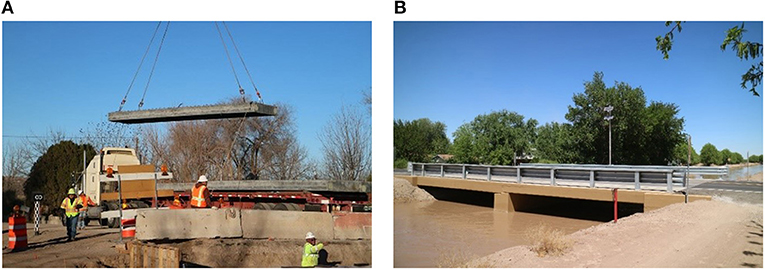
Figure 1. Bridge 9706 (A) during construction, (B) at completion.
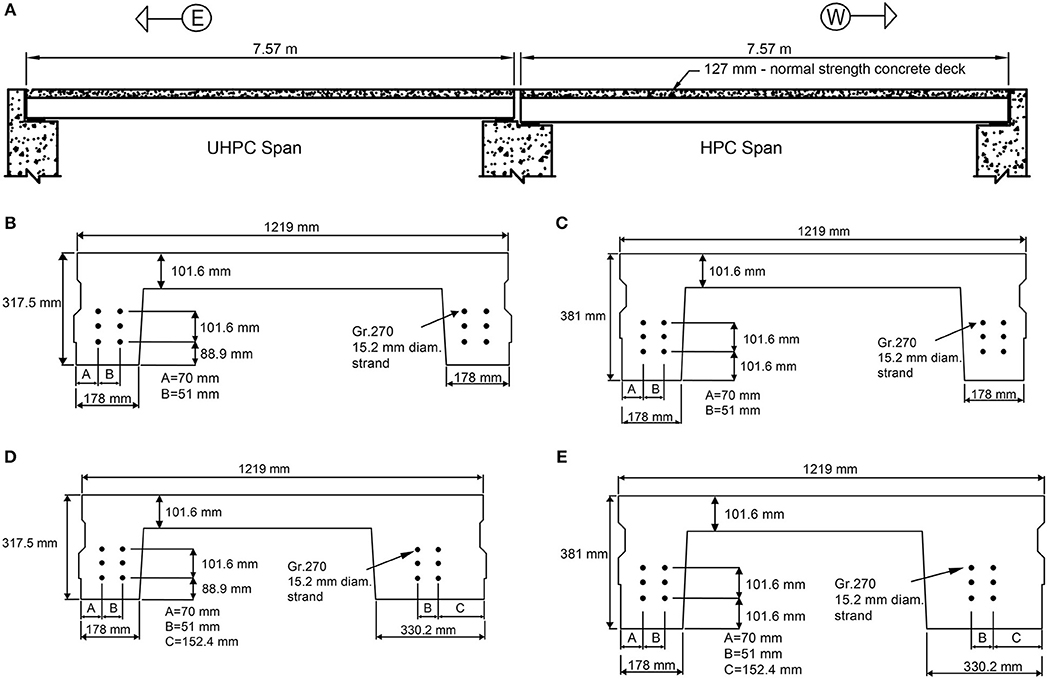
Figure 2. Bridge 9706 (A) profile, (B) UHPC interior girder, (C) HPC interior girder, (D) UHPC edge girder, and (E) HPC edge girder.
Instrumentation
Bridge 9706 was instrumented with 36 external strain transducers placed at midspan of both spans. For each span, 12 strain transducers were attached to the bottom of the stem and six were attached at mid-height of the stem. The instrumentation layout was the same for the stage 1 and stage 2 load tests. The girder and stem gauges are numbered from North to South and labeled using the notation: N/S—North stem/South stem, B/M—gauge location on bottom or at mid-height of the stem, and G#—girder number. The placement of strain gauges on each span is shown on the bridge cross-section in Figure 3.
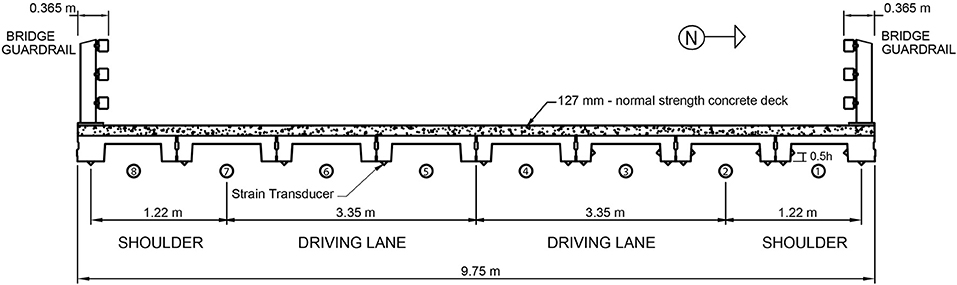
Figure 3. Instrumentation locations at bridge midspan.
Preparatory Calculations
Available Moments and Strains
The available strain capacities of the bridge girders were computed and used to monitor the measured strains during the load tests to prevent damage to the bridge. To obtain the available strains, the girder cracking moment was first calculated. The dead load moment was then subtracted to determine the available moment capacity the beam can resist before cracking. The available moment was divided by the product of the section modulus and the design modulus of elasticity to obtain the available strain. The available moment and strain equations are given in Equations (1) and (2).
where fcr is the modulus of rupture, Pe is the effective prestress determined from the AASHTO Load and Resistance Factor Design (LRFD) Specifications, Anc is the area of the non-composite section, and enc is the distance between the centroid of the non-composite section to the centroid of the strands. Sc, Snc, Mdc, and Mdnc are the composite and non-composite section moduli and the composite and non-composite dead load moments, respectively. The available strain capacity for the beam is computed as:
where Edesign is the concrete elastic modulus (either for UHPC or HPC). Equation (3) (Grabeal, 2006) and Equation (4) (ACI Committee, 2011) are used to calculate the modulus of elasticity for the UHPC and HPC, respectively:
where is the compressive strength of UHPC, is the compressive strength of HPC, and wc is the weight of the concrete (2,402 kg/m3). Table 1 summarizes the section properties, calculated moments, and strains for the UHPC and HPC girders, where k is the remaining prestress force percentage after all losses, fpi is the actual effective prestressed stress after all losses, Inc is the moment of inertia for the non-composite section, and the other parameters were previously defined.
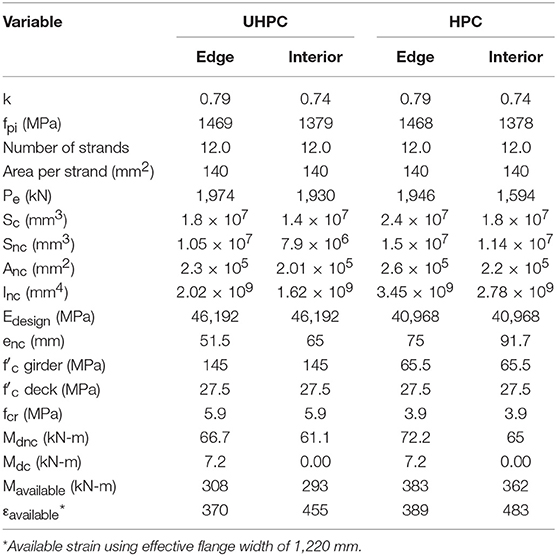
Table 1. UHPC and HPC available moment and strain parameters.
Live Load Distribution Factor
To calculate the bending moments for the girders, the lateral distribution was calculated in accordance with the current design standard. The AASHTO LRFD Bridge Design Specifications were used for Bridge 9706. Table 4.6.2.2.1–1 in Articles 4.6.2.2.2 and 4.6.2.2.3 defines the superstructure types. Bridge 9706 was considered as type (h), precast concrete channel sections with shear keys and a cast-in-place concrete overlay, although the bridge has a composite deck instead of an overlay.
Tables 4.6.2.2.2b–1 and 4.6.2.2.2d–1 provide the live load distribution factors for moment in interior and edge beams, respectively, based on the type (h) equations for interior beams and the lever rule calculation for edge beams.
A summary of the calculated AASHTO live load distribution factors for UHPC and HPC girders are presented in Table 2.
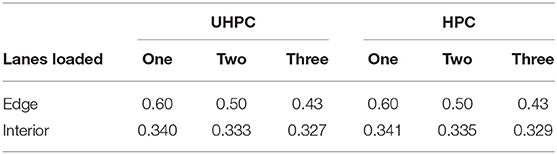
Table 2. AASHTO live load distribution factors for UHPC and HPC.
Expected Strains
For comparison to the available moment and strain capacities calculated from Equations (1) and (2), the total expected midspan moment was first calculated for the test truck applied in the stage 1 load test. The total moment was then multiplied by the design-based distribution factor from AASHTO and the “upper bound” distribution factor that represents the worst-case scenario for live load distribution between the girders (i.e., a distribution factor of one). These two factors provide the range of expected girder moments possible for the stage 1 and stage 2 test loads. The expected strains for UHPC and HPC girders were computed using Equation (5) and strain values are presented in Table 3.
where DFint. and DFedge are the distribution factors for an interior and edge girder, respectively.
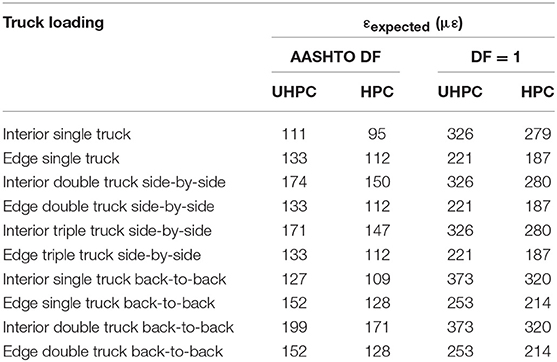
Table 3. Expected strain.
Stage 1 Load Testing
A moving diagnostic load test (stage 1) was first conducted to gain an understanding of the in-situ bridge behavior prior to the load test with larger truck loads (stage 2). The magnitude of the total truck load applied on the bridge during the stage 1 load test was less than the stage 2 target load due to the uncertainties in the bridge response. Load was applied in the stage 1 load test in similar paths used in the stage 2 load test for the single truck paths configurations; however, truck loads and paths were not applied to maximize the loading but to gather information on the behavior, load distribution between adjacent girders, and to compare the initial structural response between the UHPC and HPC spans. Six single truck load paths were conducted as part of the stage 1 load test. A single truck was applied as a slow-moving load along the transverse paths shown in Figure 4.
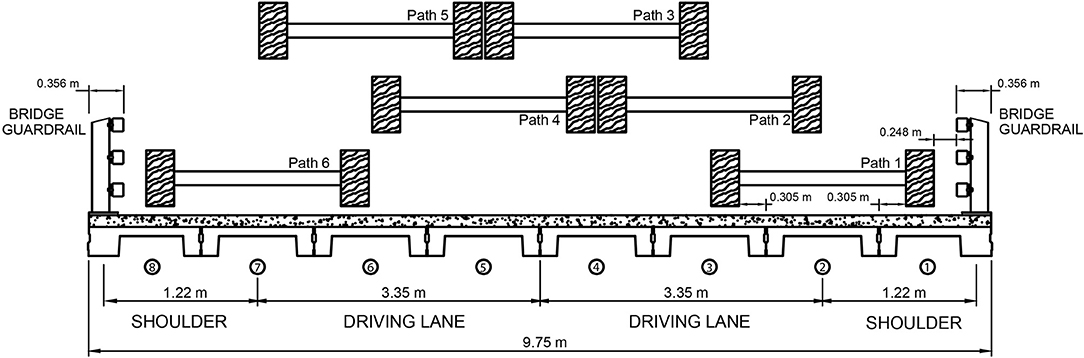
Figure 4. Single truck transverse load paths 1 through 6 (truck centered on girder centerline).
On March 30, 2017, the stage 1 load test was performed on Bridge 9706. Figure 5 shows a photo of a single truck on the bridge. Two load trucks, weighing 275 kN on average, were used during the stage 1 load test. Table 4 shows the axle weights of the trucks used for the stage 1 load test.
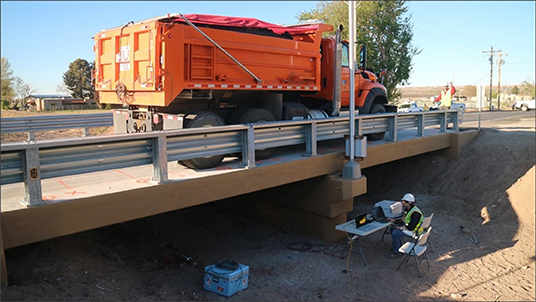
Figure 5. Single truck moving on the bridge.
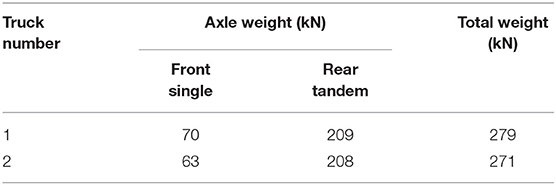
Table 4. Stage 1 load test: truck weights.
Maximum Strain for UHPC and HPC Spans
The maximum strain for each load path and the corresponding strain transducer and location on the UHPC span and HPC span is shown in Table 5. The maximum measured strain for each load path on each span is indicated in bold. The strains measured during the stage 1 load test and bridge behavior are discussed later.
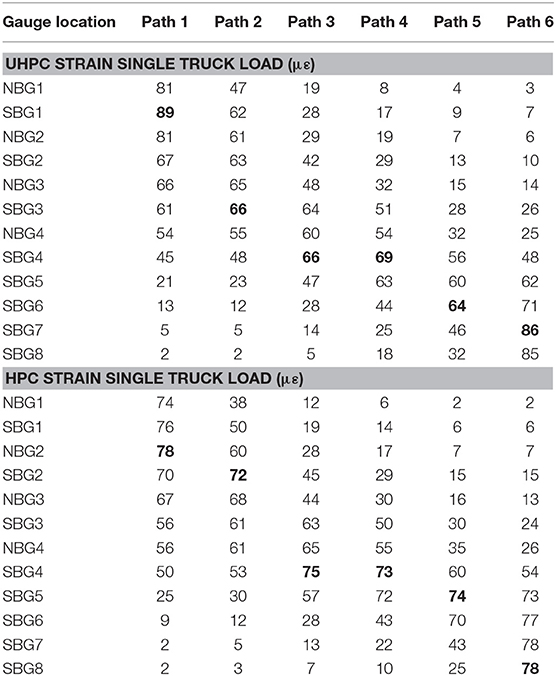
Table 5. Maximum stage 1 load test strains of UHPC and HPC.
Strain Comparison Between UHPC and HPC Spans
Comparing the strains between the UHPC span and the HPC span for the stage 1 load test, the following was observed:
• The largest measured strains in the UHPC span, were 89 and 86 με for paths 1 and 6, respectively (see Table 5). For the HPC span, the largest measured strains were 78 and 78 με during path 1 and path 6, respectively.
• The edge girders for both the UHPC and HPC spans experienced more tensile strains for paths 1 and 6 since the truck wheel loads were positioned over the edge girders. When the truck load was moved toward the interior girders, the tensile strains showed better distribution between adjacent girders, typically resulting in lower strains.
• Strains measured in the UHPC span were higher than strains in the HPC span. The maximum strains for the UHPC span occurred in either girder 1 or 7. The maximum strains for the HPC span occurred in either girder 2 or 7. The HPC girders have a larger cross-sectional area compared to the UHPC girders. Although the UHPC and HPC girders were designed to have the same capacity, UHPC girders measured higher values of strain. Although the modulus of elasticity of the UHPC is greater than that of HPC, the section modulus is smaller. The section and elastic moduli ratio between the UHPC and HPC are 0.7 and 1.2, respectively.
• Figure 6 shows the strain behavior across the bridge width for load paths 1 (North side) and 6 (South side). More strain transducers were placed on girders 1–4, therefore, additional data points are shown for these girders. The results illustrate the symmetric behavior of the bridge as expected for a newly constructed bridge.
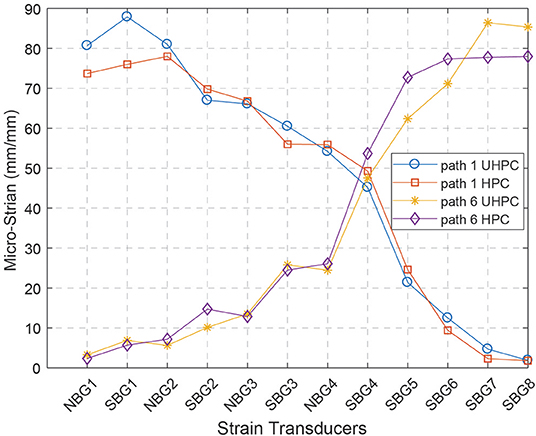
Figure 6. Strain measurement for paths 1 and 6.
Comparison of Measured and Expected Strains
The maximum measured stage 1 load test strains and the expected strains are tabulated in Table 6. The percent difference between the two strain values is also shown. Overall, the measured strains for the UHPC and HPC spans were lower than the predicted behavior, indicating the designed-based load distribution factors to be conservative for the UHPC and HPC bridge girders. The percent difference between the measured and expected strains for the UHPC girders is slightly larger than the HPC girders indicating better load distribution in the UHPC bridge.
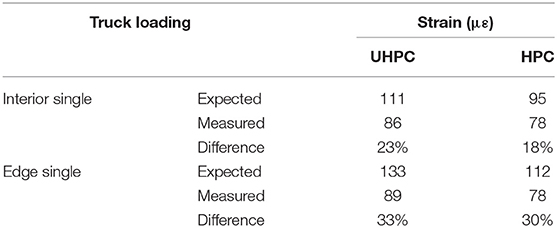
Table 6. Stage 1 load test: expected vs. measured strain.
Stage 2 Load Testing
Based on the results from the stage 1 load test, the bridge showed no signs of cracking nor did it exceed the available strain. The measured strains were 24 and 19% of the available strains for edge and interior UHPC girders, respectively. The measured strains were 20 and 16% of the available strains for interior and edge HPC girders, respectively. Consequently, the stage 2 load test was planned and conducted with the goal of applying the largest load possible to the bridge without exceeding the available moment to investigate the bridge behavior at larger loads. The bridge behavior under the stage 2 truck loading was monitored carefully via strain measurements. For the stage 2 load test, the test vehicles were loaded to the maximum weight and positioned along the paths producing the largest girder strains (critical paths). As the applied loads increased during the stage 2 load test, the measured strains were monitored carefully to ensure they did not exceed the expected or available strains. Single truck, double truck side-by-side, triple truck side-by-side, single truck back-to-back, and double truck back-to-back (i.e., four trucks) loadings were done as part of the stage 2 load test. The loading was applied by moving the trucks incrementally to specified locations along the span. Figures 7A–C, show pictures of the bridge being loaded with the single truck back-to-back, double truck back-to-back, and triple truck side-by-side load paths during the stage 2 load test. Figures 8A,B show the configurations of the double truck side-by-side and triple truck side-by-side paths for the stage 2 load test. Figure 9A shows the bridge profile with the back-to-back truck loadings, which are applied in similar path configurations as illustrated in Figure 4 (single truck back-to-back) and Figure 8A (double truck back-to-back). The back-to-back load path configurations were incrementally loaded, placing the center of the two rear tandem axels at the abutments, quarter-points, mid-points, and pier along the length of the bridge. Figures 9B,C show the top view of the bridge being loaded with single and double truck back-to-back load path configurations, respectively. It is noted that multiple load paths were used, however, only one example path is shown. For the stage 2 load test, dump trucks were maximized in weight and applied in different configurations to maximize the moment along the length of the bridge. The truck configurations included single truck, single truck back-to-back, double truck back-to-back (four trucks), and triple truck side-by-side. The double truck back-to-back and triple truck side-by-side configurations maximized the number of trucks that could be applied based on the dimensions of the bridge and were used to apply the largest load feasible. The truck moments applied to the bridge during the stage 1 and stage 2 load tests were about 15 and 20% higher than the non-factored standard truck live load moment (HL93), respectively.
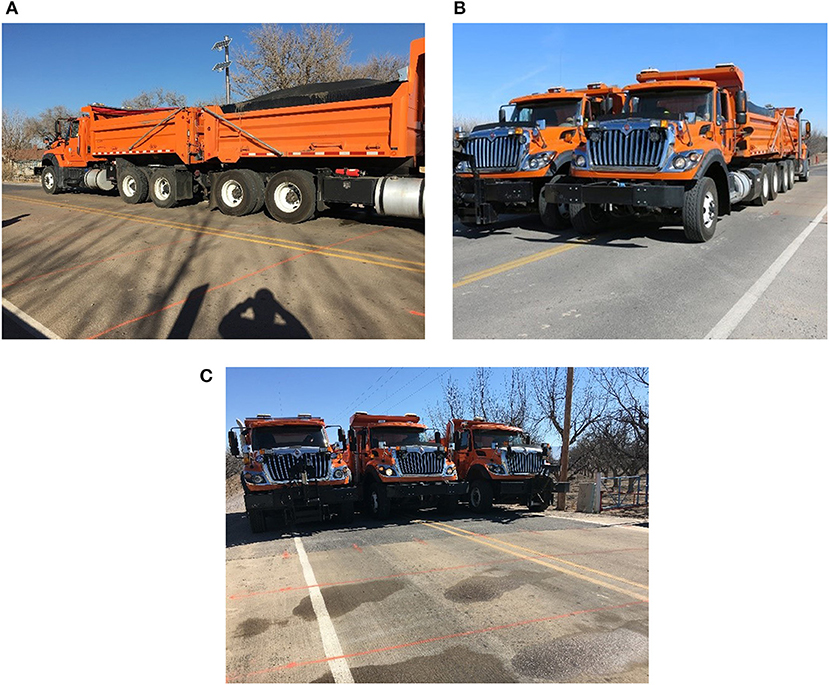
Figure 7. (A) Single truck back-to-back loading, (B) double truck back-to-back loading, (C) triple truck side-by-side loading.
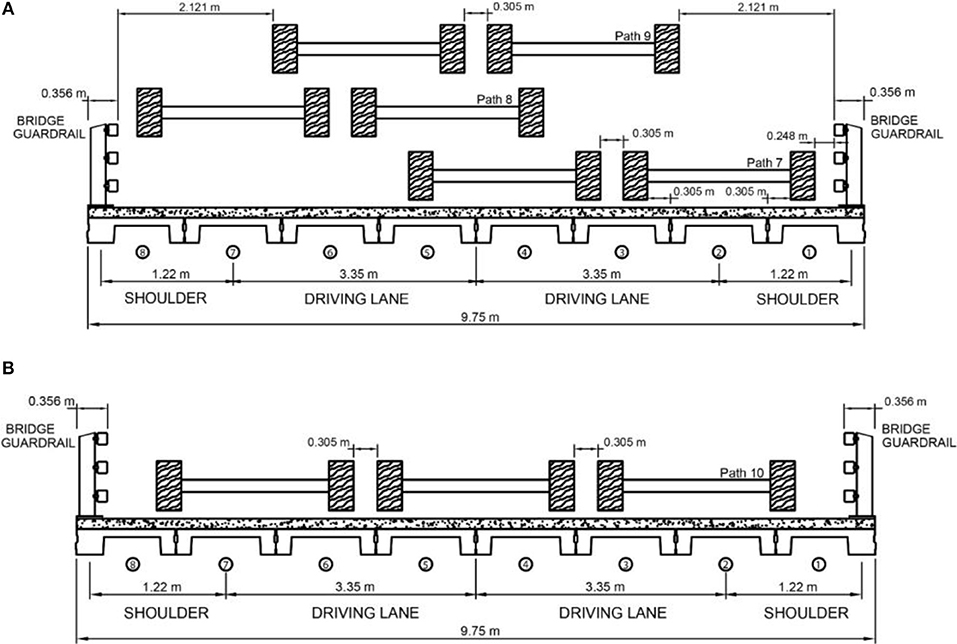
Figure 8. (A) Double truck side-by-side transverse load paths 7, 8, and 9, (B) Triple truck side-by-side transverse load path 10.
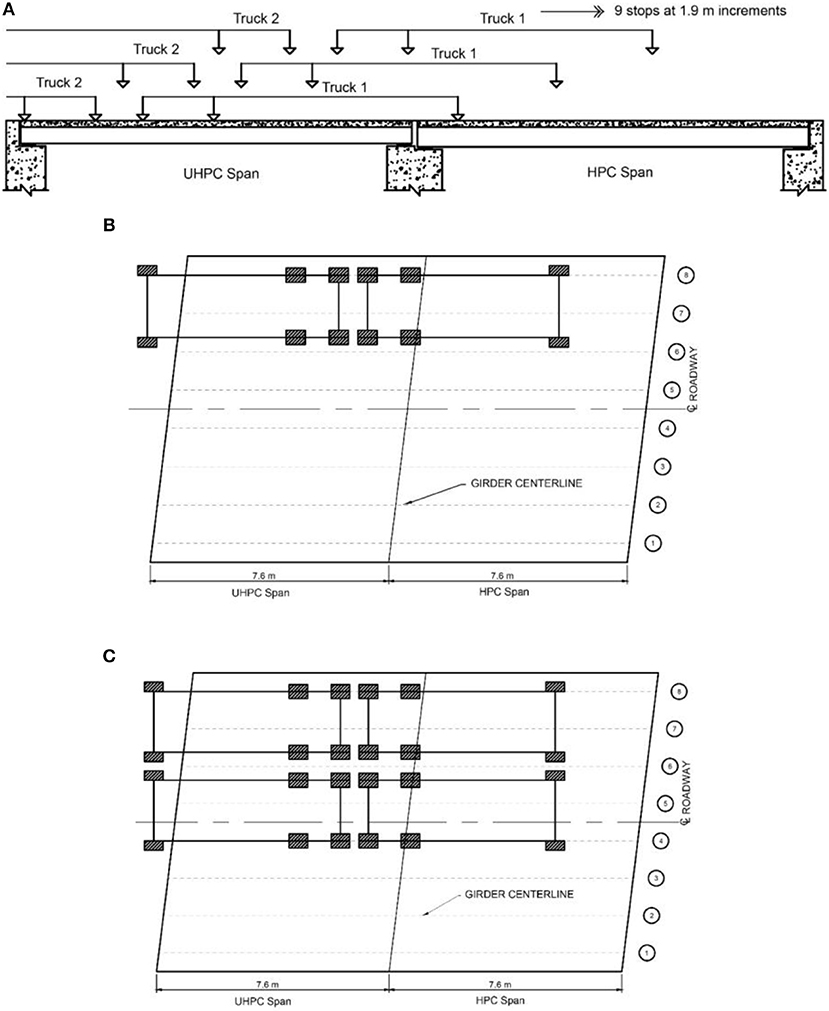
Figure 9. Path configurations (A) bridge profile with trucks, (B) top view of single truck back-to-back path, (C) top view of double truck back-to-back path.
From January 29 through January 31, 2018, the stage 2 load test was performed on Bridge 9706, 9 months after the stage 1 load test. Four load trucks, weighing on average 283 kN, were used for the test. Table 7 shows the axle weights of the trucks used for the stage 2 load test. The stage 2 load test consisted of a preliminary load test in which a few slow-moving and incremental truck load paths were used to calibrate the strain transducers and ensure the behavior of the bridge had no significant changes since the time of the stage 1 load test. Then, the stage 2 load test was conducted loading the trucks onto the bridge following the designed paths to maximize the total load applied to each span.
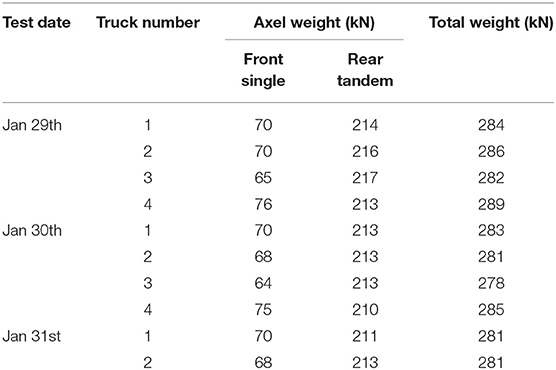
Table 7. Stage 2 load test: truck load weights.
Maximum Strains
Table 8 provides the maximum measured strains for each load path configuration on the UHPC span and HPC span. The maximum measured strain for each load path configuration on each span is indicated in bold. The strains measured during the stage 2 load test and bridge behavior are discussed later.
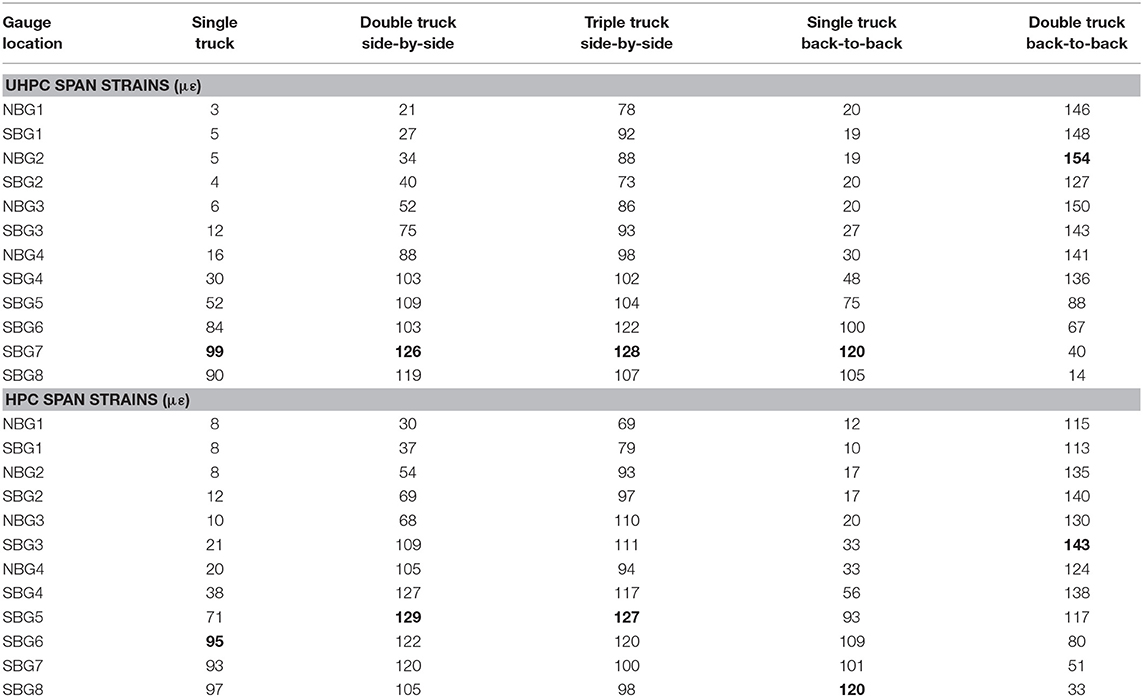
Table 8. Maximum stage 2 load test strains for UHPC and HPC.
Strain Comparisons Between UHPC and HPC Spans
Comparing the strains between the UHPC span and the HPC span for the stage 2 load test, the following was observed:
• For a single truck load, the maximum strain for the UHPC span was 99 με, which was higher than the strain measured for the HPC span, 95 με. Similarly, the strain measured for double truck side-by-side loading for the UHPC span was 126 με and for the HPC span was 129 με.
• For triple truck side-by-side loading, the largest measured strain for the UHPC span was 128 με. For the HPC span, the largest measured strain was 127 με. During this loading, the strains were more evenly distributed across all girders.
• The maximum measured strain for single truck back-to-back loading for the UHPC span was 120 με, and for the HPC span was 120 με.
• For the double truck back-to-back load path, the largest measured strains for the UHPC span was 154 με. For the HPC span, the largest measured strain was 143 με.
• The maximum strains usually occurred in the UHPC and HPC interior girders. Results show that as the bridge becomes more uniformly loaded, measured strains between the HPC and UHPC spans are more similar.
Comparison of Measured and Expected Strain
The maximum measured stage 2 load test strains and the expected strains are presented in Table 9. The percent difference between the two strains is also shown. Overall, the measured strains for the UHPC and HPC spans were lower than the predicted behavior, indicating that the designed-based load distribution factors are conservative for both the UHPC and HPC bridge girders. Again, in general, the UHPC predicted strains are greater in comparison to the measured strains than those for the HPC span. This indicates better load distributions for the UHPC span compared to HPC span.
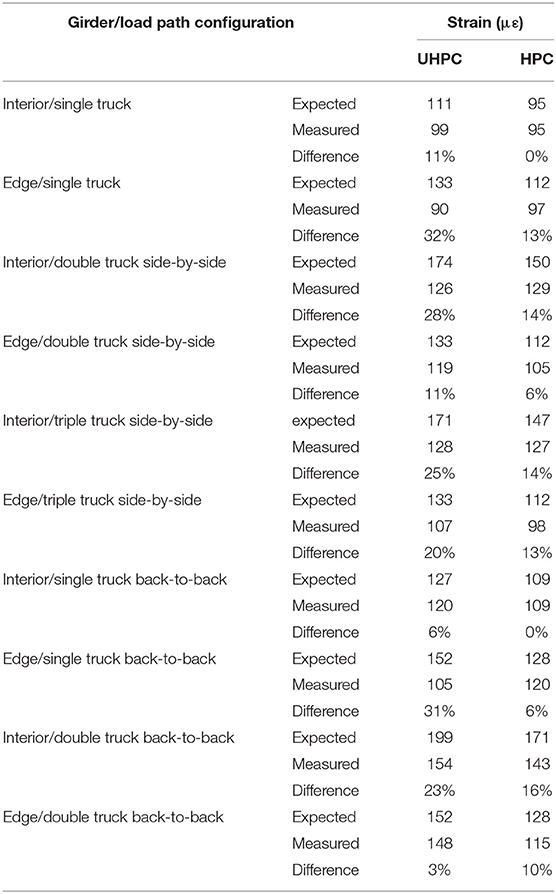
Table 9. Stage 2 load test: expected vs. measured strain.
Conclusions
The stage 1 load test of Bridge 9706 was comprised of six single truck load paths (slow-moving). The stage 2 load test was conducted ~9 months after the stage 1 load test, focusing on the behavior of the new concrete material, to provide a baseline for the bridge behavior, and compare the behaviors of the two different spans. The stage 2 load test was comprised of incremental single truck, double truck side-by-side, triple truck side-by-side, and both single and double truck back-to-back load paths. Overall, the maximum measured strains for UHPC and HPC for both the stage 1 load test and stage 2 load test were similar. A few observations and conclusions from the load tests can be made:
• The stage 1 and stage 2 load test results showed that the UHPC span experienced larger strains than the HPC span when loaded with a single truck. The combined effect of a smaller section modulus and an increased modulus of elasticity results in slightly larger expected strains in the UHPC span.
• The stiffness (EI) of the UHPC girders was calculated to be 34% smaller than HPC for both edge and interior beams. However, the measured strains were similar between the two materials. This also may indicate that the estimated E may be overly conservative for the UHPC.
• During the stage 1 and stage 2 load tests, the maximum measured strains for the UHPC and HPC spans did not exceed the expected strains. It is noted that the expected strains presented in this paper are based on the actual truck weights and positioned as measured during the tests. Prior to testing, the expected strains were based on estimated loads and the designed load paths (which were also not exceeded).
• As more trucks were added during the stage 2 load test, more girders were engaged demonstrating better load distribution across the bridge. The distribution was achieved through the composite deck and shear keys between girders.
• To ensure that no damage was done to the bridge during the load tests, the measured and expected strains were shown to not exceed the available strains that were calculated based on the AASHTO specifications for both tests. The maximum percentage of the available strains exhausted for the UHPC span was 40 and 34% for edge and interior girders, respectively. The maximum percentage of available strains exhausted for the HPC span was 31 and 30% for edge and interior girders, respectively.
• The UHPC span experienced better live load distribution compared to the HPC span, validating the expected behavior based on the distribution factor presented in Table 2.
• The use of load testing provides measured data to understand the behavior of the different concrete materials used in the bridge. Furthermore, the data can be compared to verify design procedures that incorporated the material properties of UHPC design and provide additional information for the introduction of UHPC into design codes. Based on the results from these load tests, non-proprietary UHPC can be effectively used in bridge construction with the following advantages: less material, equal or higher capacity with smaller girder cross-section, and more economical compared to proprietary products. The results also demonstrated that the introduction of UHPC into precast production was successful and the construction quality of the bridge was good.
• The information collected from load tests provides essential information for the long-term performance study of the use of UHPC. Over the design-life of the bridge, the two spans can be observed to compare the difference in performance, particularly focusing on the durability and maintenance required. Additionally, future load tests can be utilized to monitor the long-term behavior of this new concrete material by comparing changes in behavior to the baseline data. As changes are observed, the data collected can also be used to guide inspections and denote key areas that require more detailed inspections.
Data Availability Statement
The data models, or code generated or used during the study are available from the corresponding author by request and upon approval from the New Mexico Department of Transportation.
Author Contributions
All authors have contributed to the testing, data analysis, and writing of this paper.
Funding
This project was partially funded by NMDOT PROJECT NO. NM09MSC-01.
Conflict of Interest
The authors declare that the research was conducted in the absence of any commercial or financial relationships that could be construed as a potential conflict of interest.
Acknowledgments
This research was funded in part by the New Mexico Department of Transportation (NMDOT), Project No. NM09MSC-01, Project Manager Virgil Valdez. Special thanks to the NMDOT District 1 personnel: Earl Franks and Benito Trevino and to the NMDOT load truck drivers that assisted with the load tests: Ernest Lascaun, J. D Moronez, Chris Maribal, Andrew McLaughlin, Charles Blanton, and Kenny McCoy. Additionally, the authors would like to acknowledge the support of the Saudi Arabia Ministry of Higher Education for providing student support. Any and all opinions, findings, conclusions, and/or recommendations expressed herein are those of the authors and do not necessarily reflect the views of the individuals or organizations listed above.
References
AASHTO (2000). Manual for Condition Evaluation of Bridges, 1994. Washington, DC: American Association of State Highway & Transportation Officials.
AASHTO (2012). American Association of State and Highway Transportation Officials (AASHTO) Load Resistance Factor Design (LRFD) Bridge Design Specifications. Washington, DC: American Association of State and Highway Transportation Officials.
ACI Committee (2011). Building Code Requirements for Structural Concrete (ACI 318-11) and Commentary. Farmington Hills, MI: American Concrete Institute.
Aguilar, C. V., Jáuregui, D. V., Newtson, C. M., Weldon, B. D., and Cortez, T. M. (2015). Load rating a prestressed concrete double T-beam bridge without plans by field testing. Transp. Res. Record J. Transp. Res. Board 2522, 90–99. doi: 10.3141/2522-09
Aguilar, C. V., Jáuregui, D. V., Weldon, B. D., and Newtson, C. M. (2018). Rating of Prestressed Concrete Adjacent Beam Bridges Without Plans. Farmington Hills, MI: Special Publication, 323, 5–1.
Ahlborn, T. M., Harris, D. K., Misson, D. L., and Peuse, E. J. (2011). “Strength and durability characterization of ultra-high performance concrete under variable curing conditions,” in Presented at 90th Annual Meeting of the Transportation Research Board (Washington, DC).
Alampalli, S., and Kunin, J. (2003). Load testing of an FRP bridge deck on a truss bridge. Appl. Compos. Mater. 10, 85–102. doi: 10.1023/A:1022885728627
Alampalli, S., and Lund, R. (2006). Estimating fatigue life of bridge components using measured strains. J. Bridge Eng. 11, 725–736. doi: 10.1061/(ASCE)1084-0702(2006)11:6(725)
Allena, S. (2010). Ultra high strength concrete using local materials (Ph.D. dissertation), New Mexico State University, Las Cruces, NM, United States.
Brühwiler, E., and Denarié, E. (2013). Rehabilitation and strengthening of concrete structures using ultra-high performance fibre reinforced concrete. Struct. Eng. Int. 23, 450–457. doi: 10.2749/101686613X13627347100437
Cai, H., Abudayyeh, O., Abdel-Qader, I., Attanayake, U., Barbera, J., and Almaita, E. (2012). Bridge deck load testing using sensors and optical survey equipment. Adv. Civil Eng. 2012:493983. doi: 10.1155/2012/493983
Cuaron, A. M., Jáuregui, D. V., and Weldon, B. D. (2017). “Invited Student Paper- A Procedure for Load Rating Reinforced Concrete Slab Bridges without Plans (No. 17–01754), in Transportation Board 96th Annual Meeting (Washington, DC).
Giesler, A. J., Applegate, S., and Weldon, B. (2016). Implementing, nonproprietary, ultra-high performance concrete in a precasting plant. PCI J. 61, 68–80.
Giesler, A. J., McGinnis, M. J., and Weldon, B. D. (2018). Flexural behavior and analysis of prestressed ultra-high-performance concrete beams made from locally available materials. PCI J. 63, 66–80.
Grabeal, B. A. (2006). Material Property Characterization of Ultra High Performance Concrete. FHWA-HRT-06-103, Turner-Fairbank Highway Research Center, McLean, VA.
Graybeal, B. A. (2008). “UHPC in the US highway transportation system,” in Proceedings of the Second International Symposium on Ultra High Performance Concrete (Kassel), 11–17.
Graybeal, B. A. (2010). Behavior of Field-Cast Ultra-High Performance Concrete Bridge Deck Connections Under Cyclic and Static Structural Loading (No. FHWA-HRT-11-023). McLean, VA: Federal Highway Administration.
Hag-Elsafi, O., Alampalli, S., and Kunin, J. (2004). In-service evaluation of a reinforced concrete T- beam bridge FRP strengthening system. Compos. Struct. 64, 179–188. doi: 10.1016/j.compstruct.2003.08.002
Hajar, Z., Lecointre, D., Simon, A., and Petitjean, J. (2004). “Design and construction of the world first ultra-high performance concrete road bridges,” in Proceedings of the International Symposium on UHPC (Kassel), 39–48.
Hou, T. C., and Lynch, J. P. (2006). “Rapid-to-deploy wireless monitoring systems for static and dynamic load testing of bridges: validation on the grove street bridge,” in Nonintrusive Inspection, Structures Monitoring, and Smart Systems for Homeland Security, Vol. 6178, eds A. A. Diaz, H. F. Wu, S. R. Doctor, and Y. Bar-Cohen (San Diego, CA: International Society for Optics and Photonics), 61780D.
Kleinhans, D. D., Myers, J. J., and Nanni, A. (2007). Assessment of load transfer and load distribution in bridges utilizing FRP panels. J. Compos. Constr. 11, 545–552. doi: 10.1061/(ASCE)1090-0268(2007)11:5(545)
Lantsoght, E. O., van der Veen, C., de Boer, A., and Hordijk, D. A. (2017). State-of-the-art on load testing of concrete bridges. Eng. Struct. 150, 231–241. doi: 10.1016/j.engstruct.2017.07.050
Lyell, E. K. (2011). Optimization of Ultra High Performance Concrete Mixture Proportions Using Locally Available Materials. MS thesis, New Mexico State University, Las Cruces, NM.
Manglekar, H. C., Visage, E. T., Ray, T., and Weldon, B. D. (2016). Experimental and analytical investigations of a locally developed ultrahigh-performance fiber-reinforced concrete. J. Mater. Civil Eng. 29:04016202. doi: 10.1061/(ASCE)MT.1943-5533.0001732
Manning, M. P., Weldon, B. D., McGinnis, M. J., Jáuregui, D. V., and Newtson, C. M. (2016). Behavior comparison of prestressed channel girders from high-performance and ultrahigh-performance concrete. Transp. Res. Record J. Transp. Res. Board 2577, 60–68. doi: 10.3141/2577-08
Muro-Villanueva, J., Newtson, C. M., Allena, S., Weldon, B. D., and Jauregui, D. V. (2012). “Freezing and thawing durability of ultra high strength concrete,” in International Congress on Durability of Concrete (Trondheim).
Phares, B. M., Wipf, T. J., Greimann, L. F., and Lee, Y. (2005). Health Monitoring of Bridge Structures and Components Using Smart Structure Technology, Vol. 2. Washington DC: Wisconsin Highway Research Program.
Regalado, A., Carpenter, B. A., Jáuregui, D. V., and Weldon, B. D. (2017). Performance evaluation of a reinforced concrete slab bridge retrofitted with carbon fiber reinforcement polymer laminate system. Transp. Res. Record J. Transp. Res. Board 2642, 68–76. doi: 10.3141/2642-09
Taylor, C. W., Weldon, B. D., Jáuregui, D. V., and Newtson, C. M. (2013). Case studies using ultrahigh-performance concrete for prestressed girder bridge design. Pract. Period. Struct. Design Constr, 18, 261–267. doi: 10.1061/(ASCE)SC.1943-5576.0000167
Visage, E. T., Weldon, B. D., Jauregui, D. V., and Newtson, C. M. (2019). Flexural performance of ultrahigh-performance concrete developed using local materials. J. Mater. Civil Eng. 31:04019050. doi: 10.1061/(ASCE)MT.1943-5533.0002683
Voo, Y. L., Foster, S. J., and Voo, C. C. (2014). Ultrahigh-performance concrete segmental bridge technology: toward sustainable bridge construction. J. Bridge Eng. 20:B5014001. doi: 10.1061/(ASCE)BE.1943-5592.0000704
Weldon, B., Jauregui, D., Newtson, C., Montoya, K., Taylor, C., Allena, S., et al. (2012). Feasibility Analysis of Ultra High Performance Concrete for Prestressed Concrete Bridge Applications – Phase II. NMDOT Report No. NM09MSC-01, New Mexico State University, Las Cruces, NM.
Keywords: diagnostic load test, ultra-high performance concrete, high performance concrete, strain measurement, load distribution
Citation: Alahmari TS, Kennedy CS, Cuaron AM, Weldon BD and Jáuregui DV (2019) Field Testing of a Prestressed Concrete Bridge With High Performance and Locally Developed Ultra-High Performance Concrete Girders. Front. Built Environ. 5:114. doi: 10.3389/fbuil.2019.00114
Received: 16 February 2019; Accepted: 19 September 2019;
Published: 04 October 2019.
Edited by:
Joan Ramon Casas, Universitat Politecnica de Catalunya, SpainReviewed by:
Devin K. Harris, University of Virginia, United StatesFernando Rebouças Stucchi, University of São Paulo, Brazil
Copyright © 2019 Alahmari, Kennedy, Cuaron, Weldon and Jáuregui. This is an open-access article distributed under the terms of the Creative Commons Attribution License (CC BY). The use, distribution or reproduction in other forums is permitted, provided the original author(s) and the copyright owner(s) are credited and that the original publication in this journal is cited, in accordance with accepted academic practice. No use, distribution or reproduction is permitted which does not comply with these terms.
*Correspondence: Turki S. Alahmari, dHVya2k5MDlAbm1zdS5lZHU=