 Marco Terrenzi
 Enrico Spacone
- Department of Engineering and Geology, University G. D'Annunzio of Chieti-Pescara, Pescara, Italy
The prediction of the seismic response of structures requires accurate models for describing the behavior of each structural element. In frame analysis, non-linearities are typically modeled through either lumped or distributed plasticity elements. Another important assumption is needed for the selection of the appropriate section model. Phenomenological laws for the section behavior are computationally faster but less accurate than fiber-section models. This study compares the predictions obtained for reinforced concrete sections and simple single columns with a phenomenological section law (combined with a lumped plasticity element) and with a fiber-section model (combined with a distributed plasticity element). The phenomenological section model is that proposed by Ibarra et al. (2005) with the predictive equations used by Haselton et al. (2008). The fiber section distributed element is that by Spacone et al. (1996a,b). Comparisons show some important differences in the section responses (particularly for high levels of axial load) and in predicting the responses of experimentally tested columns.
1. Introduction
The non-linear behavior of frame elements is typically modeled through either distributed or lumped plasticity elements (Deierlein et al., 2010). More importantly, it is the section model that strongly influences the prediction capabilities of frame elements. Section models are typically based on either "mechanical" or “phenomenological” laws. Mechanical models account for the actual non-linear mechanisms that take place in a reinforced concrete section (bending, axial, shear, etc.). The fiber-section model is the best known and most widely used section mechanical model. It discretizes the beam or column cross sections into fibers (Spacone et al., 1996a,b). It is combined with either a concentrated or a distributed plasticity frame element formulation. In the phenomenological section model, the section non-linearities are described by non-linear Moment-Curvature or Moment-Rotation laws. In this approach, the axial-moment interaction (P-My-Mz) is difficult to capture, unless additional simplified assumptions are made. On the other hand, P-My-Mz interaction is naturally accounted for in fiber section models. On the other hand, the fiber-section model accuracy depends entirely on the definition of the (concrete, steel, etc.) constitutive laws. In many cases, these laws do not account for cyclic degradations and buckling of the rebars. When the phenomenological model is calibrated from experimental data, it can account for these phenomena. This paper compares the numerical predictions of the responses obtained with the two section approaches for reinforced concrete sections with different levels of axial load and for the set of experimentally tested columns already analyzed by Haselton et al. (2008).
2. Fiber Section and Phenomenological Section Models
The fiber section model automatically accounts for the P-My-Mz interaction. In order to account for the axial-bending-shear interaction, more advanced 2D or 3D concrete constitutive laws are necessary, and the resulting formulation and implementation may become quite involved (Petrangeli et al., 1999). Alternatively, interaction with shear can be introduced through equilibrium following the approach proposed by Marini and Spacone (2006) and made available in Opensees McKenna et al. (2000) with the “SectionAggregator” command. The non-linear behavior of the fiber section depends entirely on the non-linear constitutive laws used for steel and concrete. In this study, the concrete is modeled using the Kent and Park (1971) law (Concrete01 in OpenSees) for both confined and unconfined concrete, and steel is modeled with the Menegotto and Pinto (1973) law using bilinear laws (Steel01 in OpenSees). Cyclic degradation and bar buckling are some of the non-linear effects that are not included in the above two laws.
The phenomenological section law used in this work is based on the work by Ibarra et al. (2005) in Figure 1. Ibarra's model is implemented in OpenSees with the “ModIMKPeakOriented Material” uniaxial material (Lignos and Krawinkler, 2012), and it is defined through seven parameters, five for the monotonic envelope and two for the degradation mechanism: elastic stiffness (K), effective yield strength (My), ratio between ultimate and yield strength (α = Mc/My), pre-capping rotation (θcap), post-capping rotation (θpc), and cyclic deterioration parameters (λ,c). The parameters are computed following the predictive equations proposed by Haselton et al. (2008), obtained by statistical regression on experimental results on 255 RC members [Pacific Earthquake Engineering Research Center's Structural Performance Database (PEER 2005) - Berry et al. (2004)].
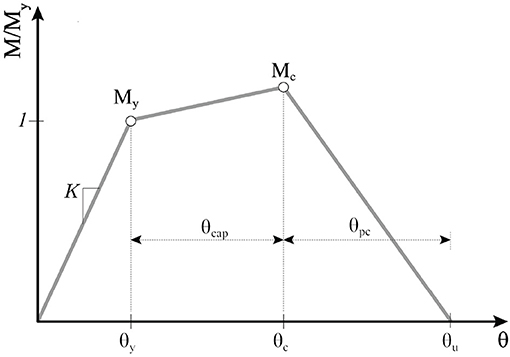
Figure 1. Ibarra et al. (2005) model.
The following equations define the hinge behavior.
where Ec and fc are the concrete elastic modulus and compressive strength, respectively; I0 is the section inertia; LV is the shear span; asl is the bond-slip parameter that varies between 0 and 1; ν is the axial load ratio; and ρsh is the lateral confinement ratio and s/d is the ratio between the stirrup spacing and the column depth. The yield moment (My), according to Haselton et al. (2008), is calculated using the predictive equation proposed by Panagiotakos and Fardis (2001) or by means of the standard stress block approach. Beams and columns are made of two zero-length hinges located at the frame elements' two ends and connected by elastic frame elements. Since the elastic element and the two hinges are in a series, the beam and column stiffnesses are adjusted using the stiffness ratio n = ks/ke, where ks and ke are the section stiffness and the elastic element stiffness, respectively (Appendix B in Ibarra et al., 2005). In this paper, n is assumed equal to 10. This adjustment is required in order to avoid excessive flexibility in frame elements.
The yield moment My is computed following the following equation proposed by Panagiotakos and Fardis (2001), which is derived from fitting with available experimental results:
where Es is the steel elastic modulus; ρ, ρ′, and ρv are the reinforcement ratios of the tension, compression, and web reinforcement, respectively; δ′ = d′/d is the ratio between the cross section effective depth (d) and the distance of the center of the compression reinforcement from the extreme compression fibers (d′); ϕy is the yield curvature; and ky is the compression area depth at yielding (normalized with respect to d). According to Panagiotakos and Fardis (2001), section yielding can occur either by steel yielding or by concrete yielding when the extreme compression concrete fiber strain reaches εc≈1.8fc/Ec. The yield curvature, ϕy, is assumed as the lowest value between the curvature corresponding to either steel or concrete yielding.
3. Prediction of Flexural Yielding and Strength of Reinforced Concrete Column Sections
This section presents a comparison of the prediction of the flexural response of reinforced concrete columns (more specifically yielding and failure moments) as the compression axial load varies from zero (pure flexure) to complete compression failure. The predictions obtained with the fiber section and with the phenomenological models presented in section 2 have been compared. Two identical 300 ×300[mm] square sections were analyzed, one with 4–12 mm diameter bars (ρ = 0.5%) and the other with 8–12 mm diameter bars (ρ = 1.0%). The two reinforcement ratios are commonly found in existing buildings designed according to old design codes. The concrete strength was fc = 20[MPa], the elastic modulus was Ec = 30[GPa], the steel yield stress was fy = 450[MPa], and the steel elastic modulus was Es = 206[GPa]. For the phenomenological law, the approach by Panagiotakos and Fardis (2001) was used for computing the yield moment (see previous section).
Figure 2 shows the yield moment estimated according to Panagiotakos and Fardis, considering an axial load that varied from 0 to the maximum axial load (Nmax = Acfc+As, totfy).The blue and red dashed lines indicate the concrete and steel yield moment and the black line indicates the lower of the two values.
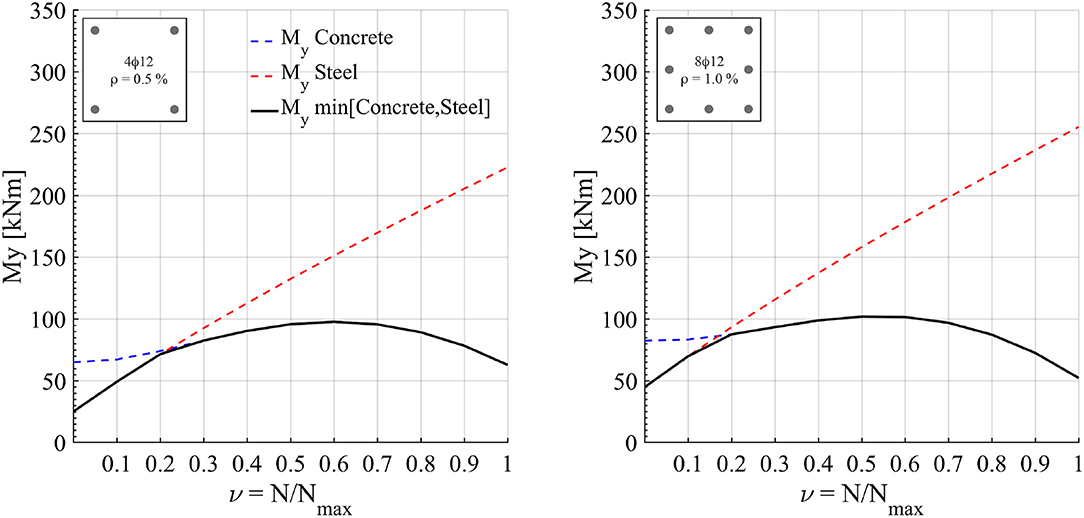
Figure 2. Axial Load-Yield Moment interaction diagram according to Panagiotakos and Fardis (2001).
Figure 3 shows the comparison between the yield moments obtained following Panagiotakos and Fardis (2001) and those obtained with the fiber section model (following the same limit criteria). It was observed that, for low axial load (ν = 0÷0.2), there is a good match between the values predicted with the two approaches. As the axial load increases, the differences increase: at the ultimate axial load, the fiber section yielding moment was correctly equal to 0[kNm], while the model by Panagiotakos and Fardis (2001) has provided a much higher value. The increasing lack of precision observed for the equation by Panagiotakos and Fardis (2001) for increasing axial loads was probably due the fact that the experimental results used for the calibration of their predictive equations were based on columns with low axial loads and higher reinforcement ratios (see later in this section).
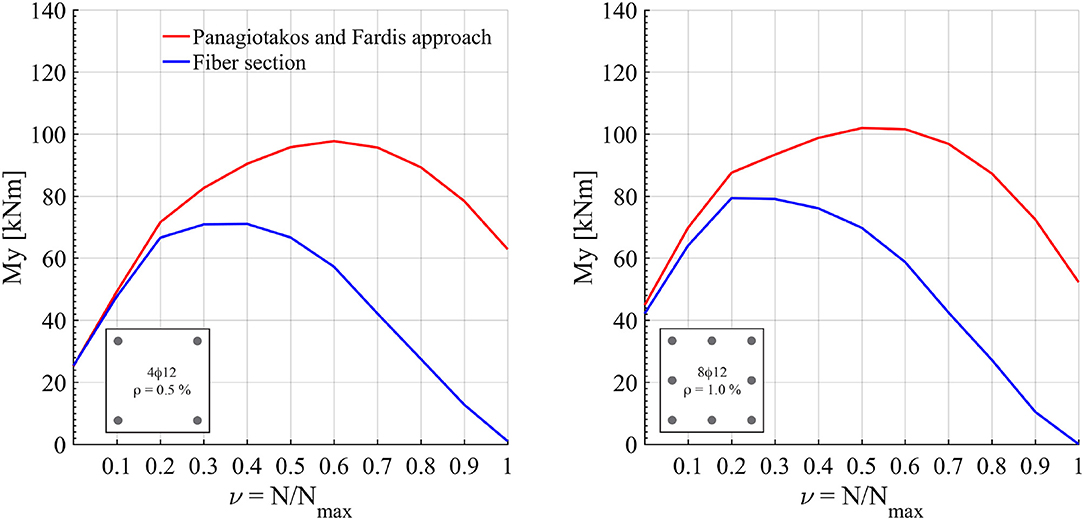
Figure 3. Comparison between Axial Load-Yield Moment interaction diagrams obtained following a fiber section model and Panagiotakos and Fardis (2001) equations.
Haselton et al. (2008) calculated the reinforced concrete section ultimate moment (Mc) from the yield moment (My) using the Equation (5) in section 2 or with a simplified where Mc/My≅1.13. Figures 4, 5 compares the results obtained with the equations by Haselton et al. (2008) and with a fiber section. As expected (since the ultimate moment computed according to Haselton et al. (2008) is a function of the yield moment), in this case, too, the ultimate moment (Mc) was predicted according to Haselton et al. (2008), and the value obtained with a fiber section provided similar results for low axial loads only. As the axial load increases, the difference in Mc increases, and Equation (5) or simplified provides unreasonable results.
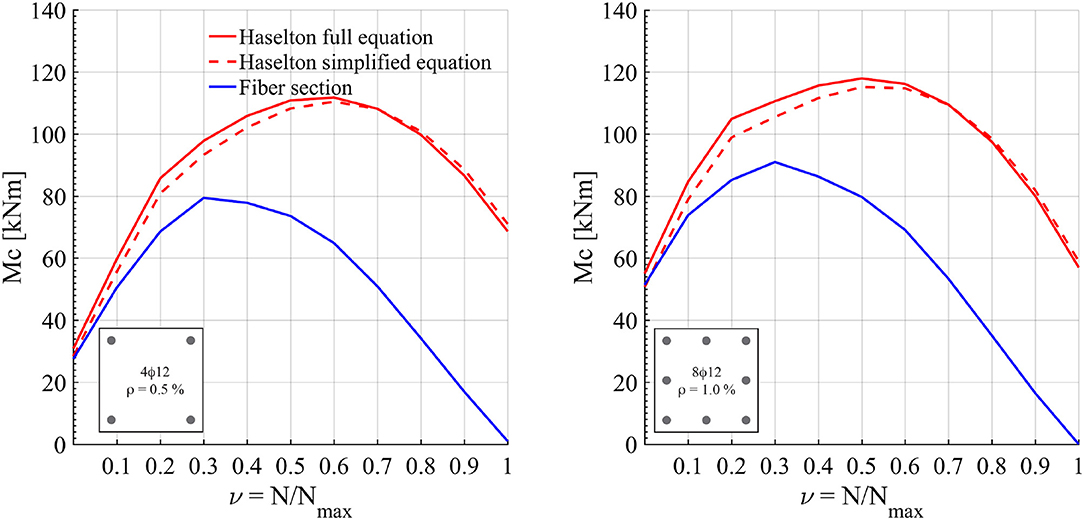
Figure 4. Ultimate moment interaction obtained with Haselton et al. (2008) predictive equation and the fiber section.
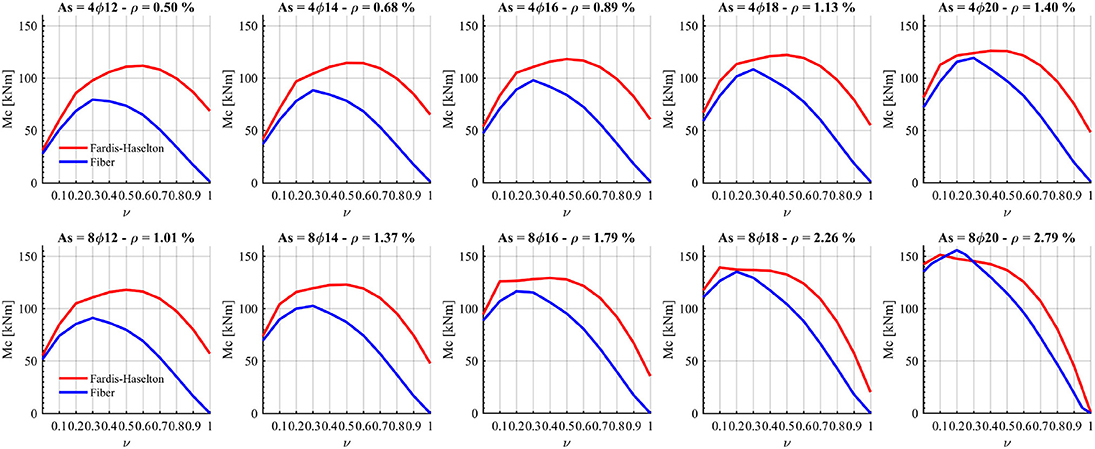
Figure 5. Reinforced concrete column ultimate moments obtained with Haselton et al. (2008) predictive equation and with a fiber section for different reinforcement ratios.
The ultimate moment Mc prediction was further investigated by considering the previously described sections (with four and eight longitudinal bars) and varying the reinforcement bars' diameter from ϕ12 to ϕ20. The headings in the plots of Figure 5 report the corresponding reinforcement rations. Figure 5 indicates that as the longitudinal reinforcement ratio increased the differences between the values of Mc predicted by Equation (5) and by the fiber section decrease. More specifically, for the sections with 8ϕ20 bars, the difference in the results was small because the experimental results used for the predictive equation calibration were based on higher reinforcement ratios (ρmean = 2.4%). However, this high longitudinal reinforcement ratio (ρ1 ≈ 2.8%) may be found in new buildings designed according to modern codes, but this is highly unlikely in older, existing structures.
4. Experimental vs Numerical Results
Four experimental tests on rectangular columns designed to fail in flexure have been analyzed in this section. The tests were extracted from the Pacific Earthquake Engineering Research Center's Structural Performance Database (Berry et al., 2004), which was used in Haselton et al. (2008) to define the predictive equations presented in section 2. The selected four columns are reported in the following Table 1 together with their main geometric and mechanical properties. The four columns have different geometries, reinforcement details, material properties, axial loads, and experimental setups. Two columns were tested under low axial load, the other two with high axial load, in line with the examples previously discussed. The tests were modeled in the Scientific Toolkit for Opensees STKO (Petracca et al., 2017a,b) and Opensees using the concentrated hinge approach combined with the phenomenological model by Ibarra et al. (2005) and the force-based distributed plasticity frame element combined with a fiber section model. The concentrated hinge properties were computed following the equations by Haselton et al. (2008) and Panagiotakos and Fardis (2001). Figures 6, 7 superimpose the numerical predictions with the experimental load-displacement curves.

Table 1. Four experimental tests extracted from the Pacific Earthquake Engineering Research Centers Structural Performance Database (Berry et al., 2004).
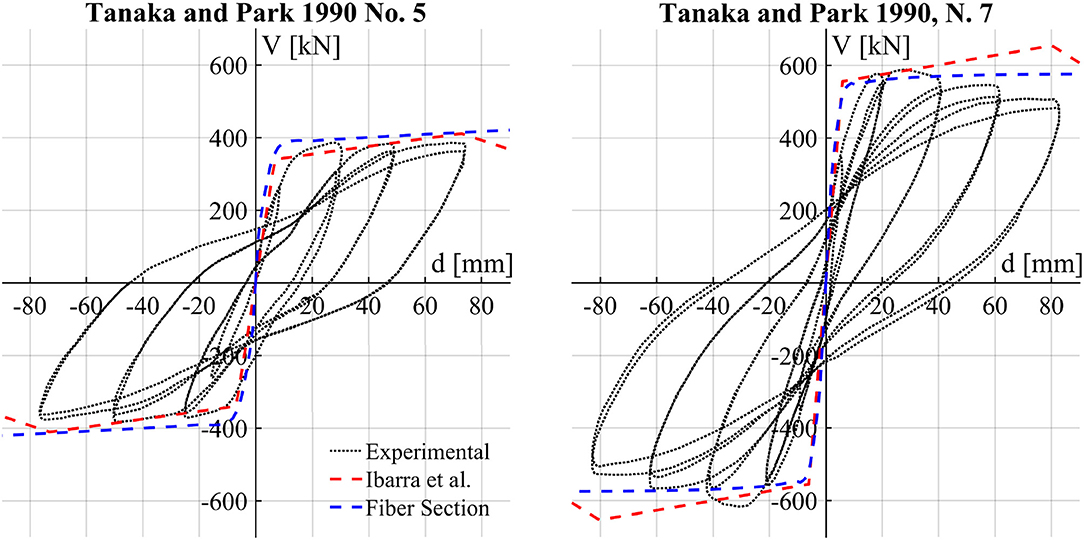
Figure 6. Experimental and numerical cyclic responses of two reinforced concrete columns with low axial loads tested by Tanaka and Park (1990).
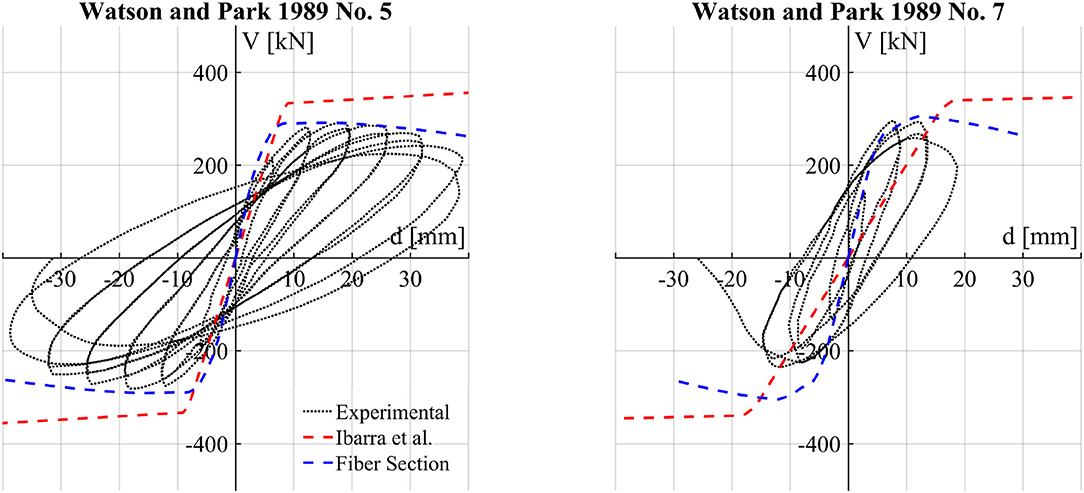
Figure 7. Experimental and numerical cyclic responses of two reinforced concrete columns with high axial loads tested by Watson and Park (1989).
Since the columns of Figure 6 were tested with low axial load, the two numerical approaches predicted the experimental results with good accuracy. For the high axial load cases, the fiber model showed a reasonable response, while the concentrated hinge properties by Ibarra et al. (2005) overestimated the specimens' shear capacity. This confirms what was previously discussed when Haselton et al. (2008) and Panagiotakos and Fardis (2001) proposed capacity equations based on experimental tests with low axial load ratios.
Figure 8 shows the ratios between the numerical and the experimental maximum shear recorded during the cycles (i.e., R = Vmax, exp/Vmax) for all 223 tests of the Pacific Earthquake Engineering Research Center's Structural Performance Database. The blue dots represent the ratios for the phenomenological model calibrated with Ibarra et al. (2005), Haselton et al. (2008), and Panagiotakos and Fardis (2001) predictive equations. The red dots represent the ratios obtained with a fiber section model.
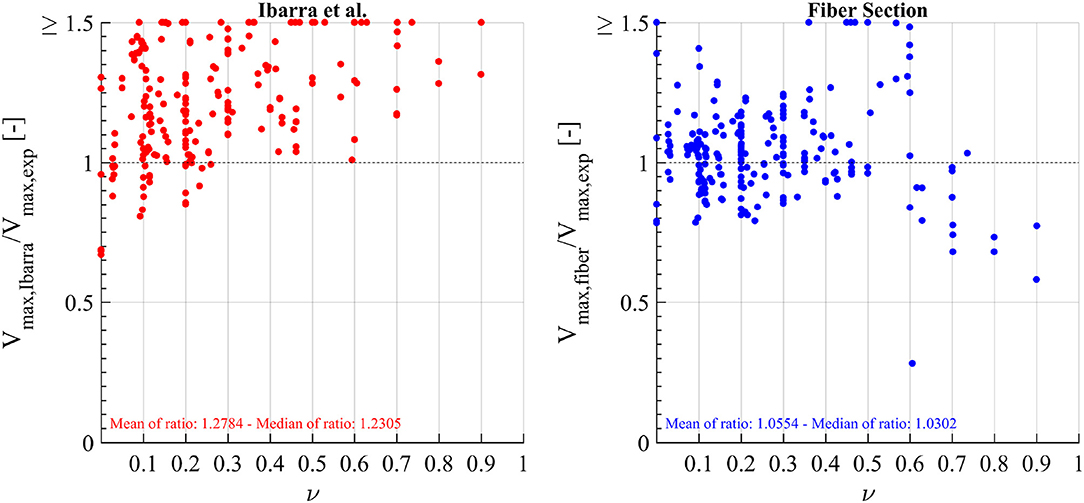
Figure 8. Experimental vs. numerical shear ratios (experimental/numerical) for phenomenological and fiber-section approaches.
The results show that the fiber section approach provides a better estimate of the mean values compared with those obtained with the phenomenological hinge model. The mean value of R was 1.06 with the fiber section and 1.28 with the phenomenological hinge model. As the axial load increases, the phenomenological model tends to overestimate the maximum shear, while the fiber model tends to underestimate the maximum shear. The results of Figure 9 are un-clustered with respect to the different loading configurations (double-ended, cantilever, and double-cantilever). The numerical predictions become less accurate for the configurations with fixed-end sections (one in the cantilever configuration, two in the double-cantilever configuration). Both models show this tendency, particularly for high axial load ratios (ν = 0.7÷1.0) in double-cantilever specimens. This is probably due of the confinement effects at the fixed ends (where the column is connected to the footings) in the experimental results, which are neglected in the numerical examples. As for the axial response of the two section models, in the phenomenological model, there is no bending-axial load interaction, and, since the axial load is constant, there is no variation in axial deformation. Conversely, in the fiber-section model, the axial deformation (at the section center, selected as reference point) and the neutral axis position changed during the analyses in order to find equilibrium with the applied axial load.
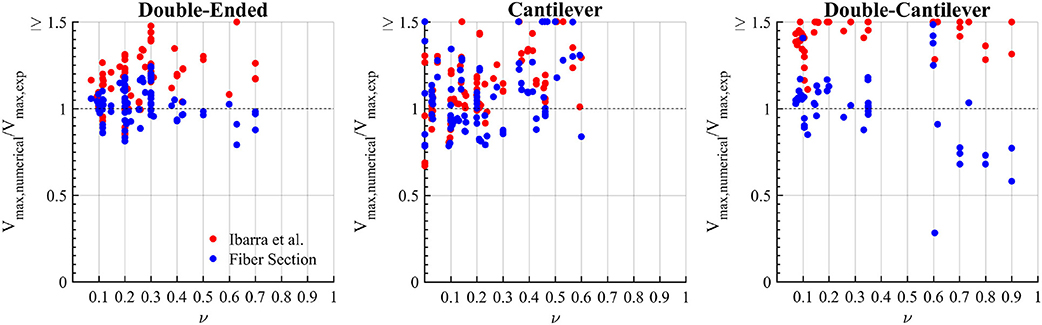
Figure 9. Experimental Shear vs. Numerical Shear for different test configuration.
5. Conclusion
This paper analyzed and compared the results obtained for reinforced concrete column sections and for simple columns using a phenomenological section model (Panagiotakos and Fardis, 2001; Ibarra et al., 2005; Haselton et al., 2008) and a fiber-section model (Spacone et al., 1996a,b). The phenomenological section model used the predictive equations proposed by Haselton et al. (2008) for the ultimate moment capacity and Panagiotakos and Fardis (2001) for the yield moment. The analyses performed showed that the numerical yield moment predicted by Panagiotakos and Fardis (2001) and the ultimate moment capacity calculated with Haselton et al. (2008) were higher than the experimental results and show that the error decreases as the longitudinal reinforcement ratio increases. Good agreement was observed with the fiber section model. In addition, experimental pushover tests of RC columns with low and high axial loads were analyzed. The results showed that for higher axial loads the predictive model calibrated with Ibarra et al. (2005), Haselton et al. (2008), and Panagiotakos and Fardis (2001) did not provide satisfactory results in terms of maximum shear, while the fiber model predicted the experimental results with good accuracy. The results indicated that the phenomenological law proposed by Ibarra et al. (2005) in conjunction with the predictive equations by Haselton et al. (2008) and Panagiotakos and Fardis (2001) should be used only in case of elements subjected to low axial loads.
Data Availability Statement
Publicly available datasets were analyzed in this study. This data can be found here: https://nisee.berkeley.edu/spd/.
Author Contributions
All authors listed have made a substantial, direct and intellectual contribution to the work, and approved it for publication.
Conflict of Interest
The authors declare that the research was conducted in the absence of any commercial or financial relationships that could be construed as a potential conflict of interest.
References
Berry, M., Parrish, M., and Eberhard, M. (2004). Peer Structural Performance Database, User's Manual (version 1.0). Berkeley, CA: University of California.
Deierlein, G. G., Reinhorn, A. M., and Willford, M. R. (2010). Nonlinear Structural Analysis for Seismic Design. NEHRP seismic design technical brief, 4.
Haselton, C. B., Liel, A. B., Taylor Lange, S., and Deierlein, G. G. (2008). Beam-Column Element Model Calibrated for Predicting Flexural Response Leading to Global Collapse of rc Frame Buildings. Pacific Earthquake Engineering Research Center, PEER Rep. 2007/03.
Ibarra, L. F., Medina, R. A., and Krawinkler, H. (2005). Hysteretic models that incorporate strength and stiffness deterioration. Earthq. Eng. Struct. Dyn. 34, 1489–1511. doi: 10.1002/eqe.495
Kent, D. C., and Park, R. (1971). Flexural members with confined concrete. J. Struct. Division. 97, 1964–1990.
Lignos, D. G., and Krawinkler, H. (2012). Development and utilization of structural component databases for performance-based earthquake engineering. J. Struct. Eng. 139, 1382–1394. doi: 10.1061/(ASCE)ST.1943-541X.0000646
Marini, A., and Spacone, E. (2006). Analysis of reinforced concrete elements including shear effects. ACI Struct. J. 103:645. doi: 10.14359/16916
McKenna, F., Fenves, G. L., and Scott, M. H. (2000). Open System for Earthquake Engineering Simulation. Berkeley, CA: University of California.
Menegotto, M., and Pinto, P. (1973). “Method of analysis for cyclically loaded rc plane frames including changes in geometry and non-elastic behavior of elements under combined normal force and bending,” in Proceedings of IABSE Symposium on Resistance and Ultimate Deformability of Structures Acted on by Well Defined Repeated Loads (Zurich), 15–22.
Panagiotakos, T. B., and Fardis, M. N. (2001). Deformations of reinforced concrete members at yielding and ultimate. Struct. J. 98, 135–148. doi: 10.14359/10181
Petracca, M., Candeloro, F., and Camata, G. (2017a). “Stko: a revolutionary visualization toolkit for opensees,” in OPENSEES DAYS Europe, First European Conference on OPENSEES (Porto).
Petracca, M., Candeloro, F., and Camata, G. (2017b). Stko User Manual. Pescara: ASDEA Software Technology.
Petrangeli, M., Pinto, P. E., and Ciampi, V. (1999). Fiber element for cyclic bending and shear of rc structures. I: theory. J. Eng. Mech. 125, 994–1001. doi: 10.1061/(ASCE)0733-9399(1999)125:9(994)
Spacone, E., Filippou, F., and Taucer, F. (1996a). Fibre beam-column model for non-linear analysis of r/c frames: part I. formulation. Earthq. Eng. Struct. Dyn. 25, 711–726. doi: 10.1002/(SICI)1096-9845(199607)25:7<711::AID-EQE576>3.0.CO;2-9
Spacone, E., Filippou, F., and Taucer, F. (1996b). Fibre beam-column model for non-linear analysis of r/c frames: part II. applications. Earthq. Eng. Struct. Dyn. 25, 727–742. doi: 10.1002/(SICI)1096-9845(199607)25:7<727::AID-EQE577>3.0.CO;2-O
Tanaka, H., and Park, R. (1990). Effect of Lateral Confining Reinforcement on the Ductile Behavior of Reinforced Concrete Columns. Report 90-2. Technical Report, Department of Civil Engineering, University of Canterbury, Christchurch, New Zealand.
Keywords: modeling, plastic hinge, phenomenological model, predictive equations, moment of yielding, fiber
Citation: Terrenzi M, Spacone E and Camata G (2020) Comparison Between Phenomenological and Fiber-Section Non-linear Models. Front. Built Environ. 6:38. doi: 10.3389/fbuil.2020.00038
Received: 19 February 2020; Accepted: 18 March 2020;
Published: 17 April 2020.
Edited by:
André Furtado, University of Porto, PortugalReviewed by:
Xinzheng Lu, Tsinghua University, ChinaSvetlana M. Kostic, University of Belgrade, Serbia
Copyright © 2020 Terrenzi, Spacone and Camata. This is an open-access article distributed under the terms of the Creative Commons Attribution License (CC BY). The use, distribution or reproduction in other forums is permitted, provided the original author(s) and the copyright owner(s) are credited and that the original publication in this journal is cited, in accordance with accepted academic practice. No use, distribution or reproduction is permitted which does not comply with these terms.
*Correspondence: Marco Terrenzi, bWFyY28udGVycmVuemlAdW5pY2guaXQ=