 Christian Bedwell
 Kurtis Gurley
 Jean-Paul Pinelli
 Roberto Vicente Silva de Abreu
- 1Department of Civil and Coastal Engineering, University of Florida, Gainesville, FL, United States
- 2Department of Mechanical and Civil Engineering, Florida Institute of Technology, Melbourne, FL, United States
The Florida Public Hurricane Loss Model is a probabilistic risk model designed to estimate wind induced insurance losses to residential infrastructure in Florida. In the physical damage estimation module, Monte Carlo simulation is employed to generate damage matrices as a function of wind speed by comparing probabilistic building component capacities to wind loads. These damage matrices are input to a repair cost algorithm, ultimately producing damage ratios as a function of wind speed for different building classes. It is required that the inventory of residential building models reflect the history of construction practice within Florida. Differing eras of construction are represented by developing component-wise options for probabilistic capacities and load paths, resulting in a suite of hundreds of model variants. Regarding loads, the probabilistic wind load model is based on a directionalized adaptation of ASCE 7, and its representation in the model is kept current with the version adopted by the Florida Building Code (FBC). In 2020 the Florida Building Code adopted by reference ASCE 7–16, which contains important changes to the wind-load provisions. These changes have implications for both the loading and resistance aspects of the physical damage model, thus influencing insured loss projections. This study discusses the development and implementation of these changes within the model and investigates the impacts on the modeled vulnerability of residential structures in Florida. Comparing vulnerability estimates of structures designed before and after the FBC adoption of ASCE 7–16 provide insight into the potential effectiveness of such changes to improve community resilience.
1 Introduction
Early models of infrastructure vulnerability to hurricane hazards were based on relationships between historical insurance loss data and local recorded wind speeds (Friedman, 1975; SWFRPC, 1982; Berke et al., 1984; Ruch, 1984). Studies performed at Clemson University integrated engineering knowledge into hurricane vulnerability models; a threshold wind speed was defined which represented significant damage to the building envelope to allow water intrusion (Sparks and Bhinderwala, 1994). Simulation models, which first appeared in the late-1990s, developed more engineering-grounded relationships between building damage and wind speed (Sciaudone et al., 1997). The Federal Emergency Management Agency and National Institute of Building Safety developed HAZUS, a methodology designed to estimate risk due to a wide variety of natural hazards (FEMA-HAZUS, 2006). Since the widespread adoption of simulation-based hurricane hazard models, many advances have been made to estimate damage. Methodologies have been developed to model the effects of progressive damage to the building envelope over the course of a wind event (Ji et al., 2020), to use a network of simulations to model the time-history of a wind event and several structures’ responses (Lin et al., 2019), and concurrently model the impacts of wind, surge, and wave hazards at a regional scale (Nofal et al., 2021). A comprehensive review of hurricane vulnerability estimation methods can be found in Pita et al., 2014, while the most recent contribution in the context of residential construction can be found in Abdelhady et al., 2022.
The Florida Public Hurricane Loss Model (FPHLM) is a probabilistic risk model designed to produce estimates of insured losses caused by hurricane wind-induced damage to residential structures within the state of Florida. The methods and outputs from this State of Florida funded risk model are evaluated and certified on a biennial basis by the Florida Commission on Hurricane Loss Projection Methodology (Florida International University, 2021). During this evaluation it must be demonstrated that the model employs the current state of knowledge in wind hazard science, incorporates assumptions that reflect historical and current building practice in Florida, and accurately simulates wind-induced physical damage and vulnerability. Herein we define vulnerability as the monetary damage ratio, which is the ratio of the cost of repair to building value.
The FPHLM began development in 2002 and was first certified by the Florida Commission on Hurricane Loss Projection Methodology in 2007. The model has been continually refined and updated to keep pace with the current state of knowledge, new datasets from wind events, and changes in the aspects of codes and standards that influence wind vulnerability. While not inclusive of all available FPHML peer reviewed documentation, the following review provides sufficient background for the engineering components and validation of the model. Insurance portfolios from three major storms were compared with predicted losses in a validation study (Pinelli et al., 2008). An overview of major model components was written and sample probable maximum loss outputs for 30 hypothetical Florida landfalling storms were produced (Hamid et al., 2010; Hamid et al., 2011). The FPHLM simulates the co-occurrence of wind, rain, and envelope damage to estimate interior damage (Pita et al., 2012). Experimental test results on wind-driven rain intrusion into residential structures (Baheru, 2014) were used to further refine the FPHLM interior damage model (Johnson et al., 2018). Later tests performed at the Florida International University’s Wall of Wind provided insight into the physical mechanisms of rainwater ingress. The results of these tests were used to develop a more thoroughly defined model of interior damage, which accounts for the propagation and distribution of water throughout various components in the structure (Silva de Abreu et al., 2020). Beyond the direct application of producing estimated losses, the FPHLM has also been utilized to evaluate the effectiveness of various mitigation techniques. Models with combinations of mitigated components (e.g. shuttered windows, roof retrofit devices, gable-end bracing) were used in a cost-benefit analysis to evaluate the effectiveness of mitigation techniques based on region and structure type (Torkian et al., 2014).
The Florida Building Code (FBC) seventh Ed., effective as of December 2020, adopts by reference the ASCE 7–16 standard to calculate design wind loads (International Code Council, 2020). Relative to its predecessor ASCE 7–10, the ASCE 7–16 standard contains significant changes to the calculation of uplift loads on roof components and cladding. In both versions of ASCE 7, the roof system is divided into zones with varying uplift load coefficients. In ASCE 7–16, these zones were redefined, and changes to the load coefficients result in an increased uplift load on roof components and cladding (American Society of Civil Engineers, 2017). These changes to roof loading (described in detail in Section 3.1), present two tasks for the FPHLM modelling team to keep the model in compliance with current knowledge and construction practice. First, the modified roof loading reflects the current understanding of wind-induced loads and should be integrated into the FPHLM’s wind loading algorithm. Second, the FBC has updated construction requirements (building code changes) in response to these new design wind loads upon adoption of ASCE 7–16. Florida residential structures built to the FBC seventh Ed. will comprise a non-negligible portion of the inventory as time passes. As the FPHLM includes structural models from various eras in residential building code history, the notable changes to the FBC call for a new model to represent post-2020 construction.
This paper describes the development and implementation of the above two tasks. The resultant loading and construction changes to the model are analyzed in isolation and in combination to understand the influence each modification has on the vulnerability outputs of the FPHLM.
2 The Florida Public Hurricane Loss Model (FPHLM)
The FPHLM consists of three components: a meteorological (hazard) module, a vulnerability (engineering) module, and an actuarial module. The meteorological module produces the peak wind speeds at 10 m height for actual terrain, at any location in Florida, for each of the 50,000 + simulated hurricanes of a stochastic set. The vulnerability module produces vulnerability matrices describing the relationship between wind speed and damage ratio. These matrices are produced for a library of different models reflecting the construction eras that make up the current Florida residential inventory. Separate vulnerability matrices are produced for physical building, appurtenant structures, interior contents, and additional living expenses. The actuarial module uses the outputs from the vulnerability and meteorological modules to produce, for example, average annual insured losses for any given portfolio of properties, or region of Florida, or era of construction, etc.
Changes to the Florida Building Code resulting from the adoption of ASCE 7–16 have a direct impact on the vulnerability module. Comprehensive documentation of the FPHLM, including flow charts for the full system and individual modules are publicly available (Florida International University, 2021). The modifications discussed in this paper are confined to the model that represents timber frame construction and gable roof shapes. Parallel modifications to models that reflect masonry wall structures and hip roof shapes are omitted for brevity.
2.1 Physical damage estimation component
The damage estimation component of the vulnerability module of the FPHLM simulates wind-induced damage to the structural components of model buildings. Monte Carlo simulation is utilized to capture uncertainties in many aspects of the load to damage chain. For a given model type (e.g. single story timber frame gable roof constructed in 1983), many simulations are conducted for a sequence of wind speeds and wind directions. Each simulation consists of a randomized representation of wind loading and component capacities. The specific probability distributions used for the randomization are dependent on building type, shape, age, and wind direction. Deterministic relationships define load paths, load sharing, and the influence of damaged components on building loads. For example, a broken window changes internal pressure and therefore net loads on roof sheathing, walls, and other windows. The outcome of a given simulation is a single sample of how many of each modeled building component fails (load exceeds capacity). The next simulation ‘rebuilds’ the same model with a fresh randomized representation of wind loading and component capacities for the same wind speed and wind direction. This continues through all assigned wind speeds and wind directions, producing a 4-dimensional ‘damage matrix’ where each row is the outcome of a simulation, each column is a building component (Table 1), the third dimension is 3-s gust wind speed, and the fourth dimension is wind direction. Each cell in any given row of the 4-D damage matrix expresses the quantity of damage to each component at each wind speed and each wind direction for one simulation. Averaging this 4-D damage matrix over all simulations and all wind directions produces a quantification of average damage to each modeled building component as a function of wind speed. The default wind speeds are 50–250 mph 3-s gust in five mph increments. The default wind directions are eight approach angles in 45° increments. For each combination of wind speed and approach angle, 2,000 simulations are performed. This represents 41 × 8 × 2,000 = 656,000 simulations in each completed damage matrix.
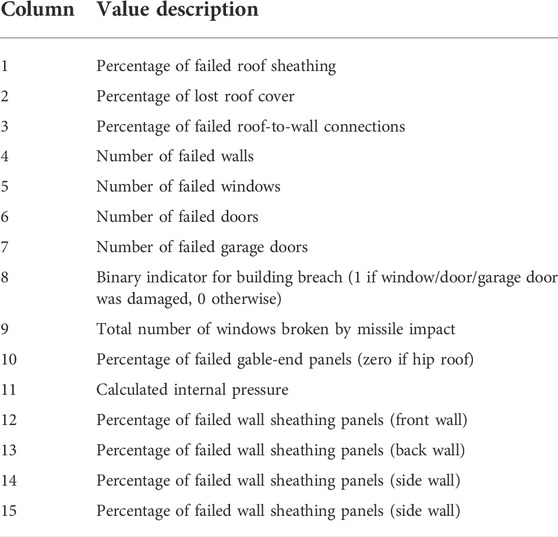
TABLE 1. Components evaluated for damage.
The same Monte Carlo engine would be used if the subject were a masonry wall hip roof building built in 2019. However, the probability distributions used for randomized building component capacities are different (material and building code differences), some aspects of load sharing are different, the wind loading scheme is different (hip and gable roof shapes load differently), and therefore the contents of the resultant damage matrix would be quite different from the 1983 built timber frame gable roof building. For that reason, many model variants were developed to represent the vast Florida inventory. Model variants include different building materials, roof shapes, eras of construction, common maintenance practices (e.g., an old structure with new roof shingles), mitigation measures (e.g., window protection against debris), and regions with specific design requirements (e.g., windborne debris region requirement for window protection).
The influence of a change to any component of a physical damage model can be investigated by implementing that change, using simulation to generate a damage matrix with and without that change, and plotting the before and after versions of the mean component damage vs. wind speed. In some cases, changing the capacity of one component may change the damage to other components, so plotting each component before and after is valuable. For example, comparing the damage with and without the use of window protection will reveal changes in mean damage to windows, roof sheathing and walls. However, this process does not provide quantitative insight with respect to changes in projected monetary damage. Will the use of window protection reduce predicted annualized average damage by $5 or $5000? For that obviously relevant insight, the physical damages must be converted to cost of repair.
2.2 Interior damage and vulnerability components
The 4-D damage matrix describing physical damage to the building’s external components in Table 1 is the input to the next process in the vulnerability module, the interior damage component. For each simulation, this component predicts interior damage to the building due to rain-water ingress through both damaged components (windows, roof cover and sheathing) and rain-water pathways through undamaged components (e.g., gaps in the window-wall interface under large pressure loads).
The final component of the vulnerability module converts the combined physical external and interior damage into monetary damage and generates damage ratios of total cost of repair over the value of the building. For each structure, these damage ratios are used to generate a vulnerability matrix. In these vulnerability matrices, each column represents the mean 3-s gust wind speed, and each row corresponds to a range of damage ratios. The value of each cell is the conditional probability of a damage ratio occurring at a given wind speed. A building vulnerability matrix can be represented graphically as a vulnerability curve, the plot of the mean damage ratio vs wind speed. Although the FPHLM uses the matrix and not the curve to compute losses, the curve provides a visual interpretation of the influence of all building component repair costs. Changes and/or updates to the components of the physical damage models can now be evaluated within the framework of how they influence the building vulnerability curve. This provides the $5 vs. $5000 insight desired at the end of the previous section. These vulnerability curves will be the basis for investigating the changes to the FPHLM as a result of the FBC adoption of ASCE 7–16. Examples are shown in Section 5.
This paper uses vulnerability matrices and curves derived from building damage ratios, which describe the cost of repairs to the external and internal components of the structure. Additionally, the vulnerability module also produces matrices for contents damage, damage to appurtenant structures, and additional living expenses. Vulnerability matrices can also be developed for interior damage, excluding the damage to external structures.
3 Code change description and implementation in FPHLM
3.1 Relevant code changes
A comprehensive survey of the changes from FBC sixth Ed. to FBC seventh Ed. was conducted to identify modifications that were relevant to structural wind resistance. This survey was accompanied by a literature review of materials written to highlight and explain relevant code changes (Chock et al., 2018; Scott, 2018; Building a Safer Florida, 2020a; Building a Safer Florida, 2020b; Florida Building Commission, 2020).
ASCE 7–16, Chapter 30 defines the method by which wind loads are calculated on the components and cladding (C&C) of structures. A notable change between ASCE 7–10 and ASCE 7–16 involves specific details within the uplift load calculations on roof C&C. The underlying mechanical principles remain the same: the net pressure on a component is calculated using
where p is the design wind pressure (psf), qh is the velocity pressure (psf), GCp is the external pressure coefficient, and GCpi is the internal pressure coefficient. The velocity pressure, qh, is defined by
where Kh is the velocity pressure exposure coefficient (equal to 0.85), Kzt is the unitless topographic factor (assigned to unity), and V is the wind speed (mph). The directionality coefficient, Kd, is set to unity in our application because the FPHLM damage model explicitly considers multiple directions. The ground elevation factor, Ke, which accounts for the change in air density at various elevations, is set to its sea level value given the typical ground elevation in Florida. The highest elevation in Florida is 345 feet above sea level (WJHG News, 2017).
The relevant change between ASCE 7–10 and ASCE 7–16 concerns both the magnitude and mapping of the external pressure coefficient, GCp, to the roof surface. Chapter 30 of ASCE seven includes a series of maps and plots for hip and gable roof shapes. The maps delineate pressure zones, and accompanying plots define GCp in each of those zones as a function of effective wind area. The ASCE 7–16 pressure zone map for gable-roof structures makes a distinction between the previously-united zones 2e and 2n, and includes the new zones 2r and 3r along the ridgeline (Figure 1). The plot defining the pressure coefficients in each zone changed significantly from ASCE 7–10 to 7–16; the plot not only accounts for new zones, but also significantly increase the GCp across most regions of the roof at most effective wind areas (ASCE, 2013; ASCE, 2017). In summary, the C&C roof uplift design pressure coefficients increased from 7 to 10 to 7–16.
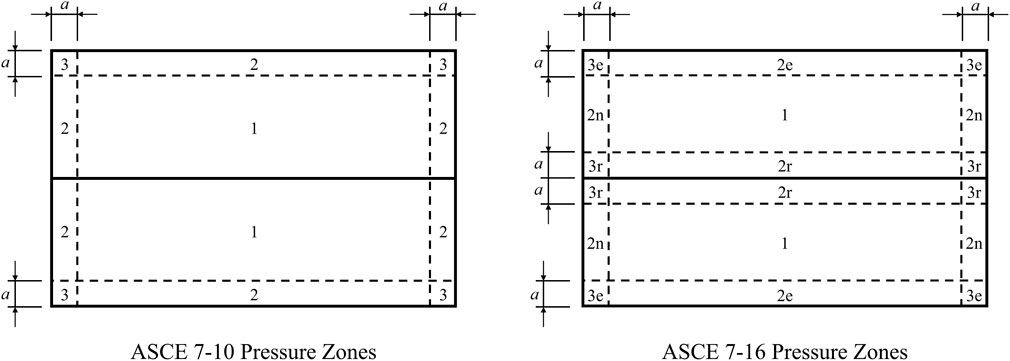
FIGURE 1. Maps of wind pressure zones for ASCE 7–10 and ASCE 7–16.
The increase in the external pressure coefficient led to a notable change in the FBC seventh Ed concerning roof sheathing fasteners. FBC Section R803.2.3.1 governs allowable roof sheathing fastener types and spacing. Design wind speed, specific gravity of the roof sheathing, and truss/rafter spacing are all factors that influence allowable fastener design in both sixth Ed. and seventh Ed. Under FBC seventh Ed., both the type and spacing requirements became stricter. RSRS-01 ring-shank nails are required in FBC seventh Ed., whereas 8 days nails, which have a weaker withdrawal capacity (Skulteti et al., 1997; Prevatt et al., 2009), were allowable in many structures under the FBC sixth Ed. Regarding fastener spacing, 12-inch spacing between fasteners was allowed at design wind speeds less than or equal to 140 mph under FBC sixth Ed. Under FBC seventh Ed., 12-inch fastener spacing is only allowed for certain structures at design wind speeds of 120 mph or less (International Code Council, 2017; International Code Council, 2020).
3.2 Changes to FPHLM loading
The new wind load provisions in ASCE 7–16 require a change to the C&C loading scheme in the FPHLM. The previous versions of the FPHLM developed modifications to the ASCE 7–98 directionally enveloped pressure maps to explicitly model eight approach wind angles (Cope, 2004). The FPHLM maps were developed for winds parallel to the ridgeline, winds perpendicular to the ridgeline, and cornering winds. For the current FPHLM modification, a similar approach was utilized to develop the directionalized pressure zone maps based on ASCE 7–16 (Figure 2).
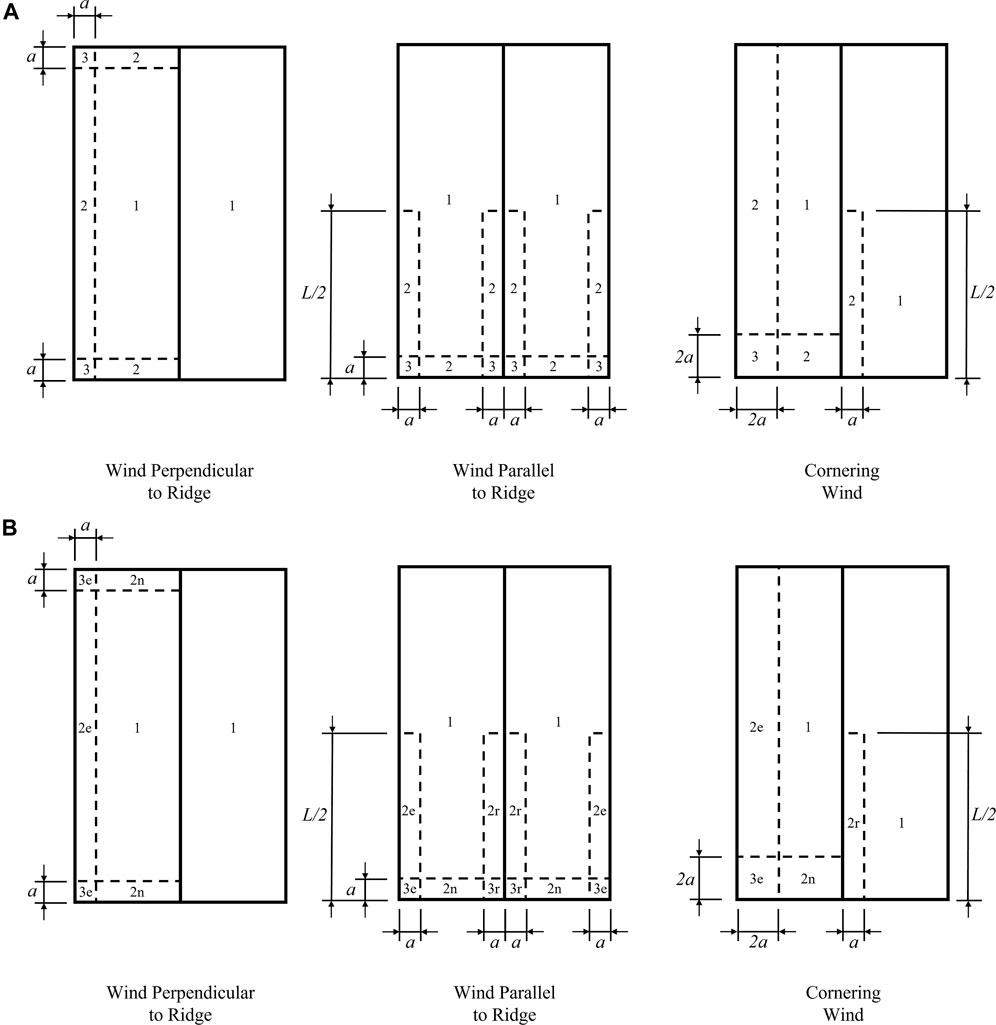
FIGURE 2. Modified wind pressure zone maps for (A) ASCE 7–10 and (B) ASCE 7–16.
For each sheathing panel, the uplift load is calculated as a uniform pressure using Eq. 1, where GCp is the weighted average of pressure coefficients overlapping that panel according to the relevant directionalized wind pressure zone map. Table 2 provides a summary of all values of GCp used in the gable-roof model prior to and after the adoption of ASCE 7–16.
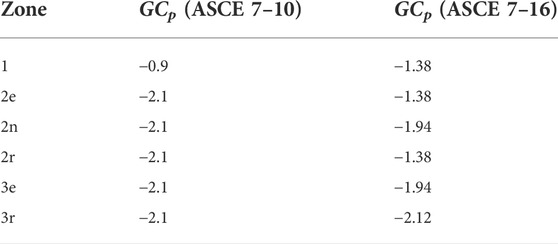
TABLE 2. External pressure coefficients in FPHLM.
Although only the pressure coefficients for zones 1 and 3r increase from ASCE 7–10 to ASCE 7–16, the total modeled uplift load across the roof increases. Considering Eq. 1, since the design wind pressure qh is uniform, the weighted average of external pressure coefficients across the roof can be used as a proxy for the total uplift load. The average GCp for each approach angle under each loading scheme was calculated (Table 3). Averaging across all approach angles (noting that cornering winds account for four out of eight approach angles) results in an average GCp increase from −1.166 to −1.416. This change accounts for a 21.4% increase in uplift load from ASCE 7–10 to ASCE 7–16 as the concept is manifested within the FPHLM.

TABLE 3. Average GCp across roof using modified pressure zone maps.
3.3 Changes to FPHLM building models
Residential structures designed under ASCE 7–16 require higher capacity components to resist the increased uplift loads. In the FPHLM, this is reflected in the development of a new variant of the current ‘strong’ model that represents pre-seventh Edition FBC construction outside of Miami/Dade and Broward Counties in Florida (outside of the high velocity hurricane zone - HVHZ). This new strong variant that represents ASCE 7–16 design wind loads is referred to as the new strong model.
In the FPHLM, the uplift load path is comprised of roof sheathing, roof-to-wall connections, and stud-to-sill connections. In the strong model, the sill to foundation is not explicitly modeled and sufficient capacity is presumed. Uplift pressures are calculated as a uniform pressure on any given roof sheathing panel as a weighted sum of that panel’s overlay within one or more pressure zones. Each sheathing panel is then evaluated for damage triggered by pressure exceeding uplift capacity, which has been randomly assigned as a function of sheathing fastener type and spacing. The uplift pressure applied to all non-damaged roof sheathing panels is then redistributed to the roof-to-wall connections. After these connections are evaluated for damage, the uplift load in each connection is transferred to the wall. The wall is evaluated for damage with a combination loading limit state, combining the effects of uplift, bending, and shear loading.
The strong model utilizes 8 days nails for roof sheathing fasteners using 6/6 spacing (nails are spaced 6 inches apart on center along panel edges, and along intermediate supports within the panel field). In compliance with Section R803.2.3.1 of FBC seventh Ed., the new strong model uses ring-shank nails at 6/6 spacing. This change results in an increase in the mean uplift capacity of sheathing panels from 130 psf to 200 psf (Prevatt et al., 2009).
The increase in uplift loads results in larger loads at the roof-to-wall connections. The modelers utilized design capacities and factors of safety from Simpson Strong-Tie to assign the capacity of roof-to-wall connections and stud-to-sill connections (Strong-Tie Company, 2021). For roof-to-wall connections, the new strong model capacity has been upgraded with higher capacity tiedowns, resulting in an increase in the mean uplift capacity from 3,720 lb to 6,750 lb. Likewise, upgrades to the stud-to-sill connections result in a mean capacity increase from 2023.5 lb/ft to 3,000 lb/ft. The changes from the strong model to the new strong model are summarized in Table 4.
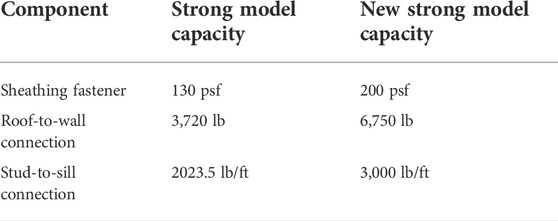
TABLE 4. Summary of component changes in new strong model.
The method of assigning random component capacities is described for the components under discussion. For each roof sheathing panel, a random value is assigned from a truncated normal distribution with a coefficient of variation (COV) of 0.25 for weak and medium models, and 0.20 for strong and new strong models. The truncation limits values to within 2 standard deviations of the mean capacity. For stud-to-sill connections the uplift capacity is selected from a truncated normal distribution using a COV of 0.2. For roof to wall connections the weak model represents toe nail connections with a truncated normal distribution and a COV of 0.2. The medium, strong, and new strong variations use a COV of 0.05 to represent the low variability among these highly engineered and consistent roof-to-wall connection products.
4 Methodology
The new strong model was developed by implementing changes to both the directionalized roof uplift loading scheme and the mean capacities of structural components in the uplift load path, as described in the previous sections. The influence of these independent changes to load and capacity on model outputs is investigated separately and in combination.
The influence of changes to the roof uplift loading scheme is evaluated on a subset of the existing library of models. Recall that many variants of the structural model have been developed to reflect different eras of construction as well as mitigation and maintenance. The base models include weak, medium and strong versions. The strong version represents post-1994 construction after significant changes to building methods and state level enforcement as a result of Hurricane Andrew. The weak model broadly represents construction before wind resistant features were commonly used in construction, such as toe nailed roof-to-wall connections prior to the common use of clips (medium model) or straps (strong model). Many subvariants of each base model were also developed (base weak but with new roof cover and re-nailed decking, all models with and without window protection, etc.). Herein, the influence of changes to wind loading on model outputs is confined to the base weak, medium, and strong models of the timber-frame gable-roof structure. For each of these models, physical damage matrices were generated via Monte Carlo simulation and input to the vulnerability model to generate internal damage and then vulnerability curves. Similarly, the influence of changes to component capacities is evaluated by comparing the base strong model and the new strong model under both ASCE 7–10 (previous) and ASCE 7–16 (new) loading schemes.
5 Analysis
5.1 Effects of new wind-loading calculations
Each vulnerability curve (Figures 3–5, Figures 7, 8), presents the mean damage ratio (ratio of repair cost to building value) as a function of the 3-s gust wind speed. Figures 3–5 each contain vulnerability curves of the identical building model (weak, medium and strong, respectively), as exposed to ASCE 7–10 and ASCE 7–16 loading. In each figure, the vulnerability curves being compared are nearly identical before 100 mph and then separate when exterior component damage starts to accumulate, and the influence of the different load schemes becomes visible. This separation occurs at increasing wind speed from weak to medium to strong models, reflecting less vulnerability to damage for better construction quality. After this separation, each model experiences greater damage under ASCE 7–16 loading. This outcome aligns with expectations, as the new loading scheme produces higher uplift loads and therefore more roof cover and sheathing damage, and more water penetration through the damaged roof.
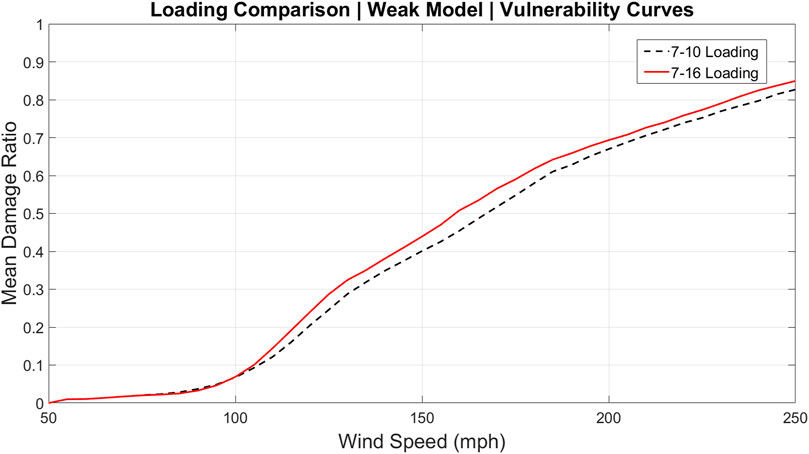
FIGURE 3. Vulnerability curves of the weak model using ASCE 7–10 and ASCE 7–16 loading.
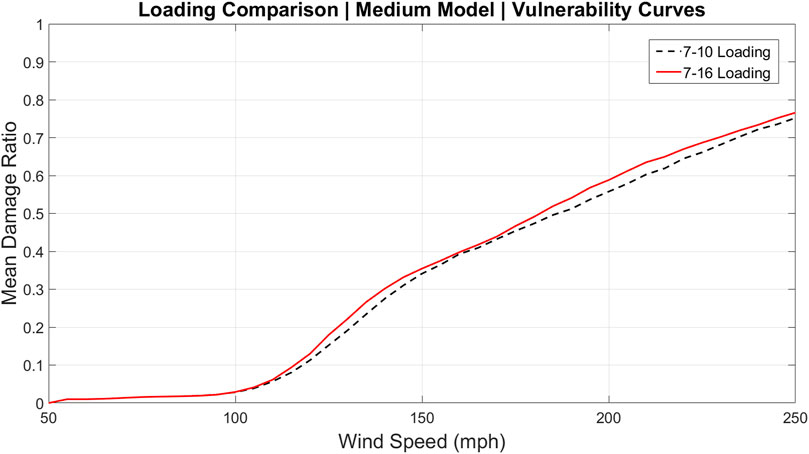
FIGURE 4. Vulnerability curves of the medium model using ASCE 7–10 and ASCE 7–16 loading.
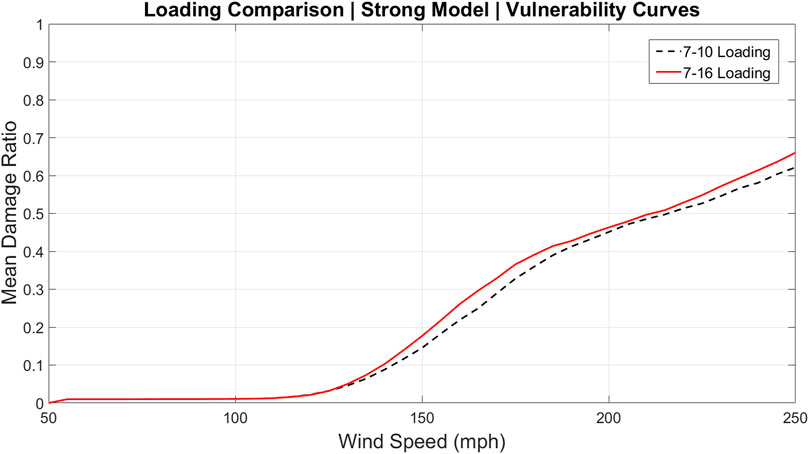
FIGURE 5. Vulnerability curves of the strong model using ASCE 7–10 and ASCE 7–16 loading.
Figures 3–5 model results for two loading schemes encompasses the influence of all modeled building components. The vulnerability of individual components can also be isolated as in Figure 6 which presents mean percent damage to the strong model roof sheathing panels using both loading schemes. The relative influence of the many individual components to overall vulnerability was investigated previously for the FPHLM (Torkian et al., 2014).
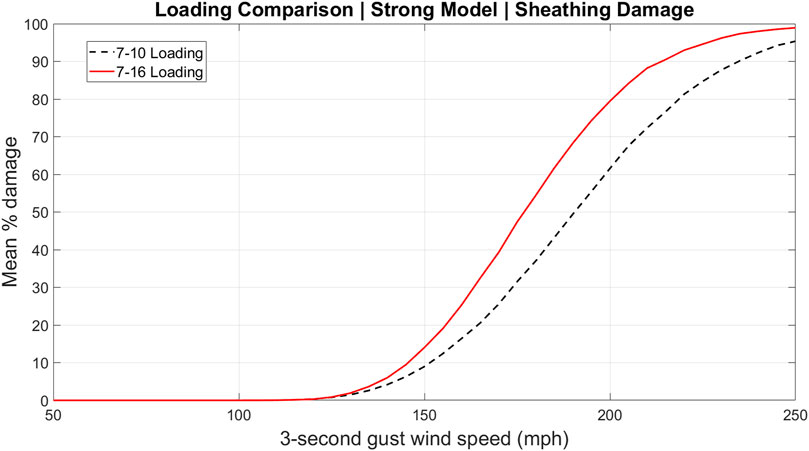
FIGURE 6. Vulnerability curves for roof sheathing damage of the strong model using ASCE 7–10 and ASCE 7–16 loading.
5.2 Effects of increased component capacities
Figures 7, 8 each contain vulnerability curves for the strong model and new strong model. Figure 7 compares these models under ASCE 7–10 loading; Figure 8 uses the newly implemented ASCE 7–16 loading. Under both loading schemes, the strong model is more vulnerable than the new strong model. These figures reveal that the mean capacity changes have a stronger influence on the damage ratio than the loading changes. In most cases, the changes due to loading led to differences in vulnerability of less than 5% (Figures 3–5). However, the assigned changes to the capacity of the components in the new strong model result in a decrease in vulnerability by well more than 5% (Figures 7, 8). The result is that the simultaneous application of the new loading scheme and new strong model capacities produce a damage curve (Figure 8 red solid curve) that is less vulnerable than the pre-2020 FBC strong model under the pre-ASCE 7–16 loading scheme (Figure 7 black dashed curve). This is important because it suggests that the changes to the FBC in response to the ASCE 7–16 load increases are a conservative (more than sufficient) response. This conclusion is clearly couched within the compound uncertainties and simplifications in the FPHLM, and inherent in any wind hazard risk model.
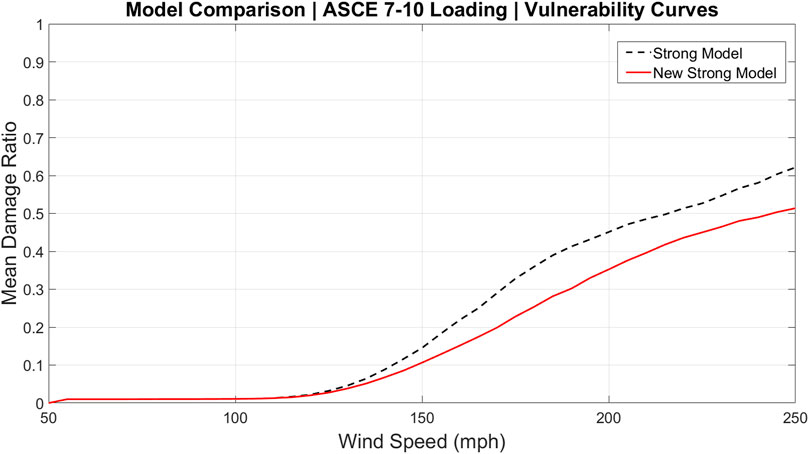
FIGURE 7. Vulnerability curves of the strong and new strong models under ASCE 7–10 loading.
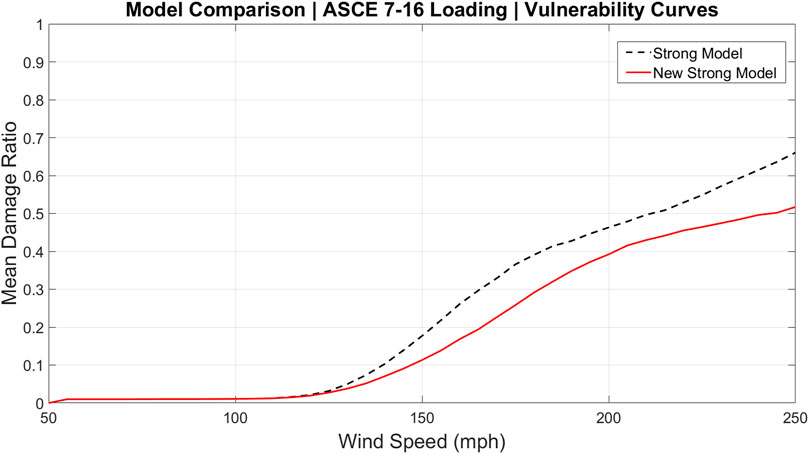
FIGURE 8. Vulnerability curves of the strong and new strong models under ASCE 7–16 loading.
Finally, the influence of the change in component capacities on individual component vulnerability is displayed in Figures 9, 10 for the strong model and new strong model roof sheathing damage under ASCE 7–10 and ASCE 7–16 respectively. Under both loading schemes, the roof sheathing in the new strong model is less vulnerable than the strong model as expected. Analogous to the conclusion in the previous paragraph, comparing Figure 6 (black dashed) to Figure 10 (red solid) shows that the updates to the FBC more than compensate for the increased loading in ASCE 7–16 at the component level.
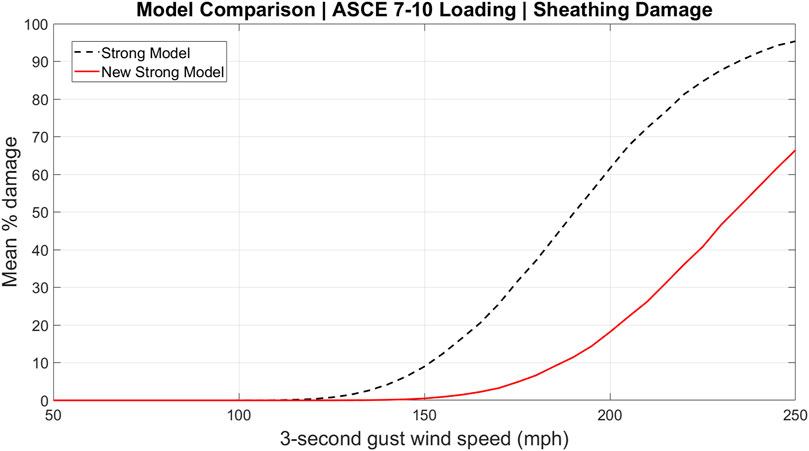
FIGURE 9. Vulnerability curves for roof sheathing damage of the strong and new strong models under ASCE 7–10 loading.
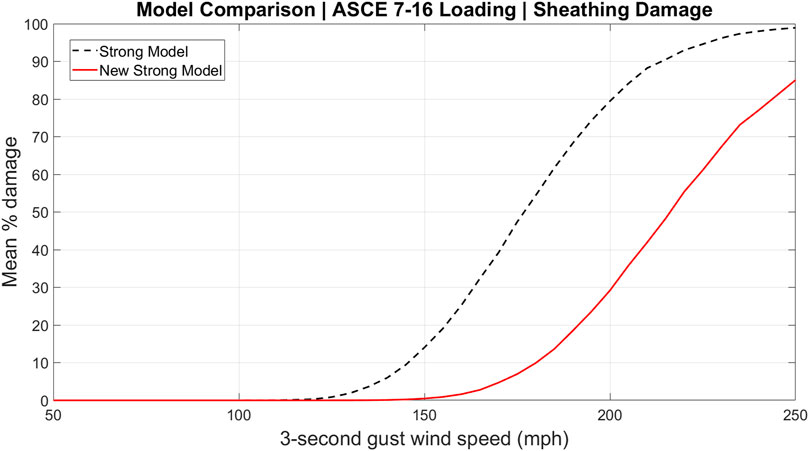
FIGURE 10. Vulnerability curves for roof sheathing damage of the strong and new strong models under ASCE 7–16 loading.
6 Conclusion and future work
The process of integrating ASCE 7–16 wind-load provisions into the FPHLM requires an understanding of the mechanical principles at work, engineering judgment, and iterative design based on analysis of previous versions. This comparative study demonstrates that the structural upgrades required to resist new uplift loads have a more significant impact on the vulnerability of the system than the new loads. The new model projections cannot be directly validated with field observations or insurance claims data, as no design-level events have impacted Florida since the enforcement of the FBC seventh Ed. The opportunity to validate this work will be pursued when nature provides. Earlier studies validating the FPHLM with insurance claims data were discussed in Section 1.
Future developments involve implementing the changes presented in this paper into more structural models in the FPHLM. Within the single family residential model, the new loading scheme will need to be developed for the hip roof, a more complex geometry than the gable roof. New strong models will need to be developed for the masonry block models. Beyond the single family residential model, both the loading-side and capacity-side changes resulting from the ASCE 7–16 wind load provisions will be explored in the manufactured housing model, the low-rise commercial residential model, and the mid-/high-rise building model.
Data availability statement
The original contributions presented in the study are included in the article/supplementary material, further inquiries can be directed to the corresponding author.
Author contributions
All authors listed have made a substantial, direct, and intellectual contribution to the work and approved it for publication.
Funding
This work is supported by Florida Office of Insurance Regulation (FOIR).
Acknowledgments
The authors wish to recognize the support of numerous FPHLM team members not directly involved in the production of this paper. The opinions, results, discussion, and conclusions are not necessarily those of the FOIR.
Conflict of interest
The authors declare that the research was conducted in the absence of any commercial or financial relationships that could be construed as a potential conflict of interest.
Publisher’s note
All claims expressed in this article are solely those of the authors and do not necessarily represent those of their affiliated organizations, or those of the publisher, the editors and the reviewers. Any product that may be evaluated in this article, or claim that may be made by its manufacturer, is not guaranteed or endorsed by the publisher.
References
Abdelhady, A. U., Spence, S. M. J., and McCormick, J. (2022). Risk and fragility assessment of residential wooden buildings subject to hurricane winds. Struct. Saf. 94, 102137. doi:10.1016/j.strusafe.2021.102137
American Society of Civil Engineers, (2017). Minimum design loads and associated criteria for buildings and other structures. Virginia, United States: American Society of Civil Engineers. ASCE/SEI 7-16. doi:10.1061/9780784414248
American Society of Civil Engineers, (2013). Minimum design loads for buildings and other structures. Virginia, United States: American Society of Civil Engineers. ASCE/SEI 7-10. doi:10.1061/9780784412916
Baheru, T. (2014). Development of test-based wind-driven rain intrusion model for hurricane-induced building interior and contents damage. Miami: Florida International University. dissertation.
Berke, P., Larsen, T., and Ruch, C. (1984). A computer system for hurricane hazard assessment. Comput. Environ. Urban Syst. 9 (4), 259–269. doi:10.1016/0198-9715(84)90026-7
Building a Safer Florida (2020a). Changes to wind loads in the. 7th Edition. Florida Building Code, Building and Residential – Impacts from ASCE 7-16. Available at: https://www.floridabuilding.org/fbc/Links_to_Code_Resources.html (Accessed July 1, 2022).
Building a Safer Florida (2020b). Florida building code – building, residential and existing building, Significant changes to roofing requirements in the 7th Edition. Available at: https://www.floridabuilding.org/fbc/Links_to_Code_Resources.html (Accessed July 1, 2022).
Chock, G., Ghosh, S. K., O’Rourke, M., and Stafford, T. E. (2018). Significant changes to the minimum design load provisions of ASCE 7-16. Virginia: American Society of Civil Engineers.
Cope, A. (2004). Predicting the vulnerability of typical residential buildings to hurricane damage. Gainesville (FL): University of Florida. dissertation.
Fema-Hazus, (2006). HAZUS-MH-MR3, multi-hazard loss estimation methodology hurricane model technical manual. Washington D.C: Dept. Of Homeland Security, Federal Emergency Management Agency, Mitigation Division.
Florida Building Commission (2020). Changes to the Florida building code. Available at: https://www.floridabuilding.org/fbc/Links_to_Code_Resources.html (Accessed July 1, 2022).
Florida International University (2021). Florida public hurricane loss model 8.1. Available at: https://www.sbafla.com/methodology/ModelerSubmissions/CurrentYearHurricaneModelSubmissions.aspx (Accessed July 1, 2022).
Friedman, D. (1975). Computer simulation in natural hazard assessment. Technical Report. Boulder, (CO): University of Colorado.
Hamid, S., Kibria, B. M. G., Gulati, S., Powell, M., Annane, B., Cocke, S., et al. (2010). Predicting losses of residential structures in the state of Florida by the public hurricane loss evaluation model. Stat. Methodol. 7, 552–573. doi:10.1016/j.stamet.2010.02.004
Hamid, S. S., Pinelli, J.-P., Chen, S., and Gurley, K. (2011). Catastrophe model-based assessment of hurricane risk and estimates of potential insured losses for the state of Florida. Nat. Hazards Rev. 12, 171–176. doi:10.1061/(ASCE)NH.1527-6996.0000050
International Code Council (2017). Florida building code, residential. Available at: https://codes.iccsafe.org/content/FRC2017 (Accessed July 1, 2022). 6th Edition
International Code Council (2020). Florida building code, residential. Available at: https://codes.iccsafe.org/content/FLRC2020P1 (Accessed July 1, 2022). 7th Edition
Ji, X., Huang, G., Wu, F., and Lu, Z. (2020). Wind-induced hazard assessment for low-rise building envelope considering potential openings. J. Struct. Eng. (N. Y. N. Y). 146. doi:10.1061/(ASCE)ST.1943-541X.0002553
Johnson, T., Pinelli, J.-P., Baheru, T., Chowdhury, A. G., Weekes, J., and Gurley, K. (2018). Simulation of rain penetration and associated damage in buildings within a hurricane vulnerability model. Nat. Hazards Rev. 19. doi:10.1061/(ASCE)NH.1527-6996.0000288
Lin, S., Chuang, W., Xu, L., El-Tawil, S., Spence, S. M. J., Kamat, V. R., et al. (2019). Framework for modeling interdependent effects in natural disasters: Application to wind engineering. Virginia, United States: ASCE. doi:10.1061/(ASCE)ST.1943-541X.0002310
Nofal, O. M., van de Lindt, J. W., Do, T. Q., Yan, G., Hamideh, S., Cox, D. T., et al. (2021). Methodology for regional multihazard hurricane damage and risk assessment. Virginia, United States: ASCE. doi:10.1061/(ASCE)ST.1943-541X.0003144
Pinelli, J.-P., Gurley, K. R., Subramanian, C. S., Hamid, S. S., and Pita, G. L. (2008). Validation of a probabilistic model for hurricane insurance loss projections in Florida. Reliab. Eng. Syst. Saf. 93, 1896–1905. doi:10.1016/j.ress.2008.03.017
Pita, G., Pinelli, J.-P., Cocke, S., Gurley, K., Mitrani-Reiser, J., Weekes, J., et al. (2012). Assessment of hurricane-induced internal damage to low-rise buildings in the Florida Public Hurricane Loss Model. J. Wind Eng. Industrial Aerodynamics 104-106, 76–87. doi:10.1016/j.jweia.2012.03.023
Pita, G., Pinelli, J.-P., Gurley, K., and Mitrani-Reiser, J. (2014). State of the art of hurricane vulnerability estimation methods: A review. Virginia, United States: ASCE, 0000153. doi:10.1061/(ASCE)NH.1527-6996.0000153
Prevatt, D. O., Hill, K. M., Datin, P. L., and Kopp, G. A. (2009). Revisiting wind uplift testing of wood roof sheathing – interpretation of static and dynamic test results. Proceedings of the Hurricane Hugo 20th Anniversary Symposium on Building Safer Communities—Improving Disaster Resilience, Charleston, South Carolina, October 22 – 23, 2009.
Ruch, C. (1984). Hurricane vulnerability analysis for aransas, kenedy, kleberg, nueces, refugio, and san patricio counties. Austin, TX: Texas A&M University for the Governor’s Division of Emergency Management.
Sciaudone, J., Feuerborn, D., Rao, G., and Daneshvaran, S. (1997). Development of objective wind damage functions to predict wind damage to low-rise structures. Baltimore, Maryland: 8th U.S. National Conf. on Wind Engineering.
Scott, D. (2018). ASCE 7-16 wind load provisions – how they affect the practicing engineer. Struct. Mag., 12–14.
Silva de Abreu, R. V., Pinelli, J.-P., Raji, F., and Zisis, I. (2020). Testing and modeling of hurricane wind-driven rain water ingress, propagation, and subsequent interior damage in residential buildings. J. Wind Eng. Industrial Aerodynamics 207, 104427. doi:10.1016/j.jweia.2020.104427
Skulteti, M. J., Bender, D. A., Winistorfer, S. G., and Pollock, D. G. (1997). Withdrawal strength of ring-shank nails embedded in southern pine lumber. Trans. ASAE 40 (2), 451–456. doi:10.13031/2013.21272
Southwest Florida Regional Planning Council (Swfrpc) (1982). Southwest Florida hurricane loss study. United states: SWFRPC.
Sparks, P., and Bhinderwala, S. (1994). “Relationship between residential insurance losses and wind conditions in hurricane Andrew,” in Hurricanes of 1992: Lessons learned and implications for the future. Editors R. Cook, and M. Sotani (Virginia, United States: ASCE), 111–124.
Strong-Tie Company, S (2021). Wood construction connectors 2021-2023. Available at: https://www.strongtie.com/resources/literature/wood-construction-connectors-catalog (Accessed July 1, 2022).
Torkian, B. B., Pinelli, J.-P., Gurley, K., and Hamid, S. (2014). Cost-and-benefit evaluation of windstorm damage mitigation techniques in Florida. Virginia, United States: ASCE, 0000122. doi:10.1061/(ASCE)NH.1527-6996.0000122
WJHG News (2017). Florida’s highest point is right in our own backyard. Available at: https://www.wjhg.com/content/news/Floridas-highest-point-is-right-in-our-own-backyard--459451853.html (Accessed July 1, 2022).
Keywords: hurricane, wind, risk modeling, vulnerability, building codes
Citation: Bedwell C, Gurley K, Pinelli J-P and Silva de Abreu RV (2022) The influence of ASCE 7–16 wind load provisions on a vulnerability model of Florida residential construction. Front. Built Environ. 8:1018207. doi: 10.3389/fbuil.2022.1018207
Received: 12 August 2022; Accepted: 19 October 2022;
Published: 02 November 2022.
Edited by:
Ahmed U. Abdelhady, Verisk Analytics, United StatesReviewed by:
Luping Yang, University of California, Berkeley, United StatesChangda Feng, Florida International University, United States
Daniel Rhee, University of Illinois at Urbana-Champaign, United States
Copyright © 2022 Bedwell, Gurley, Pinelli and Silva de Abreu. This is an open-access article distributed under the terms of the Creative Commons Attribution License (CC BY). The use, distribution or reproduction in other forums is permitted, provided the original author(s) and the copyright owner(s) are credited and that the original publication in this journal is cited, in accordance with accepted academic practice. No use, distribution or reproduction is permitted which does not comply with these terms.
*Correspondence: Christian Bedwell, Y2FiZWR3ZWxsQHVmbC5lZHU=