 Michael R. Z. Whitworth1
 Giorgia Giardina2*
 Camilla Penney3
 Luigi Di Sarno4
 Keith Adams5
 Tracy Kijewski-Correa6
 Jacob Black7Fatemeh Foroughnia2
 Valentina Macchiarulo2
 Pietro Milillo8,9Mobin Ojaghi10
 Alessandra Orfeo11
 Francesco Pugliese4
 Kökcan Dönmez12
 Yasemin D. Aktas13Josh Macabuag14
- 1AECOM, London, United Kingdom
- 2Department of Geoscience and Engineering, Delft University of Technology, Delft, Netherlands
- 3COMET, Bullard Laboratories, University of Cambridge, Cambridge, United Kingdom
- 4School of Engineering, University of Liverpool, Liverpool, United Kingdom
- 5Department of Civil and Environmental Engineering, Brunel University London, Uxbridge, United Kingdom
- 6Department of Civil and Environmental Engineering, University of Notre Dame, Notre Dame, IN, United States
- 7AKT II, London, United Kingdom
- 8Department of Civil and Environmental Engineering, University of Houston, Houston, TX, United States
- 9Microwaves and Radar Institute, German Aerospace Center (DLR), Oberpfaffenhofen, Germany
- 10Independent Professional, London, United Kingdom
- 11Department of Civil and Environmental Engineering, University of Strathclyde, Glasgow, United Kingdom
- 12Department of Earthquake Engineering, Boğaziçi University, Istanbul, Turkey
- 13Department of Civil, Environmental and Geomatic Engineering, University College London, London, United Kingdom
- 14World Bank / Independent, London, United Kingdom
On 14th August 2021, a magnitude 7.2 earthquake struck the Tiburon Peninsula in the Caribbean nation of Haiti, approximately 150 km west of the capital Port-au-Prince. Aftershocks up to moment magnitude 5.7 followed and over 1,000 landslides were triggered. These events led to over 2,000 fatalities, 15,000 injuries and more than 137,000 structural failures. The economic impact is of the order of US$1.6 billion. The on-going Covid pandemic and a complex political and security situation in Haiti meant that deploying earthquake engineers from the UK to assess structural damage and identify lessons for future building construction was impractical. Instead, the Earthquake Engineering Field Investigation Team (EEFIT) carried out a hybrid mission, modelled on the previous EEFIT Aegean Mission of 2020. The objectives were: to use open-source information, particularly remote sensing data such as InSAR and Optical/Multispectral imagery, to characterise the earthquake and associated hazards; to understand the observed strong ground motions and compare these to existing seismic codes; to undertake remote structural damage assessments, and to evaluate the applicability of the techniques used for future post-disaster assessments. Remote structural damage assessments were conducted in collaboration with the Structural Extreme Events Reconnaissance (StEER) team, who mobilised a group of local non-experts to rapidly record building damage. The EEFIT team undertook damage assessment for over 2,000 buildings comprising schools, hospitals, churches and housing to investigate the impact of the earthquake on building typologies in Haiti. This paper summarises the mission setup and findings, and discusses the benefits, and difficulties, encountered during this hybrid reconnaissance mission.
1 Introduction to the Mission
On 14th August 2021, at 0829 local time, a shallow earthquake of magnitude 7.2 struck the Tiburon Peninsula in the Caribbean nation of Haiti, approximately 150 km west of the capital Port-au-Prince. The main earthquake was followed by numerous aftershocks, with the largest to date being a magnitude 5.7 on 15 August 2021. Several thousand landslides (Martinez et al., 2021) were also triggered, by both the earthquake and subsequent rainfall from Tropical Cyclone Grace, which hit Haiti on 16 August 2021. The earthquake is estimated to have killed over 2,000 people, injured over 15,000, and damaged and destroyed 137,000 houses, affecting over 800,000 people in total (UN Office for the Coordination of Humanitarian Affairs (UN OCHA), 2021). According to the Post-Disaster Needs Assessment (PDNA), total damages and loss are estimated at US$ 1.62 billion, while recovery needs are estimated at US$ 1.98 billion.
The socio-economic and political system in Haiti is extremely complex (Oliver-Smith, 2010). Haiti is one of the poorest countries in the world, ranked 168 out of 187 on the human development index (UNDP, 2015) with almost 25% of the population living in extreme poverty on less than $1.25 per day (UNDP, 2013). At the time of the 2021 earthquake, Haiti was still recovering from the devastating earthquake of 2010, which killed over 150,000 and left 1.5 million homeless. The 2010 earthquake led to significant migration from the east to the west of Haiti, leading to a change in vulnerability and susceptibility in these areas to future earthquakes and other hazards such as Hurricane Matthew, which hit Haiti and the Tiburon Peninsula in 2016. Figure 1 shows the change in population between 2010 and 2021 in Les Cayes, a city in the southwest of Haiti. At the time of the 2021 earthquake, the Haitian President, Jovenel Moïse, had recently been assassinated, leading to significant instability, with relief efforts interrupted due to increased gang violence and insecurity.
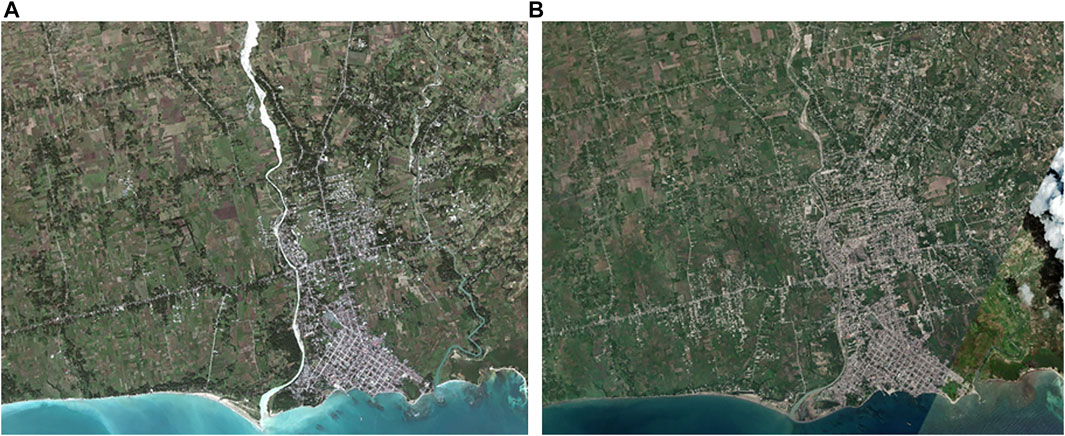
FIGURE 1. Satellite Imagery of Les Cayes in the south-east of Haiti (A) in 2010 and (B) in 2021, showing the change in population density following the 2010 earthquake and before the 2021 earthquake.
The nature of structural damage and geotechnical failures after an earthquake are perishable data, yet provide crucial information to inform future disaster risk reduction (e.g. Bray et al., 2018). Normally such data would be collected through in-person reconnaissance missions. However, the instability and insecurity discussed above, combined with Haiti being on the UK government “red list” for Covid-19 and the UK Foreign and Commonwealth Office’s “do not travel” list, both at the time of the earthquake and in the immediate aftermath, prevented undertaking an in-person mission from the United Kingdom. Instead, a remote (or virtual) mission was the most appropriate approach to investigate the impact of the disaster. This paper discusses the team involved and motivations behind undertaking such a mission (Section 1), summarises the mission’s findings in terms of seismotectonics (Section 2), remote sensing (Section 3) and building damage assessment (Section 4), before discussing the main lessons learnt for undertaking hybrid post-earthquake reconnaissance.
1.1 EEFIT and the Structure of the Remote Mission
The Earthquake Engineering Field Investigation Team (EEFIT) is a joint venture between industry and academia, conducting field investigations following major earthquakes with the following objectives (Booth et al. 2011):
• Carry out detailed technical evaluations of the performance of structures, foundations, civil engineering works and industrial plants within affected regions.
• Collect geological and seismographic data, including strong motion records.
• Assess the effectiveness of earthquake protection methods, including repair and retrofit, and compare performance with designer expectations.
• Study disaster management procedures and socio-economic effects of earthquakes.
Following the earthquake on the 14th August 2021, the EEFIT Committee convened to review the appropriateness of a mission to Haiti and whether a mission would be in-person or remote. Due to a range of issues, it was agreed that a remote mission was the only feasible option. However, data on the performance of structures in Haiti was critical to EEFIT. This data was obtained through collaboration with the Structural Extreme Events Reconnaissance (StEER) team, who were mobilising a group of local non-experts to rapidly record building damage. It was agreed that EEFIT could support these endeavours through undertaking a range of virtual assessments and data analysis.
Based on the available data sets, including earthquake records, optical and InSAR remote-sensing data sets, and building damage assessments collected by StEER; coupled with the expertise of the members of the Haiti EEFIT mission, the remote deployment was designed around four themes or workstreams (Figure 2). These workstreams linked to the core EEFIT mission objectives. Workstream 1 was focused on characterising the event, first, by understanding the geological and tectonic setting of the earthquake and, second, by evaluating strong ground motion records to determine peak ground accelerations (PGA) and seismic intensities, and to investigate how these compared to pre-existing building codes. Workstream 2 aimed to evaluate the applicability of remote-sensing techniques in the context of post-disaster assessments. This workstream used optical imagery to evaluate building damage and landslide occurrence, coupled with InSAR to evaluate deformation and displacement. Workstream 3 used the StEER building damage data set to undertake damage assessments of a range of building types and interrogate the data for any trends, or broader lessons for future building construction. Workstream 4’s objective was to understand the socio-economic and political context of the earthquake and the immediate response, with the aim of investigating Haiti’s ability to recover from such events.
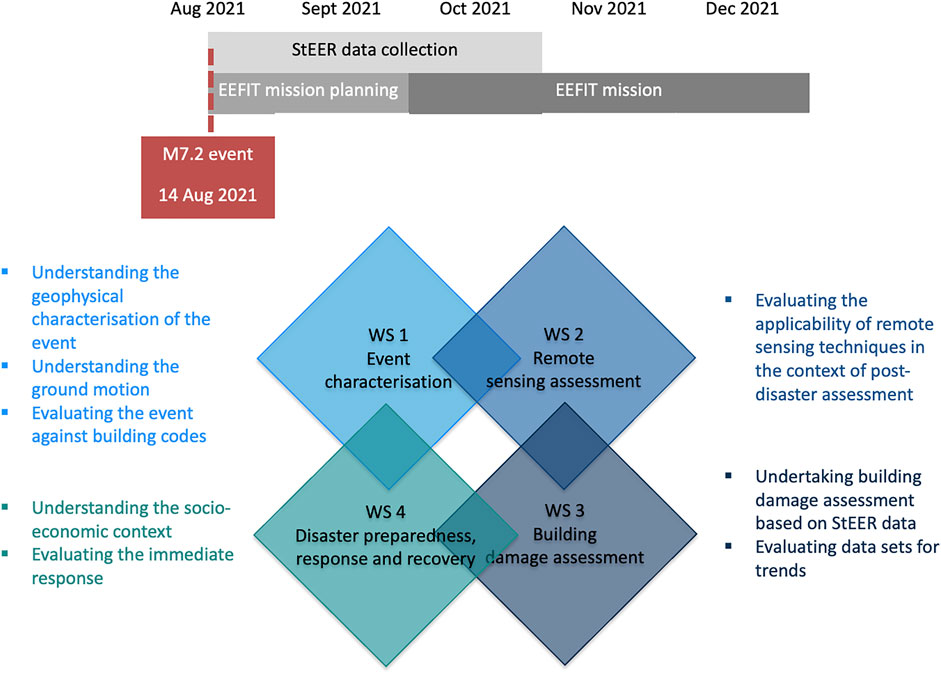
FIGURE 2. Timeline and structure of the remote mission into four workstreams.
This paper focuses on the initial observations and findings of this remote EEFIT Mission to Haiti. We evaluate the utility of such missions for understanding the impact of earthquakes compared to in-person missions, such as the EEFIT Missions to Haiti in 2010 (Booth et al., 2011) and to Nepal in 2015 (Wilkinson et al., 2019).
2 Characterisation of the Event
The seismotectonics of Haiti, and Hispaniola, of which Haiti forms the western part, are controlled by the east-north eastwards convergence of the Caribbean plate, to the south, with the North American plate, to the north (Figure 3). The plates are converging at about 20 mm/yr (DeMets, 2001; DeMets et al., 2010). Moving from east to west along the plate boundary the convergence becomes progressively more oblique, transitioning from subduction sub-perpendicular to the plate boundary in the lesser Antilles, to highly oblique convergence in Hispaniola (Calais et al., 2016). This oblique motion is accommodated across a series of microplates and deformation zones, with the compressional component predominantly taken up by offshore thrust faults to the north and south of Hispaniola. The strike-slip component of the motion is taken up on two left-lateral strike-slip faults which dominate the geomorphology of Haiti; the Septentrional fault to the north, and the Enriquillo-Plantain-Garden fault (EPGF) to the south. The EPGF strikes east-west along Haiti’s southern peninsula and has been proposed to connect offshore with strike-slip faults in Jamaica. This fault is thought to have hosted a series of major historic earthquakes in the late 18th and early 19th centuries, with intensity magnitudes estimated between 6.6 and 7.5 (Bakun, Flores, ten Brink, 2012). Mann et al. (1995) interpreted the EPGF as a sub-vertical fault accommodating pure left-lateral strike slip, which is still the interpretation used in the Haitian seismic hazard map (Frankel et al., 2011) but has been questioned based on observations from a magnitude 7 earthquake which occurred on 12th January 2010, as discussed below.
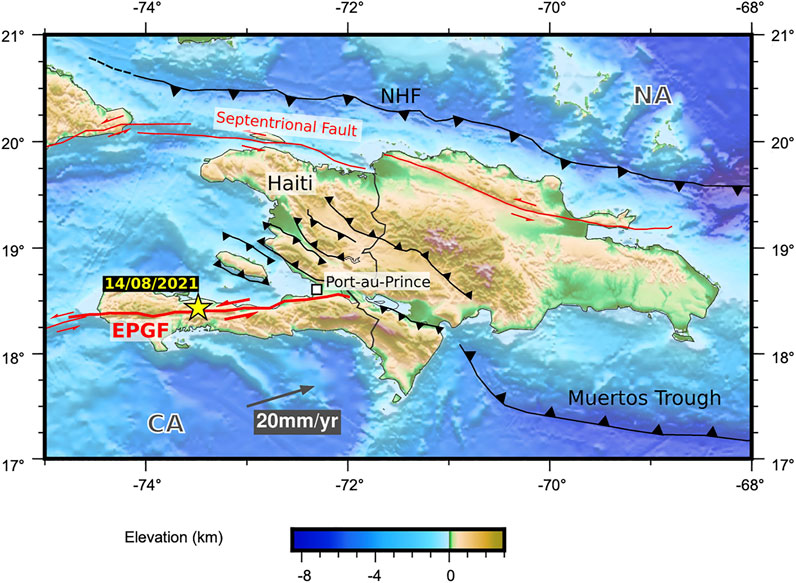
FIGURE 3. Regional Tectonics–faults from Saint-Fleur, Feuillet and Klinger (2019) and Symithe et al. (2015). The tectonics of Hispaniola, of which Haiti forms the western part, is governed by the oblique convergence of the Caribbean plate (CA) with the North American plate (NA) at ∼20 mm/yr (DeMets et al., 2010), which leads to both compressional motion on thrust faults (black lines, triangles are on hanging wall side) and left-lateral strike-slip faulting (red lines). EPGF is the Enriquillo-Plaintain-Garden Fault, the major strike-slip fault in southern Haiti. NHF is the Northern Hispaniola Fault. The yellow star shows the epicentre of the 14th August 2021 earthquake.
The epicentre of the 14th August 2021 earthquake was almost directly on the mapped trace of the EPGF near the town of L’Asile (Figure 4), with a shallow depth of ∼10 km (USGS, 2021). However, initial seismological results demonstrated that the earthquake was not a pure strike-slip event. Instead, about 17% of the movement was compressional and the earthquake occurred on a dipping plane (USGS, 2021). InSAR-derived ground surface displacements (discussed further in section 3) are consistent with the earthquake slip having a vertical component, and finite-fault inversions (Raimbault et al., 2021; USGS, 2021) demonstrate that the fault plane likely dipped to the north and was oblique, with both left-lateral and compressional slip. The fault dip is important, both because of its implications for the seismotectonics of Haiti, and because having a dipping fault means that the Boore-Joyner distances (the shortest distance between a building and the surface projection of the earthquake rupture, and a key parameter in ground motion prediction equations) will decay more slowly away from the epicentre than for a vertical fault i.e. that buildings might be expected to experience stronger ground motions over a wider area.
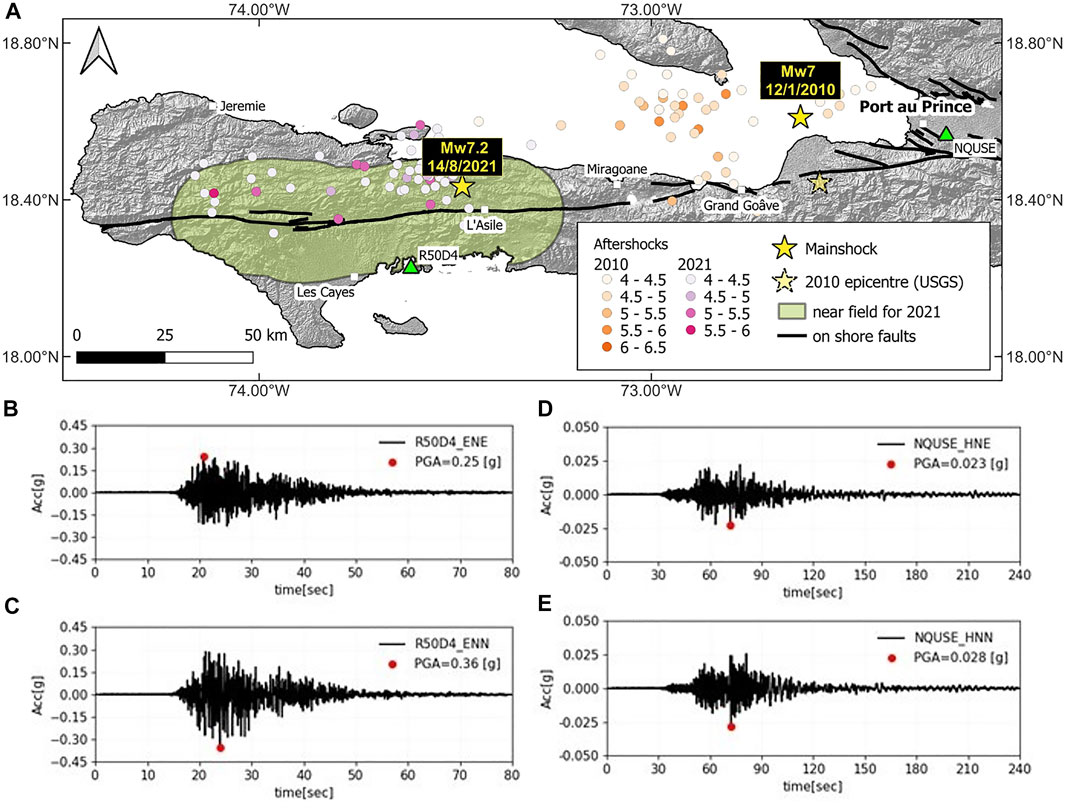
FIGURE 4. (A) 2021 and 2010 earthquakes, and aftershocks. The mainshock epicentres are shown as yellow stars. The initial USGS epicentre for the 2010 earthquake is shown as a semi-transparent star. Aftershocks of the 2010 earthquake are in orange, shaded by moment magnitude, aftershocks for the 2021 earthquake recorded by the Ayiti-seismes, 2022 network (Calais et al., 2020) are shown in pink, shaded by reported magnitude. Black lines are onshore active faults from Saint-Fleur et al., 2020. Green shading shows the approximate near field (≤15 km from fault trace) region for the 2021 mainshock (the rupture extent is based on the USGS, 2021, finite fault solution, and that of Raimbault et al., 2021). Green triangles show the location of the strong ground motion stations used to calculate spectral accelerations in (B–E) and Figure 5. (B–C) E and N acceleration records for station R50D4 (on the edge of the “near field” region. (D–E) E and N acceleration records for station NQUSE ∼150 km from the epicentre in Port-au-Prince. Acceleration records are from the Ayiti-seismes, 2022 network (Calais et al., 2020) downloaded from IRIS.
Limited on-the-ground access has made mapping and identification of surface ruptures challenging. Although many of the citizen science seismometers in the Ayiti-seismes, 2022 network (Calais et al., 2020) were not operational at the time of the earthquake, a single raspberry shake R50D4 provided a record of strong ground motions ∼15 km from the earthquake (on the edge of the seismic code’s definition of “near-field”; Ministère des Travaux Publics, Transports et Communications (MTPTC), 2012), and the station NQUSE in the American embassy provided an additional in-country record of strong ground motion (Courboulex et al., 2021). The availability of strong ground motion records is in stark contrast to the last major earthquake in Haiti, which occurred on 10 January 2010. At the time of that magnitude 7 earthquake, there were no strong ground motion instruments in Haiti, so ground motions had to be inferred based on building damage and aftershocks (Hough et al., 2010).
The magnitude of the 2021 earthquake was 7.2, meaning that it released about twice as much energy as that in 2010. However, the epicentre of the 2021 earthquake was ∼100 km west of that in 2010 (Figure 4), away from the major population centre in Port-au-Prince, which meant that the death toll was almost two orders of magnitude lower. Similar to the 2021 earthquake, the 2010 earthquake was initially thought to have occurred on the EPGF based on its epicentral location (e.g. Hayes et al., 2010). However, more detailed seismological and geodetic analysis demonstrated that the earthquake actually ruptured a previously unmapped fault (the Léogâne fault; Calais et al., 2010) and had a significant thrust component (Calais et al., 2010; Hayes et al., 2010). Subsequent GPS data have demonstrated compressional strain accumulation perpendicular to the eastern end of the EPGF but concluded that the fault-perpendicular motion was negligible further west, including in the region which ruptured in 2021 (Symithe & Calais, 2016; Saint Fleur, Klinger, Feuillet, 2020). The occurrence and nature of the 2021 earthquake, therefore, reinforces the message of the 2010 earthquake that the faulting in Haiti is more complex than has historically been assumed and that further work is needed to fully understand the seismic hazard in this region.
As well as highlighting previously unmapped faults, the 2010 earthquake led to the creation of new seismic hazard maps for Haiti (Frankel et al., 2011) as well as the creation of a national annexe to ASCE/SCI 7-05, 2005; (MTPTC, 2012); the spectra for the maximum credible earthquake and design spectra in this annex are shown in Figure 6). However, these maps were still dominated by strike-slip motion on the assumed vertical EPGF. Two other major caveats are: 1) that publicly available Vs30 measurements for most of Haiti (shear wave velocity at 30 m depth, a key control on ground motions) are based on topographic gradients (Wald & Allen, 2007 cited in; Frankel et al., 2011) rather than in-situ measurements and 2) that there are no specific ground motion prediction equations for Haiti. One of our aims for this mission, therefore, was to compare the recorded ground motions to the seismic code.
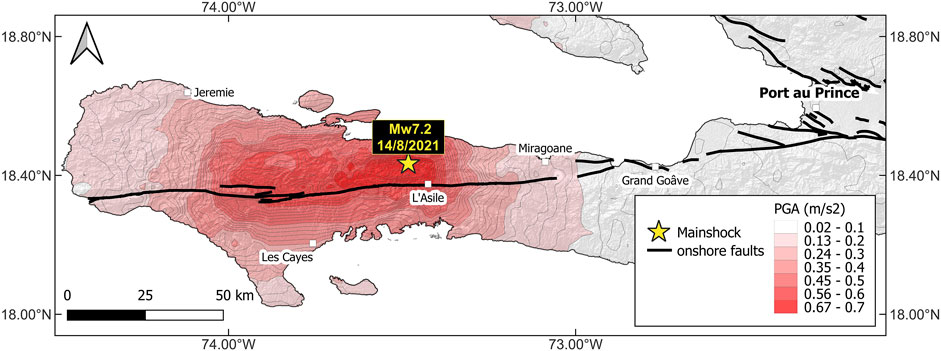
FIGURE 5. Peak Ground Accelerations for the 2021 earthquake modelled by the USGS (USGS, 2021). Darker reds indicated higher peak ground accelerations. The ∼70 km length of the fault plane used for finite fault modelling leads to an approximately east-west striking band of predicted high peak ground accelerations.
Peak ground accelerations at R50D4 and NQUSE were 0.36 and 0.023 g respectively (Figure 4C,E, compared to Figure 5 modelled peak ground accelerations). NQUSE is sited in the US embassy in Port-au-Prince, more than 100 km from the epicentre. Since the southern peninsula of Haiti is very narrow (<15 km wide in places) almost the whole width of the peninsula within the rupture region is near-field (Figure 4). Figure 6 therefore compares the spectral accelerations for near-field ground shaking for the maximum credible earthquake, and the design level in the current code to those observed at R50D4. At periods less than about 1 s, which are of relevance for Haiti since most buildings have 1 or 2 storeys, the accelerations from the 2021 earthquake are less than those for the maximum credible earthquake. However, they exceed the design level, meaning that even buildings built to code, which many are not, might be expected to have experienced plastic deformation. Although no single earthquake can invalidate a code based on a particular return period, the fact that the design accelerations have been exceeded less than a decade after the code’s introduction suggests further work is required to fully explore and understand seismic hazard in Haiti.
3 Remote Sensing
Earth-Observation satellites can provide frequent imagery of very large areas worldwide, enabling the observation of locations that are difficult or dangerous to access with traditional survey methods (Milillo et al., 2016), and providing a wide-angle view of major disasters and their impact on the built environment. Satellite remote-sensing data is typically released between a few hours and few days after an earthquake (Yun et al., 2015), and can provide sub-centimetre accuracy (Bürgmann et al., 2000), sub-metre resolution and daily-to-weekly revisit times. Such data enables a close-up view of buildings and structures while capturing large-scale movements and providing a broad overview of the extent of damage caused by the disaster. In the context of post-earthquake reconnaissance, the most frequently used space-borne remote sensing techniques are Synthetic Aperture Radar Interferometry (InSAR) and Optical/Multispectral imagery.
InSAR uses radar images acquired by satellites to measure deformation of the Earth’s surface. The satellite radar antenna emits an electromagnetic signal in the microwave frequency band toward the ground surface and receives signals scattered back from the Earth to the satellite (Bamler, 2000). The backscattered signal is used to generate a SAR image which contains information on the phase and amplitude of the signals. As the phase is recorded as a function of the satellite positions and image acquisition time, the phase difference between two radar acquisitions can be used to estimate ground deformations along the look direction (LOS) of the satellite radar antenna (Bürgmann et al., 2000). Pre- and post-event SAR images can be used to estimate earthquake-induced ground deformation (Stramondo et al., 2005; Chini et al., 2008). InSAR deformation measurements can also be used to identify relationships between co-seismic ground deformations and building damage (Yun et al., 2015; Barba-Sevilla et al., 2018; Li et al., 2021).
Optical/multispectral images are collected by satellite sensors operating in the optical part of the electromagnetic spectrum, which includes visible, near-infrared and short-wave infrared wavelengths. Thanks to the use of optical wavebands, optical/multispectral imagery is very similar to common photographs, making its interpretation easier than InSAR data. However, in contrast to InSAR techniques, optical/multispectral sensors cannot penetrate dense clouds. In geographic regions with frequent cloud coverage, this can result in limited observation capabilities. In the context of post-earthquake assessment, a wealth of literature has investigated the possibility of using optical imagery to assess structural damage based on the extraction of building characteristics, such as texture, geometric shape, and spectral reflectance (Anniballe et al., 2018; Ji et al., 2018), or to detect secondary-induced hazards, such as landslides (Zekkos et al., 2017).
Two main types of methods are traditionally used to analyse optical data: visual interpretation and image classification techniques (Bai et al., 2018; Duarte et al., 2018; Rathje et al., 2005). Visual interpretation can involve a manual superimposition of pre- and post-earthquake images to detect damaged structures, or the evaluation of only post-event images to map the occurrence of secondary hazards, such as landslides. Image-enhancement techniques can involve automated change detection between two pre- and post-event images, or automated classification, such as Convolutions Neural Networks (CNN) and Normalised Difference Vegetation Index (NDVI), of post-event data.
The following two sections show the results of using InSAR and optical/multispectral images for the characterization of co-seismic displacements and the identification of landslides caused by the 2021 magnitude 7.2 Haiti earthquake.
3.1 InSAR-Based Deformation Maps
Two pairs of pre- and post-event images were processed to derive the co-seismic deformations caused by the 14th August 2021 earthquake (Figure 7). The images were acquired before and after the event by the Sentinel-1A/B satellites, which operate at C-band, i.e. with a signal wavelength of 5.6 cm, and acquire interferometric images every 6-days using both satellites. The images were processed using the topsApp.py processor of the InSAR Scientific Computing Environment (ISCE) v.2, an open-source software developed and released by the NASA Jet Propulsion Laboratory (Rosen et al., 2012). Figure 7A shows the resulting interferogram maps for the ascending (i.e. satellite travelling from south to north) and descending (i.e. satellite travelling from north to south) geometry. Each contour indicates a movement in the LOS direction equal to half of the sensor wavelength. Thus, those areas with more closely spaced contours, around and west of the epicentre, exhibit a greater amount of deformation in the LOS direction.
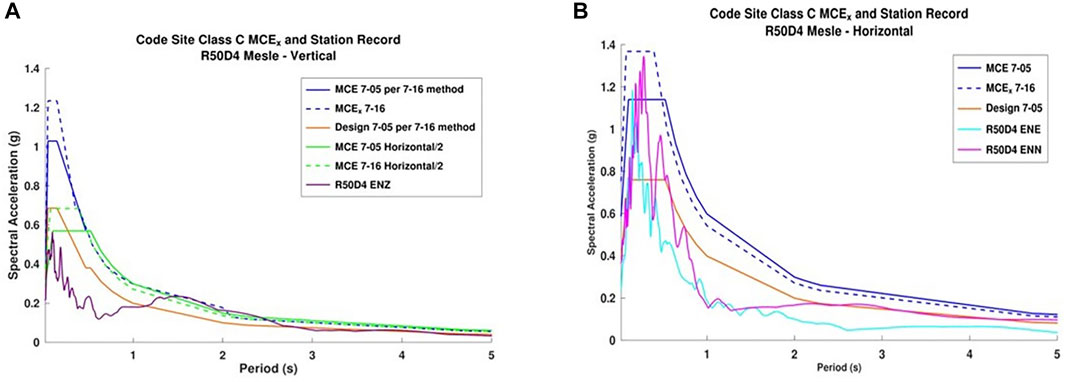
FIGURE 6. Spectral accelerations at R50D4 from the 14th August 2021 earthquake. (A) vertical component. (B) horizontal motion. MCE is maximum credible earthquake, showing the 7–05 and 7–15 ASCE/SEI standards, and the design spectra for the 7–05 standard, to which Haiti has a national annexe (MTPTC, 2013).
The differential phase values contained in the interferograms were later converted into actual displacement units (metre). Figure 7B shows the map of surface displacements for ascending and descending geometries. Each pixel indicates a change in distance along the satellite LOS between pre- and post-event acquisitions. Positive and negative values correspond to LOS displacements toward and away from the satellite, respectively. Results indicate that the blue area close to the epicentre moved toward the satellite by up to 0.5 m.
3.2 Optical-Based Landslide Detection
Previous evidence from field reconnaissance missions has identified that earthquake-induced landslides can pose a secondary risk to the built environment. Landslides contribute a significant number of fatalities and can lead to obstruction and damage of adjacent infrastructure (Jones et al., 2019; Whitworth et al., 2020). Furthermore, earthquake-induced landslides can have long-term impacts on the landscape, increasing susceptibility to future landslide events (Jones et al., 2021). To determine the effects of earthquake-induced landslides on key infrastructure, we used optical imagery to evaluate landslide activations and their impacts. We first carried out large-scale mapping using Sentinel-2 imagery captured pre- and post-earthquake (Figure 8) and then investigated the impact of landslides on transport infrastructure.
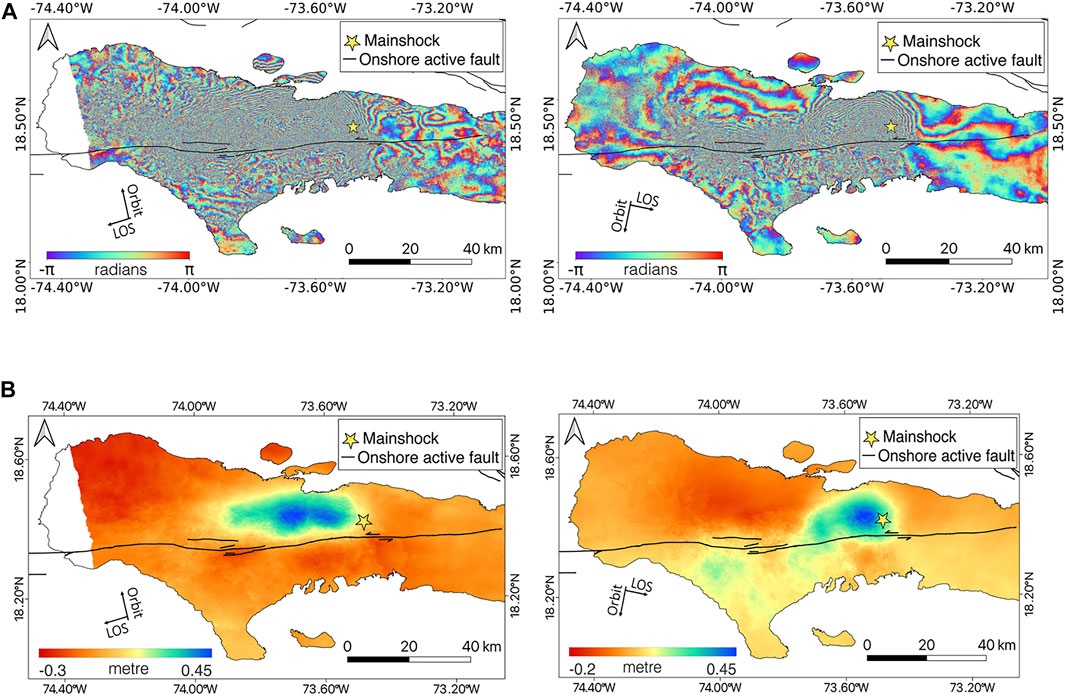
FIGURE 7. (A) Co-seismic interferograms and (B) surface displacement maps obtained by processing (left) a pair of Sentinel-1 SAR images acquired on 05 August and 17 August 2021 from ascending acquisition geometry, and (right) a pair of Sentinel-1 SAR images acquired on 03 August and 15 August 2021 from descending acquisition geometry. The yellow star indicates the earthquake epicentre. Black lines are onshore active faults from Saint-Fleur et al., 2020.
Due to the potentially large number of earthquake-induced landslides, covering a wide area, multispectral Sentinel-2 imagery was selected. To identify landslides in pre- and post- Sentinel-2 Earthquake Imagery we used the Image Differencing approach (Lu et al., 2004) as detailed in Close et al. (2021). Based on the assumption that earthquake-induced landslides would be highlighted on different spectral bands, we used a range of different approaches to attempt an automatic landslide detection. These include the Normalised Difference Vegetation Index (NDVI) Change (Ji and Peters, 2003), Normalised Difference Built up Index (NDBI) Change (Zha et al., 2003) and Brightness Index (BI) Change (Escadafal, 1989).
Figures 8C,D show some example outputs from the analysis. However, we found that these automated approaches could not adequately distinguish between landslides and cloud cover, despite training the system to classify landslides and clouds separately. Therefore, we mapped the landslides manually in the post-earthquake true-colour Sentinel-2 imagery.
To evaluate the impact of landslides on transport infrastructure, we used higher resolution Worldview-1 and Worldview-2 imagery, in combination with an OpenStreetMap (OSM, 2021) database of roadways in Haiti. The employed optical data consisted of pre- and post-event Worldview-1, Worldview-2 and Worldview-3 images released by MAXAR (Maxar, 2021) 2 days after the earthquake, as part of the MAXAR Open Data Program. Such images have a resolution between 30 and 90 cm. The OSM road database contains vector data of road centrelines in the Tiburon Peninsula and includes information on the road length, road name, and road type, e.g., primary and secondary. We observed that some of the detected landslides had had a direct impact on adjacent infrastructure, causing damage and blocking roads. For example, Figure 9 shows two landslides blocking a primary road a few kilometres outside Cavaillon, in the South Department of Haiti. The affected infrastructure is the National Road 2, which is a key route linking the South and Nippes Departments. A visual comparison between pre- and post-earthquake optical images shows that in the first location the earthquake likely activated a new sliding body, while for the second road obstacle, the presence of an existing sliding body was already visible in April 2020, i.e. the landslide hazard could potentially have been recognised in advance.
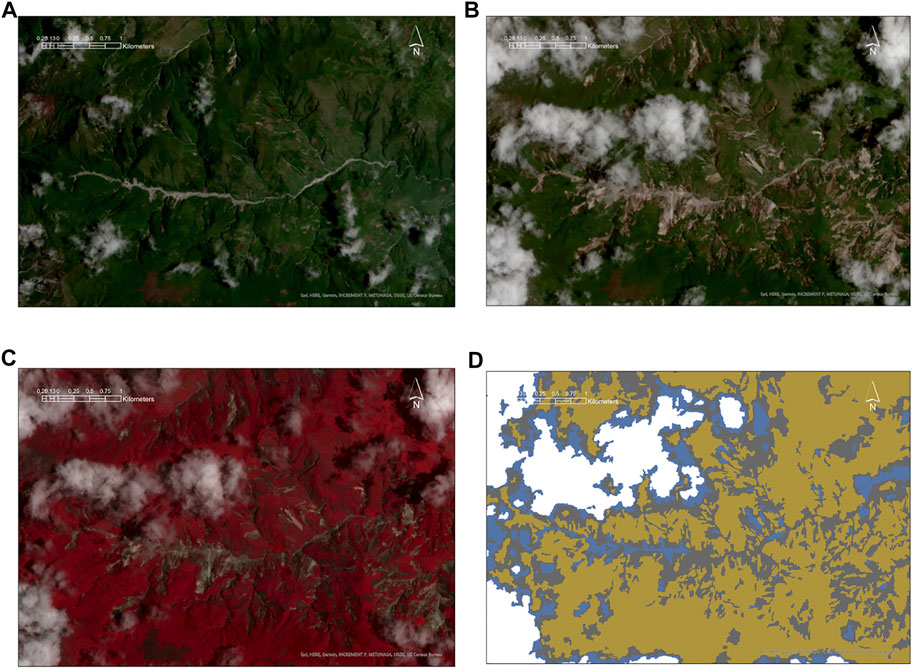
FIGURE 8. Sentinel-2 true colour Imagery (A) before and (B) after the earthquake. (C,D) processed multi-spectral Sentinel-2 imagery change detection images.
4 Building Damage Assessment
This section illustrates the results of the remote damage assessment we carried out following the 14th August 2021 earthquake. In total, an estimated 137,500 buildings were damaged or destroyed as a result of the earthquake (Haiti: Earthquake Flash Update, 2021). The EEFIT team worked with the dataset provided by the Structural Extreme Events Reconnaissance (StEER), who coordinated the collection of building damage descriptions and photographs by local Haitians (Kijewski-Correa et al., 2021). This dataset was paramount to understanding the structural damage distribution. The database includes a map of Haiti with the recorded buildings and their assigned damage level (Figure 10A). The EEFIT team surveyed a total of 2062 out of 11,669 buildings (data available in the Fulcrum App), and grouped them in different functional categories: schools, hospitals, churches and residential buildings. A total of 836 schools, 78 hospitals, 319 churches and 829 other buildings were assessed. The following structural classification was used for each assessed building: Reinforced Concrete with infill masonry shear walls (RC), Confined Masonry (CM), Unreinforced Masonry bearing walls (URM), Reinforced Masonry bearing walls (RM), Wood Light frames (WL), Wood with Stone infills (WS), and Unknown (UN). The damage level for each case-study building was assigned according to a rating system comparable to the European Macroseismic Scale (EMS-98), as defined in the StEER assessment manual (Miranda, 2021). The damage levels are subsequently abbreviated as: DS1 – No Damage, DS2 – Minor Damage, DS3 – Moderate Damage, DS4 – Severe Damage and DS5—Total or Partial Collapse. Figure 11 shows the percentage of each structural typology experienced and the damage distribution for buildings in different functional categories. As an example of the observations resulting from the remote assessment, the rest of this section presents some detailed insight into the assessment performed on schools (Figure 10B).
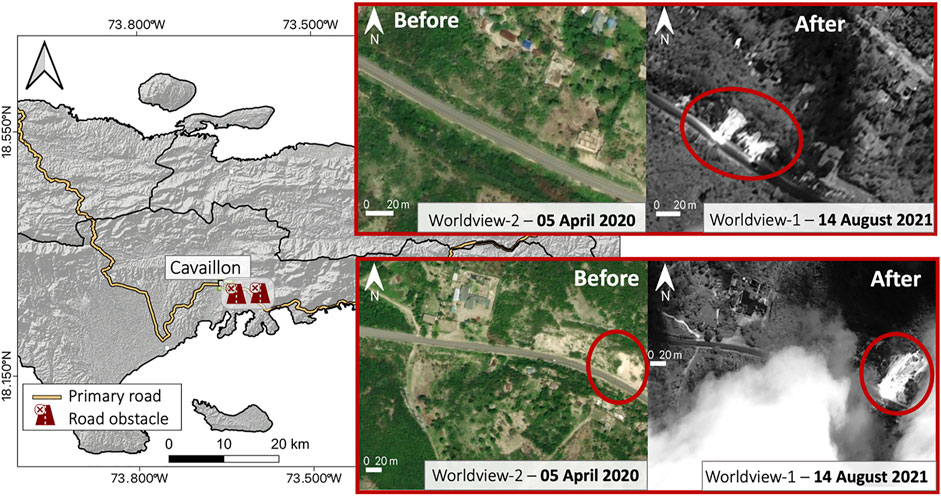
FIGURE 9. Worldview 1 and 2 imagery used to evaluate impact of landslides on infrastructure. Optical imagery are from the MAXAR Open Data Program.
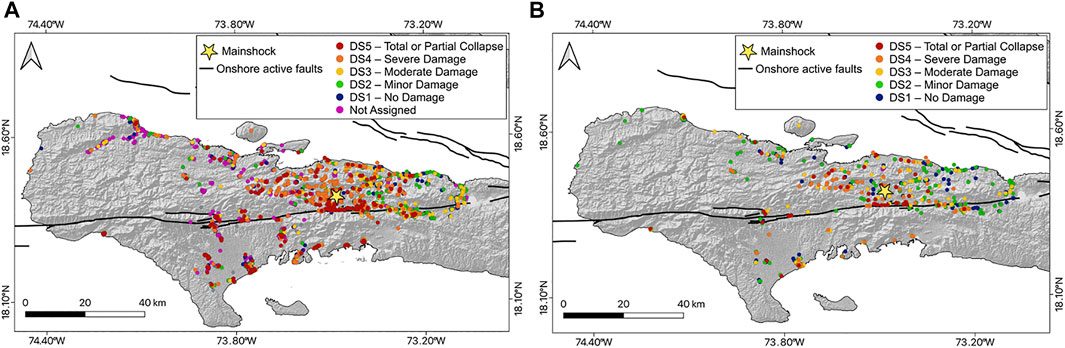
FIGURE 10. Overview of the StEER Fulcrum database showing the spatial distribution and assigned damage status of (A) all recorded structures, and (B) all surveyed schools.
Among all surveyed schools, 39.5% (330 out of 836) and 26.2% (219) were constructed out of confined masonry and concrete frame with masonry walls, respectively (Figure 11A, left). In terms of damage level, 24.9 and 38.4% of the assessed schools experienced no or minor damage, respectively (Figure 11A, right). However, a significant proportion of schools demonstrated severe damage (11.1%), or partial or total collapse (6.1%). For most building typologies, the greatest percentage of buildings experienced only minor damage. However, the most common damage level for schools made of wood light frames (WL) was no damage, and that for wooden frames with stone infill (WS) was severe damage. Damage levels by building typology are presented in Figure 12.
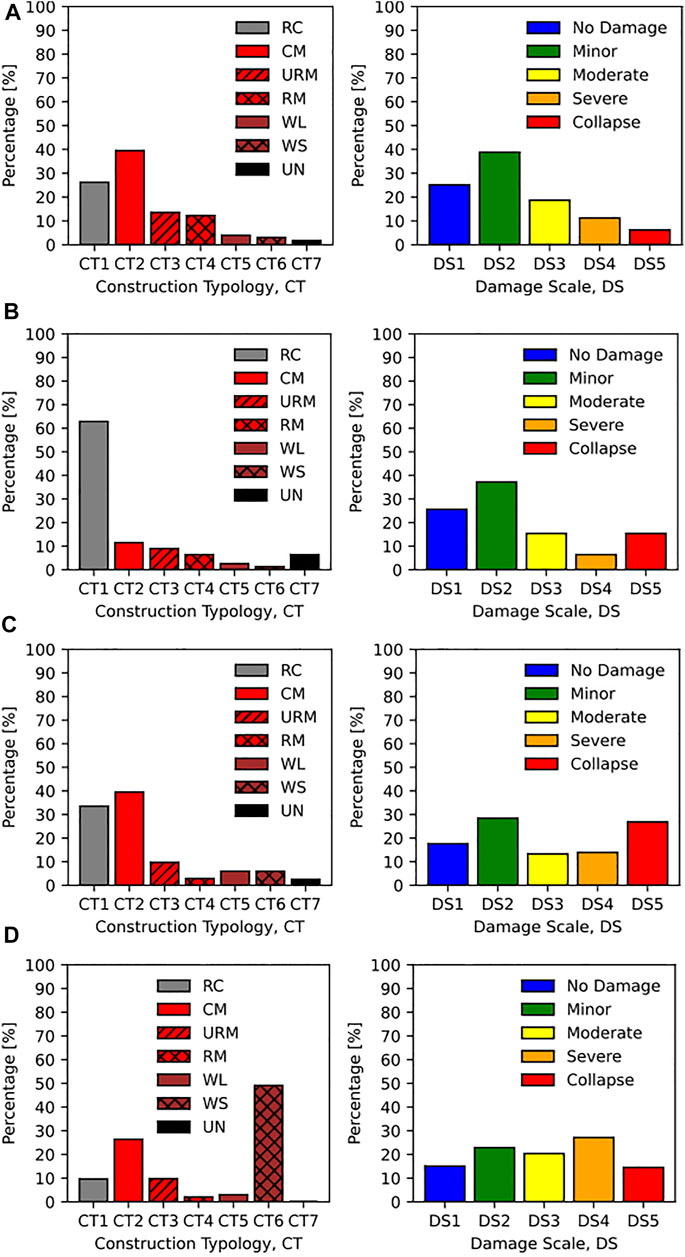
FIGURE 11. (Left column) construction typology and (right column) overall damage distribution for (A) school, (B) hospitals, (C) churches and (D) residential buildings.
In-plane and out-of-plane masonry failure were the most common failure mechanisms for the damaged schools. Vertical cracks were evident along the corners and walls of the buildings, indicating out-of-plane material failure. Horizontal and diagonal “x” shaped cracks were also present, typically around openings and along walls in-plane with the earthquake slip direction. Whilst these failure mechanisms were primarily evident in the masonry and concrete structures, failure of the connections, either from poor material strength, detailing or workmanship was evident in all building typologies. On many occasions, openings along the perimeter walls provided areas of high stress concentration where the seismic load had no clear load path to the wall and ground below. Figures 13C–F show the typical damage mechanisms experienced by the schools graded from moderate to total collapse.
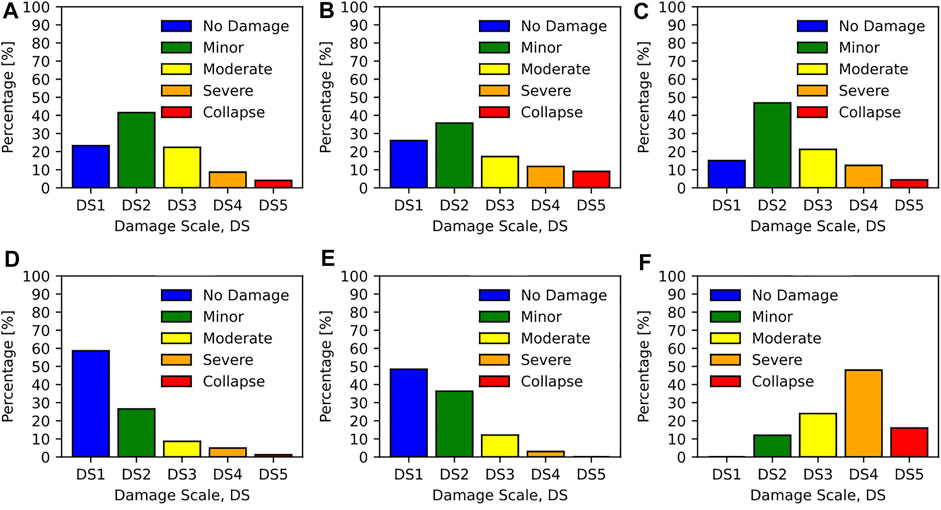
FIGURE 12. Distribution of damage grades for (A) reinforced concrete, (B) confined masonry, (C) unreinforced masonry, (D) reinforced masonry, (E) wood light frame and (F) wood schools with stone infill.
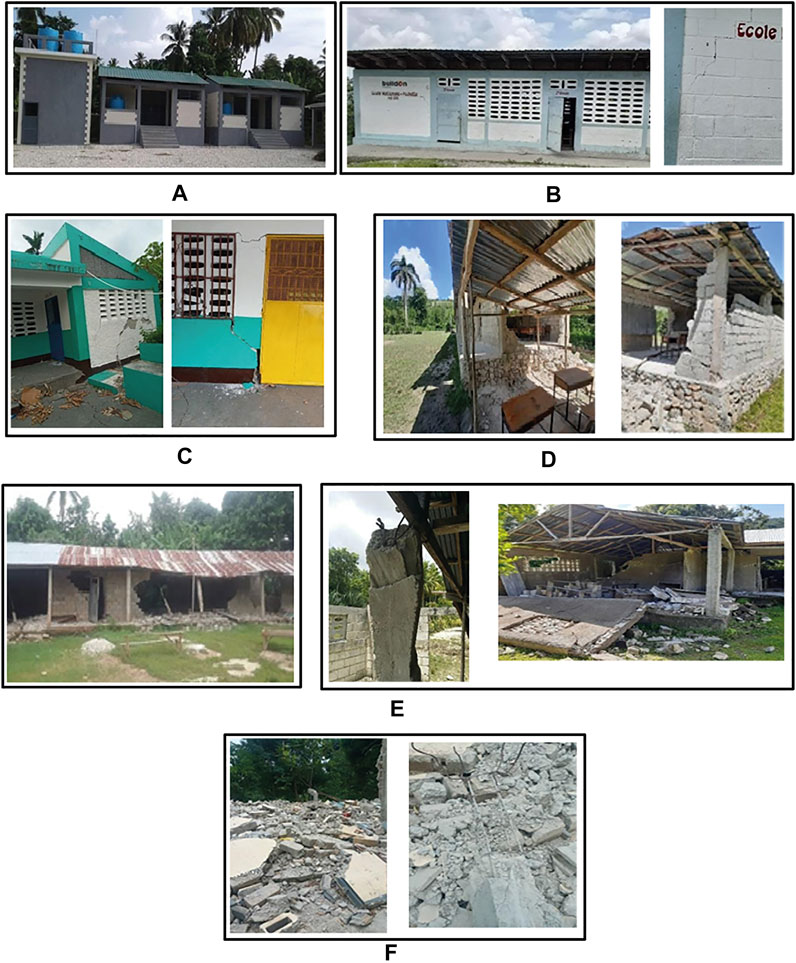
FIGURE 13. Examples of the damage grades (A) no damage, (B) minor damage, (C) moderate damage, (D) severe damage, (E) partial collapse, (F) total collapse.
Schools which performed well had regular plans and provided adequate strength and ductility. Light timber roof structures performed particularly well, experiencing little or no damage. Strong foundations and sufficient connections between the shear walls and supporting corner columns acted to dissipate the seismic forces effectively and thus reduced the damage experienced by these schools. Evidence of this is presented in Figures 13A–B.
5 Discussion
With the ongoing discussions around climate emergency and sustainability, there have been advocates for the review of in-person missions, versus utilising remotely-collected data to undertake assessments and evaluate the impact of disasters such as the Haiti Earthquake (Whitworth M. R. et al, 2020). The aim of this paper is to present the 2021 EEFIT Haiti mission in terms of the lessons it held for conducting remote missions. We now outline some of our observations about the (dis)advantages of carrying out such post-earthquake reconnaissance remotely. In doing so we note that some of these observations are likely to be mission-specific, depending on the geographic setting, team membership and pre-existing connections to the affected community inter alia. We nonetheless hope that these insights will be instructive for future missions, remote or otherwise.
Although the mission was remote, in the sense that the team didn’t travel to Haiti, it relied heavily on data collected in person. The StEER dataset which underpinned our building damage assessments was collected by Haitian volunteers, mostly non-engineers. Their pictures, notes and recordings were critical to our assessments of building damage, particularly for identifying minor and moderate damage, such as cracking, which cannot be detected remotely. It is therefore important to recognise that this mission was not truly remote, and that, at least at the moment, conducting a genuinely remote mission without the involvement, hard work and commitment of locals, often working under challenging conditions, is not possible. Calling such missions remote has the potential to privilege work done by trained engineers, and more generally workers from the Global North, over that carried out by local communities. It is important that future teams conducting “remote” missions recognise and consider the hierarchies of knowledge implicit in their choice of terminology.
Local reporting also provided the only human connection EEFIT team members had to the disaster. As well as showing the damage to buildings, many of the audio recordings gathered made clear the trauma of the loss of homes and livelihoods, which extends far beyond structural damage. Showing damaged buildings as coloured dots on a map, without the experience of going to, and assessing, the situation in person has the potential to disconnect built infrastructure from the human experience it represents. However, the pictures which Haitian volunteers had collected did bring this experience into focus. In many cases, it was challenging to distinguish whether features of a building, such as tarpaulined walls, represented a temporary repair to earthquake damage or pre-earthquake living conditions. Such challenges highlighted to team members the idea, which has long been recognised in disaster studies, that the conditions of vulnerability which enable a hazard, such as an earthquake, to become a disaster, also mean that the normal living conditions of vulnerable people are frequently indistinguishable from what might be identified as a disaster in another context (e.g. pp.10, Hewitt, 1983; Aronsson-Storrier and Dahlberg, 2021).
We expect that this understanding, of the socio-cultural context of the disaster, would have been more evident had the team been in Haiti. Similarly, though the StEER dataset provided an invaluable resource, there were frustrations in using it associated with not having collected the data ourselves (such as pictures taken at awkward angles or not capturing key structural elements). Perhaps more importantly, however, it was hard to recognise the challenges which the people capturing the data had faced in doing so, both as non-engineers and due to the unstable political situation in Haiti at the time.
A lack of social relations and human connections to Haiti was a more generalised problem of the mission. Not being in-country made it harder to connect directly with appropriate stakeholders, making it more difficult to ensure that the lessons learned have tangible benefits for the affected communities. Local information and knowledge about the impacts of the earthquake, and locally specific factors which might have contributed to building damage, were also missing from a remote mission. These difficulties are partly mission-specific. The political situation in Haiti at the time and EEFIT’s lack of pre-existing in-country contacts meant that it was challenging to build connections and talk to people with appropriate local knowledge, irrespective of the team’s physical location. However, we think that being present in-country would have provided more opportunities for developing such connections and directly interacting with regional stakeholders. This lack of connection also impacted our assessment and understanding of WS4 Disaster Response and Recovery (Figure 2). It is important to note that whether in person or remote, field missions need to be carefully planned in order not to impact ongoing relief and recovery efforts. The status of the relief and recovery effort at the time of the mission may have impacted people’s availability to engage.
There were also limitations to the team being remote in terms of our assessment of the geophysical impacts of the earthquake. InSAR and seismological data are now routinely available shortly after an earthquake, along with models of how and when the causative fault slipped during an earthquake (e.g. USGS, 2021). These data provided a useful guide to understanding the physical properties of the earthquake, its seismotectonic implications (section 2) and the associated large-scale ground motions. Recent studies have also demonstrated the possibility of using optical image correlation to map surface ruptures at scales as small as ∼20 cm (Milliner & Donnellan, 2020). However, in practice, smaller-scale features, such as surface ruptures, remain challenging to map remotely due to the limited availability of affordable high-resolution optical imagery. It may also be difficult to interpret such features without an on-the-ground context. For instance, even for the Ridgecrest earthquake (2019) many of the identified surface features might have been related to cracking rather than the direct surface expression of faulting (Milliner and Donnellan, 2020). These limitations aside, the ready availability of remote sensing data, and its utility in providing a first-order overview of what has happened in an earthquake, leads us to suggest that the type of remote sensing analysis conducted in this mission might provide a useful pre-mission exercise for future teams who will travel to an earthquake-affected region. Such pre-mission remote sensing might also allow areas of particular interest or concern to be identified in advance, and give team members a broader context for the, inevitably, smaller region it is possible to visit whilst in country.
Remote sensing data has long been used to map landslides and understand triggers, mechanisms and susceptibility factors (Jones et al., 2019; Jones et al., 2021). However, these approaches rely on 2D-surface mapping, rather than understanding the phenomena in 3D, by determining depth of failure and volumes. Zekkos et al. (2017) highlight the benefit of field mapping to understand aspects such as depth of failure and entrainment. Similar issues with using remote sensing data on both a large and smaller scale were evident in the Haiti mission, further compounded by cloud cover limiting the identification of landslides and the automation of the identification process. However, there is still significant benefit to rapid assessments to support the recovery and relief efforts.
The larger team for this “remote” mission relative to previous in-country missions was another benefit which might provide a useful addition to future missions. One of EEFIT’s purposes is to train earthquake engineers in building damage assessment. However, for an in-country mission numbers are limited by funding and potentially ethical concerns about bringing relatively inexperienced engineers to a region which has recently experienced a disaster. This mission was able to include a relatively large team and thus to give more people an opportunity to learn about post-earthquake reconnaissance.
We suggest that future missions could benefit from a hybrid approach where some team members provide remote support, whilst a smaller group travel to the affected area. This approach would allow EEFIT to fulfil its aims of training and to capture the large-scale regional context which remote sensing data allows, whilst also having the benefits of an in-person mission described above.
6 Conclusion
We have presented preliminary results and observations of the Earthquake Engineering Field Investigation Team remote mission to Haiti, following the August 2021 earthquake. The aims of the mission were to use openly available data to understand the pre-existing tectonics, and the deformation and motions which occurred during the earthquake, and to carry out damage assessments on affected buildings in the region. These damage assessments were only possible because of data collected locally by Haitians, often under challenging conditions. Although important insights can be gained into the large-scale deformation and regions of potential damage using only remote sensing data, we conclude that missions investigating structural damage cannot be truly remote at present, and should acknowledge the role of local stakeholders. We also conclude that the connection to the human aspects of disaster is poorer for lack of in-person experience. However, hybrid missions have the potential to reduce environmental and local impacts, expand the number of engineers who can be trained in damage assessment and also allow for the in-person engagement with local stakeholders, which is crucial to ensuring that the results of post-earthquake reconnaissance missions contribute to disaster risk reduction.
Data Availability Statement
The raw data supporting the conclusions of this article will be made available by the authors, without undue reservation.
Author Contributions
All authors listed have made a substantial, direct, and intellectual contribution to the work and approved it for publication.
Funding
CP was supported by a Junior Research Fellowship from Queens’ College, University of Cambridge, and VM was supported by the Dutch Research Council (NWO), project OCENW.XS5.114.
Conflict of Interest
Author MRW was emplopyed by the company AECOM. Author JB was employed by the company AKT II.
The remaining authors declare that the research was conducted in the absence of any commercial or financial relationships that could be construed as a potential conflict of interest.
Publisher’s Note
All claims expressed in this article are solely those of the authors and do not necessarily represent those of their affiliated organizations, or those of the publisher, the editors and the reviewers. Any product that may be evaluated in this article, or claim that may be made by its manufacturer, is not guaranteed or endorsed by the publisher.
Acknowledgments
The team would like to acknowledge the work and dedication of the citizen scientists who collected the building damage database, and to thank them for their efforts which made this mission possible. All seismic data were downloaded through the IRIS Wilber 3 system (https://ds.iris.edu/wilber3/) or IRIS Web Services (https://service.iris.edu/), from the Raspberry Shake Network: https://doi.org/10.7914/SN/AM. We thank the European Space Agency for providing Sentinel-1 and Sentinel-2 data over Haiti. We acknowledge the Maxar Open Data program for providing Worldview-1 and Worldview-2 imagery.
References
Anniballe, R., Noto, F., Scalia, T., Bignami, C., Stramondo, S., Chini, M., et al. (2018). Earthquake Damage Mapping: An Overall Assessment of Ground Surveys and VHR Image Change Detection after L'Aquila 2009 Earthquake. Remote sensing Environ. 210, 166–178. doi:10.1016/j.rse.2018.03.004
Aronsson-Storrier, M., and Dahlberg, R. (2022). “Defining Disaster,” in Defining Disaster. doi:10.4337/9781839100307
ASCE/SCI 7-05. 2005. Asce Standard Minimum Design Loads for Buildings and Other Structures. doi:10.1061/9780784408094
Ayiti-Seismes (2022). Available at https://ayiti.unice.fr/ayiti-seismes/ (last accessed 02 28, 2022).
Bai, Y., Mas, E., and Koshimura, S. (2018). Towards Operational Satellite-Based Damage-Mapping Using U-Net Convolutional Network: A Case Study Of 2011 Tohoku Earthquake-Tsunami. Remote Sensing 10 (10), 1626.
Bakun, W. H., Flores, C. H., and ten Brink, U. S. (2012). Significant Earthquakes on the Enriquillo Fault System, Hispaniola, 1500-2010: Implications for Seismic Hazard. Bull. Seismological Soc. America 102 (1), 18–30. doi:10.1785/0120110077
Bamler, R. (2000). Principles of Synthetic Aperture Radar. Surv. Geophys. 21 (2), 147–157. doi:10.1023/a:1006790026612
Barba-Sevilla, M., Baird, B., Liel, A., and Tiampo, K. (2018). Hazard Implications of the 2016 Mw 5.0 Cushing, OK Earthquake from a Joint Analysis of Damage and InSAR Data. Remote Sensing 10 (11), 1715. doi:10.3390/rs10111715
Booth, E., Saito, K., and Madabhushi, G. (2011). The Haiti Earthquake of 12 January 2010: A Field Report by EEFIT, Earthquake Engineering Field Investigation Team (EEFIT).
Bray, J. D., Frost, J. D., Rathje, E. M., and Garcia, F. E. (2018). “Turning Disaster into Knowledge in Geotechnical Earthquake Engineering,” in Geotechnical Earthquake Engineering and Soil Dynamics V: Seismic hazard Analysis, Earthquake Ground Motions, and Regional-Scale Assessment. Editors S. J. Brandenberg, and M. T. Manzari (American Society of Civil Engineers), 186–200. doi:10.1061/9780784481462.018
Bürgmann, R., Rosen, P. A., and Fielding, E. J. (2000). Synthetic Aperture Radar Interferometry to Measure Earth’s Surface Topography and its Deformation. Annu. Rev. earth Planet. Sci. 28 (1), 169–209.
Calais, E., Boisson, D., Symithe, S., Prépetit, C., Pierre, B., Ulyse, S., et al. (2020). A Socio-Seismology Experiment in Haiti. Front. Earth Sci. 8. doi:10.3389/feart.2020.542654
Calais, E., Freed, A., Mattioli, G., Amelung, F., Jónsson, S., Jansma, P., et al. (2010). Transpressional Rupture of an Unmapped Fault during the 2010 Haiti Earthquake. Nat. Geosci 3, 794–799. doi:10.1038/ngeo992
Calais, É., Symithe, S., Mercier de Lépinay, B., and Prépetit, C. (2016). Plate Boundary Segmentation in the Northeastern Caribbean from Geodetic Measurements and Neogene Geological Observations. Comptes Rendus Geosci. 348 (1), 42–51. doi:10.1016/j.crte.2015.10.007
Chini, M., Bignami, C., Stramondo, S., and Pierdicca, N. (2008). Uplift and Subsidence Due to the 26 December 2004 Indonesian Earthquake Detected by SAR Data. Int. J. Remote Sensing 29 (13), 3891–3910. doi:10.1080/01431160701871112
Close, O., Petit, S., Beaumont, B., and Hallot, E. (2021). Evaluating the Potentiality of Sentinel-2 for Change Detection Analysis Associated to LULUCF in Wallonia, Belgium. Land 10 (1), 55. doi:10.3390/land10010055
Code National du Bâtiment d’Haïti 2012, Ministère de Travaux Publics, Transports et Communications (MTPTC). République d’Haïti. Edition Janvier 2013. ISBN 978-99935-7-455-2.
Courboulex, F., Monfret, T., Paul, S., Calais, E., Symithe, S., Chèze, J., et al. (2021). Le réseau de sismologie citoyenne en Haïti face au séisme de Nippes (Mw 7.2) du 14 Aout 2021. 5èmes Rencontres Scientifiques et Techniques Résif. Obernai, France.
DeMets, C. (2001). A New Estimate for Present-Day Cocos-Caribbean Plate Motion: Implications for Slip along the Central American Volcanic Arc. Geophys. Res. Lett. 28 (21). doi:10.1029/2001gl013518
DeMets, C., Gordon, R. G., and Argus, D. F. (2010). Geologically Current Plate Motions. Geophys. J. Int. 181 (1), 1–80. doi:10.1111/j.1365-246x.2009.04491.x
Duarte, D., Nex, F., Kerle, N., and Vosselman, G. (2018). Satellite Image Classification Of Building Damages Using Airborne And Satellite Image Samples In A Deep Learning Approach. ISPRS Ann. Photogramm. Remote Sens. Spat. Inf. Sci. 4 (2). doi:10.5194/isprs-annals-IV-2-89-2018
Escadafal, R. (1989). Remote Sensing of Arid Soil Surface Color with Landsat Thematic Mapper. Adv. Space Res. 9, 159–163. doi:10.1016/0273-1177(89)90481-x
Frankel, A., Harmsen, S., Mueller, C., Calais, E., and Haase, J. (2011). Seismic Hazard Maps for Haiti. Earthquake Spectra 27 (1_Suppl. 1), 23–41. doi:10.1193/1.3631016
Haiti Earthquake Flash Update (2021). Earthquake Flash Update No. 3, 18.08.21. Geneva: United Nations Office for the Coordination of Humanitarian Affairs.
Hayes, G. P., Briggs, R. W., Sladen, A., Fielding, E. J., Prentice, C., Hudnut, K., et al. (2010). Complex Rupture during the 12 January 2010 Haiti Earthquake. Nat. Geosci 3, 800–805. doi:10.1038/ngeo977
Hewitt, K. (1983). “The Idea of Calamity in a Technocratic Age,” in Interpretations of Calamity (Harlow, England: Addison Wesley Longman Ltd).
Hough, S. E., Altidor, J. R., Anglade, D., Given, D., Janvier, M. G., Maharrey, J. Z., et al. (2010). Localized Damage Caused by Topographic Amplification during the 2010 M 7.0 Haiti Earthquake. Nat. Geosci 3, 778–782. doi:10.1038/ngeo988
Ji, L., and Peters, A. J. (2003). Assessing Vegetation Response to Drought in the Northern Great Plains Using Vegetation and Drought Indices. Remote Sensing Environ. 87, 85–98. doi:10.1016/s0034-4257(03)00174-3
Ji, M., Liu, L., and Buchroithner, M. (2018). Identifying Collapsed Buildings Using post-earthquake Satellite Imagery and Convolutional Neural Networks: A Case Study of the 2010 Haiti Earthquake. Remote Sensing 10 (11), 1689. doi:10.3390/rs10111689
Jones, J. N., Boulton, S. J., Stokes, M., Bennett, G. L., and Whitworth, M. R. Z. (2021). 30-year Record of Himalaya Mass-Wasting Reveals Landscape Perturbations by Extreme Events. Nat. Commun. 12 (1), 6701–6715. doi:10.1038/s41467-021-26964-8
Jones, J. N., Boulton, S. J., Bennett, G. L., Whitworth, M. R., and Stokes, M. (2019), January. Investigating the Landslide Susceptibility of a Glacial/periglacial Landscape. Geophysical Research Abstracts, 21. Langtang Valley, Nepal.
Kijewski-Correa, T., ALhawamdeh, B., Arteta, C., Djima, W., Do, T., Garcia, S., et al. (2021). StEER: M7.2 Nippes, Haiti Earthquake Preliminary Virtual Reconnaissance Report (PVRR). in M7.2 Nippes Earthquake, Haiti. Notre Dame: DesignSafe-CI. StEER - 14 August 2021. doi:10.17603/h7vg-5691
Li, Q., Wang, W., Wang, J., Zhang, J., and Geng, D. (2021). Exploring the Relationship between InSAR Coseismic Deformation and Earthquake-Damaged Buildings. Remote Sensing Environ. 262, 112508. doi:10.1016/j.rse.2021.112508
Lu, D., Mausel, P., Brondízio, E., and Moran, E. (2004). Change Detection Techniques. Int. J. Remote Sensing 25, 2365–2401. doi:10.1080/0143116031000139863
Mann, P., Taylor, F. W., Edwards, R. L., and Ku, T.-L. (1995). Actively Evolving Microplate Formation by Oblique Collision and Sideways Motion along Strike-Slip Faults: An Example from the Northeastern Caribbean Plate Margin. Tectonophysics 246 (1–3), 1–69. doi:10.1016/0040-1951(94)00268-e
Martinez, S. N., Allstadt, K. E., Slaughter, S. L., Schmitt, R., Collins, E., Schaefer, L. N., et al. (2021). Landslides triggered by the August 14, 2021, magnitude 7.2 Nippes, Haiti, Earthquake: USA. Geological Survey Open-File Report 2021–1112, 17. doi:10.3133/ofr20211112
Maxar (2021). © 2021 Maxar Technologies. Availble at https://www.maxar.com.
Milillo, P., Bürgmann, R., Lundgren, P., Salzer, J., Perissin, D., Fielding, E., et al. (2016). Space Geodetic Monitoring of Engineered Structures: The Ongoing Destabilization of the Mosul Dam, Iraq. Sci. Rep. 6 (1), 37408–37417. doi:10.1038/srep37408
Milliner, C., and Donnellan, A. (2020). Using Daily Observations from Planet Labs Satellite Imagery to Separate the Surface Deformation between the 4 July Mw 6.4 Foreshock and 5 July Mw 7.1 Mainshock during the 2019 Ridgecrest Earthquake Sequence. Seismological Res. Lett. 91 (4), 1986–1997. doi:10.1785/0220190271
Ministère des Travaux Publics, Transports et Communications (MTPTC) (2012). Code National Dubatiment d’Haiti (CNBH).
Miranda, E. (2021). Assessment Manual: Rapid Damage Classification for Nippes August 14, 2021 M7.2 Earthquake in Haiti.
Oliver-Smith, A. (2010). Haiti and the Historical Construction of Disasters. NACLA Report on the Americas 43 (4), 32–36. doi:10.1080/10714839.2010.11725505
OSM (2021). ©OpenStreetMap. openstreetmap.Org. Available at: https://www.openstreetmap.org.
Raimbault, B., Jolivet, R., Calais, E., Duputel, Z., and Fukushima, Y. (2021). Complex Fault Rupture Geometry and Slip Distribution of the Mw7.2 Nippes Earthquake. Haiti.
Rathje, E. M., Woo, K. S., Crawford, M., and Neuenschwander, A. (2005). “Earthquake Damage Identification Using Multi-Temporal High-Resolution Optical Satellite Imagery,” in Proceedings. 2005 IEEE International Geoscience and Remote Sensing Symposium, 2005. IGARSS’05 (IEEE) 7, 5045–5048. doi:10.1109/IGARSS.2005.1526812
Rosen, P. A., Gurrola, E., Sacco, G. F., and Zebker, H. (2012). “The InSAR Scientific Computing Environment,” in EUSAR 2012; 9th European Conference on Synthetic Aperture Radar VDE, 730–733.
Saint Fleur, N., Feuillet, N., and Klinger, Y. (2019). Active Tectonics along the Cul-De-Sac – Enriquillo plain and Seismic hazard for Port-Au-Prince. Haiti, Tectonophysics 771, 228235. doi:10.1016/j.tecto.2019.228235
Saint Fleur, N., Klinger, Y., and Feuillet, N. (2020). Detailed Map, Displacement, Paleoseismology, and Segmentation of the Enriquillo-Plantain Garden Fault in Haiti. Tectonophysics 778, 228368. doi:10.1016/j.tecto.2020.228368
Stramondo, S., Moro, M., Tolomei, C., Cinti, F., and Doumaz, F. (2005). InSAR Surface Displacement Field and Fault Modelling for the 2003 Bam Earthquake (southeastern Iran). J. Geodynamics 40 (2-3), 347–353. doi:10.1016/j.jog.2005.07.013
Symithe, S., Calais, E., de Chabalier, J. B., Robertson, R., and Higgins, M. (2015). Current Block Motions and Strain Accumulation on Active Faults in the Caribbean. J. Geophys. Res. Solid Earth 120 (5), 3748–3774. doi:10.1002/2014jb011779
Symithe, S., and Calais, E. (2016). Present-day Shortening in Southern Haiti from GPS Measurements and Implications for Seismic hazard. Tectonophysics 679, 117–124. doi:10.1016/j.tecto.2016.04.034
UN Office for the Coordination of Humanitarian Affairs (UN OCHA) (2021). Haiti: Earthquake Situation Report No. 3.
USGS (2021). M 7.2 - Nippes, Haiti. Available at https://earthquake.usgs.gov/earthquakes/eventpage/us6000f65h/executive (last accessed: 01 2122).
Wald, D. J., and Allen, T. I. (2007). Topographic Slope as a Proxy for Seismic Site Conditions and Amplification. Bull. Seismological Soc. America 97, 1379–1395. doi:10.1785/0120060267
Whitworth, M. R., Moore, A., Francis, M., Hubbard, S., and Manandhar, S. (2020a). Building a More Resilient Nepal-The Utilisation of the Resilience Scorecard for Kathmandu, Nepal Following the Gorkha Earthquake of 2015. Lowland Tech. Int. 21 (4), 229–236. (March).
Whitworth, M. R. Z., Boulton, S. J., and Jones, J. N. (2020). Implementing the Sendai Framework in Developing Countries Using Remote Sensing Techniques for the Evaluation of Natural Hazards. Lowland Tech. Int. 22 (1), 113–122. (June).
Wilkinson, S., DeJong, M., Novelli, V., Burton, P., Tallet-Williams, S., Whitworth, M., et al. (2019). The Mw 7.8 Gorkha, Nepal Earthquake of the 25th April 2015. in Earthquake Engineering Field Investigation Team (EEFIT).
Yun, S.-H., Hudnut, K., Owen, S., Webb, F., Simons, M., Sacco, P., et al. (2015). Rapid Damage Mapping for the 2015Mw 7.8 Gorkha Earthquake Using Synthetic Aperture Radar Data from COSMO-SkyMed and ALOS-2 Satellites. Seismological Res. Lett. 86 (6), 1549–1556. doi:10.1785/0220150152
Zekkos, D., Clark, M., Whitworth, M., Greenwood, W., West, A. J., Roback, K., et al. (2017). Observations of Landslides Caused by the April 2015 Gorkha, Nepal, Earthquake Based on Land, UAV, and Satellite Reconnaissance. Earthquake Spectra 33 (1_Suppl. l), 95–114. doi:10.1193/121616eqs237m
Keywords: remote reconnaissance, earthquake, building damage, remote sensing, landslides, data collection, InSAR, multispectral imagery
Citation: Whitworth MRZ, Giardina G, Penney C, Di Sarno L, Adams K, Kijewski-Correa T, Black J, Foroughnia F, Macchiarulo V, Milillo P, Ojaghi M, Orfeo A, Pugliese F, Dönmez K, Aktas YD and Macabuag J (2022) Lessons for Remote Post-earthquake Reconnaissance from the 14 August 2021 Haiti Earthquake. Front. Built Environ. 8:873212. doi: 10.3389/fbuil.2022.873212
Received: 10 February 2022; Accepted: 14 March 2022;
Published: 29 April 2022.
Edited by:
Michalis F. Vassiliou, ETH Zürich, SwitzerlandReviewed by:
Andrea Calabrese, California State University, Long Beach, United StatesAnastasios I. Giouvanidis, University of Minho, Portugal
Copyright © 2022 Whitworth, Giardina, Penney, Di Sarno, Adams, Kijewski-Correa, Black, Foroughnia, Macchiarulo, Milillo, Ojaghi, Orfeo, Pugliese, Dönmez, Aktas and Macabuag. This is an open-access article distributed under the terms of the Creative Commons Attribution License (CC BY). The use, distribution or reproduction in other forums is permitted, provided the original author(s) and the copyright owner(s) are credited and that the original publication in this journal is cited, in accordance with accepted academic practice. No use, distribution or reproduction is permitted which does not comply with these terms.
*Correspondence: Giorgia Giardina, Zy5naWFyZGluYUB0dWRlbGZ0Lm5s