 Taiki Hagiwara
 Yuma Shimamoto
 Tetsuya Suzuki
- 1Graduate School of Science and Technology, Niigata University, Niigata, Japan
- 2Institute of Agriculture, Tokyo University of Agriculture and Technology, Fuchu, Japan
- 3Faculty of Agriculture, Niigata University, Niigata, Japan
Steel sheet pile materials are primarily used for canal structure construction for irrigation and drainage of agricultural fields in Japan. Recently, accelerated corrosion of steel materials and buckling phenomena in pitting corrosion parts have been detected in in-service steel sheet pile canals. In this study, we focus on the buckling phenomenon of in-service steel sheet pile canals, which is detected by non-contact monitoring using digital image analysis. The buckling phenomenon index is evaluated as the inclination angle of the steel sheet pile due to deformation. As a digital image analysis, Hough transform is applied, which is a figure detection method in digital images, to detect a straight line that describes the distance and angle parameters. The angle parameter corresponds to the inclination angle index of in-service steel sheet pile with a buckling phenomenon. As a result, the maximum difference between the analyzed angles by Hough transform and the measured angles is evaluated as 0.9° after the image rotation correction. The relation of the analyzed angles by Hough transform and the measured angles of the buckling phenomenon is correlated. Therefore, the degradation of steel sheet pile canals is quantitatively evaluated by using digital image analysis with unmanned aerial vehicle monitoring. This study’s significance is non-contact and simple measurement by using a digital image which can reduce a working time and perform quick diagnosis in extensive areas.
1 Introduction
In recent years, water infrastructure degradation has become the most important issue for maintaining and managing in-service structures. In Japan, due to the frequent occurrence of heavy rain disasters, drainage facilities require adequate maintenance. In this study, we focus on a steel sheet pile canal, which is one of the drainage facilities and the thin steel wall structures (Figure 1). Steel sheet piles are steel foundation members to protect walls from landslide and water erosion in canal structures. The theory of the steel sheet pile method was established by the development of theoretical research of the 1940s–1950s (Ishiguro et al., 1986). In Japan, the construction technique for steel sheet piles was developed from the 1950s to the 1970s during high economic growth, which spread widely. A steel sheet pile receives Earth and water pressures and is stabilized by the combined action of the sheet pile wall and Earth and water pressures. Recently, the extreme corrosion of the steel materials in service canals has become a problem because steel sheet piles control water as drainage facilities for a long time (Suzuki et al., 2012; Suzuki et al., 2019a).
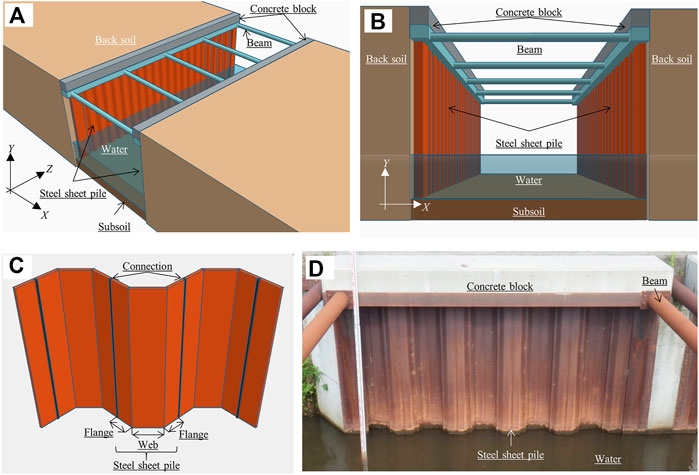
FIGURE 1. Steel sheet piles applied as a canal structure. (A) A steel sheet pile canal with beams. (B) A cross section of a steel sheet pile canal. (C) Steel sheet piles. (D) In-service steel sheet piles in a drainage canal.
In the deteriorated phenomenon of the steel sheet pile, bucking is found in steel structures (Melchers, 2009; Chaves et al., 2016; Ishigami et al., 2018). The buckling process in service steel sheet pile canals due to extreme corrosion is shown in Figure 2. In-service facility corrosion is concentrated in the tidal zone due to water level fluctuations (Figure 2A). Accelerated corrosion leads pitting corrosion (Figure 2B). Pitting corrosion causes the thickness loss of the steel sheet pile and the decrease in its mechanical properties. In addition, extreme corrosion induces the buckling of the steel sheet pile (Figure 2C). A similar corrosion problem has been reported in harbor steel structures. In the marine tidal zone, high corrosion losses of steel materials have been observed (Melchers, 2008; Jeffrey and Melchers, 2009; Ray et al., 2009; Melchers and Jeffrey, 2012; Melchers et al., 2014; James and Hattingh, 2015; Refait et al., 2020). A probabilistic model can be used to model the steel corrosion process (Schoefs et al., 2020) and the corrosion rate can be estimated by the index of sheet pile thickness (Wall and Wadso, 2013). Many studies have frequently evaluated the buckling phenomena of corroded steel structures by using computational simulations of the mechanical dynamics (Moen and Schafer, 2009; Shi et al., 2014; Karagah et al., 2015; Bailey and Osomo, 2020; Wang et al., 2022), with most concentrating on thin steel structures, such as H-steel, and only a few considering steel sheet piles (Balegh et al., 2018). Therefore, although the buckling phenomena of steel sheet piles are detected in in-service structures, an analytical procedure for the phenomena is required.
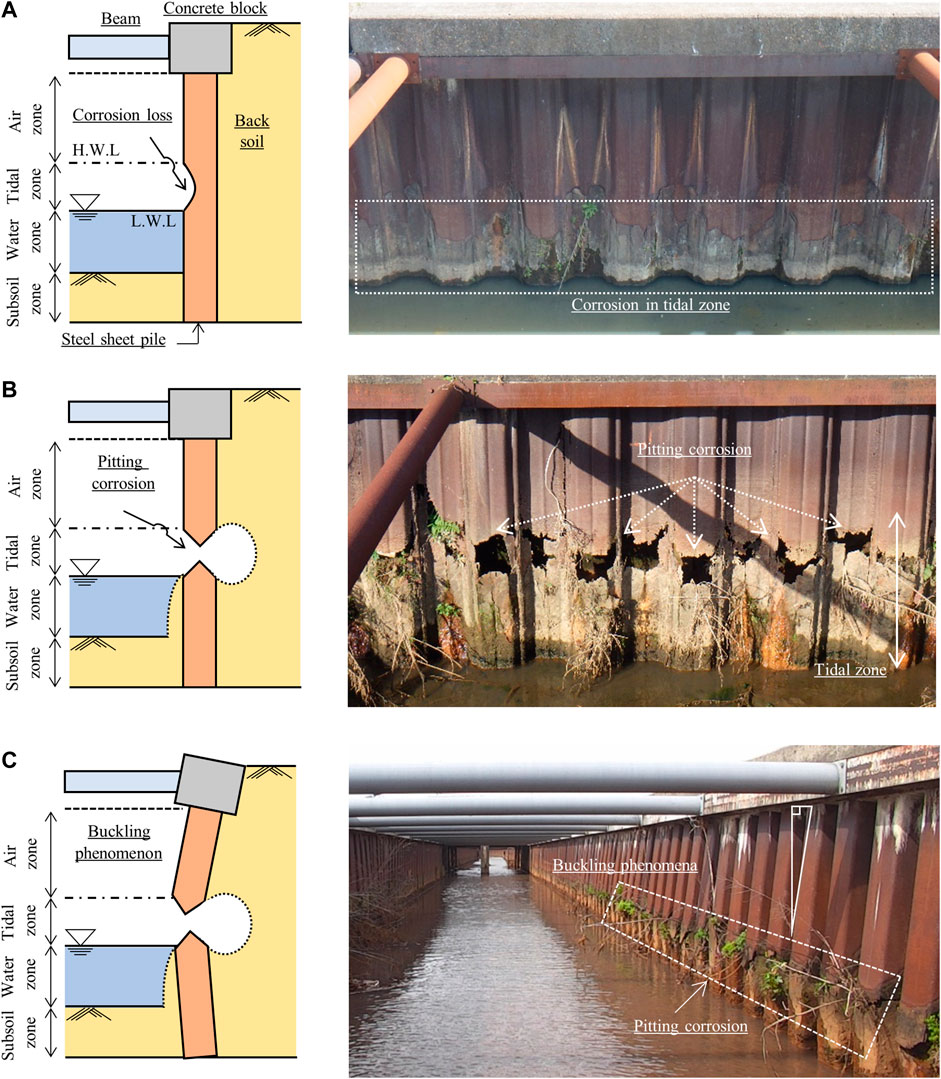
FIGURE 2. Buckling process due to extreme corrosion in service steel sheet pile canals. (A) Accelerated corrosion in the tidal zone. (B) Extreme corrosion as pitting corrosion. (C) A buckling phenomenon.
By the authors, some studies have explored the corroded conditions of steel sheet pile canals (Suzuki et al., 2012; Suzuki et al., 2017; Suzuki et al., 2019a). Here, we focused on the quantitative inspection of corroded conditions by using digital image analysis with an unmanned aerial vehicle (UAV) system (Suzuki et al., 2019b; Hagiwara et al., 2020; Hagiwara et al., 2021). The steel sheet pile canals are constructed over a long distance, and facility monitoring requires to efficiency for effective operations. Recently, structural health monitoring has been performed by using machine vison (Ye et al., 2016; Spencer et al., 2019). As previous studies have shown the importance of simulating the buckling phenomenon mechanism and detecting buckling in service structures, image analysis is introduced to detect the buckling phenomenon of in-service steel sheet pile canals. Hough transform (HT) is applied as an image analysis method. Hough transform is one of the figure detection methods that can identify lines, circles, and ellipses in images (Mukhopadhyay and Chaudhuri, 2014). As the detected figures are described by parameters, Hough transform extracts these figures in images by using a space with the parameters as axes. Hough (1962) was the first to introduce Hough transform to recognize a straight line that was described by using the parameters of slope and intercept. Duda and Hart. (1972) later improved the description of a straight line by using distance and angle parameters. Considering the HT characteristic, in this study, the deformation angles of in-service steel sheet pile due to buckling phenomena are evaluated as the angle parameters of the detected lines by Hough transform. This is non-contact angle detection from a digital image. For example, while Hough transform has been frequently applied to detect the skew angle of the characters in documents (Amin and Fischer, 2000; Singh et al., 2008; Boukharouba, 2017; Boudraa et al., 2020) and to evaluate the rotation of loosened bolts (Park et al., 2015; Cha et al., 2016; Pham et al., 2020; Ta and Kim, 2020), it has found applications in the measurement of contact angle between liquid and solid interface (Xu et al., 2013) and in the estimation of muscle fiber orientation in the medical field (Zhou and Zheng, 2008).
In this study, the buckling phenomena of in-service steel sheet pile canals are evaluated by applying digital image analysis. The investigated canals with buckling sheet piles are agricultural drainage canals with beams. Digital images are monitored by using a UAV system. The buckling index in service steel sheet piles is evaluated by using the inclination angle, which is calculated from HT processing. Using the Hough transform with image analysis, the inclination angle of the steel sheet piles due to buckling is detected. By comparing the measured and analyzed angles from the analytical image (Case 2 in Section 3.4), the mean absolute error (MAE) and maximum absolute error are evaluated as 0.4° and 0.9° after the image correction. HT processing with digital images can probably detect the inclination angles due to buckling of steel sheet piles. Therefore, this study’s novelty is to build the buckling detection model by using non-contact method with a digital image. Applying Hough transform for a diagnosis of agricultural structures is the first introduction. The significance is non-contact and simple measurement by using a digital image which can reduce a working time and perform quick diagnosis in extensive areas. On canal structures, measuring inclination angles of buckling requires to approach canal walls and to bring an angle meter into contact with the walls. Some walls are higher than persons’ heights and water in a canal makes worker’s move difficult. Entering a canal is a heavy burden on workers at risk. The steel sheet pile canal in Japan is 300 km for national facilities and is estimated to 4,000 km from the maker’s shipment (Asano et al., 2017). It is difficult to conduct an extensive measurement due to a long-time work. Our developed method can be applied to in-service structures which are difficult and dangerous to approach.
2 Materials and methods
2.1 Investigated facilities
The investigated facilities are named the H and S drainage canals, which are located in the Kameda-go district of Niigata Prefecture, Japan. The structural canal style is a lightweight steel sheet pile wall with beams (Figures 1A,B). The H drainage canal was constructed in 1994, which was after 26 years in the survey. The design thickness of the steel sheet piles is set to 5 mm, the canal width is 4.5 m, and the canal height is 2.3 m. The S drainage canal was constructed in 1996, which was after 24 years in the survey. The design thickness of the steel sheet piles is set to 6 mm, the canal width is 5.5 m, and the canal height is 2.4 m. In the H drainage canal, 24 steel sheet pile samples with buckling were investigated. In the S drainage canal, eight steel sheet pile samples without buckling were investigated. Both canals were investigated on the right canal wall. The buckling phenomenon on the H drainage canal’s right bank is shown in Figure 2C. The cross section loss due to pitting corrosion is concentrated in the tidal zone. Steel sheet piles in the tidal zone buckles toward the inside of the waterway in the H drainage canal owing to the beam supporting the wall head.
2.2 Set up for digital image acquisition
Image acquisition was performed by using a UAV system (Matrice 210, DJI). An aerial camera (Zenmuse Z30, DJI) was mounted on the UAV system. This camera had CMOS 1/2.8 and the lens were able to be up to 30x optical zoom. Measurement by using the UAV system is shown in Figure 3A. Image acquisition was conducted at the H and S drainage canals between 1 and 3 p.m. on 30 March 2020. The acquisition was performed three times in a row with one shot per site. The UAV flight position was set to about 1.5 m from the canal bottom. The shooting direction was in the downstream direction, which was the normal direction of the canal cross section such as in Figure 1B. The pan (vertical angle) and tilt (horizontal angle) of the UAV gimbal were set to 0°. The optical zoom was ×1.0, which corresponded to the focal length of 4.0 mm. The field of view was set to 63.7°. The aperture value, shutter speed, and sensitivity were set automatically. The acquired image was RGB color image, the bit depth was 24 bits and the image size was 1,920 × 1,080 pixels.
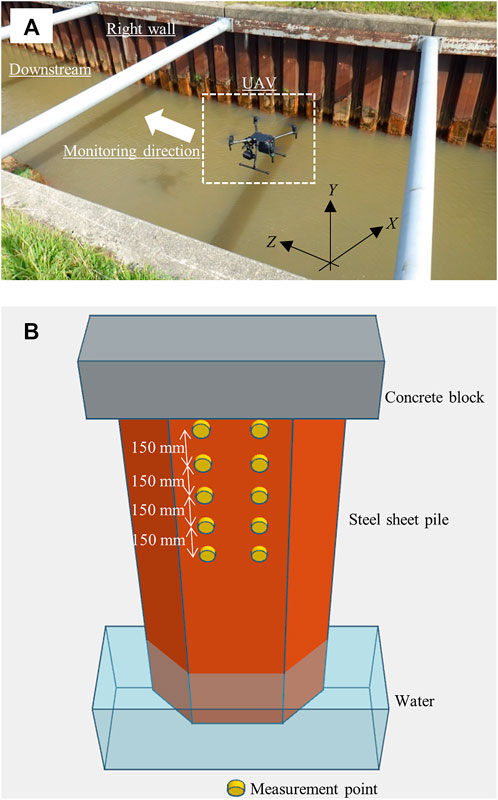
FIGURE 3. Measurement procedures in service steel sheet pile canals. (A) Image acquisition with a UAV system. (B) Measurement location of sheet pile inclination angles.
2.3 Measurement of inclination angles
The inclination angles of the steel sheet piles were measured by using a digital angle meter (digital angle meter II with dustproof function and magnet, Shinwa Rules). The resolution of the angle meter was 0.05°. The accuracy was ±0.05° for measurement angles of 0° and 90°; otherwise, ± 0.15°. The inclination angle of the steel sheet pile was defined as the vertical angle between the vertical axis and the sheet pile above the buckling position. The measurement location of the inclination angle is shown in Figure 3B. The location was the web of a steel sheet pile above the buckling position. The number of measurement points was 10 points per steel sheet pile. The measurement points were divided into five points on the left and right from the web center. The vertical measurement interval was set to 150 mm. Twenty-four steel sheet pile samples in the H drainage canal and eight samples in the S drainage canal were measured.
2.4 Analytical procedures
2.4.1 Analytical images and preprocessing
The analytical images are shown in Figure 4. The analytical area in each image is a range surrounded by squares. The analytical area size is set to 1,510 × 670 pixels. Analyzed steel sheet piles are on the right canal wall that is located on the right side of the image. The analysis is set to three cases. Case 1 is a buckling condition in the H drainage canal wall. The upper left point with coordinates of the analytical area is (x, y) = (230, 390). Twelve steel sheet piles from No. 1 to No. 12 on the right wall are evaluated. Case 2 is a buckling condition with image rotation. These sheet piles differ from Case 1 in the H drainage canal. The upper left point with coordinates is (x, y) = (370, 290). Twelve steel sheet piles from No. 1 to No. 12 on the right wall are evaluated. Image rotation correction is conducted in Case 2. Projection transform is applied as a correction method, as explained in Section 2.4.4. Case 3 is a non-buckling condition in the S drainage canal wall. The upper left point with coordinates is (x, y) = (150, 390). Eight steel sheet piles from No. 1 to No. 8 on the right wall are evaluated. In the following of this section, the square area in Figure 4 is regarded as Case 1, 2 and 3 of analytical images.
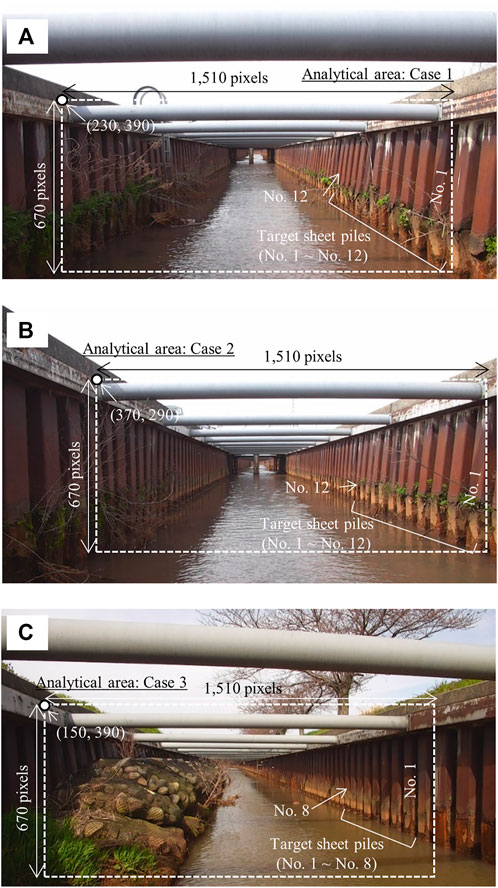
FIGURE 4. Analytical images of in-service steel sheet pile canals. (A) Case 1: Buckling condition. (B) Case 2: Buckling condition with image rotation. (C) Case 3: Non-buckling condition.
Preprocessing of the analytical images is conducted before Hough transform (see Section 2.4.2). The analytical images are converted from RGB color images to grayscale images. Using grayscale images, histogram equalization is performed, which is an equal redistribution of the image histogram to raise the image contrast. Canny edge detection is conducted on the grayscale image after histogram equalization (Canny, 1986). The edges describe the object outline in the image, where the brightness changes rapidly. Differential filtering for the image space is applied to detect the edges. Threshold processing is performed on these detected edges. The thresholds are set to the image gradient magnitude. This magnitude is a Euclidean norm that is calculated by using differential values of each direction, x (horizontal) and y (vertical) directions. The upper and the lower threshold values are set. The magnitude exceeding the upper threshold determines its coordinates as an edge. The magnitude not exceeding the lower threshold determines its coordinates as not an edge. The magnitude between the upper and the lower thresholds determines its coordinates as an edges only if the coordinates are next to an edge. In this study, the upper and lower thresholds are 200 and 120, respectively. Hough transform is performed on the edge image resulting from Canny edge detection.
2.4.2 Hough transform (HT)
Buckling deforms a steel sheet pile. The buckling index is evaluated as the inclination angle due to deformation. The inclination angle is detected by applying Hough transform (Duda and Hart, 1972). This method detects figures described by the parameters in an image space. In this analysis, straight lines are detected, which are described by the distance parameter ρ and the angle parameter θ. A straight line in the image space is calculated using Eq. 1.
where x and y are the coordinates in the image space, ‘ρ’ is the signed distance from the origin to the straight line, and ‘θ’ is the angle between the x-axis and the perpendicular line drawn from the origin to the straight line. The HT theory is explained in Figure 5A. A point (x, y) of the image space is mapped to the parameter space using Eq. 1. The mapping transforms the point into sine curves. This is called voting. All analytical points in the image space are voted on in the parameter space. The sine curves in the parameter space intersect at specific points (ρ0, θ0). The discretization interval of the parameter space is 0.1° on the angle parameter θ axis (the horizontal axis) and one on the distance parameter ρ axis (the vertical axis). The number of votes threshold is set. If the number of votes of specific coordinates (ρ0, θ0) exceeds the threshold value, the coordinates are inversely mapped to the straight line in the image space by Eq. 1. Inverse mapping transforms the coordinates (ρ0, θ0) into the straight line ρ0 = xcosθ0+ ysinθ0. Points are converted to straight lines. Hough transform detects straight lines by mapping of the parameter space and inverse mapping of the image space.
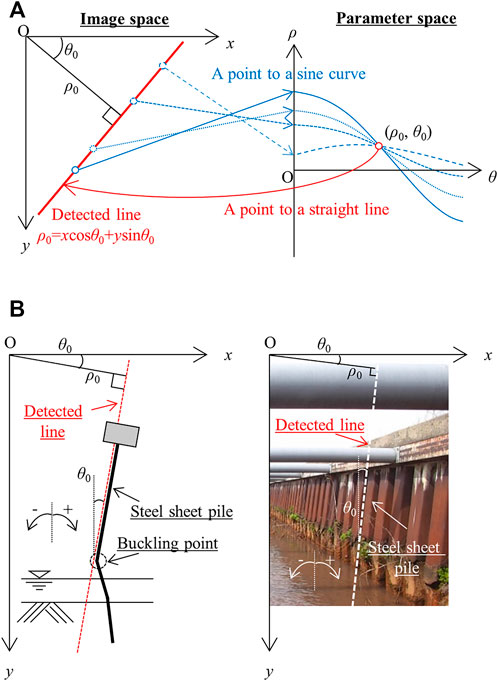
FIGURE 5. Buckling detection by using image analysis with Hough transform. (A) Hough transform theory. (B) Buckling detection model with Hough transform.
2.4.3 Buckling detection model
As this study’s novelty, the buckling detection model by using a digital image with Hough transform is developed to detect steel sheet pile buckling. The model is shown in Figure 5B. This model is applied to the canal’s right wall. This model aims to detect the inclination angle of the steel sheet pile due to buckling. The detection target is the straight line of the sheet pile above a buckling point. The buckling point is pushed out to the inside of the canal by the horizontal load. The sheet pile above the buckling position is inclined clockwise from the vertical direction. This angle corresponds to the inclination angle of the steel sheet pile (Figure 5B). The measured value of this angle is obtained in Section 2.1. The sign of the angle is explained as follows: a positive angle is from the vertical direction to the clockwise direction and a negative angle is from the vertical direction to the counterclockwise direction. The straight line of the inclined sheet pile is detected by image analysis with Hough transform. The angle parameter of the detected line is the angle between the x-axis and the distance from the detected line. This angle parameter equals the measured angle from the positional relationship (Figure 5B). After this treatment, this angle parameter is called the analyzed angle. In this study, the UAV is assumed not to shake horizontally when hovering. The image space x-axis is considered a horizontal reference in the image analysis.
2.4.4 Projective transform
In Case 2, the analytical image has horizontal image rotation (Figure 4B) because the image monitoring direction shifts to the left from the normal direction of the canal cross section. The effect of image rotation on analyzed angle accuracy is verified. The image rotation is corrected by applying a projective transform. Projective transform is a method that transforms an arbitrary quadrilateral image into another arbitrary one. A schematic diagram of the projective transform of a quadrilateral is shown in Figure 6A. The transformation of an arbitrary point as coordinates (x, y) to another arbitrary point as coordinates (x', y') is shown as follows:
where a1, b1, c1, a2, b2, c2, a3, b3, and c3 are the nine coefficients required for coordinate transform. The projective transform maps the four coordinates that form an arbitrary quadrilateral into another four arbitrary ones. Assuming that the combination of the x-coordinate and the y-coordinate is one coordinate, Eqs 2, 3 are expressed by four each. A total of eight equations is expressed. The denominator and numerator are divided by c3 to make c3 in Eqs 2, 3 unity. Therefore, eight coefficients exist and are calculated by solving eight simultaneous equations. In this study, image rotation correction is performed based on the beam in the analytical image. The developed image correction model is shown in Figure 6B. Assuming that the beam length is L and the image rotation angle is φ, the beam on the acquired image induces the length Lcosφ, by the projective transform, the beam with the length Lcosφ on the image is corrected to be the length L. The angle φ is estimated based on the actual length.
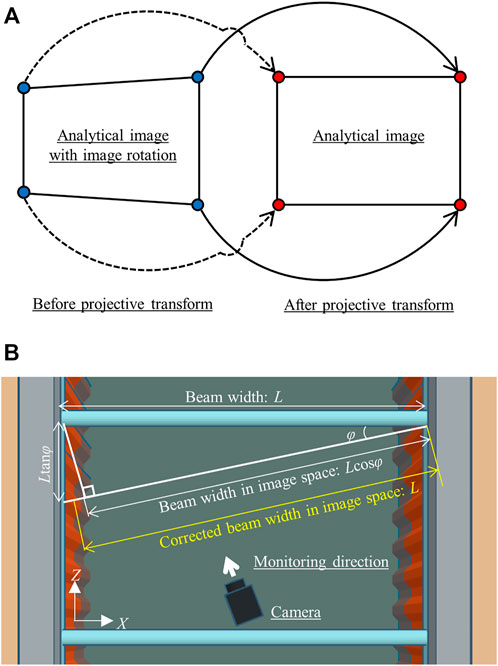
FIGURE 6. Correction of image rotation. (A) Projective transform for horizontally rotated image. (B) Image correction model by projective transform.
2.4.5 Non-contact detection flowchart
The flowchart of the non-contact detection of the inclination angle by image analysis is shown in Figure 7. After image acquisition of in-service structures, whether the image requires the correction of image rotation is then judged. If the correction is required, the projective transformation is conducted. In this study, this treatment is applied only to case 2. Preprocessing of the analytical image is conducted. The preprocessing is as follows: grayscale conversion of the RGB color image, histogram equalization and Canny edge detection. After these steps, Hough transform is conducted. The straight lines of steel sheet piles are detected by the threshold processing of the distance and angle parameters. The angle parameter is evaluated as the inclination angle of the steel sheet pile. This angle is called the analyzed angle that is obtained from the digital image. The accuracy of non-contact measurement is verified by comparing the analyzed and measured angles. The results of each step are shown in each section of Figure 7.
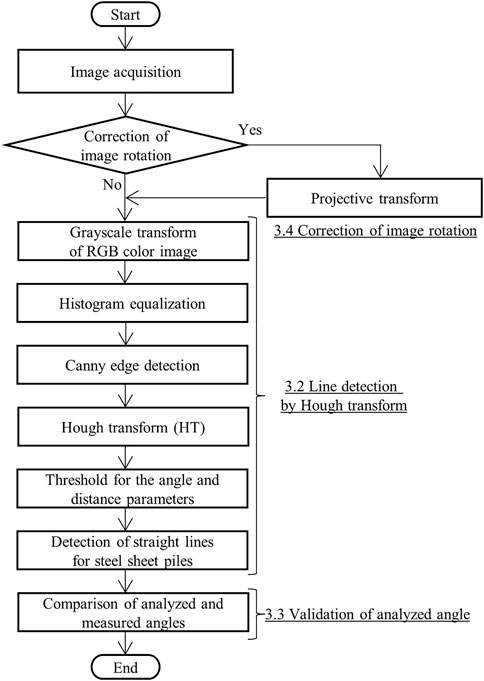
FIGURE 7. Flowchart of non-contact angle detection with digital image analysis.
3 Results and discussion
3.1 Measured angles of buckling steel sheet piles
The results of the measured inclination angles of in-service steel sheet piles by using the digital angle meter are shown in Table 1. The mean and standard deviation values of the inclination angles are calculated from 10 measurement points per steel sheet pile. The number of measured sheet piles is 12 in Case 1 (No. 1–12), 12 in case 2 (No. 1–12), and 8 in Case 3 (No. 1–8). The positive sign of the angle is represented as clockwise from the vertical direction, and the negative sign is represented as counterclockwise from the vertical direction (Figure 5B). In Case 1 of the buckling condition, the mean value varies from 6.4° to 7.7°, and the standard deviation varies from 0.1° to 0.2°. In Case 2 of the buckling condition, the mean value varies from 5.3° to 7.6°, and the standard deviation varies from 0.1° to 0.2°. In Case 3 of the non-buckling condition, the mean value varies from −0.3° to 0.7°, and the standard deviation varies from 0.1° to 0.4°. In buckling conditions (Case 1 and Case 2), the increased values in the inclination angles of steel sheet piles are observed owing to deformation. In the non-buckling condition (Case 3), the inclination angle is about 0.0°, and the canal wall stands upright. The mean values in Table 1 are compared with the analyzed angles detected by Hough transform in Section 3.3.
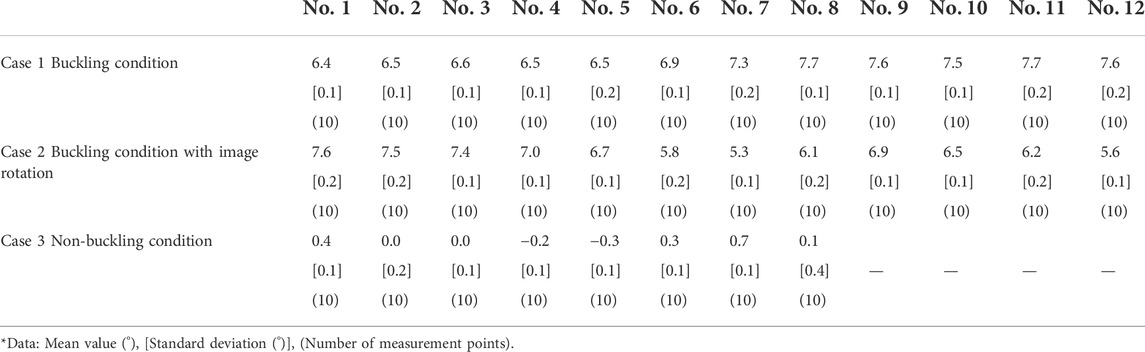
TABLE 1. Measured angles of in-service steel sheet piles by using a digital angle meter.
3.2 Line detection by Hough transform
The results of the edge detection for analytical images and Hough transform to the parameter space based on the edges are shown in Figure 8. The edge images are shown in Figures 8A,C,E. The edge images are obtained after grayscale conversion and histogram equalization of the grayscale analytical images. The edge images are binary. White elements are selected for edges, and black elements are selected for non-edges. The edges are extracted, describing steel sheet piles, beams, concrete blocks, vegetation, and light reflection on the water surface. The edges in Figures 8A,C,E correspond to the points in the image space (Figure 5A). Hough transform converts the mapping of the edges in the image space to sine curves in the parameter space. The results of voting into the parameter space are shown in Figures 8B,D,F. In the parameter space, the horizontal axis is the angle parameter, and the vertical axis is the distance parameter. The color bar shows the number of votes that corresponds to the bins at the intersection of the sine curves with a specific coordinate.
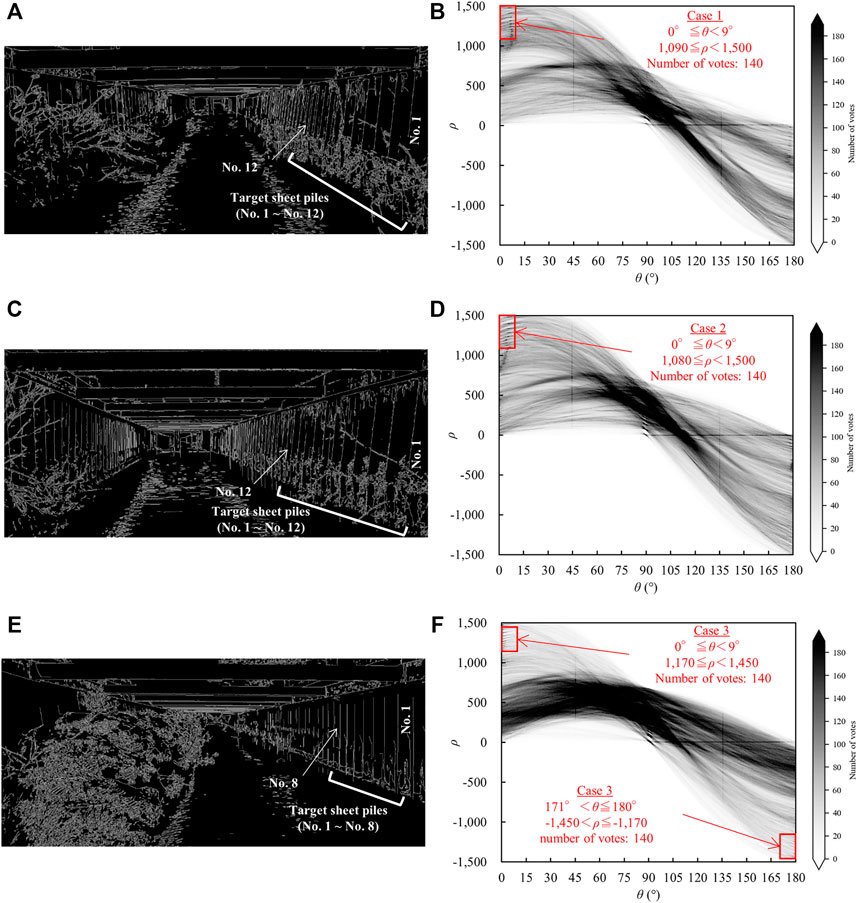
FIGURE 8. Results of Hough transform. (A) An edge image in Case 1. (B) Voting edges in Case 1 to the parameter space by Eq. 1. (C) An edge image in Case 2. (D) Voting edges in Case 2 to the parameter space by Eq. 1. (E) An edge image in Case 3. (F) Voting edges in Case 3 to the parameter space by Eq. 1.
Threshold processing is conducted for the number of votes to limit the detected straight lines. Threshold processing is also performed on the angle and distance parameters to extract the straight lines. In Case 1, the angle parameter threshold is set to 0.0°–9.0°, and the distance parameter threshold is 1,090–1,500. In Case 2, the angle parameter threshold is set to 0.0°–9.0°, and the distance parameter threshold is 1,080–1,500. In Case 3, the thresholds are set to two types. One is that the angle parameter threshold is set to 0.0°–9.0°, and the distance parameter threshold is 1,170–1,450. The other is that the angle parameter threshold is set to 171.0°–180.0°, and the distance parameter threshold is between –1,450 and –1,170. The intersections and plots in the red square in Figures 8B,D,F, describe the straight lines of the steel sheet piles that fulfill the requirements for these thresholds. The angle parameters of these straight lines are evaluated as inclination angles. The intersections and plots out of the red square in Figures 8B,D,F describe the noise lines, which are classified as other object outlines or not object outlines (Hagiwara et al., 2021). The former noise lines are evaluated as steel sheet piles except for Case 1 to 3, concrete blocks, beams, and vegetation. The latter noise lines are evaluated as lines comprising different object edges. Hough transform can detect a line based on discontinuous edges that describe different objects in an image (Matsuyama and Koshimizu, 1989). In an image space, different object edges are assumed on the same straight line, for example, between edges of pitting corrosion part (Case 1 and Case 2) and between edges of gabions (Case 3).
The straight lines that are extracted by the threshold processing of the number of votes, the angle and distance parameters are shown in Figure 9. White lines describe the detected lines, and yellow circles describe the mark of the detected lines to evaluate the angle parameters. The detected lines of the in-service steel sheet piles describe the linear shape of the sheet piles in the air zone. Multiple white lines are detected per sheet pile. The number of yellow circles is 12 in Case 1, 12 in Case 2, and 8 in Case 3. One yellow circle marks the multiple white lines that are detected per sheet pile. The analyzed angle of each sheet pile is evaluated as the average value of the detected lines that are indicated by the yellow circle. The results of the analyzed angles, which describe the inclination angle of steel sheet piles, are shown in Table 2. In this table, the mean value, standard deviation, and number of detected lines per sheet pile are shown. In Case 1 of the buckling condition, the mean value and standard deviation are evaluated as 6.3°–7.9° and 0.3°–0.8°, respectively. In Case 2 of the buckling condition with image rotation, the mean value and standard deviation are evaluated as 4.5°–7.4° and 0.3°–0.5°, respectively. In Case 3 of the non-buckling condition, the mean value and standard deviation are evaluated as 0.0°–0.7° and 0.2°–0.6°, respectively. Like the measured values in Section 3.1, in the buckling conditions (Case 1 and Case 2), the increased values in the inclination angles are observed. In the non-buckling condition (Case 3), the inclination angle is about 0.0°. Unlike the measured angles, the increased values in the variation (the standard deviation) of the analyzed angle are observed. In Section 3.3, the accuracy of the analyzed angles in Table 2 is verified by the measured angles in Table 1.
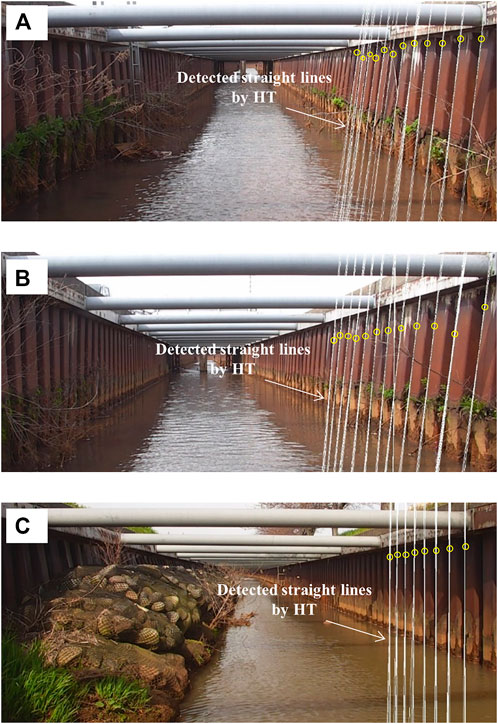
FIGURE 9. Results of line detection of steel sheet piles. White lines describe detected straight lines by Hough transform, and yellow circles describe the lines which evaluate the angle parameters. (A) Case 1: Buckling condition. (B) Case 2: Buckling condition with image rotation. (C) Case 3: Non-buckling condition.
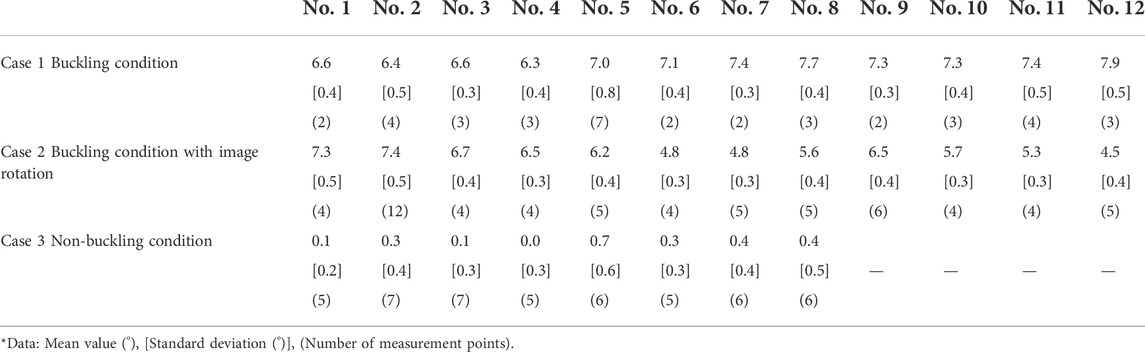
TABLE 2. Analyzed angles of in-service steel sheet piles by digital image analysis with Hough transform.
3.3 Validation of analyzed angles
The analyzed and measured angles are verified using Hough transform and a digital angle meter, respectively. The comparison of the measured and analyzed angles is shown in Figure 10. The horizontal axis is set to the measured angle, and the vertical axis is set to the analyzed angle. The circle plot shows the relation the mean value of the measured angle and that of the analyzed angle (Tables 1, 2). The accuracy of the analyzed angle is evaluated by MAE for the linear function of y = x. The MAE is the mean value of the absolute differences between the answered value (here, the measured angle) and the estimated value (here, the analyzed angle). The unit of MAE is the same as that of the data. In Case 1, the MAE is evaluated as 0.2°, the maximum absolute error is 0.5° in No. 5, and the minimum error is 0.0° in No. 3 (Figure 10A). In Case 2, the MAE is evaluated as 0.6°, the maximum absolute error is 1.1° in No. 12, and the minimum error is 0.0° in No. 2 (Figure 10B). In Case 3, the MAE is evaluated as 0.3°, the maximum absolute error is 1.0° in No. 5, and the minimum error is 0.0° in No. 6 (see Figure 10C). The result of the entire plots of Case 1 to 3 is shown in Figure 10D.
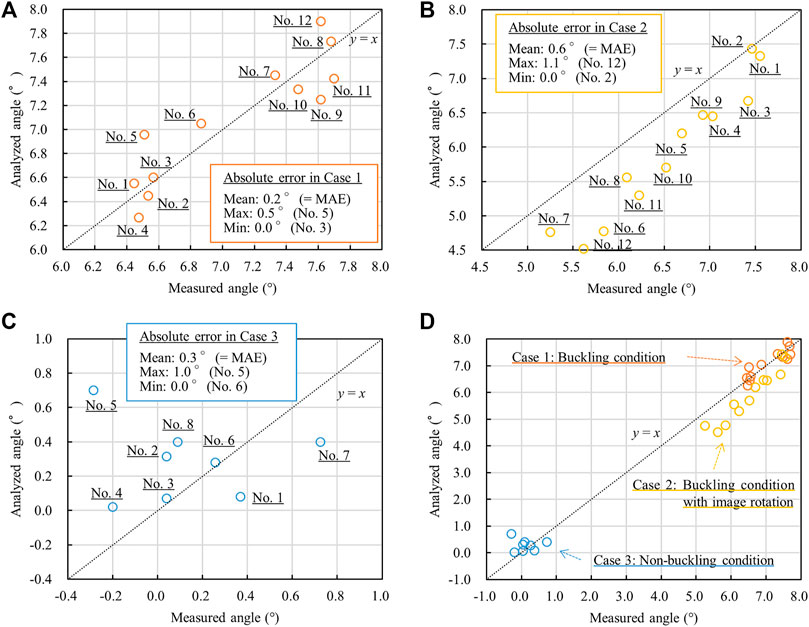
FIGURE 10. The comparison of measured and analyzed angles. (A) Case 1: Buckling condition. (B) Case 2: Buckling condition with image rotation. (C) Case 3: Non-buckling condition. (D) Results of Case 1, Case 2, and Case 3.
For Case 1, under the buckling condition, the relation of the measured and analyzed angles is correlated along with y = x. The buckling phenomenon can be detected by using a non-contact method with digital image analysis (Figure 10A). For Case 2, under the buckling condition, the analyzed angles are underestimated compared to the measured angles (Figure 10B). This result suggests that image rotation affects the underestimation of the analyzed angles. In Figure 4B, Case 2 is rotated because there are three sheet piles on the left side in front of the first beam but no sheet piles on the right side. While, in Figure 4A, Case 1 is not rotated because there are two sheet piles on the left and right sides in front of the first beam. In Figures 10A,B, the plots of Case 1 are more concentrated in a line y = x than Case 2. Image rotation affects this difference in Case 1 and Case 2. It is reported that image rotation causes the accuracy of angle estimation from digital images to decline (Pham et al., 2020). In Section 3.4, the accuracy of the analyzed angles in Case 2 is improved by image correction using the projective transform. For Case 3, under the non-buckling condition, the relation of the measured and analyzed angles is correlated along with y = x. In Case 3, although the target steel sheet piles without buckling stand upright, an increase in the analyzed angle variation is observed (Table 2 and Figure 10C). This implies that the variation is increased by the edges of the corrosion product on the steel sheet pile surface in the tidal zone. The edges, which are lined up in a row in an image space, are recognized as a straight line by Hough transform. This means that some different object edges can be detected as a same straight line. In this analysis, the edges of the linear shape of the steel material in the air zone are targeted to detect the straight line. The edges of the corrosion product have a gap with the edges of the steel material part. Furthermore, Hough transform can detect a straight line whose edges are discontinuous. The edges of the corrosion product and the steel material are assumed to exist on the same straight line in the image space. Ta and Kim. (2020) reveals that detecting the lines under the corroded conditions is more difficult than under non-corroded conditions owing to the pollutants and dirt on the edges of corroded conditions. Thus, the straight lines through the edges of both the steel material and the corrosion product are slightly inclined, and these lines affect the variation in the detected lines. In Figure 10D, the analyzed angles of Case 1 and Case 3, which are little influenced by the image rotation, can detect the inclination angle along with y = x. Those of Case 2 requires the correction of the difference in the measured angles.
Therefore, the inclination angle in the buckling and non-buckling conditions can be accurately detected by using the digital images with Hough transform, which are set to along the normal direction of the canal cross section. The buckling reaches finally after accelerate corrosion and pitting corrosion with material thickness loss as shown in Figure 2. Hough transform detects the final degradation phase of in-service structures. It is the issue that a relation of the inclination angle and the mechanical characteristic based on an interaction between steel material and soil is clarified. In Case 2, the correction of image rotation is evaluated in Section 3.4.
3.4 Correction of image rotation
In Case 2, the horizontal image rotation is corrected by applying the projective transform. The result of applying the projective transform to the analytical image in Case 2 is shown in Figure 11. The points with coordinates of the four corners in Case 2 are selected as (370, 290), (370, 959), (1,879, 959), and (1,879, 290) counterclockwise from the upper left. The width in the x-direction and the height in the y-direction in the analytical image are selected as 1,510 pixels and 670 pixels, respectively. In the projective transform, the first beam in the analytical image is focused (Figure 11). Before the transform, the first beam in an oblique direction corresponds to 1,510 pixels in the image (see ‘Lcosφ’ in Figure 6B). This beam is converted to the length, which is monitored from the front. This length is evaluated as ‘L’ in the image. In the service structure, the angle ‘φ’ is 20.1° when the beam length ‘L’ is 4.1 m and the shifted length ‘Ltanφ’ is 1.5 m, which corresponds to the width of three sheet piles; multiplying ‘Lcosφ’ by ‘1/cosφ’ yields ‘L’, which is a transformed value. Its length ‘L’ corresponds to 1,608 pixels in the image (see ‘L’ in Figure 6B). Therefore, the length of the first beam in Case 2 is transformed from 1,510 pixels to 1,608 pixels by using the projective transform. The length in the y-direction is constant at 670 pixels before and after the transformation. After the projective transform, the corner coordinates in Case 2 are selected as (0, 0), (0, 669), (1,607, 669), and (1,607, 0) counterclockwise from the upper left point. The angle detection by using Hough transform is performed on the image after the projective transform.
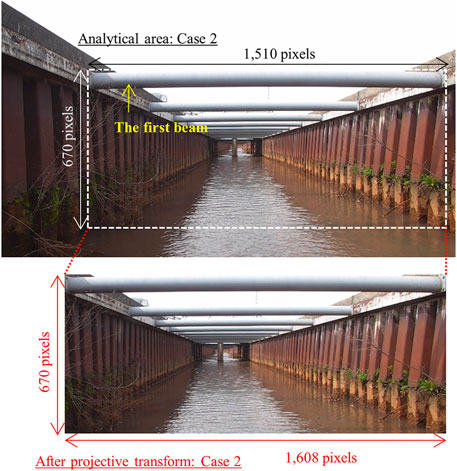
FIGURE 11. A projective transform to correct image rotation in Case 2.
The results of the analyzed angles of Case 2 after the correction are shown in Table 3. After the correction, the mean value is evaluated as 4.7°–8.0° (before: 4.5°–7.4°), and the standard deviation is 0.3°–0.6° (before: 0.3°–0.5°). The comparison of the measured angles and the analyzed angles in Case 2, which are detected before and after the image correction, is shown in Figure 12. Open circles indicate the analytical angles before the image correction, and closed circles indicate the analytical angles after the image correction. The accuracy of the analyzed angle is evaluated by MAE. After the correction, the MAE between the measured and corrected analyzed angles is evaluated as 0.4° (before the correction: 0.6°), the maximum absolute error is 0.9° in No. 12 (before: 1.1° in No. 12), and the minimum error is 0.1° in No. 5 (before: 0.0° in No. 2). By correcting the image rotation, the MAE decreases to 0.2°, the maximum absolute error decreases to 0.2°, and the minimum error increases to 0.1°. The results of MAE indicate that the accuracy of the analyzed angle after the image correction exceeds that before the image correction. Using a similar method of angle detection with Hough transform, Park et al. (2015) reported an increase in analysis accuracy. In No. 1 and No. 2, the difference between the measured and analyzed angles increases due to the correction (Figure 12). It seems that this analytical processing using the projective transform increases the analyzed angles of the entire sample owing to the widening of the analytical image size in the horizontal direction (Figure 11). Therefore, proposing an effective correction model that considers the relation of an image coordinate and a world coordinate system is imperative.
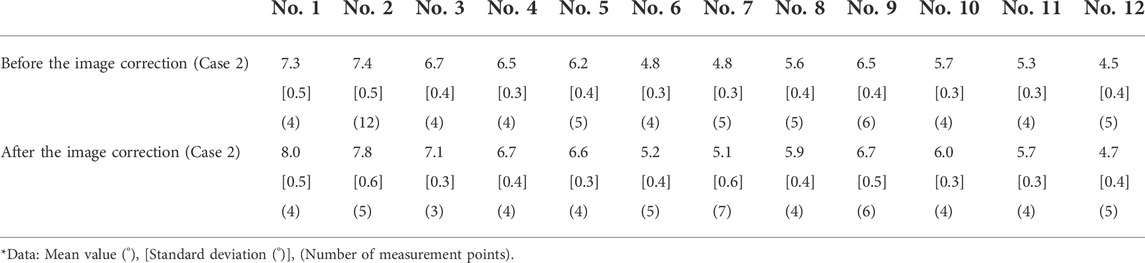
TABLE 3. Analyzed angles in Case 2 before and after image correction with projective transform.
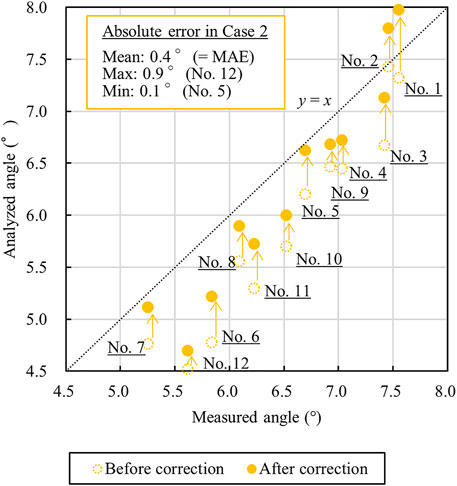
FIGURE 12. The comparison of measured and analyzed angles after image correction in Case 2.
4 Conclusion
Digital image monitoring with a UAV system was used to explore the non-contact and quantitative evaluation of buckling phenomena of in-service steel sheet piles. Digital image analysis with Hough transform, which is a line detection method, is applied. The buckling phenomenon index is evaluated as the inclination angle of the in-service steel sheet pile. The non-contact evaluation of the inclination angle is performed by using the angle parameter that is detected by Hough transform. Analytical images are selected for buckling condition, buckling condition with image rotation, and non-buckling condition. The image rotation is corrected by applying the projective transform, which is a geometric transform method in an image space. The analyzed and measured angles are verified using Hough transform and a digital angle meter, after which the accuracy of the analyzed angles before and after the image correction is evaluated. This study’s results are summarized as follows.
1) Hough transform can detect straight lines of in-service steel sheet piles in the digital image and quantitatively evaluate the inclination angle. The threshold processing of the number of votes, the distance parameter, and the angle parameter must be conducted to extract the target sheet pile lines from the noise lines.
2) The relation of the analyzed angles by using a digital image and the measured angles by using a digital angle meter is correlated under the buckling and non-buckling conditions. The non-contact method by using a digital image with Hough transform is useful in the evaluation of the buckling phenomena of in-service steel sheet piles.
3) The accuracy of the analyzed angles from the analytical image with rotation is improved by using the projective transform for correction. Some cases of widening the difference between the analyzed and measured angles after correction are observed. Therefore, the analytical image correction model requires improvement to accurately consider the relation of an image coordinate and a world coordinate system.
Data availability statement
The original contributions presented in the study are included in the article/supplementary material, further inquiries can be directed to the corresponding author.
Author contributions
TH conducted the measurement and the analysis and wrote the manuscript. YS conducted the measurement, improved the accuracy of the analysis and reviewed the manuscript. TS conducted the measurement, supervised the work and revised the manuscript.
Conflict of interest
The authors declare that the research was conducted in the absence of any commercial or financial relationships that could be construed as a potential conflict of interest.
Publisher’s note
All claims expressed in this article are solely those of the authors and do not necessarily represent those of their affiliated organizations, or those of the publisher, the editors and the reviewers. Any product that may be evaluated in this article, or claim that may be made by its manufacturer, is not guaranteed or endorsed by the publisher.
References
Amin, A., and Fischer, S. (2000). A document skew detection method using the Hough transform. Pattern Analysis Appl. 3 (3), 243–253. doi:10.1007/s100440070009
Asano, I., Kawabe, S., Ohtaka, N., and Ohmura, K. (2017). “Maintenance measures for steel sheet pile canals - development of lightweight stainless steel sheet piles-,” in Corroded conditions (Niigata: Daiichiprinting Co., Ltd.), 5–10.
Bailey, B., and Osomo, S. A. (2020). Prediction of nominal compressive strength in steel piles subject to corrosion losses: A finite element approach. J. Civ. Eng. Constr. 9 (1), 24–30. doi:10.32732/jcec.2020.9.1.24
Balegh, B., Trouzine, H., and Houmadi, Y. (2018). Finite element simulation and prediction of mechanical and electrochemical behavior on crevice corrosion in sheet pile steel. Jordan J. Mech. Industrial Eng. 12 (1), 23–31.
Boudraa, O., Hidouci, W. K., and Michelucci, D. (2020). Using skeleton and Hough transform variant to correct skew in historical documents. Math. Comput. Simul. 167, 389–403. doi:10.1016/j.matcom.2019.05.009
Boukharouba, A. (2017). A new algorithm for skew correction and baseline detection based on the randomized Hough Transform. J. King Saud Univ. - Comput. Inf. Sci. 29, 29–38. doi:10.1016/j.jksuci.2016.02.002
Canny, J. (1986). A computational approach to edge detection. IEEE Trans. Pattern Anal. Mach. Intell. PAMI-8, 679–698. doi:10.1109/tpami.1986.4767851
Cha, Y. J., You, K., and Choi, W. (2016). Vision-based detection of loosened bolts using the Hough transform and support vector machines. Automation Constr. 71, 181–188. doi:10.1016/j.autcon.2016.06.008
Chaves, I. A., Melchers, R. E., Peng, L., and Stewart, M. G. (2016). Probabilistic remaining life estimation for deteriorating steel marine infrastructure under global warming and nutrient pollution. Ocean. Eng. 126, 129–137. doi:10.1016/j.oceaneng.2016.09.013
Duda, R. O., and Hart, P. E. (1972). Use of the Hough transformation to detect lines and curves in pictures. Commun. ACM 15 (1), 11–15. doi:10.1145/361237.361242
Hagiwara, T., Shimamoto, Y., and Suzuki, T. (2021). Detection of deformation in beam-type steel sheet pile revetment by image data with Hough transform. Irrigation, Drainage Rural Eng. J. 312, I1–I9. doi:10.11408/jsidre.89.I_1
Hagiwara, T., Shimamoto, Y., Suzuki, T., Otaka, N., and Fujimoto, Y. (2020). Detection of textural characteristics in visible images of corroded steel sheet pile by gray level co-occurrence matrix. Irrigation, Drainage Rural Eng. J. 310, I145–I153. doi:10.11408/jsidre.88.I_145
Hough, P. V. C. (1962). Method and means for recognizing complex patterns. United States Patent Office, 3069654.
Ishigami, A., Hoshino, K., and Kudoh, Y. (2018). Performance degradation of steel sheet-pile drainage canals in snowy cold regions. Water, Land Environ. Eng. 86 (5), 43–46. doi:10.11408/jjsidre.86.5_421
Ishiguro, K., Shiraishi, M., and Kaiwa, M. (1986). Civil engineering construction technology complete book 3, Steel sheet pile method (first volume). Tokyo: Sankaido Publishing Co., Ltd.
James, M. N., and Hattingh, D. G. (2015). Case studies in marine concentrated corrosion. Eng. Fail. Anal. 47, 1–15. doi:10.1016/j.engfailanal.2014.08.013
Jeffrey, R., and Melchers, R. E. (2009). Effect of vertical length on corrosion of steel in the tidal zone. Corrosion 65 (10), 695–702. doi:10.5006/1.3319096
Karagah, H., Shi, C., Dawood, M., and Belarbi, A. (2015). Experimental investigation of short steel columns with localized corrosion. Thin-Walled Struct. 87, 191–199. doi:10.1016/j.tws.2014.11.009
Matsuyama, T., and Koshimizu, H. (1989). Hough transform and pattern matching in computer vision. J. Inf. Process. Soc. Jpn. 30 (9), 1035–1046.
Melchers, R. E. (2009). Experiments, science and intuition in the development of models for the corrosion of steel infrastructure. Coffs Harbour: Australasian Corrosion Association, 1–19.
Melchers, R. E. (2008). Extreme value statistics and long-term marine pitting corrosion of steel. Probabilistic Eng. Mech. 23 (4), 482–488. doi:10.1016/j.probengmech.2007.09.003
Melchers, R. E., and Jeffrey, R. (2012). Corrosion of long vertical steel strips in the marine tidal zone and implications for ALWC. Corros. Sci. 65, 26–36. doi:10.1016/j.corsci.2012.07.025
Melchers, R. E., Jeffrey, R. J., and Usher, K. M. (2014). Localized corrosion of steel sheet piling. Corros. Sci. 79, 139–147. doi:10.1016/j.corsci.2013.10.038
Moen, C. D., and Schafer, B. W. (2009). Elastic buckling of cold-formed steel columns and beams with holes. Eng. Struct. 31, 2812–2824. doi:10.1016/j.engstruct.2009.07.007
Mukhopadhyay, P., and Chaudhuri, B. B. (2015). A survey of Hough transform. Pattern Recognit. 48 (3), 993–1010. doi:10.1016/j.patcog.2014.08.027
Park, J. H., Kim, T. H. K., Lee, K. S., Nguyen, T. C., and Kim, J. T. (2015). “Novel bolt-loosening detection technique using image processing for bolt joints in steel bridges,” in The 2015 world congress on advances in structural engineering and mechanics (Incheon: ASEM).
Pham, H. C., Ta, Q. B., Kim, J. T., Ho, D. D., Tran, X. L., and Huynh, T. C. (2020). Bolt-loosening monitoring framework using an image-based deep learning and graphical model. Sensors 20, 3382. doi:10.3390/s20123382
Ray, R., Lee, J., and Little, B. (2009). Factors contributing to corrosion of steel pilings in Duluth-Superior Harbor. Corrosion 65 (11), 707–717. doi:10.5006/1.3319097
Refait, P., Grolleau, A. M., Jeannin, M., Rémazeilles, C., and Sabot, R. (2020). Corrosion of carbon steel in marine environments: Role of the corrosion product layer. Cmd 1 (1), 198–218. doi:10.3390/cmd1010010
Schoefs, F., Boéro, J., and Capra, B. (2020). Long-term stochastic modeling of sheet pile corrosion in coastal environment from on-site measurements. Jmse 8 (2), 70. doi:10.3390/jmse8020070
Shi, C., Karagah, H., Dawood, M., and Belarbi, A. (2014). Numerical investigation of H-shaped short steel piles with localized severe corrosion. Eng. Struct. 73, 114–124. doi:10.1016/j.engstruct.2014.04.048
Singh, C., Bhatia, N., and Kaur, A. (2008). Hough transform based fast skew detection and accurate skew correction methods. Pattern Recognit. 41, 3528–3546. doi:10.1016/j.patcog.2008.06.002
Spencer, B. F., Hoskere, V., and Narazaki, Y. (2019). Advances in computer vision-based civil infrastructure inspection and monitoring. Engineering 5 (2), 199–222. doi:10.1016/j.eng.2018.11.030
Suzuki, T., Asano, I., and Ishigami, A. (2019a). Corroded conditions and long-life measures of agricultural steel sheet pile canal -performance design for repair, reinforcement, and update-. Tokyo: Yokendo Ltd.
Suzuki, T., Asano, I., and Ishigami, A. (2017). Corroded conditions, repair and reinforcement measures of steel sheet pile canal. Niigata: Daiichiprinting Co., Ltd.
Suzuki, T., Morii, T., Hara, H., and Haneda, T. (2012). Development of steel sheet pile recycling method contributing to effective utilization of local assets. Water, Land Environ. Eng. 80 (10), 21–24. doi:10.11408/jjsidre.80.10_809
Suzuki, T., Otaka, N., Fujimoto, Y., Shimamoto, Y., and Asano, I. (2019b). Detection and evaluation of corroded conditions in steel sheet pile using infrared images with UAV. Water. Land Environ. Eng. 87 (8), 25–28. doi:10.11408/jjsidre.87.8_659
Ta, Q. B., and Kim, J. T. (2020). Monitoring of corroded and loosened bolts in steel structures via deep learning and Hough transforms. Sensors 20, 6888. doi:10.3390/s20236888
Wall, H., and Wadsö, L. (2013). Corrosion rate measurements in steel sheet pile walls in a marine environment. Mar. Struct. 33, 21–32. doi:10.1016/j.marstruc.2013.04.006
Wang, H., Gao, J., Liu, T., Yu, Y., Xu, W., and Sun, Z. (2022). Axial buckling behavior of H-piles considering mechanical-electrochemical interaction induced damage. Mar. Struct. 83, 103157. doi:10.1016/j.marstruc.2022.103157
Xu, B., Liu, D., Xu, G., Zhang, X., and Bi, L. (2013). A measurement method for contact angle based on Hough Transformation. Measurement 46, 1109–1114. doi:10.1016/j.measurement.2012.10.023
Ye, X. W., Dong, C. Z., and Liu, T. (2016). A review of machine vision-based structural health monitoring: Methodologies and applications. J. Sensors 2016, 1–10. doi:10.1155/2016/7103039
Keywords: steel structure, steel sheet pile, buckling phenomena, corrosion, digital image analysis, Hough transform (HT), inclination angle, non-contact detection
Citation: Hagiwara T, Shimamoto Y and Suzuki T (2022) Non-contact detection of degradation of in-service steel sheet piles due to buckling phenomena by using digital image analysis with Hough transform. Front. Built Environ. 8:948232. doi: 10.3389/fbuil.2022.948232
Received: 19 May 2022; Accepted: 05 August 2022;
Published: 30 August 2022.
Edited by:
Ninel Alver, Ege University, TurkeyReviewed by:
Chuanzhi Dong, Palo Alto Research Center Incorporated, United StatesDenizhan Yavas, University of Central Florida, United States
Copyright © 2022 Hagiwara, Shimamoto and Suzuki. This is an open-access article distributed under the terms of the Creative Commons Attribution License (CC BY). The use, distribution or reproduction in other forums is permitted, provided the original author(s) and the copyright owner(s) are credited and that the original publication in this journal is cited, in accordance with accepted academic practice. No use, distribution or reproduction is permitted which does not comply with these terms.
*Correspondence: Taiki Hagiwara, ZjIxbjAwMWNAbWFpbC5jYy5uaWlnYXRhLXUuYWMuanA=
†These authors have contributed equally to this work and share first authorship