 Ahmad Hajinejad
 Mohammad Hossein Jahangir
 Minoo Askari
- Renewable Energies and Environmental Department, Faculty of New Science and Technologies, University of Tehran, Tehran, Iran
Due to the high potential of tourism in Iran and the high utilization of tourist buildings in Iran, as well as the high energy consumption in the buildings sector, this study aims to provide a feasible model for designing a renewable energy supply system for a tourist building in different climates of Iran. According to the country’s climate, 5 cities of Ahvaz, Bandar Abbas, Rasht, Mashhad, and Yazd were selected as the cities under study. The hybrid system also consists of photovoltaic panels, wind turbine, battery, and converter for power supply and boilers with natural gas fuel and geothermal heat pump to provide building thermal load. The heat pump is used to supply the load needed to preheat the building’s hot water. The system is connected to the electricity grid, so by selling excess electricity, the net project costs (NPC) will be reduced and the system can provide part of its need from the grid. The scenarios which were studied are of two categories. In the first category, all the thermal load is supplied by the boiler. After selecting the best economic scenario by Homer software in this category, the heat pump is added to the system by calculating the thermal load required to preheat the hot water. The scenarios used two types of wind turbines with a capacity of 10 and 50 kW and two types of 25-W panels with different efficiencies of 15.3% and 18%. Finally, a top-down scenario was chosen for each city. The best city to run the project on economic criteria is Mashhad with an NPC of $ 195,745 and a renewable fraction of $ 50.5. Using a heat pump to preheat the hot water, would also save 7% on fuel consumption and reduce CO2 production by 639,000 kg per year.
1 Introduction
The energy crisis and global warming are among the main concerns of humans in different countries. These two problems are related; taking measures to solve one contributes to solving the other one. Sustainable development practices in different energy consumption areas are among the strategies governments adopt to cope with climate change. The public knowledge of environmental problems has grown in recent years. This has led governments to pursue practices to minimize environmental destruction (Apoorv, 2010).
Considering that buildings account for a large portion of energy consumption and pollutant and waste production in societies, it is essential to modify their functions in this respect. For example, the production of building materials, such as tiles, glass, and cement, accounts for a much larger portion of carbon dioxide emissions than industry and transportation do in societies. Buildings stand for 40%–50% of the consumption of water, energy, and raw materials. Also, the building industry accounts for 40%–50% of water pollution, air pollution, greenhouse gas emission, and CFC production (UNEP, 2009). The use of buildings with optimal energy consumption reduces energy consumption by up to 40%. This will also considerably decrease energy consumption-related costs (Roufechaei et al., 2014). The research has shown that taking measures to optimize buildings’ energy consumption will reduce greenhouse gas emissions by 142 and 294 mega tones by 2020 and 2030, respectively (Marszal et al., 2011).
The construction and development of green buildings is a method used to optimize the energy consumption of buildings. According to definition, Green building means saving resources, protecting the environment, reducing pollution during the whole life cycle of the building, providing people with healthy, comfortable, and efficient use of space to the greatest extent, and achieving harmonious symbiosis with nature (Zhang et al., 2021). Green buildings offer many advantages, including reduced energy (fossil fuel) consumption, reduced greenhouse and pollutant emissions, reduced energy cost, and the generation and selling of clean power to the network. Numerous researchers and organizations have shown that the acceptance and use of green buildings can make a significant contribution to the building industry in achieving sustainable development.
A Net-zero energy building (NZEB) is another concept used for such buildings. These buildings generate their required energy through by different renewable methods, such as wind energy, solar energy, and geothermal energy within or near the building (Marszal et al., 2011). Net-zero energy buildings are one of the promising decarbonization attempts due to their potential of decreasing the use of energy and increasing the total share of renewable energy. To achieve a net-zero energy building, it is necessary to decrease the energy demand by applying efficiency enhancement measures and using renewable energy sources (Ahmed et al., 2022). As a result, the net energy consumption of the building becomes zero during a given period. Moreover, when energy generation exceeds energy consumption, the additional energy is sold to the network and brings income.
The present study selects five Iranian cities as representatives of different climates. Then, a tourism building with a medium size is employed as the case study, modeling its electrical and thermal loads. A portion of the energy requirement is supplied by renewable energy resources, such as solar, wind, and geothermal energy. Then, by designing different scenarios with the mentioned resources along with a boiler, a battery, and a powerful network, the economically optimal scenario is determined. Thus, a suitable model will be obtained for tourism buildings in different climates in Iran.
Finally, the effects of some important variables on the economic parameters will be evaluated by performing the sensitivity analysis on the optimal scenario.
1.1 Hybrid renewable energy systems (HRESs)
Hybrid systems are a combination of renewable resources, fossil energy resources, and energy storage mechanisms to supply the required power in two casnon-network-connected, and non-network connected (standalone). Considering the presence of energy storage systems and the occasional use of fossil resources, the safety factor of such systems is larger than that of individual renewable resources in supplying energy. Also, such systems can sell additional power to the power network and be more cost-effective. Wind and solar resources are the main renewable resources used in hybrid renewable energy systems (HRESs).
Geothermal energy, particularly heat pumps, is also employed to supply the entire or a portion of a building’s heat requirement. According to studies, approximately 70% of geothermal heat pumps’ energy is supplied by geothermal renewable resources (Chua et al., 2010). The main advantage of heat pumps is their high energy consumption efficiency. They reduce not only energy costs but also greenhouse gas emissions (Lim et al., 2016). Conducted a study in Britain and reported that users that replaced their common gas-fuel heating systems with a ground-source heat pump (GSHP) saved £410–595 per year (Xie et al., 2017).
Overall, the advantages of HRESs can be said to be increased renewable energy source contribution to energy generation, reduced energy cost, reduced greenhouse gas emission, and providing rural populations with access to power. These, in turn, lead to the three objectives of sustainable development, including economic, environmental, and social aspects. Asian countries such as Iran have a high potential for use renewable energy resources.
It is essential to optimize different components of hybrid systems, including the number of wind turbines, the capacity of photovoltaic panels, and the capacity of batteries and converters. Numerous studies investigated this problem from different points of view.
Shivarama et al. (Shivarama Krishna and Sathish Kumar, 2015) resented a comprehensive review of hybrid renewable energy systems. They considered modeling, analysis, optimal sizing, energy, management, and control aspects of the HRES. In 2017, Hongyang Zou did a technical and economic analysis of large-scale PV power generation in China. That study has been performed to fulfill the residential load of five different cities, and both grid-connected and off-grid PV system scenarios have been considered (Zou et al., 2017). Zabalaga et al. (Jimenez Zabalaga et al., 2020) resented the performance analysis of the HRES including photovoltaic (PV), biomass Stirling engine and battery system. They compared the HRES with the PV/diesel engine/battery hybrid system and performed the analysis in terms of energy efficiency, environmental sustainability, and economic feasibility. Their results revealed that the HRES performed better in terms of each indicator in the analysis. In a study by Shebaz A. et al. (Memon et al., 2021) optimizing the size components of HRES for a remote rural region was studied. The case study had both standalone and grid-connected modes. The methodology used validated using HOMER software by comparing its results with HOMER results for the cases considered. Upadhyay and Sharma (Upadhyay and Sharma, 2014) and Shivarama and Sathish (Shivarama Krishna and Sathish Kumar, 2015) evaluated energy management, optimization methods, design criteria, and other problems of different HRES function modes—i.e., network-connected and non-network connected.
1.2 Simulating HREs in HOMER software
Shahzad et al. (2017) designed a hybrid system that used biomass and solar resources to supply the required power for an agricultural farm and a residential community in Pakistan. They treated Sun radiation information and biomass potential in the case study region as inputs and proposed an optimal system by optimizing the power generation price. Results then were refined further by performing sensitivity analysis on biomass potential, biomass price, solar irradiance, and variations in loads. Mehrpooya et al. (2018) designed a hybrid system to supply the power of a laboratory at the University of Tehran, Iran, using the Homer Software. They employed batteries and fuel cells to store energy. Four scenarios were included: a diesel generator scenario, a solar panel-generator-battery scenario, a solar panel-battery scenario, and solar panel-fuel cell scenario. Finally, the solar panel-generator-battery scenario was proposed to be the most economically optimal choice. Samir M. Dawoud (Dawoud, 2021) studied developing different hybrid renewable sources of residential loads as a reliable method to realize energy sustainability in Egypt. A combination of four different hybrid renewable sources of SPV, wind turbines, diesel engines, and storage batteries is considered for residential systems. The simulation results, optimization, and modeling procedures are completed with the use of HOMER software. Results show that the SPV-wind-diesel-battery source has a minimum value of the cost of the energy annually 0.275$/kWh and the.
SPV-diesel source has a higher value of the cost of the energy with 0.36 $/kWh.
In a study by Mokhtara et al. (2020) an optimal design of an off-grid HRES for arid climates is suggested and a techno-economic feasibility study of a hybrid PV-wind-battery-diesel energy system is done by HOMER. It is found that PV-Li-ion represents the best configuration, with TNPC of $23,427 and cost of energy (COE) of 0.23 $/kWh.
Olatomiwa et al. (2016) investigated different hybrid scenarios by HOMER to supply the required electrical load of a rural health clinic. The clinic was planned to be constructed in one of six regions in Nigeria. The candidate regions’ potential for using renewable resources was investigated. It was found that the potential of the wind energy resource is higher than other choices in the two regions. The regions, however, had almost the same potential for solar energy. Finally, it was found that the hybrid solar panel-diesel-battery system was the most optimal choice for regions that had no access to the power network, while the wind-solar-diesel-battery system was the most optimal choice for other regions.
Ayodele et al. (2019) employed a hybrid wind-solar-diesel-battery system to provide the electrical load of a small bank in a remote village in Nigeria. The optimal HOMER-selected system yielded a net present cost (NPC) and a cost of energy (COE) of $469000 and 0.667 UDS/kWh, respectively. Also, the system reduced environmental pollutant generation by 50%.
Türkay and Telli. (2011) employed HOMER to obtain an HRES including a wind turbine and photovoltaic panels with a hydrogen storage system to supply the required power for Faculty of Electricity, Istanbul University. The cost of energy (COE) was found to be 0.307 UDS/kWh.
Boussetta et al. (2017) studied the feasibility of a micro-grid hybrid wind-solar system by HOMER to supply the electrical load of public infrastructures in different Moroccan cities with different geographical parameters. Their results indicated that the proposed micro-grid system was an optimal choice, except for regions where the mean annual wind speed was low.
Fazelpour et al. (2014) implemented a network-independent hybrid system using solar and wind resources to supply the power of a small hotel with 125 rooms on Kish Island, Iran. The economic analysis was performed on the proposed system in HOMER. The effects of factors such as wind speed, solar radiation, and fuel price were evaluated by performing the sensitivity analysis. Finally, the hybrid wind-diesel-battery system was selected as the optimal scenario to supply the hotel’s power.
Aagreh and Al-Ghzawi. (2013) employed HOMER to select a hybrid system that used wind and solar resources to supply the power of a small hotel in a city in the north of Jordan. A system with a wind turbine connected to the power network was selected as the optimal scenario by investigating the NPC, RF, and investment return time. The system could supply 62% of the power requirement of the hotel with wind energy, and the surplus power would be sold to the network.
Güler et al. (2013) evaluated different scenarios with wind turbines, solar panels, and batteries to supply the power requirement of a hotel in Turkey. Different network connections, network independence, and power sale cases were studied by HOMER. It was found that batteries and converters were needed only when the surplus power was sold to the network and the entire required power of the hotel was supplied by renewable resources. As a result, the initial cost of the system would be higher than that of the case in which a portion of the power was purchased from the network.
Dalton et al. (2008) analyzed different standalone and grid-connected scenarios to supply the power of a hotel with a capacity of more than 100 at the Queensland beach, Australia, by HOMER. According to the results, a hybrid grid-connected system would be able to supply 73% of the required power of the hotel through renewable resources. Also, its investment return time was found to be 14 years, reducing 65% of greenhouse gas emissions. It was also observed that the use of wind turbines was more cost-effective than the use of solar panels for the hotel.
Hence, case studies were conducted to propose hybrid models to supply the required energy of tourist buildings. However, no studies incorporated the entire climate. Also, geothermal energy was not employed along with wind and solar resources to supply the energy of tourist buildings. Thus, the present study supplies some portions of the heat requirements of hotels in different climates in a country by using heat pumps.
2 Materials and methods
This study aims to select the best scenario among several scenarios based on technical, economic, and environmental criteria. The first group of scenarios employs only boilers to supply the heat requirement. In the last scenario, the hot water requirement is supplied by heat pumps, while the remaining heat load is supplied by a boiler.
2.1 Select the cities
A representative was selected from each climate to cover the entire climate of Iran. Alijani and Heydari (Alijani and Heydari, 1999) classified Iranian cities into five groups by using multivariable statistical techniques and investigating 49 climatic variables in 43 stations. Considering that the incorporated building was a tourist building, the main cities of each climate with more tourist attractions and a higher number of tourists were selected as the representatives of the climates, as shown in Table 1.

TABLE 1. Iran’s climatic divisions and representative cities.
2.2 Building specifications
Considering the high tourism capacity of Iran and the ever-increasing need for residential complexes and hotels, a tourist building was selected as the case study. An apartment hotel with four floors and a medium-size was used as the base building since the study was aimed at investigating five cities and be used as a reference for other cities. An advantage of this selection was that there were a large number of apartment hotels in different Iranian cities, and no high investment was required for construction. Table 2 shows the specification of the hotel.

TABLE 2. Specifications of the hotel’s rooms.
The hotel had 45 rooms, with a maximum total capacity of 110 people. This information will be used to calculate hot water consumption and heat load.
2.3 Mathematical model
2.3.1 Heat pump
The function of a geothermal heat pump depends on the heat exchanger design. The tube length, which is dependent on the climatic characteristics, soil, and technical heat pump specifications, is an essential parameter of heat exchangers.
Considering that the groundwater level was high in Rasht and Bandar Abbas and that the soil was hard in Mashhad, a heat pump with horizontal pipes was employed since deeper excavation would be required to install vertical pipes.
The heat transfer from the Earth to the fluid in a heat pump with horizontal pipes is calculated as (Khan, 2017):
Where Q is the heat transfer from soil into the refrigerant or vice versa (W), L is the length of the tube (m) and R is the heat resistance, which is equal to:
Where S is shaping Factor which is:
Where d is the depth of pipe underground the surface (m),
Where
The temperature of the soil is a function of time and depth which is calculated as (Kusuda and Achenbach, 1965):
Where
2.3.2 Photovoltaic panels
The output power of a panel is calculated as (Hassan et al., 2018):
Where
Where
2.3.3 Wind turbines
The electric energy generation of a wind turbine is dependent on the wind speed and the energy received by the turbine from the wind. It is calculated as:
Where V is the wind velocity (m/s), A the area of air which is encompassed by the blades of the turbine (m2) and
A turbine’s power generation is calculated as (Baneshi and Hadianfard, 2016):
Where
2.3.4 Economic parameters
According to the Central Bank of the Islamic Republic of Iran, the interest rate and inflation were considered as 15% and 10%. The lifetime of the project was considered to be 25 years, considering the reported lifetimes of the selected equipment, including the panels and turbines.
The net present cost (NPC) is the criterion of HOMER to select the highest scenario. Thus, a scenario’s initial cost might be the largest, while its total estimated cost of 25 years would be the lowest, being selected as the highest scenario. This parameter and the cost of electricity (COE) are calculated as (Dalton et al., 2008):
Where
Where
2.4 Simulation tool: HOMER
Homer is a simulation software program whose main task is to design and propose different power generation systems in standalone and network-connected modes. It was introduced by the National Renewable Energy Laboratory (NREL) in 1993, primarily aiming to meet the requirement of the renewable energy industry for system analysis and optimization (Lau et al., 2010).
2.5 Inputs
2.5.1 Electrical load
The data available in HOMER for a small hotel with four floors were used to obtain the electric power required by the hotel. HOMER proposes the required electrical load of a hotel separately for each city.
2.5.2 Power network
To improve the system’s reliability and prevent the initial cost rise of the power supply system, the portion of the building’s required power that was not supplied by renewable sources was purchased from the power network by connecting the network to the power distribution network. Also, the hotel’s costs would be saved by selling the surplus power to the network. According to the prices determined by the government for purchasing renewable sources’ power, the electricity price was selected to be $0.07 per kWh.
Figure 1 and Table 3 represent the power tariffs during a year in Iran.
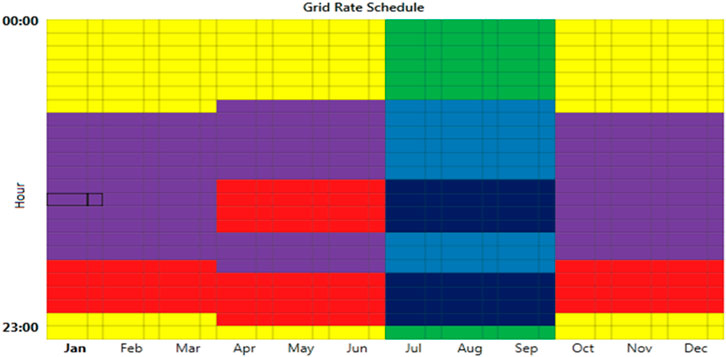
FIGURE 1. Power tariffs during a year in Iran (“Iran Ministry of Energy—Tariffs” n. d.).
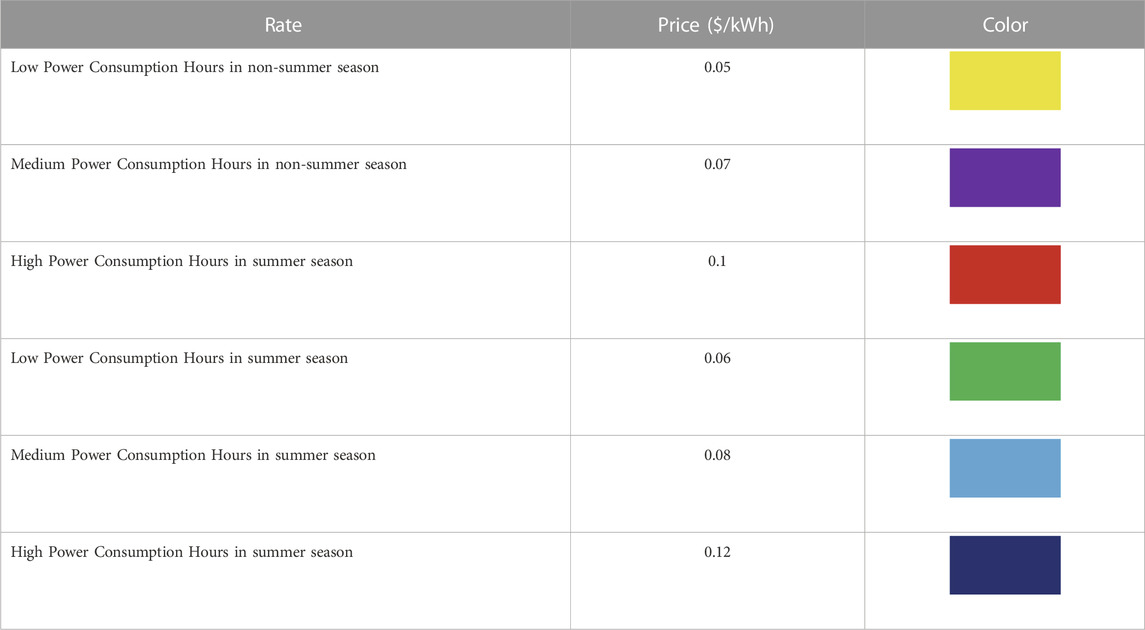
TABLE 3. Power tariffs in Iran (Firozjaei et al., 2020).
Iranian power plants mostly consume fossil fuels, particularly natural gas, to generate power. Thus, the pollution produced by such power plans is an essential and costly challenge of the government in the health sector. Table 4 provides the pollution data of Iranian power plants and the determined penalties based on the Iranian Energy Balance Sheet.
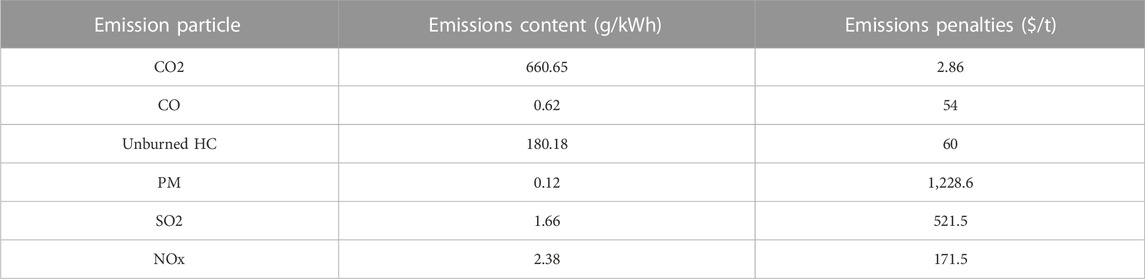
TABLE 4. Emissions of Iranian power plants and the determined penalties (Gruber et al., 2015; Hanafizadeh et al., 2016).
Several factors cause a power outage and reduce the power distribution network’s reliability, including worn-out power distribution systems, increased power consumption at peak hours, and network defects. Although these are less likely in large cities than in villages and outlying regions, they are possible, particularly in summer and at peak hours. Thus, according to the mean power outage data reported by the Ministry of Energy, the power outage time of large cities was assumed to be 60 h. Also, the mean time required to fix the power outage was considered as 4 h (Jahangir et al., 2021b).
2.5.3 Thermal load
A large portion of a hotel’s heat load consists of the hot water supply, heating, and cooking. Two major methods are investigated to supply this portion of the hotel’s required energy. In the first group of scenarios, only a typical boiler that consumed natural gas was employed to supply the heat requirement. In the next scenario, the hot water supply was considered a responsibility of a heat pump, with the remaining heat load being supplied by the boiler.
The heat requirement of the building was assumed to be 1.5 times as high as its electric requirement to calculate the building’s heat load. Then, the ratio was changed to obtain results at other rates by performing a sensitivity analysis on the selected scenario of each city.
2.5.4 Solar panels
Figure 2 represents the Sun radiation and wind speed diagram of Mashhad during the year.
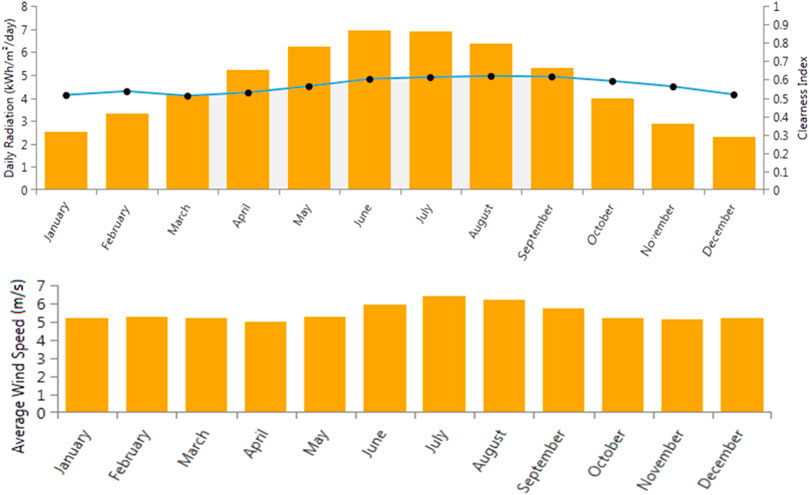
FIGURE 2. Sun radiation and average wind speed diagram of Mashhad during a year from HOMER.
Table 5 shows panels that were used in scenarios.

TABLE 5. Specifications of the panels used in this study (Mandal et al., 2018).
It should be noted that the installation of solar panels encountered space limitations. The total area of each floor was 400 m2, some portion of which was used for the installations, such as the cooling system and wind turbine. Thus, a maximum of 70% of the root area (i.e., 280 m2) could be employed to install solar panels.
According to the dimensions of the panels and the space limitation, Table 6 provides the maximum power generation capacity of the solar panels.

TABLE 6. Specifications of the turbines used in this study (Zahariea et al., 2018).
According to Table 6, the maximum load of the selected panels was considered to be 50 and 60 kW.
2.5.5 Wind turbine
Not only the initial turbine cost but also the availability of turbines in the domestic market is an essential factor in selecting turbines. Furthermore, considering the power curves of turbines, which are developed based on wind speed, the selected turbines should function at the mean velocities of cities. The mean wind speed in the five selected cities are 6.56 m/s for Yazd, 5.24 m/s for Ahvaz, 5.53 m/s for Bandar Abbas, 5.48 m/s for Mashhad and, 6.58 m/s for Rasht respectively based on HOMER data.
Table 6 shows the turbines employed for the scenarios.
Given that it was required to install wind turbines near the hotel building, the required installation area had to be estimated to obtain a more accurate estimate of the project cost, adding the cost of the land to the total cost of the project. Thus, no constraints were applied to the number of wind turbines.
2.5.6 Converter
A generic converter with a capacity, initial cost, lifetime, replacement cost, and maintenance cost of 1 kW, 600 USD, 15 years, 600 USD, and 30 USD/year, respectively, were used to convert the DC output of the panels into the AC. The efficiency of the inverter was considered to be 90% (Mohammadi et al., 2018).
2.5.7 Battery
A battery was employed to store power to make maximum use of renewable power generation and reduce the dependence on the power distribution network. According to Ref. (Chan et al., 2009), a Surrette 4 KS 25 P battery with a capacity, initial cost, replacement cost, lifetime, and maintenance cost of 7.55 kW h, 1259 USD, 1100 USD, 12.5 years, and 5 USD/year, respectively, was used.
2.5.8 Boiler
A generic natural gas-fuel boiler was employed to supply the heat load of the building—the entire and a part of the load in the first and second scenarios, respectively. The efficiency of the boiler was 85%. The gas price was considered to be 0.03 USD/m2 (Tanaka et al., 2008).
2.5.9 Heat pump
2.5.9.1 Hot water
It was required to obtain the heat requirement of the building to calculate the heat supply of the heat pump. The mean hot water consumption of a double room for a day in different seasons are about 382.2 L/day for summer, 319.4 L/day for winter, and 356.7 L/day for spring and autumn, respectively (Tanaka et al., 2008). Also, the total hot water for each seasons are 34,398, 28,746, and 64,206 L/season. The hot water requirement of the hotel was calculated in each city and season, as shown in Table 7.

TABLE 7. Mean hot water consumption of hotel in each season.
Assuming the water tank of the heat pump to be placed inside the building to avoid freezing in cold seasons, it can be said that the input temperature of the pump was equal to the building temperature. The desirable temperature of a residential building was considered to be 25°C and 20°C in warm and cold seasons in Ref. (Tanaka et al., 2008), respectively.
The present study’s reference for the temperature in different seasons and cities was the data of HOMER. Table 8 provides the mean temperature in different seasons.
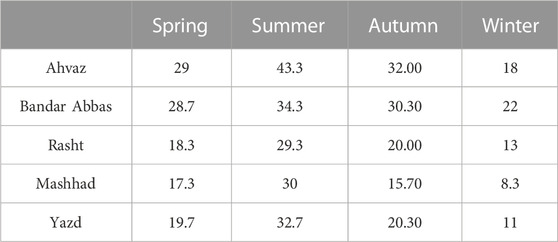
TABLE 8. Mean temperature in each season in 5 cities.
It should be noted that the heat pump was limited in raising the water temperature. In other words, a geothermal heat pump can only preheat since the temperature of the ground, which is the heat source in winter, is constant.
Also, the output temperature was required to be a value between the input fluid temperature and ground temperature. Since it influenced the lengths of the pump pipes as the input of the problem, it was considered to be the mean value of the soil temperature and input fluid temperature.
According to (Khan, 2017), the pipe placement depth was selected to be 5 m. The output water temperature of the heat pump was obtained by calculating the soil temperature through the equations of the previous section, as shown in Table 9.
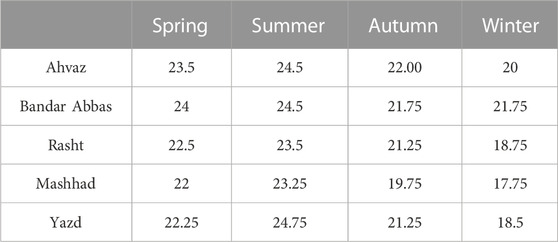
TABLE 9. Mean temperature of the output water of the heat pump.
Finally, the energy required to raise the water temperature to the calculated value is obtained as
Where
Table 10 reports the heat transfer of the heat pump in kWh/day. The remaining heat had to be supplied by the boiler.
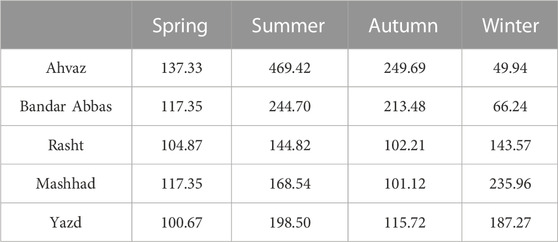
TABLE 10. Daily heat required to supply the hot water of hotel in kWh/day.
The required pipe length was then calculated in different cities and seasons based on the maximum values in the seasons, as shown in Table 11.
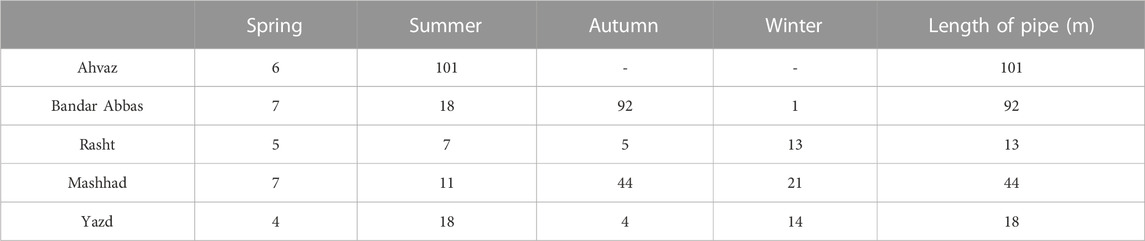
TABLE 11. Pipe length of the heat pump.
As can be seen, the heat pump was mainly used in hot seasons to reduce the input water temperature in the cities with high air temperatures. Thus, the required pipe lengths were calculated higher for hot seasons than for other seasons.
The pipe lengths obtained for Mashhad, Rasht, and Yazd were common pipe lengths for heat pumps. Thus, the length size could be reduced by raising the number of fluid circulation rounds within the pipes to reduce the pipe length in Ahvaz and Bandar Abbas.
To obtain the heat load in the scenarios of the second group, it was required to subtract the values provided in Table 11 from the heat loads of the cities, remodeling the conditions.
According to Geothermal Heat Pump Costs and Heating System Installation Prices, approximately 2,500 USD/ton was required for a heat pump to receive the heat transfer of the heat pump. A ton is heat transferred by a heat pump in an hour—i.e., a ton is 12,660 kJ.
Also, the pipes required 800 USD/ton for heat transfer. Thus, it can be concluded that the cost of a heat pump with a capacity of 1 ton is approximately 4,000 USD, including the installation and maintenance costs. Furthermore, the average annual operation and maintenance cost of the heat pump is 250 USD.
Since the obtained heat transfer values for the supply of hot water were small, a heat pump with a capacity of 1 ton could be employed.
The required pump cost was added to the initial cost in the software to be included in the scenarios of the second group.
2.6 Scenarios
As mentioned, it was required to include a total of four scenarios for each city, considering that two wind turbines and two solar panels were employed. Furthermore, two cases were considered to supply the heat load (i.e., a boiler and a boiler with a heat pump), the heat pump was included in the top scenario so the performance of the top scenario with the heat pump could be investigated. Table 12 represents the scenarios. Figure 3 illustrates the schematic of the hybrid power generation system’s components.
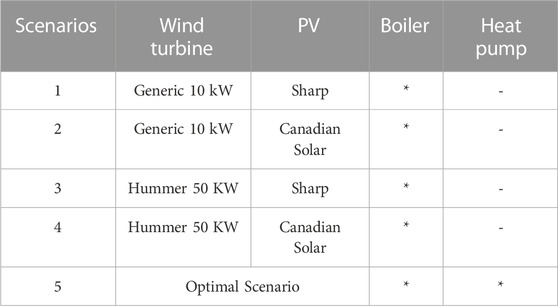
TABLE 12. Scenarios.
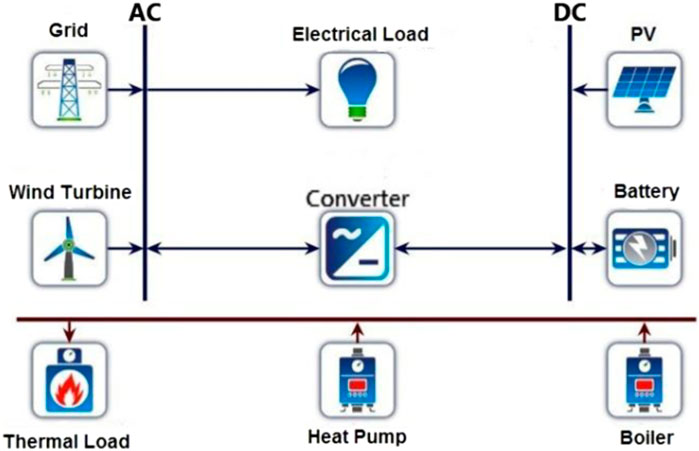
FIGURE 3. Schematic of the hybrid power generation system’s components.
3 Results and discussion
3.1 Scenarios without heat pump in mashhad
Table 13 reports the results of the four scenarios with no heat pumps for Mashhad. As can be seen, due to its lower COE and NPC, the third scenario with eight 50-kW Hummer turbines and eight 5-kW Sharp solar panels was selected as the best scenario. The initial cost of the third scenario was also smaller than the other projects. Moreover, more than 518,000 kW of power would be sold to the power distribution network every year.
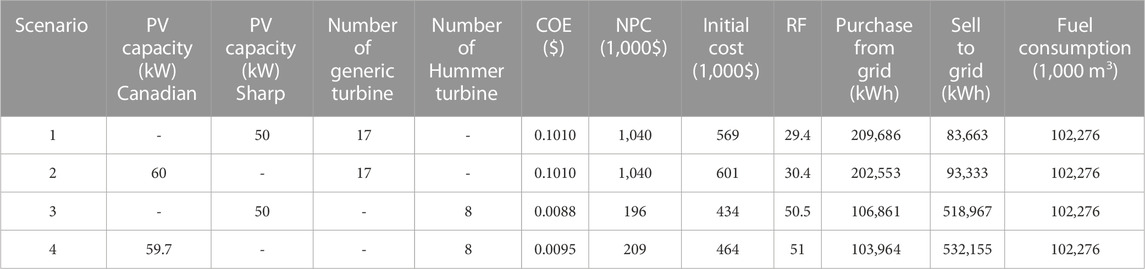
TABLE 13. Results of the scenarios for Mashhad and the best scenario.
Figure 4 represent the distributions of the power sold to the grid and purchased from the power network, respectively. According to Figure 4, more power was sold to the power network in summer than in other seasons. Approximately 83% of the building’s power was supplied by wind turbines. The mean wind speed was larger in summer than in other seasons in Mashhad. Thus, the turbine power generation and then, the power sold to the power network were higher in summer.
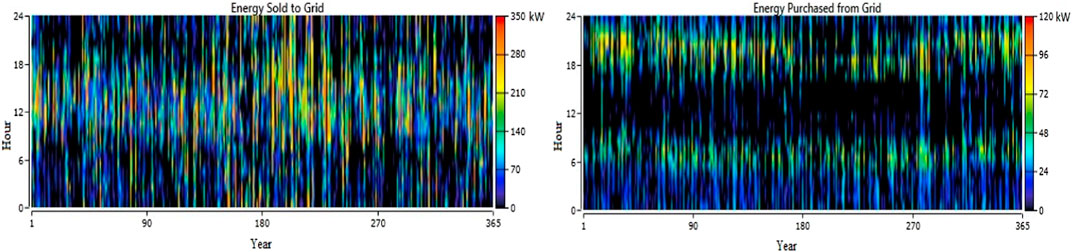
FIGURE 4. Distribution of the daily power sold to the grid during a year (kW).
According to Figure 4, the color is black for most days of the year between 6:00–18:00. This suggests that the power purchase was approximately zero during this period. The Sun radiation during days and thus, solar panel power generation are an explanation for the reduced power purchase.
Figure 5 demonstrate the electric energy generation of the wind turbines and solar panels in the best scenario of Mashhad, respectively.
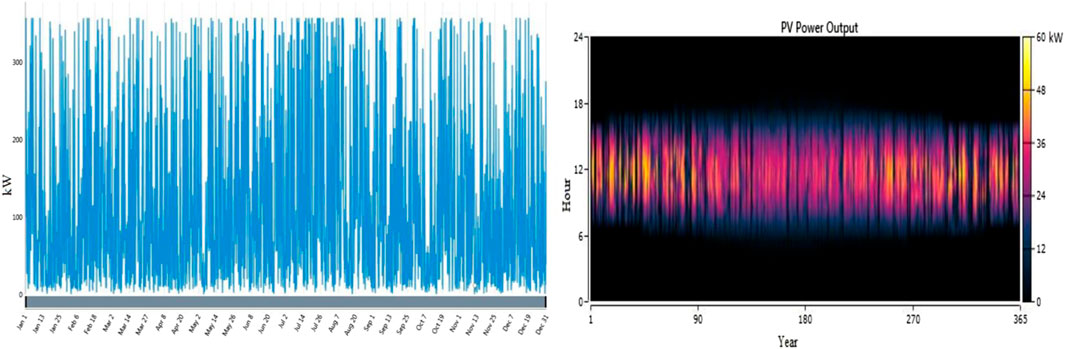
FIGURE 5. Electricity generation of the wind turbines and solar panels during a year in Mashhad (kW).
Table 14 provides the total annual shares of the energy sources.
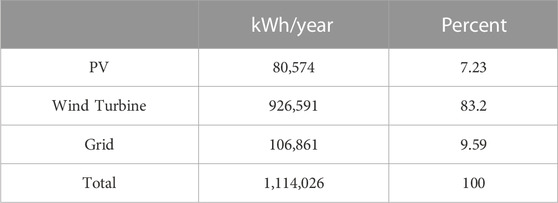
TABLE 14. Annual shares of different sources in electricity generation.
According to Table 14, the wind power generation was higher in summer than in other seasons due to the larger mean wind speed.
As can be seen from calculations, the cost of the project was high in the first year due to the initial costs of equipment and components. The only cost of the system was that of purchasing fuel, and the system had a constant earning in light of selling power to the power network between the second and 11th years. Considering the battery service life of 12.5 years, the battery replacement cost is shown for the 12th year. In the 15th year, it was required to replace the converter, as the converter replacement cost can be observed. The service life of the wind turbines ended, needing to be replaced in the 20th year. The twenty-fifth year was the last year of the system’s service life, after which the sellable components (i.e., the turbines and converter) would be sold, providing income. Table 15 shows the income and costs of different sections during the project life.
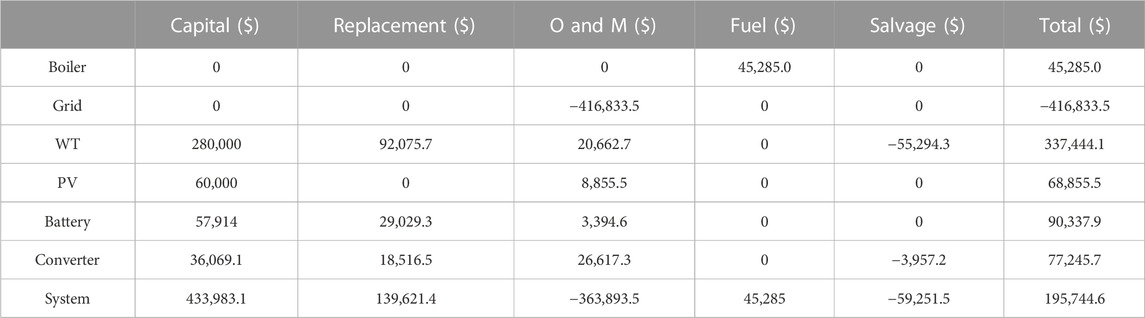
TABLE 15. Costs and incomes of the best scenario for Mashhad.
Table 16 reports pollutant production. It compares the results of two cases, i.e., the case in which the entire required power of the building was supplied by the power network and the case with the best scenario.
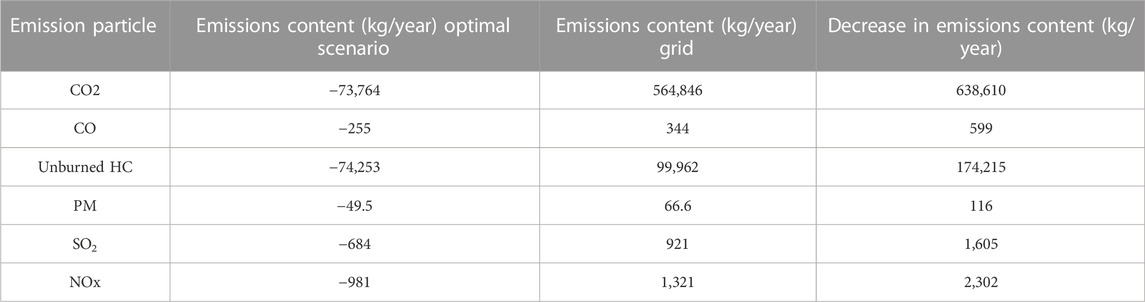
TABLE 16. Reduction in emissions in the best scenario for Mashhad.
3.2 Top scenario with heat pump in mashhad
A heat pump was added to the best scenario of the previous section to supply the building’s heat requirement for preheating water. Table 17 provides the results of this scenario.

TABLE 17. Comparison of the best scenario in two cases without and with heat pump.
As can be seen, the addition of the heat pump to the energy supply system of the hotel slightly increased the COE, NPC, and initial cost by 5.2%, 2.1%, and 1%, respectively. However, the natural gas consumption of the boiler was reduced by 7%, leading to a 2% lower CO2 emission than the best scenario.
3.3 Comparing cities results
This section compares the scenario results of the cities from different viewpoints. Figure 6 compares the COE, NPC, initial cost, and RF results of different scenarios in the cities, respectively.
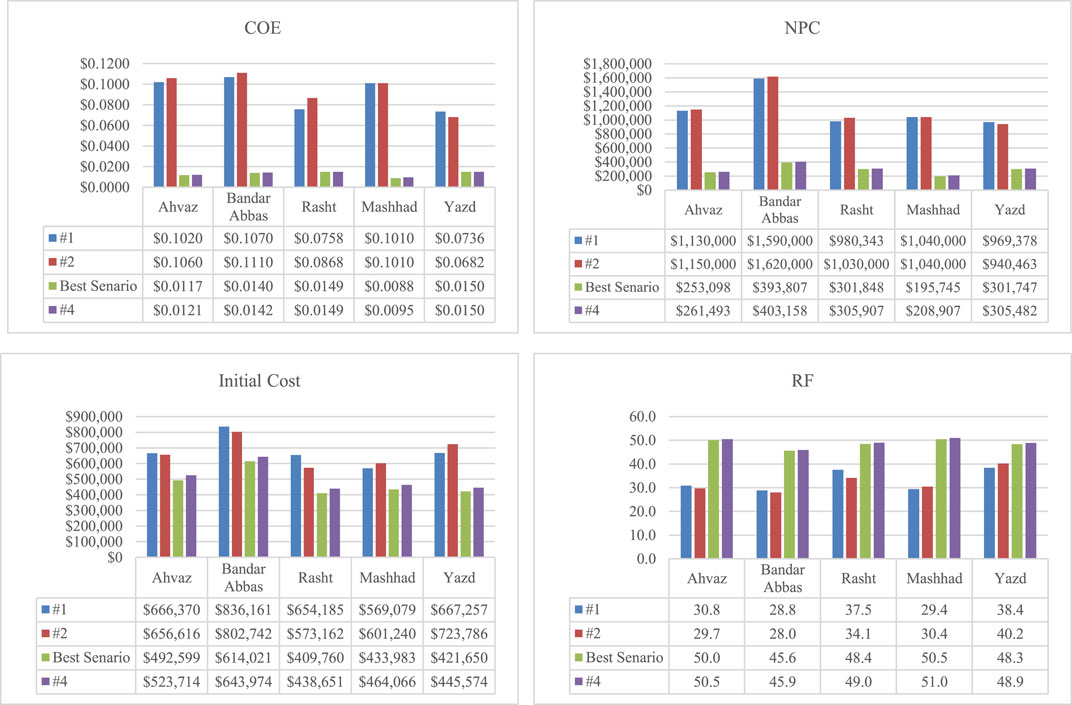
FIGURE 6. Comparison between the COE, NPC, initial cost, and RF of different scenarios in the cities.
As can be seen, the cost of each power generation unit was larger in scenarios 1 and 2 than in scenarios 3 and 4 due to the higher number of turbines in scenarios 1 and 2. The lowest COE was obtained for Mashhad, while the highest was derived for Yazd and Rasht. The project costs of scenarios 1 and 2 were significantly higher than those of scenarios 3 and 4 due to the higher number of turbines and batteries and the larger converter capacities in scenarios 1 and 2.
The lowest NPC was obtained for Mashhad, while the highest NPC was derived for Bandar Abbas. The higher electricity consumption of Bandar Abbas was an explanation for this phenomenon.
The differences in the initial costs were not as large as the differences in the COE and NPC. Among the twenty cases, the smallest initial cost was obtained for the best scenario of Rasht, while the largest initial cost was derived for the first scenario of Bandar Abbas. Also, the largest initial cost of the best scenario was calculated for Bandar Abbas.
As can been in Figure 6, the highest renewable fraction was obtained for the best scenario and scenario 4. Although the renewable fraction of scenario 4 was higher than that of the best scenario, scenario 3 was selected as the best scenario due to its economic advantages. The lower power generation of the turbines in scenarios 1 and 3 were reasons for their lower renewable fractions.
Finally, Mashhad and Ahvaz were found to be the best cities in terms of the COE and NPC for the implementation of the best scenario.
3.4 Sensitivity analysis
The sensitivity analysis identifies the effects of different parameters on the type and components of the system, including the NPC, COE, renewable fraction, and pollutant production. Such parameters can include economic and environmental parameters, such as the mean solar radiation, power sale, and purchase tariffs, and electric and heat loads.
The present study performed sensitivity analyses on the natural gas price, heat load/electrical load ratio, initial turbine and solar panel costs, interest, and inflation rate respectively.
It should be noted that sensitivity analyses were performed on the scenarios that did not include heat pumps since they were more affordable. In other words, sensitivity analyses were performed on the best scenario with no heat pumps.
According to Table 18, the above-mentioned parameters were determined in HOMER, carrying out sensitivity analyses on the best scenarios of Mashhad and Ahvaz.
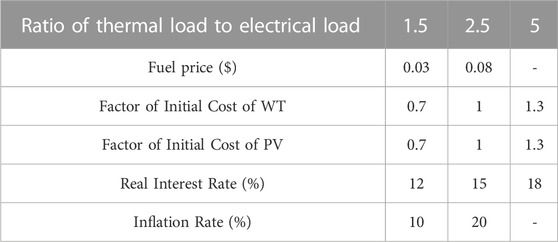
TABLE 18. Values of the studied parameters in the sensitivity analysis.
3.4.1 Natural gas price - Heat load/electrical load ratio
Two cases were included to determine the natural gas price: a case with the current gas price and a case without governmental subsidies. The heat load/electrical load ratio is strongly dependent on the consumption pattern. Thus, the investigation of the heat load/electrical load ratio would considerably help obtain more accurate results.
Figure 7 depicts the sensitivity analysis results of the two parameters.
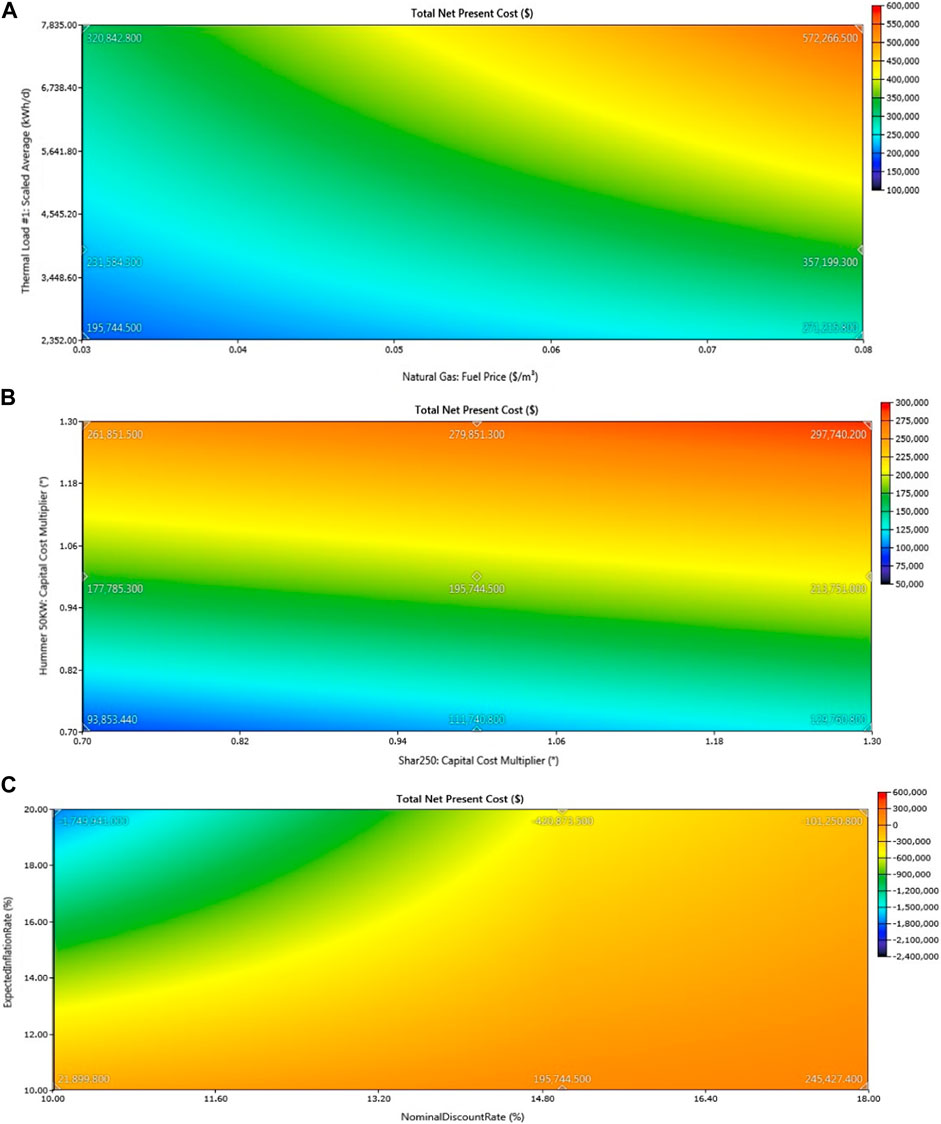
FIGURE 7. (A) Variation of NPC in the sensitivity analysis of Natural gas price - heat load/electrical load ratio (B) Variation of NPC in the sensitivity analysis of Initial cost of wind turbines and solar panels (C) Variation of NPC in the sensitivity analysis of Interest and inflation rates.
As can be seen in Figure 7, a rise in the natural gas price predictably raised the NPC since the increased gas price increases the total project cost.
3.4.2 Initial cost of wind turbines and solar panels
It is essential to investigate the effects of price variations on the scenarios since the economic situation of Iran is not so steady. Thus, investigating the initial cost of purchasing wind turbines and solar panels, it was attempted to predict the effects of the initial cost on the total project. Also, the variations of the wind turbine and solar panel prices were assumed not to exceed 30%.
According to Figure 14, an increase in the wind turbine or solar panel price increased the NPC.
It should be noted that the variations of the NPC versus the turbine and panel prices considerably differed due to the larger initial cost of wind turbines than that of solar panels.
3.4.3 Interest and inflation rates
Also, according to Figure 7, the NPC reduced as the inflation rate increased from 10% to 20%. This suggests that the total cost of the project would be lower than its income during its lifetime.
An explanation for this phenomenon is that the salvage value of the equipment at the end of the project lifetime after 25 years becomes much higher than the cost of purchasing the equipment at the beginning of the project due to the inflation rate.
Another explanation is the increased electricity price during the project life. Considering the higher price of electricity than that of renewable sources, the growth of electricity income is higher than that of electricity purchase. Thus, the total income of the system in light of selling electricity to the power network is considerably higher than the cost of purchasing power from the power network during the project’s lifetime.
4 Conclusion
The present study modeled the electrical and heat requirements of an apartment hotel with four floors in five climates in Iran to propose a hybrid system consisting of solar, wind, geothermal, and battery energy sources along with a boiler for supplying the heat and electrical load of the building. The best scenarios of the cities were found based on economic criteria, comparing the economic and environmental advantages of the best scenarios to those of the other scenarios (supplying power by the power network and the entire heat by the boiler). Given the low fuel price and high inflation in Iran, sensitivity analyses were performed on important parameters to evaluate their effects on the best scenarios. The following results were obtained.
• The lowest cost of the green tourist building project was obtained for Mashhad. The COE and NPC of Mashhad were lower than those of the other cities, revealing that more than 50% of the required power could be supplied by renewable sources.
• Hummer turbines were employed in all of the best scenarios. This suggests that Hummer turbines are cost-effective due to their high capacities, despite their high initial cost.
• Sharp solar panels were included in all of the best scenarios due to their lower initial cost, considering almost the same efficiency as the two investigated panels.
• The largest power sale to the power network was obtained for Bandar Abbas. In addition, the number of wind turbines was larger in Bandar Abbas than in the other cities due to the higher electricity consumption of Bandar Abbas in light of its hot and humid climate as it is located next to the Persian Gulf.
• The power generation of wind turbines was much larger than that of solar panels and power purchases for the entire city. Wind turbines accounted for approximately 82% of the power generation on average.
• The largest reduction in fuel consumption due to the use of heat pumps was derived to be 10% in Ahvaz.
• The largest decline in CO2 emission due to the use of heat pumps was obtained to be 5% in Bandar Abbas.
• The NPC decreased as inflation enhanced. This suggested that the project incomes became exceeded the project cost as inflation increased. The major part of the project incomes arose from selling power to the power network and the salvage value of HRES components.
Future works are proposed to the following suggestions to augment the accuracy of the present work’s results.
• Implement the project in different cities
• Accurately calculate the electrical load of the building based on electricity bills
• Accurately calculate the monthly building heat load by gas bills
• Supply the required heat load for heating by heat pumps
• Investigate the use of vertical heat pumps.
Data availability statement
The original contributions presented in the study are included in the article/supplementary material, further inquiries can be directed to the corresponding author.
Author contributions
AH conceived and designed the analysis. MJ conceived and designed the analysis. FS performed the analysis, collected the data and wrote the paper. MA wrote the paper and other contribution.
Conflict of interest
The authors declare that the research was conducted in the absence of any commercial or financial relationships that could be construed as a potential conflict of interest.
Publisher’s note
All claims expressed in this article are solely those of the authors and do not necessarily represent those of their affiliated organizations, or those of the publisher, the editors and the reviewers. Any product that may be evaluated in this article, or claim that may be made by its manufacturer, is not guaranteed or endorsed by the publisher.
References
Aagreh, Y., and Al-Ghzawi, A. (2013). Feasibility of utilizing renewable energy systems for a small hotel in Ajloun city, Jordan. Appl. Energy 103, 25–31. doi:10.1016/j.apenergy.2012.10.008
Ahmed, A., Ge, T., Peng, J., Yan, W. C., Tee, B. T., and You, S. (2022). Assessment of the renewable energy generation towards net-zero energy buildings: A review. Energy Build. 256, 111755. doi:10.1016/j.enbuild.2021.111755
Alijani, B., and Heydari, H. (1999). Climatic classification of Iran using multivariate statistical techniques. Geogr. Res., 1.
Apoorv, V. (2010). “Introduction to National Rating System - GRIHA an evaluation tool to help design, build, operate, and maintain a resource-efficient built environment,” in Power, building (New Delhi: India: Ministry of New and Renewable Energy, Government of India and The Energy and Resources Institute).
Ayodele, E., Misra, S., Damasevicius, R., and Maskeliunas, R. (2019). Hybrid microgrid for microfinance institutions in rural areas – a field demonstration in West Africa. Sustain. Energy Technol. Assessments 35, 89–97. doi:10.1016/j.seta.2019.06.009
Bahramara, S., Moghaddam, M. P., and Haghifam, M. R. (2016). Optimal planning of hybrid renewable energy systems using HOMER: A review. Renew. Sustain. Energy Rev. 62, 609–620. doi:10.1016/j.rser.2016.05.039
Baneshi, M., and Hadianfard, F. (2016). Techno-economic feasibility of hybrid diesel/PV/wind/battery electricity generation systems for non-residential large electricity consumers under southern Iran climate conditions. Energy Convers. Manag. 127, 233–244. doi:10.1016/j.enconman.2016.09.008
Boussetta, M., El Bachtiri, R., Khanfara, M., and El Hammoumi, K. (2017). Assessing the potential of hybrid PV–Wind systems to cover public facilities loads under different Moroccan climate conditions. Sustain. Energy Technol. Assessments 22, 74–82. doi:10.1016/j.seta.2017.07.005
Chan, Y. J., Chong, M. F., Law, C. L., and Hassell, D. (2009). A review on anaerobic–aerobic treatment of industrial and municipal wastewater. Chem. Eng. J. 155 (1), 1–18. doi:10.1016/j.cej.2009.06.041
Chua, K. J., Chou, S. K., and Yang, W. M. (2010). Advances in heat pump systems: A review. Appl. Energy 87 (12), 3611–3624. doi:10.1016/j.apenergy.2010.06.014
Dalton, G. J., Lockington, D. A., and Baldock, T. E. (2008). Feasibility analysis of stand-alone renewable energy supply options for a large hotel. Renew. Energy 33 (7), 1475–1490. doi:10.1016/j.renene.2007.09.014
Dawoud, S. M. (2021). Developing different hybrid renewable sources of residential loads as a reliable method to realize energy sustainability. Alexandria Eng. J. 60 (2), 2435–2445. doi:10.1016/j.aej.2020.12.024
Fazelpour, F., Soltani, N., and Rosen, M. A. (2014). Feasibility of satisfying electrical energy needs with hybrid systems for a medium-size hotel on Kish Island, Iran. Energy 73, 856–865. doi:10.1016/j.energy.2014.06.097
Firozjaei, H. K., Firozjaei, M. K., Nematollahi, O., Kiavarz, M., and Alavipanah, S. K. (2020). On the effect of geographical, topographic and climatic conditions on feed-in tariff optimization for solar photovoltaic electricity generation: A case study in Iran. Renew. Energy 153, 430–439. doi:10.1016/j.renene.2020.01.127
Gruber, J. K., Prodanovic, M., and Alonso, R. (2015). Estimation and analysis of building energy demand and supply costs. Energy Procedia 83, 216–225. doi:10.1016/j.egypro.2015.12.176
Güler, Ö., Akdağ, S. A., and Dinçsoy, M. E. (2013). Feasibility analysis of medium-sized hotel's electrical energy consumption with hybrid systems. Sustain. Cities Soc. 9, 15–22. doi:10.1016/j.scs.2013.02.004
Hanafizadeh, P., Eshraghi, J., Ahmadi, P., and Sattari, A. (2016). Evaluation and sizing of a CCHP system for a commercial and office buildings. J. Build. Eng. 5, 67–78. doi:10.1016/j.jobe.2015.11.003
Hassan, A. A., Anwari, M., and Ramli, M. A. (2018). Optimal design and analysis of grid-connected photovoltaic under different tracking systems using HOMER. Energy Convers. Manag. 155, 42–57. ISSN 0196-8904. doi:10.1016/j.enconman.2017.10.090
Jahangir, M. H., Eslamnezhad, S., Mousavi, S. A., and Askari, M. (2021). Multi-year sensitivity evaluation to supply prime and deferrable loads for hospital application using hybrid renewable energy systems. J. Build. Eng. 40, 102733. doi:10.1016/j.jobe.2021.102733
Jahangir, M. H., Mokhtari, R., and Mousavi, S. A. (2021). Performance evaluation and financial analysis of applying hybrid renewable systems in cooling unit of data centers–A case study. Sustain. Energy Technol. Assessments 46, 101220. doi:10.1016/j.seta.2021.101220
Jimenez Zabalaga, P., Cardozo, E., Choque Campero, L. A., and Araoz Ramos, J. A. (2020). Performance analysis of a stirling engine hybrid power system. Energies 13 (4), 980. doi:10.3390/en13040980
Khan, N. Y., Design and installation of a direct exchange ground source heat pump system. In 2017 ASEE northeast section conference 2017.
Kusuda, T., and Achenbach, P. R. (1965). Earth temperature and thermal diffusivity at selected stations in the United States.
Lau, K. Y., Yousof, M., Arshad, S., Anwari, M., and Yatim, A. (2010). Performance analysis of hybrid photovoltaic/diesel energy system under Malaysian conditions. Energy 35 (8), 3245–3255. doi:10.1016/j.energy.2010.04.008
Lim, T. H., De Kleine, R. D., and Keoleian, G. A. (2016). Energy use and carbon reduction potentials from residential ground source heat pumps considering spatial and economic barriers. Energy Build. 128, 287–304. doi:10.1016/j.enbuild.2016.06.060
Mandal, S., Das, B. K., and Hoque, N. (2018). Optimum sizing of a stand-alone hybrid energy system for rural electrification in Bangladesh. J. Clean. Prod. 200, 12–27. doi:10.1016/j.jclepro.2018.07.257
Marszal, A. J., Heiselberg, P., Bourrelle, J., Musall, E., Voss, K., Sartori, I., et al. (2011). Zero Energy Building – a review of definitions and calculation methodologies. Energy Build. 43 (4), 971–979. doi:10.1016/j.enbuild.2010.12.022
Mehrpooya, M., Mohammadi, M., and Ahmadi, E. (2018). Techno-economic-environmental study of hybrid power supply system: A case study in Iran. Sustain. Energy Technol. Assessments 25, 1–10. doi:10.1016/j.seta.2017.10.007
Memon, S. A., Upadhyay, D. S., and Patel, R. N. (2021). Optimal configuration of solar and wind-based hybrid renewable energy system with and without energy storage including environmental and social criteria: A case study. J. Energy Storage 44, 103446. doi:10.1016/j.est.2021.103446
Mohammadi, M., Ghasempour, R., Razi Astaraei, F., Ahmadi, E., Aligholian, A., and Toopshekan, A. (2018). Optimal planning of renewable energy resource for a residential house considering economic and reliability criteria. Int. J. Electr. Power and Energy Syst. 96, 261–273. doi:10.1016/j.ijepes.2017.10.017
Mokhtara, C., Negrou, B., Bouferrouk, A., Yao, Y., Settou, N., and Ramadan, M. (2020). Integrated supply–demand energy management for optimal design of off-grid hybrid renewable energy systems for residential electrification in arid climates. Energy Convers. Manag. 221, 113192. doi:10.1016/j.enconman.2020.113192
Olatomiwa, L., Mekhilef, S., and Ohunakin, O. S. (2016). Hybrid renewable power supply for rural health clinics (RHC) in six geo-political zones of Nigeria. Sustain. Energy Technol. Assessments 13, 1–12. doi:10.1016/j.seta.2015.11.001
Roufechaei, K. M., Hassan Abu Bakar, A., and Tabassi, A. A. (2014). Energy-efficient design for sustainable housing development. J. Clean. Prod. 65, 380–388. doi:10.1016/j.jclepro.2013.09.015
Shahzad, M. K., Zahid, A., ur Rashid, T., Rehan, M. A., Ali, M., and Ahmad, M. (2017). Techno-economic feasibility analysis of a solar-biomass off grid system for the electrification of remote rural areas in Pakistan using HOMER software. Renew. Energy 106, 264–273. doi:10.1016/j.renene.2017.01.033
Shivarama Krishna, K., and Sathish Kumar, K. (2015). A review on hybrid renewable energy systems. Renew. Sustain. Energy Rev. 52, 907–916. doi:10.1016/j.rser.2015.07.187
Tanaka, A., Murakawa, S., Koshikawa, Y., and Takata, H. (2008). Calculation of hot water supply demands and instruments capacity for the guest rooms in a city hotel. J. Environ. Eng. Trans. Aij) 73, 69–75. doi:10.3130/aije.73.69
Türkay, B. E., and Telli, A. Y. (2011). Economic analysis of standalone and grid connected hybrid energy systems. Renew. Energy 36 (7), 1931–1943. doi:10.1016/j.renene.2010.12.007
Unep, S. (2009). “Buildings and climate change: Summary for decision-makers,” in United nations environmental programme, sustainable buildings and climate initiative (Paris: UNEP DTIE Sustainable Consumption and Production Branch).
Upadhyay, S., and Sharma, M. P. (2014). A review on configurations, control and sizing methodologies of hybrid energy systems. Renew. Sustain. Energy Rev. 38, 47–63. doi:10.1016/j.rser.2014.05.057
Xie, Y., Gilmour, M., Yuan, Y., Jin, H., and Wu, H. (2017). A review on house design with energy saving system in the UK. Renew. Sustain. Energy Rev. 71, 29–52. doi:10.1016/j.rser.2017.01.004
Zahariea, D., Zotic, M. V., and Pavăl, M. S. (2018). Small-scale 5.1 kW wind turbine on-grid connected for outdoor illumination of a small residential district. Mater. Sci. Eng. 444 (8), 082008. doi:10.1088/1757-899x/444/8/082008
Zhang, Y., Wang, W., Wang, Z., Gao, M., Zhu, L., and Song, J. (2021). Green building design based on solar energy utilization: Take a kindergarten competition design as an example. Energy Rep. 7, 1297–1307. doi:10.1016/j.egyr.2021.09.134
Zou, H., Du, H., Brown, M. A., and Mao, G. (2017). Large-scale PV power generation in China: A grid parity and techno-economic analysis. Energy 134, 256–268. doi:10.1016/j.energy.2017.05.192
Nomenclature
Keywords: green building, hybrid renewable energy system, homer, optimization, heat pump
Citation: Hajinejad A, Seraj F, Jahangir MH and Askari M (2023) Economic optimization of hybrid renewable energy systems supplying electrical and thermal loads of a tourist building in different climates. Front. Built Environ. 8:969293. doi: 10.3389/fbuil.2022.969293
Received: 14 June 2022; Accepted: 22 September 2022;
Published: 19 May 2023.
Edited by:
Roberto Bruno, University of Calabria, ItalyCopyright © 2023 Hajinejad, Seraj, Jahangir and Askari. This is an open-access article distributed under the terms of the Creative Commons Attribution License (CC BY). The use, distribution or reproduction in other forums is permitted, provided the original author(s) and the copyright owner(s) are credited and that the original publication in this journal is cited, in accordance with accepted academic practice. No use, distribution or reproduction is permitted which does not comply with these terms.
*Correspondence: Mohammad Hossein Jahangir, bWguamFoYW5naXJAdXQuYWMuaXI=