 Francesca Linda Perelli1*
 Luigia Sara Di Maio2
 Daniela De Gregorio1,3
 Gennaro Magliulo3
 Prospero De Martino4
 Giulio Zuccaro1,3
- 1PLINIVS Study Centre, University of Naples Federico II, Naples, Italy
- 2Department of Earth Sciences, University of Geneva, Geneva, Switzerland
- 3Department of Structures for Engineering and Architecture (DiSt), University of Naples Federico II, Naples, Italy
- 4Istituto Nazionale di Geofisica e Vulcanologia, Sez. di Napoli–Osservatorio Vesuviano, Naples, Italy
Campi Flegrei (Italy) is among the areas with the greatest volcanic explosive risk in the world due to the dangerousness of the expected hazards, the high exposed value (about 500,000 people will be evacuated during the “alarm phase”), and the vulnerability of the urban settlements under the effect of the volcanic phenomena. The last two dramatic bradyseism phases occurred in 1969–1972 and 1982–1984 when Pozzuoli town was affected by rapid ground inflation, which brought an overall higher level of about 3.5 m and caused numerous earthquakes (M ≤ 4.2), with severe damage to buildings. During 1984, the seismicity was intense, with 33 events with 0.5 < M ≤ 3 and six with 3 < M ≤ 3.8. Subsequently, the Campi Flegrei caldera was characterized by general subsidence for about 20 years until 2005, when a new inflation period started and is still ongoing (∼1 m). The areal distribution of the recent uplift is characterized by the maximum vertical displacement in the town of Pozzuoli, with a radial decrease from the caldera center outwards. The need to better understand Campi Flegrei volcanic activity is fundamental to protecting the population from hazards linked to explosive volcanic eruptions and understanding the role of seismicity as a possible precursor of a potential eruption. In this perspective, as part of the activities of the PLINIVS Study Centre (Centre of Competence of Italian Civil Protection Department for Volcanic Risk), the authors developed a procedure, implemented in a web application, that relates the monitoring of the ground deformation with the behavior of buildings to evaluate the level of progressive damage to the ordinary Phlegraean buildings due to bradyseism in near real time. This study describes the models adopted for the three impact/risk factors (hazard, exposure, and vulnerability) used to estimate building damage.
1 Introduction
Campi Flegrei is a large and potentially very explosive volcanic area (Jenkins et al., 2015; Marzocchi et al., 2015; Aucelli et al., 2017; Vitale et al., 2019; Cannatelli et al., 2020) made by a caldera collapse structure (Orsi et al., 1996; Di Vito et al., 1999; Deino et al., 2004), with the concrete possibility of high-impact eruptions (Horwell et al., 2015). It is characterized by a volcanic phenomenon called “bradyseism” (from the Greek bradus, which means slow, and sism, which means movement), which is a short-term ground deformation (Orsi et al., 1999) determining a slow ground uplift and subsidence according to a bell-shaped geometry. The derived deformation is made by vertical and horizontal displacements. Earthquakes manifest themselves mainly as seismic swarms, always following the deformation produced by the uplift (Tramelli et al., 2006; Giudicepietro et al., 2021; Lima et al., 2021). The Campi Flegrei area suffered two bradyseismic crises in recent times, the first between 1969 and 1972, the second between 1982 and 1984, with critical seismic activity and abnormal ground inflation, reaching a total uplift of 3.56 m (177 cm during the first crisis, 179 during the second) (Del Gaudio et al., 2010).
The knowledge of the bradyseismic phenomenon in the Campi Flegrei area and its impact on the built stock is important for the (very dense) population safety. Extensive literature deals with the analytic study of the effects of soil motion on building behavior, especially for masonry structures, from a kinematic (Iannuzzo et al., 2018; Iannuzzo et al., 2021; Liguori et al., 2022; Maia Avelino et al., 2022; Perelli et al., 2023a) and static (Cusano et al., 2021; Montanino et al., 2022) standpoint.
The PLINIVS Study Centre developed for the Italian Civil Protection is a procedure that relates the monitoring of soil motion to building behavior to evaluate the level of ordinary Phlegraean building progressive damage due to bradyseism in near real time. The tool has been automated in a web application available at the Civil Protection Department, which returns, for each square area with a side of 250 m (minimum unit of analysis), the number of buildings with an assigned damage level (from D0, no damage, to D5, total collapse), depending on soil slope and uplift inputs. Some similar web applications can be found in the literature with respect to seismic events (Işık et al., 2018; Işık et al., 2021; Columbro et al., 2022; Nanda et al., 2022; Zhang et al., 2022).
The procedure provides scenario analyses based on hazard, exposure, and vulnerability. The hazard is provided in terms of slope and uplift through a periodic automatic transfer in the web application, where two different monitored pieces of information are acquired: the CNR-IREA interferometric data and the INGV-OV geodetic network data. The exposure is assessed through the distribution on the territory of the typological–structural characteristics of the buildings. It is estimated by statistical procedures based on information obtained through detailed data collection campaigns on the territory, including about 2,000 buildings in Pozzuoli town, and data on buildings provided by the National Census Building Database (ISTAT, 2001). The vulnerability of the building stock is developed on an empirical basis from the analysis of the damage to the Puteolan building stock following the 1982–1984 bradyseismic crisis, recorded in special survey forms called POZZUOLI, provided by the Municipality of Pozzuoli, integrated by Perelli et al. (2019) for the not surveyed buildings. Fragility curves have been assessed depending on soil slope and uplift for three bradyseismic vulnerability classes (A, B, and C for decreasing vulnerability), in which the buildings are grouped according to their typological–structural characteristics. Based on the SAVE method (Zuccaro and Cacace, 2015), an empirical model has been constructed using data collected by the POZZUOLI form capable of assigning a bradyseismic fragility class to a building based on its typological characteristics (bradyseismic SAVE). According to the BINC procedure (Cacace et al., 2018), statistical correlations were determined between bradyseismic fragility classes and the year of building construction. A possible distribution of building fragility over the analyzed territory was determined using the ISTAT 2011 database (ISTAT, 2001), which provides the number of buildings by the age of construction over census areas.
2 The event of 1982–1984: building damage dataset
2.1 Building safety check: POZZUOLI form
During the bradyseismic crisis in 1982–1984, the Secretary of State Minister for Coordination of Civil Protection promoted and coordinated a census of the constructions aimed at deepening the knowledge of the static conditions of the buildings in Pozzuoli and assessing a structural safety check for each of them. For this purpose, an ad hoc form, called the POZZUOLI form, was developed (Figures 1, 2) by a Technical Scientific Committee (TSC) on the basis of the form tested for the 1980 Irpinia earthquake.
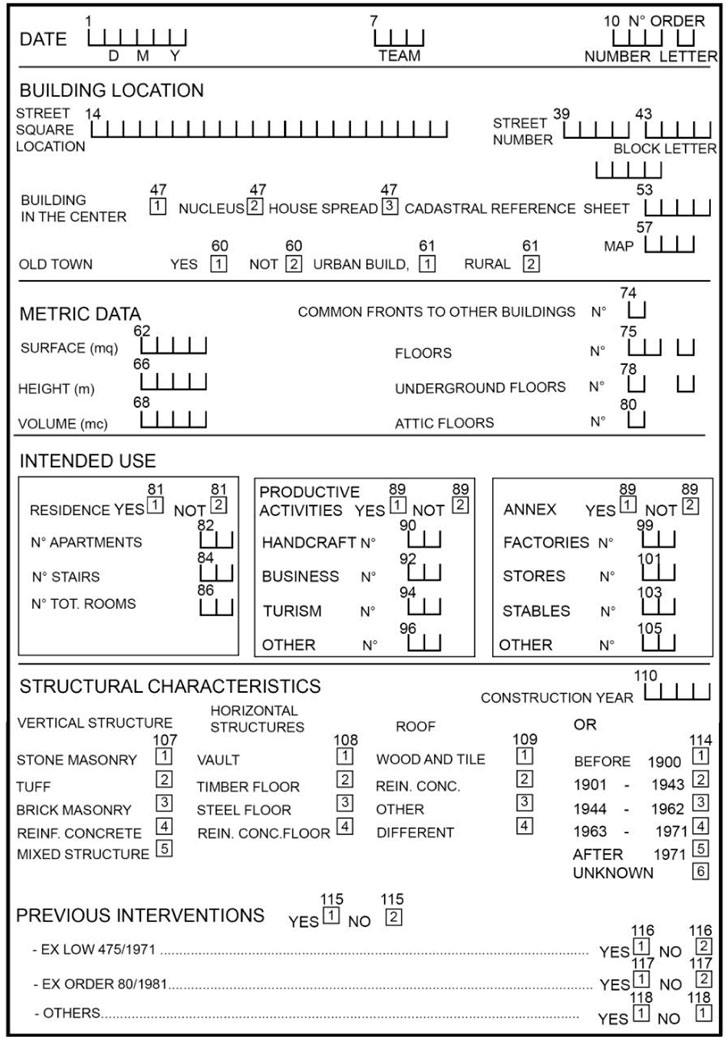
FIGURE 1. Pozzuoli form, page 1.
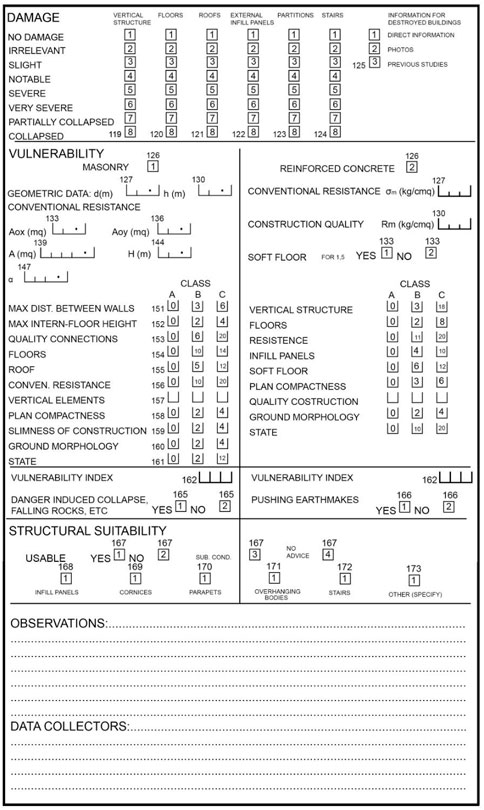
FIGURE 2. Pozzuoli form, page 2.
The form defines the state of the construction and collects data useful to the structural safety judgment. The data are grouped into two pages of the form (Figures 1, 2), and they are divided into ten sections: date, building location, metric data, intended use, structural characteristics, previous interventions, damage, vulnerability, structural suitability, and comments.
Page 1 of the POZZUOLI form (Figure 1) comprises six sections. Section 1 contains information on the date of the survey activity, the team identifier, and the order number of the structural unit under examination (isolated or in structural aggregate). Section 2 collects data on the location (address) and context (old town, urban area, and rural area) of the building. Section 3 collects metric data of the building, such as surface, height, volume, number of floors above ground level, number of underground floors, presence of attic, and the possible presence of fronts common to other buildings. Section 4 relates to the intended use of the building (residential or productive) and the possible annexed structures. Section 5 collects the structural characteristics of the building, including age and construction techniques for vertical and horizontal structures and the roof. Section 6 contains information on possible previous structural interventions.
Page 2 of the POZZUOLI form (Figure 2) comprises four sections. Section 7 contains an assessment of damage on vertical structures, floors, roofs, external infill panels, partitions, and stairs, according to eight levels of judgment: no damage, irrelevant, slight, notable, severe, very severe, partially collapsed, and collapsed. Section 8 presents information on vulnerability factors, divided by masonry and reinforced concrete typologies and the assessment of a vulnerability index. Section 9 presents the structural safety check of the building through suitability expert judgment. Section 10 contains a note space for observations.
A total of 3,695 buildings were examined using the POZZUOLI form (Figure 3), including 2,726 masonry buildings and 969 reinforced concrete buildings. The aggregates were 361, and the interconnected (in aggregates) structural units were 1,144 globally.
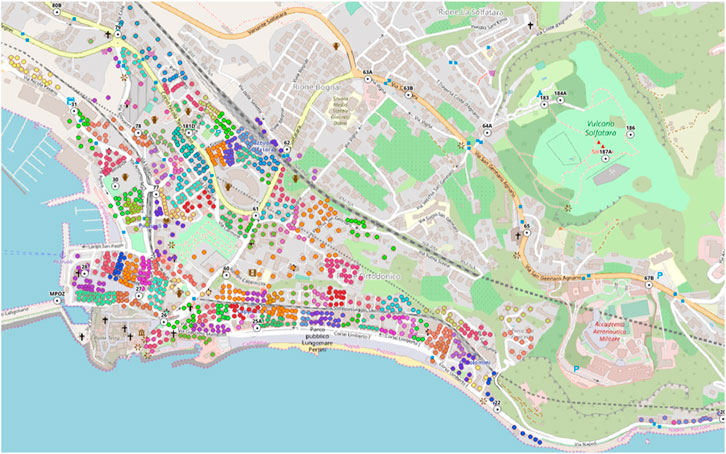
FIGURE 3. Map of the buildings surveyed using the Pozzuoli form.
2.2 Analyses of correlations between the building characteristics and the damage
Based on the SAVE approach (Zuccaro and Cacace, 2015) developed in the seismic field, the data collected following the 1982–1984 events have been analyzed to calibrate a statistical procedure that can understand the behavior of buildings in the case of bradyseism phenomena. In particular, the correlations between data on building features and damage have been determined.
For each building, there are four typological–structural characteristics deduced using the POZZUOLI form: the vertical typology (stone masonry, tuff, brick masonry, reinforced concrete, and mixed structure); the horizontal typology (vault, timber floor, steel floor, and reinforced concrete); the number of floors (1–12, but grouped in 1–2, 3–4, 5–6, and 7+); and the age of the construction (before 1900, 1901–1943, 1944–1962, 1963–1971, and after 1971). The type of roof is not considered because the information is not always clearly defined for the available sample.
The damage collected in the POZZUOLI form is expressed on a scale of eight levels. In this work, damage information has been defined according to the European Macroseismic Scale-98 (Grünthal, 1998) scale, which is structured on six grades representing the overall damage of the structure: D5, total collapse; D4, partial collapse; D3, severe structural damage; D2, light structural damage; D1, light nonstructural damage; and D0, no damage. The correlation between the two damage scales was set based on the damage indicated on the vertical structure, horizontal structures, and interior infill panels of the POZZUOLI form because these are the most filled data in the database. The correspondence has been set as follows: D5: the damage of the vertical and horizontal structures is marked as “collapsed”; D4: at least one damage scale of the vertical structure or that of the horizontal structures is marked as “partially collapsed” or “very severe” and the other is marked as other than “collapsed”; D3: at least one damage scale of the vertical structure and that of the horizontal structures is marked as “severe” or “notable,” and the other is other than “collapsed” or “partially collapsed”; D2: at least one between the damage of the vertical structure and that of the horizontal structure is marked as “slight,” and the other is other than “collapsed,” “partially collapsed,” “very severe,” “severe,” or “notable”; D1: at least one between the damage of the vertical structure and the damage of the horizontal structures is marked as “irrelevant” or both the damage of the vertical structure and the damage of the horizontal structures are crossed out as “no damage” and the damage of the interior infill panels is other than “no damage”; and D0: damage of vertical and horizontal structures and interior infill panels is marked as “no damage.”
According to the SAVE approach, on the basis of the correlations among typological–structural characteristics of the building and occurred damage, it is possible to assess a parameter that allows to identify buildings with similar behaviors (similar damage) in regard to the bradyseismic phenomenon and group them into specific classes (called “vulnerability classes”). Accordingly, it is necessary to calculate the barycentric abscissa of the damage level i, called the Synthetic Parameter of Damage (
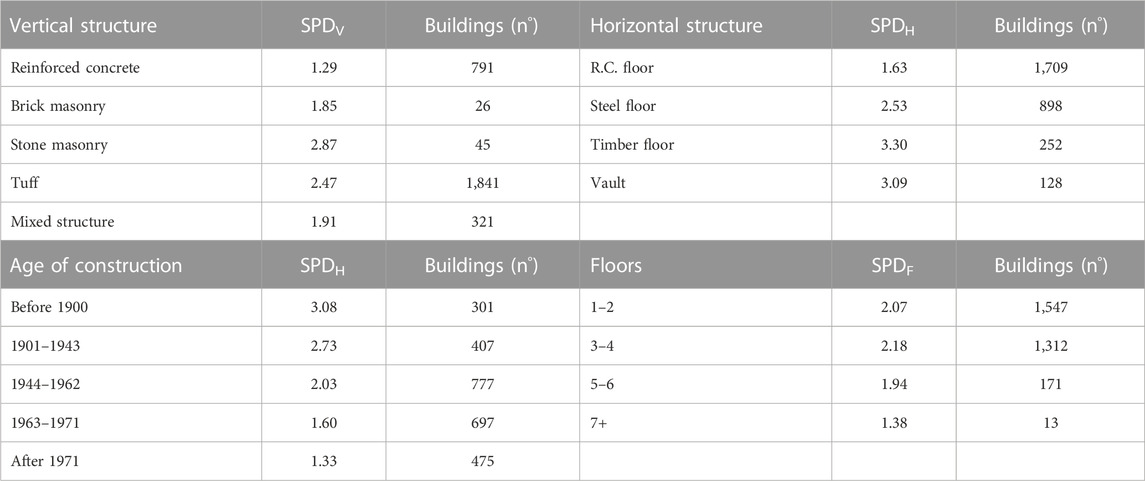
TABLE 1. Synthetic Parameter of Damage (SPD) for each category of the typological–structural characteristics.
In particular,
where
By assuming the “vertical structure” V as a reference parameter, the relative influence of the other features P (horizontal structure, number of floors, and age of construction) on it is calculated as follows:
where
Tables 2, 3, 4 summarize the scores calculated with reference to the parameters’ horizontal structure, number of floors, and age, respectively. For each building, it is possible to evaluate a synthetic damage parameter that considers the contribution of vertical structure damage and the relative influence of the other features as follows:
where
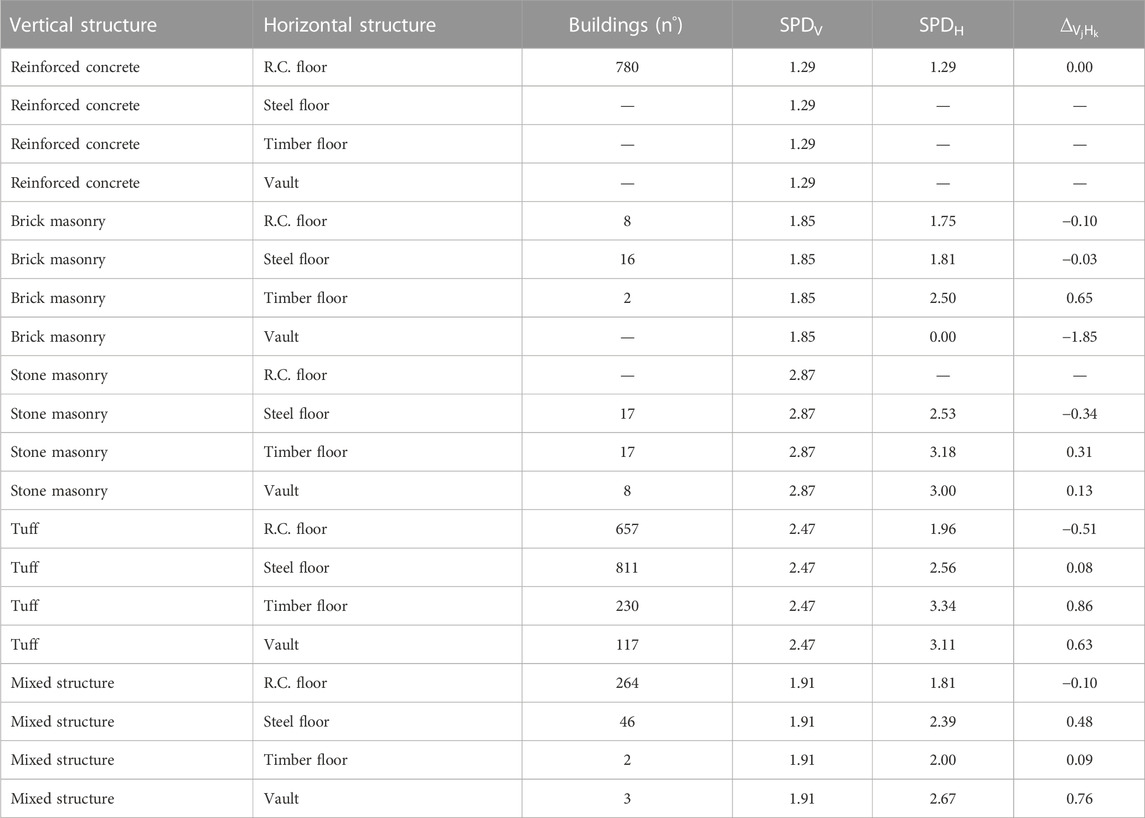
TABLE 2. Influence of the horizontal structures on the vertical typologies.
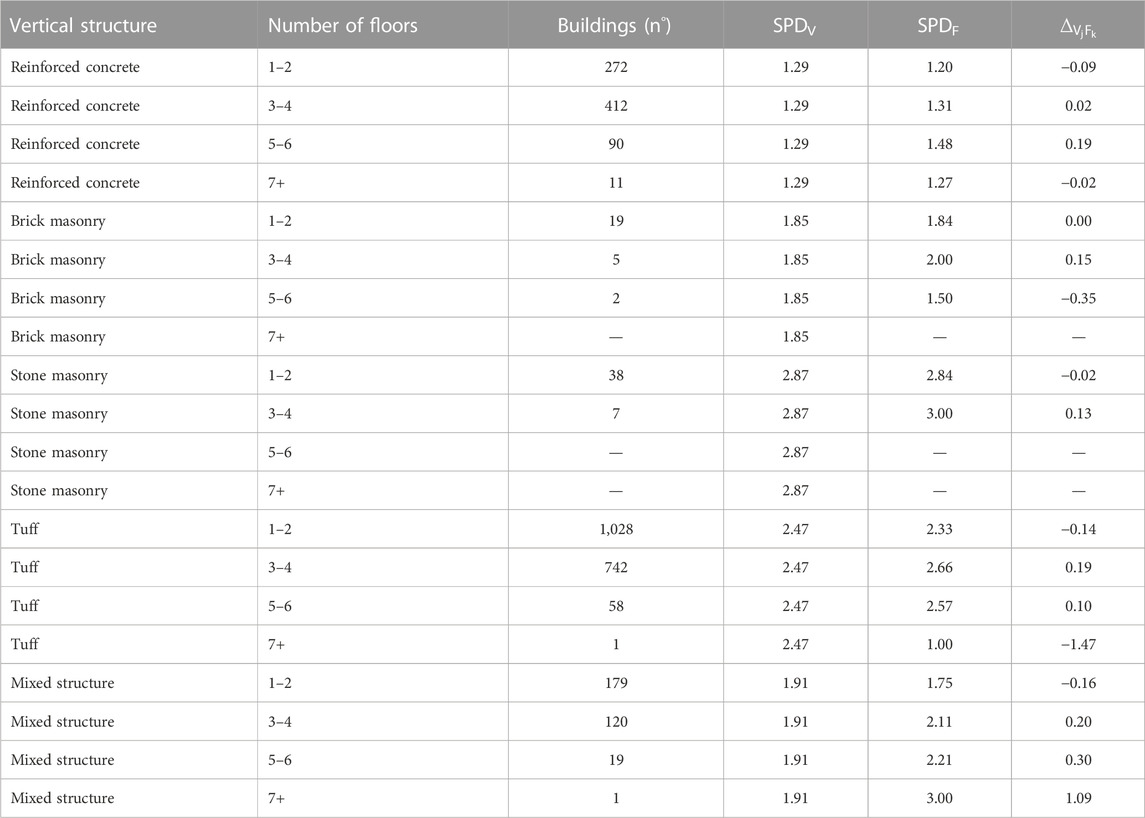
TABLE 3. Influence of the number of floors on the vertical typologies.
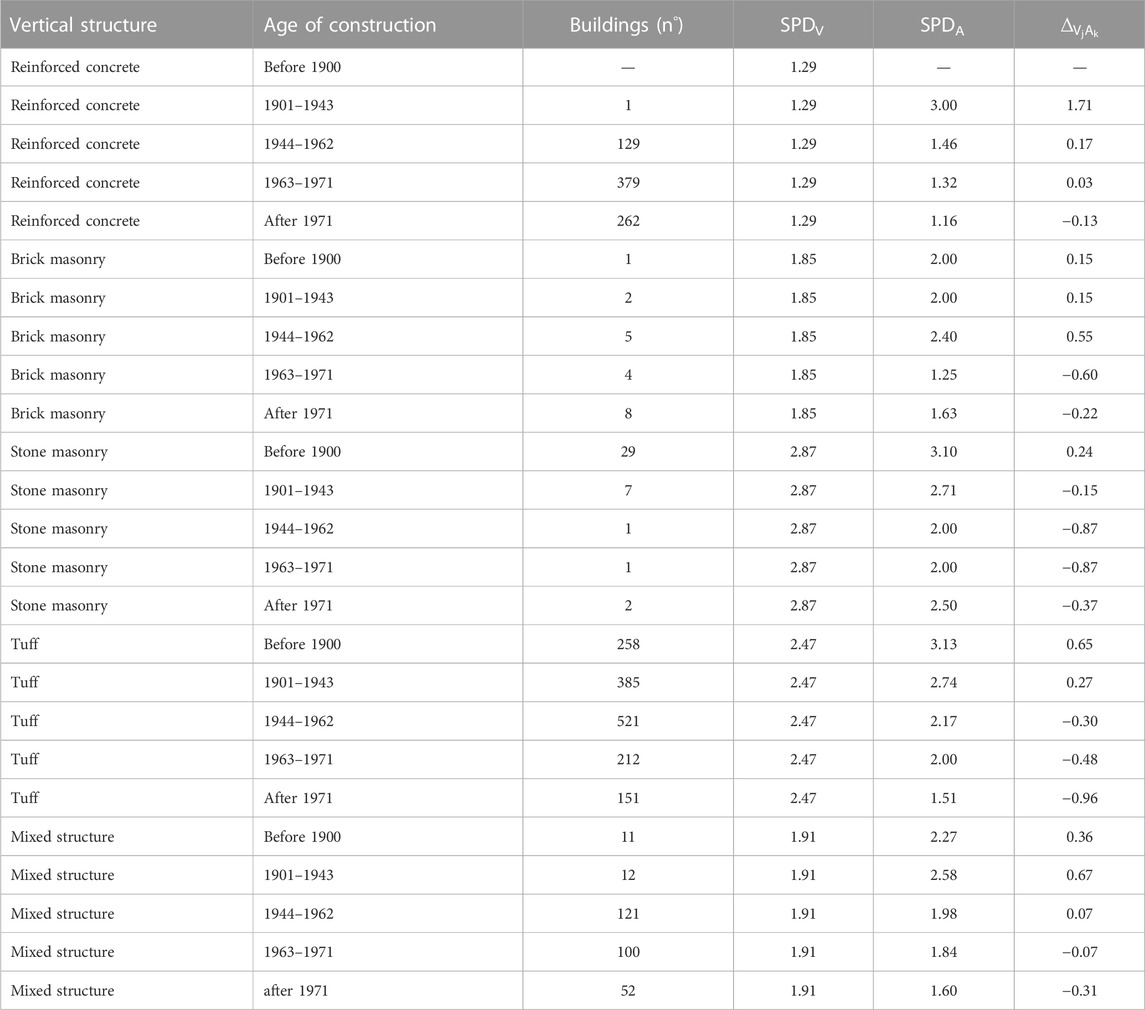
TABLE 4. Influence of the age of construction on the vertical typologies.
where
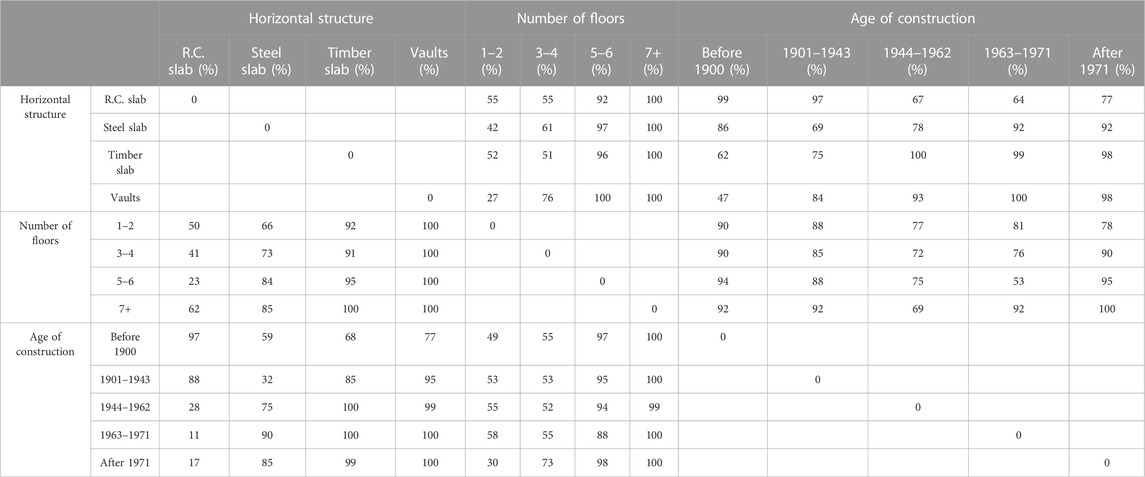
TABLE 5. No correlation coefficients among the parameters.
Buildings can be classified according to three vulnerability classes (A, B, and C) based on the following SPD ranges, computed assuming the vertical structures SPD (Table 1) as a reference: SPD ≥ 2.47 Class A, 1.87 ≤ SPD < 2.47 Class B, and SPD < 1.87 Class C.
2.3 Empirical fragility curves
Fragility curves represent the probability that a fixed level of damage can be achieved or exceeded. The vulnerability curves can be estimated through analytical, empirical, or hybrid methods (Calvi et al., 2006). The first one studies building vulnerability through mechanical analyses that can describe the damage evolution of a building with the assigned typological and structural characteristics, increasing the hazard input value. The second one defines building behavior by exploiting detected data about structures affected by seismic events since statistical correlation and regression methods to evaluate the relation among typological characteristics of the buildings, hazard input, and level of damage. The third one combines mechanical and observational analyses of the damage produced by past events. Some recent works (Harrichian, 2021; Nanda et al., 2022) also exploited rapid visual screening through soft computing techniques to define the vulnerability class of the buildings.
In this work, empirical fragility curves of ordinary buildings are proposed based on the damage that occurred during the 1982–1984 crisis. The movements that occurred in the 1982–1984 crisis have been studied to analyze the correlation among the vulnerability classes (i.e., the structural–typological features of the buildings), the reached damage, and the bradyseism hazard. The data were furnished by the INGV geodetic network recording the vertical ground movements related to the strongholds distributed throughout the Campi Flegrei territory (Del Gaudio et al., 2010). Bradyseism is a phenomenon that consists of a periodic lowering or raising of the ground level. The hazard caused by the phenomenon can, therefore, be identified in the average variation in height that concerns an area (uplift) or in the lifting differences created between the structural elements of the buildings (slope). In order to evaluate a correlation between the damage to the buildings and the uplift caused by bradyseism, the maximum vertical movements (m) that occurred up to June 1984 were deduced from the provided geodetic data. A continuous distribution of the phenomenon has been evaluated through interpolation by the b-spline function (Figure 4). This enabled the evaluation of the uplift and slope relative to the center of gravity of each building plan surveyed using the POZZUOLI form.
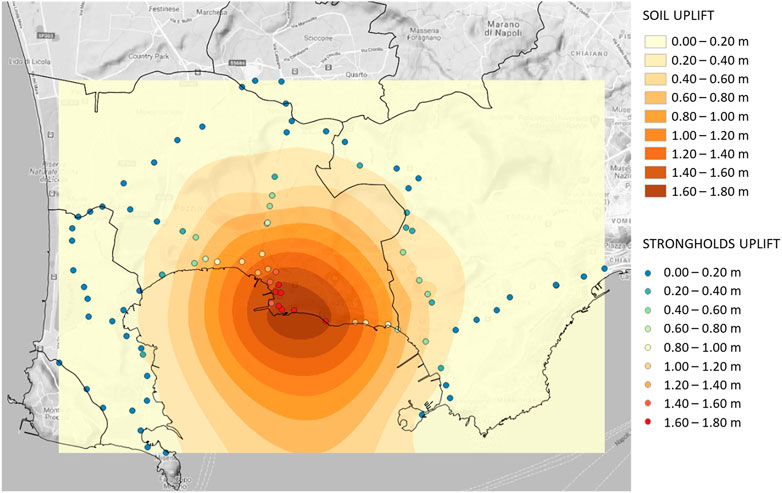
FIGURE 4. Map of the maximum vertical ground movements occurring in the 1982–1984 bradyseismic crisis, obtained through the b-spline function.
The correlation between the vulnerability classes, damage, and hazard parameters (uplift and slope) provided by INGV has been determined. The results related to total buildings are shown in Table 6. They show a clear underestimation of the damage level D0. Experience testifies that vulnerability models built on an observational basis are often affected by an underestimation of low damage levels caused by the failure to survey undamaged buildings, although affected by the studied phenomenon (Perelli et al., 2019). A confirmation of the lack of such data is shown in Figure 5, which depicts both the strongholds of the INGV stations, where the uplift data related to the 1982–1984 bradyseismic event are recorded, and the buildings surveyed using the POZZUOLI form. In particular, the strongholds are represented by two concentric circles whose red intensity increases as the uplift increases, whereas the damaged buildings are represented by squares whose orange intensity increases as their level of damage increases. Therefore, it is evident that the survey activity mainly focused on the most damaged buildings, also distributed around the strongholds that reached the greatest displacements.
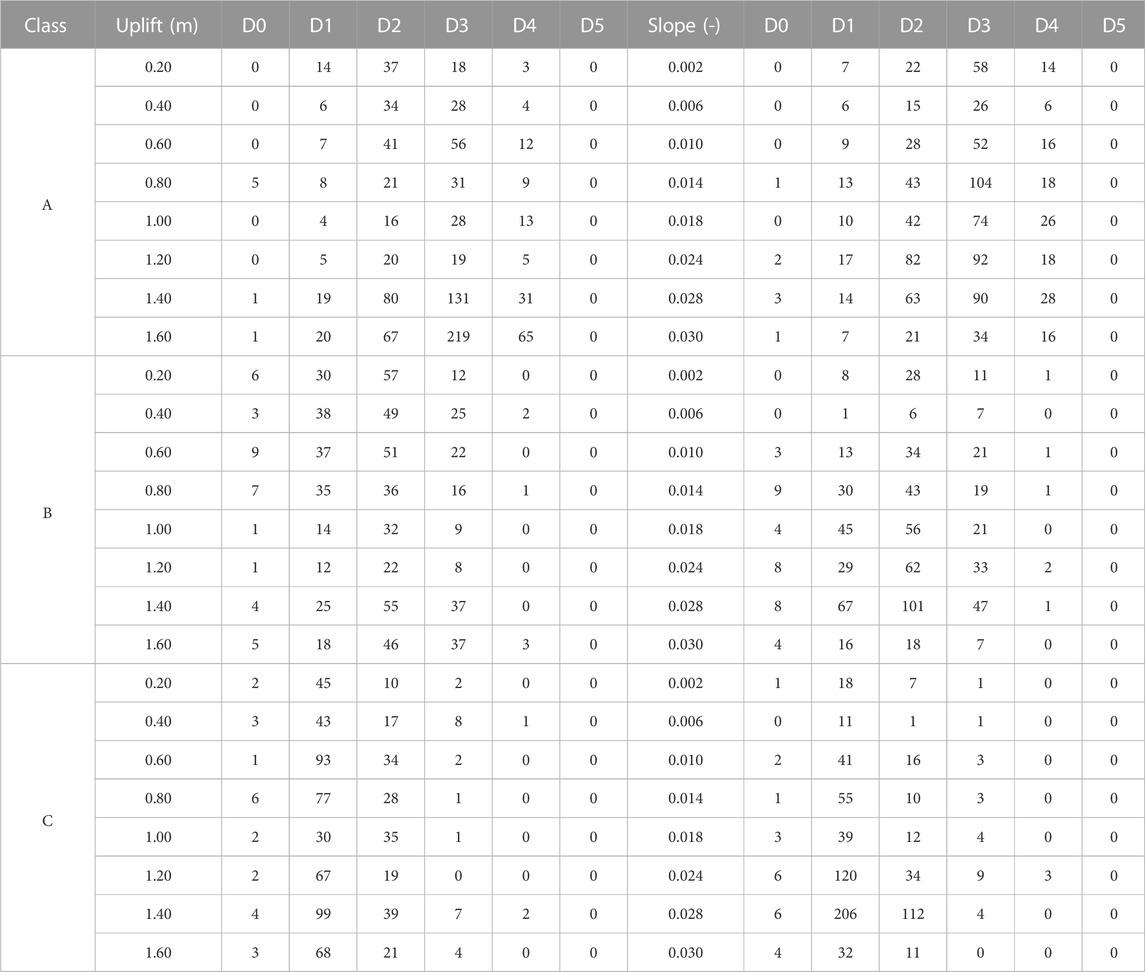
TABLE 6. Surveyed building distribution on the levels of damage according to the uplift and slope parameters.
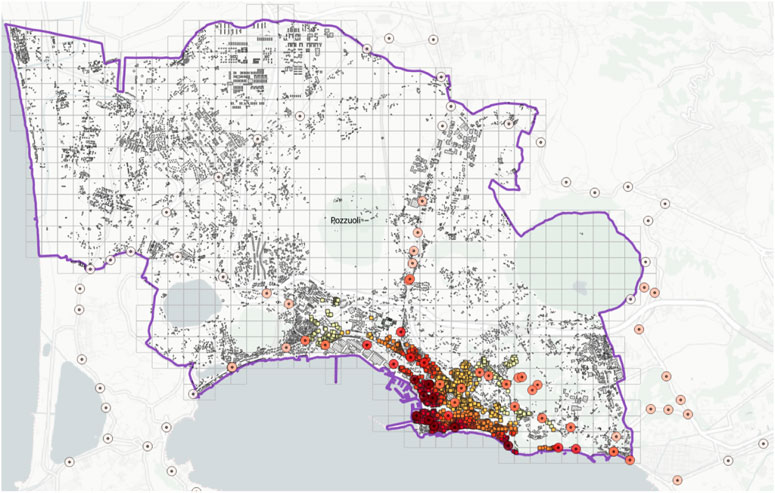
FIGURE 5. Location of the strongholds of the INGV stations and the buildings surveyed using the POZZUOLI form.
For an accurate definition of the vulnerability model, it is necessary to define a criterion for the recovery of missing data to create a tool able to describe the complete damage evolution of building types for each considered hazard phase. This requires integrating undamaged buildings of the 1982–1984 stock, distributed by vulnerability class and hazard level of the 1982–1984 event. Therefore, the procedure described in Section 2.2, based on census data on buildings constructed before 1980, has been adopted.
Summing the number of buildings grouped for vulnerability class and hazard value, the total number of buildings associated with each of these values is obtained (Table 7). The number of undamaged buildings has been determined (D0 value in Table 8) by subtracting the number of damaged buildings from the total number of buildings for each vulnerability class and each hazard value. The pair of logarithmic mean and logarithmic standard deviation parameters that best fit the trend of representative points of cumulative damage rates for each class and each hazard parameter have been evaluated using the least squares method (Figure 6 for slope and Figure 7 for uplift).
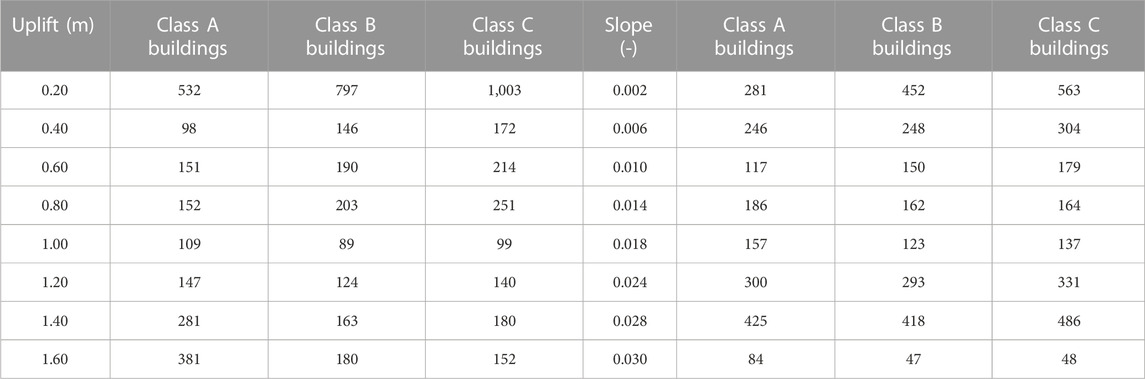
TABLE 7. Total building distribution on the levels of damage according to the uplift and slope parameters.
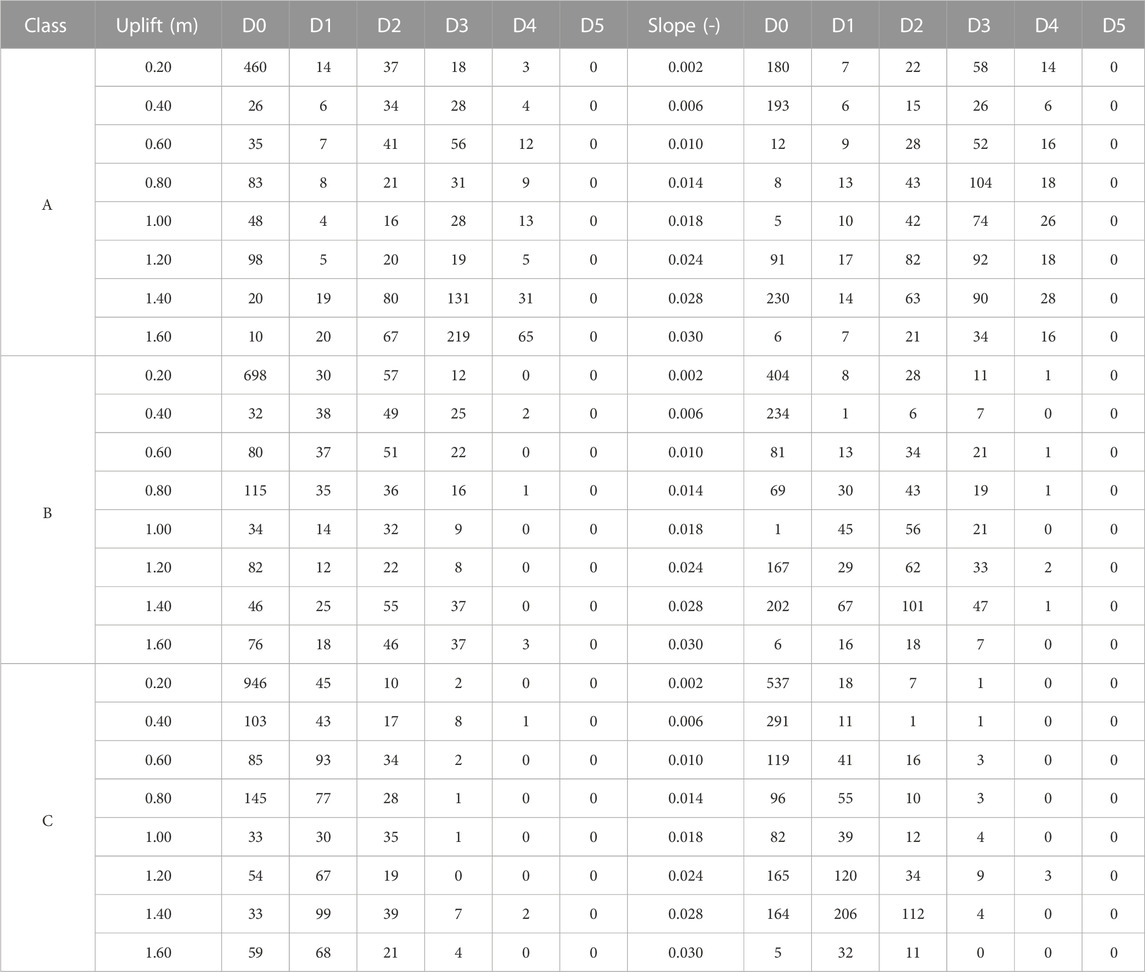
TABLE 8. Surveyed building distribution on the levels of damage according to the uplift and slope parameters.
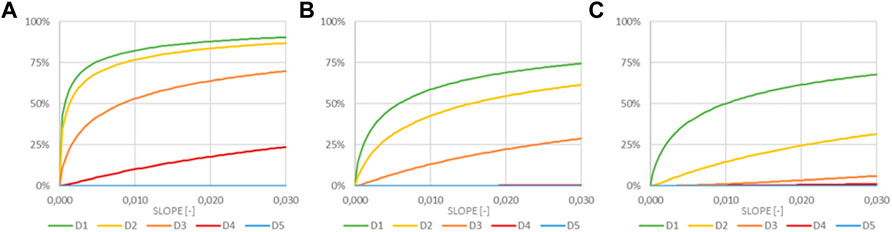
FIGURE 6. Vulnerability curves for Classed A (A), B (B), and (C) depending on slope.
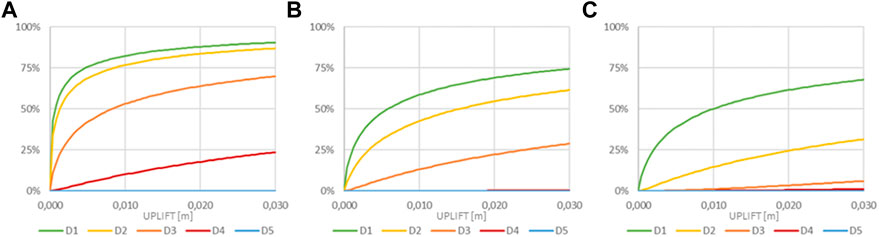
FIGURE 7. Vulnerability curves for Classed A (A), B (B), and (C) depending on uplift.
3 Impact model
3.1 Scenario analyses
A procedure based on scenario analysis has been developed to evaluate in near real time the damage induced to buildings by uplifts or slopes caused by the bradyseismic phenomenon in the Phlegraean area based on previous studies on seismic impact analyses (Zuccaro et al., 2021a; Zuccaro et al., 2021b; Perelli et al., 2023b). The scenario to achieve an assigned damage level “l” under the effect of an assigned uplift (or slope) is determined as follows:
where
The procedure, implemented in a specific web application, connects three centers of competence of Civil Protection (PLINIVS, INGV-OV, and CNR-IREA) to correlate the records of the movements induced by the bradyseismic phenomenon of the geodetic and interferometric networks with exposure and vulnerability models for evaluating the induced damage. The minimum unit of analysis of the model is a square cell with a side of 250 m. The individual parameters of the model are described in the following sections.
3.2 Hazard
The hazard model provides each minimum unit of analysis (250 × 250 m) the parameters against which the bradyseismic behavior of buildings is defined: slope, measured in degrees, and uplift, measured in meters.
The modalities of hazard data acquisition agree with CNR IREA and INGV-OV that provided periodic uploads of Campi Flegrei ground deformation data to the PLINIVS server in the framework of an agreement involving the analysis (monitoring and data processing) of the entire Campi Flegrei area. Accounts have been configured on the server to accept the upload via SFTP of the data surveys, with the expected cadence (monthly/weekly), and credentials for access shared with the institutes’ managers.
The provisions and reliabilities of ground deformation data provided by CNR-IREA and INGV-OV are significantly different: CNR-IREA data are recorded by radar interferometry on a 30 × 30-m grid of points covering the entire Campi Flegrei area; INGV-OV provides east, north, and vertical components of Global Navigation Satellite System (GNSS) displacements at 21 Global Positioning System (GPS) stations (De Martino et al., 2021). Therefore, the hazard model has been built upon the CNR-IREA data, and INGV-OV data have been used to validate elaborations. The results of CNR-IREA’s satellite Synthetic Aperture Radar (SAR) surveys are provided in a file in which information is organized in an ASCII text table. Each table row provides the following parameters: point identifier, latitude, longitude, strain rate, and uplift. The results are represented on the Shuttle Radar Topography Mission (SRTM) 1 arcsec Digital Elevation Model (DEM) grid. Consequently, the geolocation accuracy corresponds to ± 30 m, and the latitude and longitude provided are relative to the center of the pixel of the considered DEM grid.
For each considered pixel, the first value of the displacement time series is 0.0000 because the first acquisition was considered the reference one. The data recorded on the 30 × 30-m grid are interpolated according to the IDW Inverse Distance Weighting (IDW) method with nearest neighbor searching (Maleika, 2020) to cover as much analysis area as possible, including areas where there are no SAR data (e.g., waters and vegetated areas). The obtained values are analyzed according to the 250 × 250-m analysis grid by attributing the relevant calculated statistical values to each element. The uplift of the cell has been calculated as the average of the uplifts associated with the CNR-IREA points belonging to the cell. The slope assigned to the cell is defined as the average of the slopes among the CNR-IREA points belonging to the cell, estimated based on the uplifts. Figures 8,9 show the maps of the uplifts and slopes, respectively, with reference to the detection dated 15 December 2022, where the hazard values characterizing the investigated area are minimum uplift 0.00 m, medium uplift 0.42 m, maximum uplift 1.75 m, minimum slope 0.00%, medium slope 0.012%, and maximum slope 0.030%.
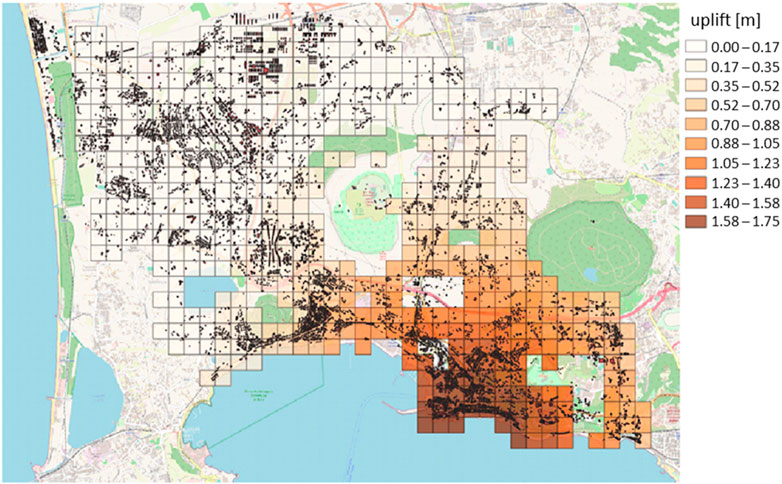
FIGURE 8. Uplift values at the cells (250 × 250 m) with reference to the detection dated 15 December 2022.
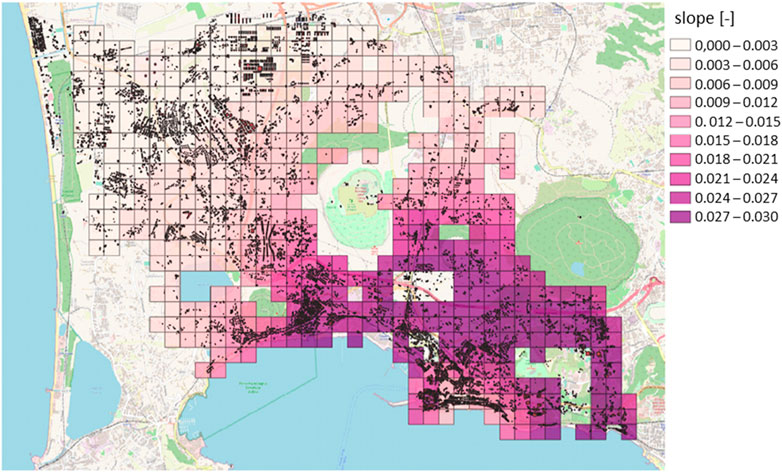
FIGURE 9. Slope values at the cells (250 × 250 m) with reference to the detection dated 15 December 2022.
3.3 Exposure and vulnerability models
Vulnerability and exposure represent strictly connected factors. For each category of exposed elements, the assessment of vulnerability due to a given natural event must be combined with “a qualitative and quantitative analysis of the exposed element” (exposure) to identify the time-spatial distribution of typological classes of exposed elements, defined as “vulnerability classes.” Each represents a group of elements with the same characteristics, which presents a similar behavior (vulnerability) with respect to a given phenomenon.
In this procedure, the adopted vulnerability model is constituted by the empirical fragility curves developed in Section 2.3. In order to link these curves with the exposure, the distribution on the territory of the typological–structural characteristics of the buildings has been expressed in terms of “vulnerability classes” distribution, assessed according to the procedure developed in Section 2.2 for each cell of 250 × 250 m.
Based on the data collected using the POZZUOLI form, a correlation between the construction age of the (about 2,000) surveyed buildings and the vulnerability classes has been defined. The ISTAT 2011 (ISTAT, 2001) database furnishes, for census areas, the number of buildings for the age of construction for the following classes: before 1919, 1919–1945, 1946–1961, 1962–1971, 1972–1981, 1982–1991, 1991–1996, 1997–2001, and 2001–2011. Given the percentage of buildings associated with each vulnerability class (Table 9) (Cacace et al., 2018), using relation (Eq. 6), it is possible to identify the number of buildings associated with each vulnerability class in the census area (Table 9):
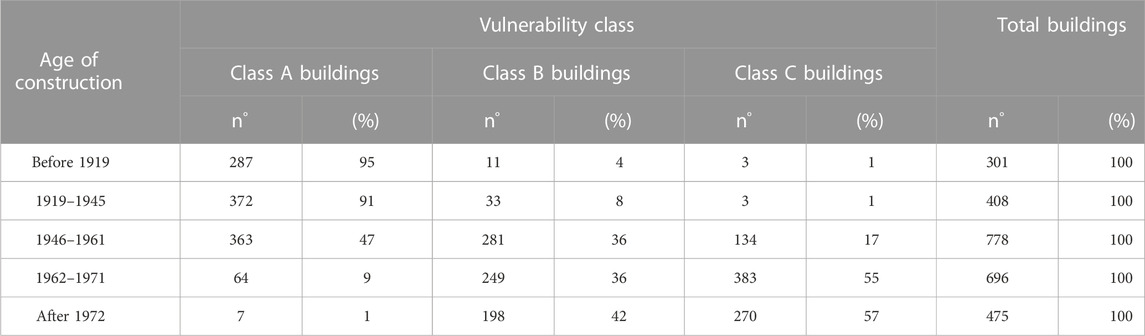
TABLE 9. Number of buildings associated with each vulnerability class on the census area.
where
The number of buildings for each cell c belonging to the vulnerability class k is computed as follows:
where Eijk, the number of buildings in zone i of the census area j belonging to the vulnerability class k, is
c is the cell, j the census area, i the zone, that is, the intersection of the cell with the census area (Figure 10), k the vulnerability class (k = A, B, C), n the number of zones in the cell c, Ejcensus the number of buildings in the census area j, Ejk the number of buildings in the census area j belonging to the vulnerability class k, EjR the number of surveyed buildings in the census area j, Eijk,R the number of surveyed buildings in zone i of the census area j belonging to the vulnerability class k, and Eijk,R the number of not surveyed buildings in zone i of the census area j belonging to the vulnerability class k.
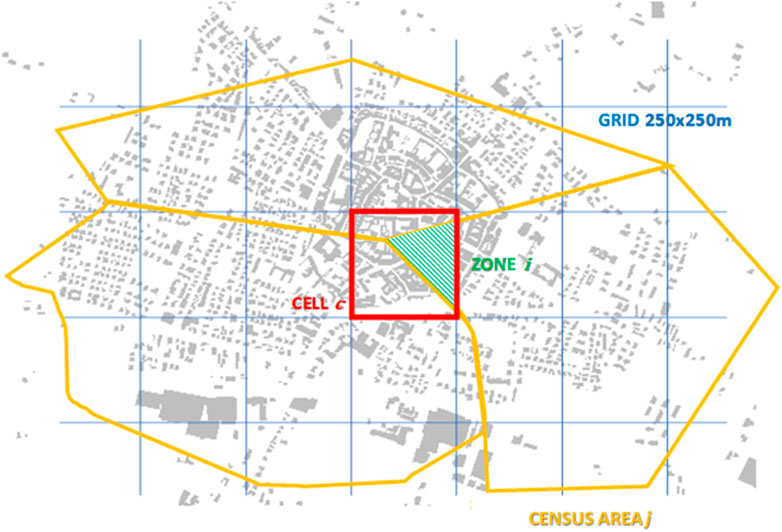
FIGURE 10. Illustrative representation of the zone (green), defined as the area of intersection between the ISTAT census area (yellow) and the 250 × 250-m cell (red) of the model reference grid (blue).
The number of buildings for each cell belonging to vulnerability Classes A, B, and C, respectively, and their percentages are reported in Figures 11, 12, 13. Over the 6,658 buildings placed in the investigated area, the model provides 17% belonging to vulnerability Class A, 37% to Class B, and 46% to Class C.
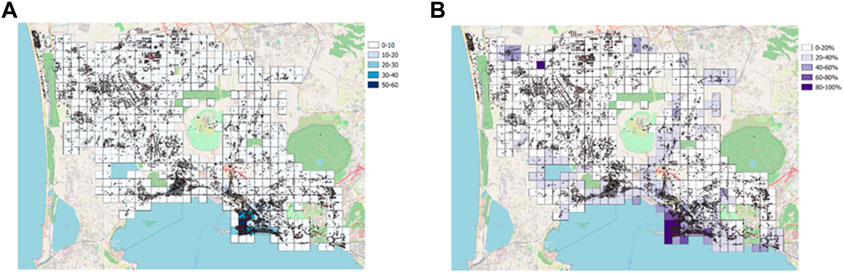
FIGURE 11. (A) Number of buildings belonging to vulnerability Class A for each cell and (B) their percentage.
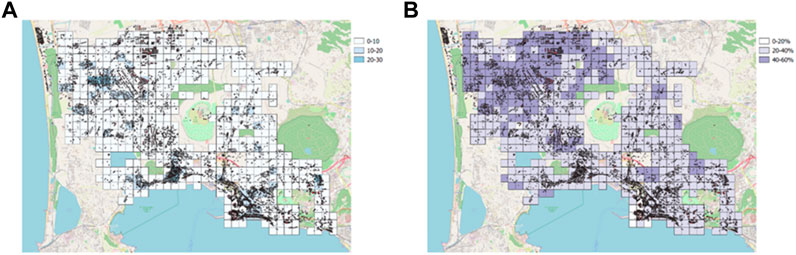
FIGURE 12. (A) Number of buildings belonging to vulnerability Class B for each cell and (B) their percentage.

FIGURE 13. (A) Number of buildings belonging to vulnerability Class C for each cell and (B) their percentage.
3.4 Outputs
Finally, the number of buildings of cell i reaching the damage level k caused by the hazard level j (associated with the cell) equals
where
Figures 14, 15 show, for each cell, the percentage of buildings affected by a given level of damage depending on the hazard values (uplift and slope, respectively) provided by CNR-IREA on 15 December 2022. The impact model evaluates light damage to load-bearing structures (D2–D5) and light damage to nonstructural elements (D1).
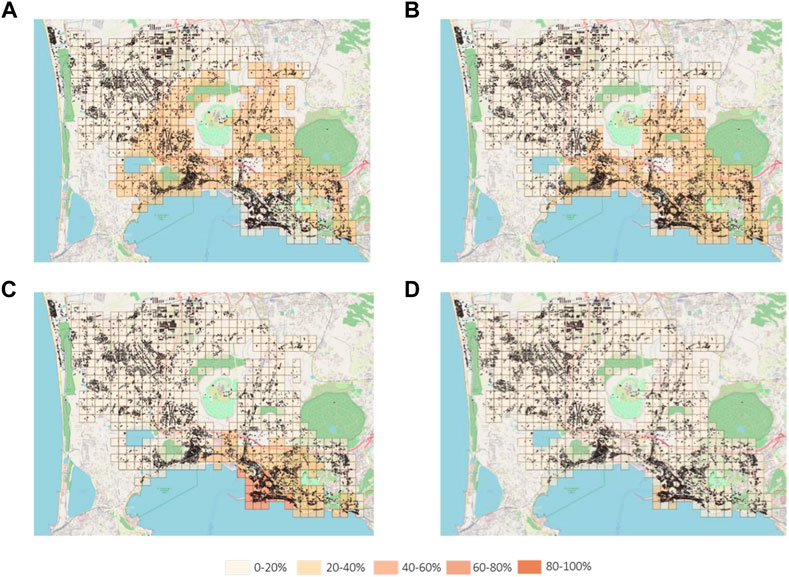
FIGURE 14. Percentage of buildings affected by damage levels D1 (A), D2 (B), D3 (C), and D4 (D) with reference to the uplift reported in Figure 8.
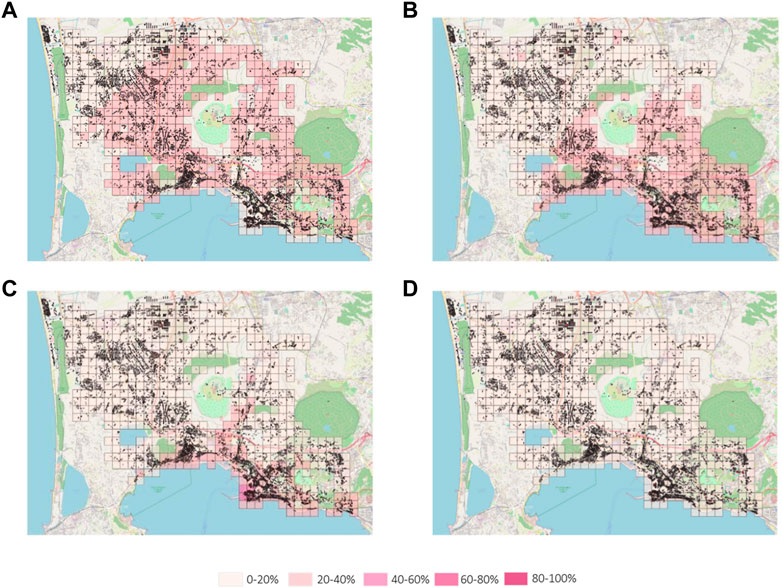
FIGURE 15. Percentage of buildings affected by damage levels D1 (A), D2 (B), D3 (C), and D4 (D) with reference to the slope reported in Figure 9.
4 Discussion, conclusion, and future developments
Campi Flegrei active caldera is a very densely urbanized area with a consequent very high volcanic risk. The occurrence of several bradyseism episodes characterized by ground uplift and subsidence according to a bell-shaped geometry centered in Pozzuoli town caused damage to the buildings and, consequently, to the resident population. During the last bradyseismic episode, which occurred in 1982–1984, the Secretary of State Minister for Coordination of Civil Protection appointed a TSC for Bradyseism in the Campi Flegrei area that, among the various carried out activities, built up the POZZUOLI form to define the state of the constructions and, in particular, the capacity of buildings for future response. The damage caused by the 1982–1984 bradyseismic event was documented in a sample of about 3,700 buildings.
In recent years, at Campi Flegrei caldera, a new phase started with increasing uplift rates over time. This phenomenon has drawn the attention of the Civil Protection Department (DPC), which is responsible for emergency coordination and relief activities. Therefore, under the VIRA agreement (VIRA 2019–2022, “Assessments of Vulnerability, Impact and Risk Induced by Campania Volcanoes on the Urban Environment”) signed between DPC and the PLINIVS Study Centre, one of the DPC competence centers, a near real-time impact study of the bradyseismic phenomenon on the built environment was conducted. Based on this agreement, the PLINIVS Study Centre produced a web application for the Civil Protection Department based on satellite data monthly provided by CNR-IREA regarding ground uplift, giving the impact, in terms of damage, on the built-up area divided by a grid of 250 × 250 m cells. The exposure and vulnerability models adopted by the web application were obtained on an empirical basis from the survey data of the POZZUOLI forms, and the outcomes are provided for each cell in terms of building six-level damage distribution. Models used for each risk factor (hazard, exposure, and vulnerability) are described, and the impact relative to the current hazard state is evaluated. The impact values obtained from the two implemented hazard parameters produce similar results, although the damage related to the slope is slightly higher.
The model developed on the basis of a web application for assessing the damage of ordinary buildings in almost real time due to bradyseism constitutes an innovative advance in the field of research, but it presents some critical issues. First of all, the hazard parameter adopted (uplift or slope of the center of gravity of the building plan) could be insufficient to capture some fundamental aspects of the phenomenon, such as differential settlements between the different foundation elements of the same building, as well as the speed of occurrence of the phenomenon itself. Another aspect that should not be underestimated is the development of empirical curves deduced on the basis of the observation of the damage caused by bradyseism, which occurred in 1982–1984. Such curves could be strongly influenced by the characteristics of the specific event, characterized by a given velocity (in terms of daily uplift), so extending those results to current bradyseism (which is slower) could be overly conservative, as the presented analyses show, which estimate greater damage than those actually recorded by the Civil Protection of the Municipality of Pozzuoli. Finally, special attention should be paid to the lower damage levels (<D3), which require greater analytical attention than that possible through the POZZUOLI form, which does not capture any disturbances, such as difficulty in opening the doors and loss of verticality of the items.
Some model improvements were considered as future activities. With reference to the hazard parameters, activities are planned to install deformation sensors on some sentinel buildings that can provide punctual ground deformation values more accurately than satellite data. Further analyses are programmed to evaluate how the speed of the phenomenon affects the damage evolution. In terms of exposure, data collection activities are planned that can provide more accurate information on the vulnerability distribution over the analyzed area. Finally, it is proposed to validate the empirical vulnerability model by comparison with curves built using analytical models (Perelli et al., 2023a).
Data availability statement
The original contributions presented in the study are included in the article/supplementary materials, further inquiries can be directed to the corresponding author.
Author contributions
FP: writing–review and editing, software, formal analysis, investigation, and data curation; LD: writing–original draft, writing–review, and editing; DD: writing–original draft, writing–review and editing, conceptualization, investigation, validation, and funding acquisition; GM: review and editing; PD: review and editing; GZ: review and editing, investigation, validation, and supervision. All authors contributed to the article and approved the submitted version.
Funding
This research was developed in the framework of the VIRA 2019–2022 research project “Assessment of Vulnerability, Impact and Risk Induced by Campania Volcanoes on the Urban Environment,” funded by the Italian Civil Protection Department. The described procedure is based on the activity of the Advanced Telecommunications and Information Technology Platforms for the Offer of Services to the Environmental Sector (PETIT-OSA) research project (PON 2000–2006).
Conflict of interest
The authors declare that the research was conducted in the absence of any commercial or financial relationships that could be construed as a potential conflict of interest.
Publisher’s note
All claims expressed in this article are solely those of the authors and do not necessarily represent those of their affiliated organizations or those of the publisher, the editors, and the reviewers. Any product that may be evaluated in this article, or claim that may be made by its manufacturer, is not guaranteed or endorsed by the publisher.
References
Aucelli, P., Brancaccio, L., and Cinque, A. (2017). “Vesuvius and campi flegrei: Volcanic history, landforms and impact on settlements,” in Landscapes and landforms of Italy (Springer), 389–398.
Cacace, F., Zuccaro, G., De Gregorio, D., and Perelli, F. L. (2018). Building inventory at national scale by evaluation of seismic vulnerability classes distribution based on census data analysis: BINC procedure. Int. J. Disaster Risk Reduct. 28, 384–393. doi:10.1016/j.ijdrr.2018.03.016
Calvi, G., Pinho, R., Magenes, G., Bommer, J., Restrepo-Vélez, L., and Crowley, H. (2006). Development of seismic vulnerability assessment methodologies over the past 30 years. ISET J. Earthq. Technol. 43 (3), 75–104.
Cannatelli, C., Spera, F., Bodnar, R., Lima, A., and De Vivo, B. (2020). “Ground movement (bradyseism) in the campi flegrei volcanic area: A review,” in Vesuvius, Campi Flegrei, and campanian volcanism, 407–433.
Columbro, C., Eudave, R., Ferreira, T., Lourenço, P., and Fabbrocino, G. (2022). On the use of web mapping Platforms to support the seismic vulnerability assessment of old urban areas. Remote Sens. 14 (6), 1424. doi:10.3390/rs14061424
Cusano, C., Angjeliu, G., Montanino, A., Zuccaro, G., and Cennamo, C. (2021). Considerations about the static response of masonry domes: A comparison between limit analysis and finite element method. Int. J. Mason. Res. Innovation 6 (4), 502–528. doi:10.1504/ijmri.2021.118835
De Martino, P., Dolce, M., Brandi, G., Scarpato, G., and Tammaro, U. (2021). The ground deformation history of the neapolitan volcanic area (Campi flegrei caldera, somma–vesuvius volcano, and ischia island) from 20 years of continuous gps observations (2000–2019). Remote Sens. 13, 2725. doi:10.3390/rs13142725
Deino, A. L., Orsi, G., de Vita, S., and Piochi, M. (2004). The age of the Neapolitan Yellow Tuff caldera-forming eruption (Campi Flegrei caldera - Italy) assessed by 40Ar/39Ar dating method. J. Volcanol. Geotherm. Res. 133, 157–170. doi:10.1016/s0377-0273(03)00396-2
Del Gaudio, C., Aquino, I., Ricciardi, G., Ricco, C., and Scandone, R. (2010). Unrest episodes at campi flegrei: A reconstruction of vertical ground movements during 1905-2009. J. Volcanol. Geotherm. Res. 195, 48–56. doi:10.1016/j.jvolgeores.2010.05.014
Di Vito, M. A., Isaia, R., Orsi, G., Southon, J., De Vita, S., D'Antonio, M., et al. (1999). Volcanism and deformation since 12,000 years at the campi flegrei caldera (Italy). J. Volcanol. Geotherm. Res. 91, 221–246. doi:10.1016/s0377-0273(99)00037-2
Giudicepietro, F., Chiodini, G., Avino, R., Brandi, G., Caliro, S., De Cesare, W., et al. (2021). Tracking episodes of seismicity and gas transport in campi flegrei caldera through seismic, geophysical, and geochemical measurements. Seismol. Res. Lett. 92, 965–975. doi:10.1785/0220200223
Harrichian, E. e. a. (2021). A review on application of soft computing techniques for the rapid visual safety evaluation and damage classification of existing buildings. J. Build. Eng. 43, 102536. doi:10.1016/j.jobe.2021.102536
Horwell, C. J., Baxter, P. J., and Kamanyire, R. (2015). “Health impacts of volcanic eruptions,” in Global volcanic hazards and risk, 289–294.
Iannuzzo, A., Angelillo, M., De Chiara, E., De Guglielmo, F., De Serio, F., Ribera, F., et al. (2018). Modelling the cracks produced by settlements in masonry structures. Meccanica 53 (7), 1857–1873. doi:10.1007/s11012-017-0721-2
Iannuzzo, A., Dell'Endice, A., Van Mele, T., and Block, P. (2021). Numerical limit analysis-based modelling of masonry structures subjected to large displacements. Computers & Structures. Comput. Struct. 242. doi:10.1016/j.compstruc.2020.106372
Işık, M., Işik, E., and Bulbul, M. .A. (2018). Application of iOS/Android based assessment and monitoring system for building inventory under seismic impact. Gradevinar 70, 1043–1056. doi:10.14256/JCE.1522.2015
Işık, M., Işik, E., and Hari̇ci̇hi̇an, E. (2021). Application of IOS/Android rapid evaluation of post-earthquake damages in masonry buildings. Gazi Mühendislik Bilim. Derg. 7 (1), 36–50. doi:10.30855/gmbd.2021.01.05
Jenkins, S., Wilson, T., Miller, V., Miller, V., Stewart, C., Blong, R. J., et al. (2015). “Volcanic ash fall hazard and risk,” in Global volcanic hazards and risk, 173–221.
Liguori, F. S., Fiore, S., Perelli, F. L., De Gregorio, D., Zuccaro, G., and Madeo, A. (2022). “Seismic vulnerability of masonry structures through a mechanical-based approach,” in World congress in computational mechanics and ECCOMAS congress (Oslo.
Lima, A., Bodnar, R., De Vivo, B., Spera, F., and Belkin, H. (2021). Interpretation of recent unrest events (bradyseism) at campi flegrei, napoli (Italy): Comparison of models based on cyclical hydrothermal events versus shallow magmatic intrusive events. Geofluids 2021, 1–16. doi:10.1155/2021/2000255
Maia Avelino, R., Iannuzzo, A., Van Mele, T., and Block, P. (2022). An energy-based strategy to find admissible thrust networks compatible with foundation settlements in masonry structures. Mech. Res. Commun. 125, 103978. doi:10.1016/j.mechrescom.2022.103978
Maleika, W. (2020). Inverse distance weighting method optimization in the process of digital terrain model creation based on data collected from a multibeam echosounder. Appl. Geomatics 12 (6), 397–407. doi:10.1007/s12518-020-00307-6
Marzocchi, W., Selva, J., Costa, A., Sandri, L., Tonini, R., and Macedonio, G. (2015). “Tephra fall hazard for the Neapolitan area,” in Global volcanic hazards and risk, 239–248.
Montanino, A., De Gregorio, D., Olivieri, C., and Iannuzzo, A. (2022). The continuous airy-based for stress-singularities (CASS) method: An energy-based numerical formulation for unilateral materials. Int. J. Solids Struct. 256, 111954. doi:10.1016/j.ijsolstr.2022.111954
Nanda, R., Damarla, R., and Nayak, K. (2022). Android application of rapid visual screening for buildings in indian context. Structures 46, 1823–1836. doi:10.1016/j.istruc.2022.10.140
Orsi, G., De Vita, S., and Di Vito, M. (1996). The restless, resurgent Campi Flegrei nested caldera (Italy): Constraints on its evolution and configuration. J. Volcanol. Geotermal Res. 74, 179–214. doi:10.1016/s0377-0273(96)00063-7
Orsi, G., Civetta, L., Del Gaudio, C., de Vita, S., Di Vito, M. A., Isaia, R., et al. (1999). Short-term ground deformations and seismicity in the resurgent campi flegrei caldera (Italy): An example of active block-resurgence in a densely populated area. Volcanol. Geotherm. Res. 91, 415–451. doi:10.1016/s0377-0273(99)00050-5
Perelli, F. L., De Gregorio, D., Cacace, F., and Zuccaro, G. (2019). Empirical vulnerability curves for Italian masonry buildings. Proceeding of the 7°ECCOMAS Thematic Conference on Computational Methods in Structural Dynamics and Earthquake Engineering [COMPDYN]. Heraklion: Crete.
Perelli, F. L., De Gregorio, D., Montanino, A., Olivieri, C., Maddaloni, G., and Iannuzzo, A. (2023a). Energy-based modelling of in-plane fragility curves for the 2D ultimate capacity of Italian masonry buildings. Front. Built Environ. 9, 1127523. doi:10.3389/fbuil.2023.1127523
Perelli, F., De Gregorio, D., and Zuccaro, G. (2023b). Analysis of ordinary buildings on the island of ischia (Italy) for a seismic impact. Sidney: SSRN.
Tramelli, A., Del Pezzo, E., Bianco, F., and Boschi, E. (2006). 3D scattering image of the Campi Flegrei caldera (Southern Italy). Phys. Earth Planet. Interiors 155, 269–280. doi:10.1016/j.pepi.2005.12.009
Vitale, S., Isaia, R., Ciarcia, S., Di Giuseppe, M., Iannuzzi, E., Prinzi, E., et al. (2019). Seismically induced soft-sediment deformation phenomena during the volcano-tectonic activity of Campi Flegrei caldera (southern Italy) in the last 15 kyr. Tectonics 38 (6), 1999–2018. doi:10.1029/2018tc005267
Zhang, S., Liu, Y., and Li, S. (2022). A brief method for rapid seismic damage prediction of buildings based on structural strength. Buildings 12 (6), 783. doi:10.3390/buildings12060783
Zuccaro, G., and Cacace, F. (2015). Seismic vulnerability assessment based on typological characteristics. First level procedure SAVE. Soil Dyn. Earthq. Eng. 69, 262–269. doi:10.1016/j.soildyn.2014.11.003
Zuccaro, G., De Gregorio, D., Leone, M. F., Sessa, S., Nardone, S., and Perelli, F. L. (2021). Caesar ii tool: Complementary analyses for emergency planning based on seismic risks impact evaluations. Sustainability 13, 9838. doi:10.3390/su13179838
Zuccaro, G., Perelli, F. L., De Gregorio, D., and Masi, D. (2021). Caesar II: An Italian decision support tool for the seismic risk. The case study of Torre Pellice, Villar Pellice and Pinerolo municipalities. Proceeding of the 8th International Conference on Computational Methods in Structural Dynamics and Earthquake Engineering, COMPDYN 2021. Athens.
Keywords: bradyseism, fragility curves, volcanic risk, building safety check, emergency plan
Citation: Perelli FL, Di Maio LS, De Gregorio D, Magliulo G, De Martino P and Zuccaro G (2023) Impact assessment caused by bradyseism phenomena in the Campi Flegrei area. Front. Built Environ. 9:1129175. doi: 10.3389/fbuil.2023.1129175
Received: 21 December 2022; Accepted: 27 April 2023;
Published: 16 May 2023.
Edited by:
Xinzheng Lu, Tsinghua University, ChinaReviewed by:
Ercan Işık, Bitlis Eren University, TürkiyeFrancesco Clementi, Marche Polytechnic University, Italy
Copyright © 2023 Perelli, Di Maio, De Gregorio, Magliulo, De Martino and Zuccaro. This is an open-access article distributed under the terms of the Creative Commons Attribution License (CC BY). The use, distribution or reproduction in other forums is permitted, provided the original author(s) and the copyright owner(s) are credited and that the original publication in this journal is cited, in accordance with accepted academic practice. No use, distribution or reproduction is permitted which does not comply with these terms.
*Correspondence: Francesca Linda Perelli, ZnJhbmNlc2NhbGluZGEucGVyZWxsaUB1bmluYS5pdA==