 Tuomo Poutanen
 Sampsa Pursiainen
 Tim Länsivaara1
- 1Civil Engineering, Faculty of Built Environment, Tampere University, Tampere, Finland
- 2Information Technology and Communication Sciences, Tampere University, Tampere, Finland
Sometimes structural loads are excessively high, and a decision must be made if intervention, either removal of the excess load or strengthening of the structure, is needed. This issue was addressed previously in the retrofitting literature. However, equations for excess load calculation were not presented. This article includes equations based on the full probabilistic reliability model for the failure probability of excessive load of three materials: steel, timber, and concrete. Failure probabilities are given as a function of the load designed for full capacity according to the Eurocodes. Safe excessive loads, i.e., loads with a failure probability less than 1/1500, are given, too. The load combination is a critical issue in this study. There are many options for load combination, which vary regarding the dependent vs. independent load combination, dependent vs. independent reliability calculation, the reference time, and the reference reliability. The conclusion is that the loads should be combined dependently, reliability should be calculated dependently, the reference time is 50 years, and the reliability is 50 years. We stress that the reliability of steel structures is questionably low in the current Eurocodes.
1 Introduction
Sometimes structural loads are excessively high, and a decision must be made if intervention, such as the removal of the excess load or strengthening of the structure is needed. This issue is widely addressed in the retrofitting literature. The reliability calculation is presented based on the independent load combination. Equations for the excess load calculation can be found, e.g., in (New, 2015; CEN, 2020).
This article explores the excessive loads of three materials: steel, timber, and concrete. Failure probabilities of these materials, designed to the full capacity according to the Eurocodes as a function of load, can be found in (CEN, 2004; CEN, 2005a; CEN, 2005b; Draft, 2020). The reliability calculation is presented here for the independent and the dependent load combination. The uncertainty is omitted. That is, the reliability and the excessive load is calculated from load and resistance distributions only. The authors have disclosed earlier equations for full probabilistic reliability calculation, which allows the failure probability calculation as a function of load (Poutanen et al., 2011; Poutanen et al., 2021a; Poutanen, 2021).
We may assume that the 50-year failure probability Pf < 1/1500 corresponding to the reliability index b50 > 3.2 denotes a safe design (International Organization for Standardization, 1987; International Organization for Standardization, 2015; Joint Committee on Structural Safety, 2022). The loads for this reliability are given, too.
The load exceeding the characteristic load during the service time of 50 years is regarded here as excessive load. The loads below the characteristic load are service loads. About half of the structures encounter an excessive load during the service time.
This paper is organized as follows. Section 2 briefly reviews the methods of load combination, Section 3 describes the present mathematical approach, and Section 4 presents computed examples which are discussed in Section 5. Section 6 concludes the study.
2 Load combination
The load combination is a debated issue in structural probability theory. Various calculation methods are presented. These differ with respect to the following four points:
1. Independent vs. dependent load combination. The current dominant hypothesis is the independent combination (Ferry Borges and Castanheta, 1971). The load combination is independent if there is a load reduction normally realized by multiple permanent load factors such as γG = 1.15, 1.35 in the Eurocodes; otherwise, the combination is dependent. We have earlier shown in (Poutanen et al., 2018; Poutanen et al., 2021b) that the load combination is dependent. The dependent load combination is applied mainly here; it is safe, as it results in about 10% higher safety factors than those obtained from the independent load combination. This article includes one further argument for the dependent combination; the independent combination calculated for 50-year loads and reliability is virtually the same as the dependent one.
2. Independent vs. dependent reliability calculation. The independent calculation is simply obtained using the convolution equation (CEN, 2005b; Poutanen et al., 2021a), while the dependent one is obtained by summing up the partial loads by fractiles (CEN, 2005b; Poutanen et al., 2021a). The reliability calculation should be dependent on the same arguments as the dependent load combination.
3. The reference time, which may be 1 (Poutanen et al., 2011; Köhler et al., 2019; Ranta-Maunus et al., 2022), 5 (Gulvanessian et al., 2002; Gulvanessian and Holicky, 2005; Implementation of Eurocodes, 2005), or 50 years (Poutanen et al., 2021a; Poutanen, 2021; Ranta-Maunus et al., 2022). The first two of these are based on the independent load combination and reduced reliability. The 50-year load strikes every structure, and it is always simultaneous with the permanent load. Therefore, the reference time should be 50 years. The current dominant load combination assumption is that the loads are combined from independent and random one-year loads. This assumption ignores the fact that the variable load strikes each structure multiple times and the highest load is the 50-year load. Consequently, the 50-year load is critical, as the design must be based on the highest load.
4. The reference reliability, which may be modified one-year reliability (Köhler et al., 2019) or 50-year reliability (Gulvanessian and Holicky, 2005; Implementation of Eurocodes, 2005; Poutanen et al., 2011; Poutanen et al., 2021a; Poutanen, 2021; Gulvanessian et al., 2002). The modified one-year reliability is based on the independent load combination and a load reduction. The permanent load and the 50-year variable load are always simultaneous, and, therefore, no load reduction can be applied. Thus, the reliability should be based on the 50-year reliability.
These four options result in the following nine calculation methods presented in the literature:
1. The loads are combined dependently, and the reliability is calculated dependently for 50-year loads and for 50-year reliability (Poutanen et al., 2021a; Poutanen, 2021).
2. The loads are combined dependently, and the reliability is calculated independently for 50-year loads and for 50-year reliability (Poutanen et al., 2021b).
3. The loads are combined dependently, and the reliability is calculated independently for 5-year loads and for 50-year reliability [rule 8.12 of the Eurocodes (Gulvanessian et al., 2002; Gulvanessian and Holicky, 2005; Implementation of Eurocodes, 2005)].
4. The loads are combined independently, the reliability is calculated independently for 5-year loads and for the 50-year reliability [rule 8.13,a,b (Gulvanessian et al., 2002; Gulvanessian and Holicky, 2005; Implementation of Eurocodes, 2005)].
5. Rule 8.14,a,b of the Eurocodes, which is a simplification of rule 8.13,a,b, resulting in excess unsafe error (Gulvanessian et al., 2002; Gulvanessian and Holicky, 2005; Implementation of Eurocodes, 2005).
6. As 3, but the loads are calculated for 1-year loads and for reduced 1-year reliability (Köhler et al., 2019).
7. As 4, but the loads are calculated for 1-year loads and for reduced 1-year reliability (Köhler et al., 2019).
8. As 5, but the loads are calculated for 1-year loads and for reduced 1-year reliability (Köhler et al., 2019).
9. The loads are combined dependently, and the reliability is calculated independently for 1-year loads and for 50-year reliability (Ranta-Maunus et al., 2022).
Methods 6–8 are not addressed here further, as these methods are semi-probabilistic and lead to almost the same result as methods 3-5, which are more precise in cases where the permanent load is dominant. Method 9 results in unrealistic low reliability for variable loads and is not addressed here further. Method 4 apparently is currently considered the most correct one by the research community. In the authors’ opinion, method 1 is correct, and method 2 yields virtually the same result as explained here and in (Poutanen et al., 2021b). In this article, methods 1, 2, and 4 are addressed further and compared with each other.
3 Materials and methods
In the following, we apply the notation of the Eurocodes (Draft, 2020). Assumptions of the current structural probability theory and the Eurocodes apply except for the load combination.
3.1 Assumptions
The target reliability index of the current Eurocodes is β1 = 4.7, whereas β1 = 4.2 is assumed here as the criterion to calculate the safe excessive load (International Organization for Standardization, 1987; International Organization for Standardization, 2015; Joint Committee on Structural Safety, 2022).
The reliability calculation necessitates a design point, where the characteristic loads of all distributions, the mean of the permanent load, the 0.98 fractile of the one-year variable load, and the 0.05 fractile of the material property are fixed. Here the design point is set at unity in the distribution-setting phase, i.e., in the serviceability limit state (SLS) as well as in the ultimate limit state (ULS). In the ULS reliability calculation, safety factors are applied, which shifts the distributions further away from the design point. It is arbitrary whether they are shifted left (down to lower loads) or right (up to higher loads) given that the load and the resistance distributions are moved further away from each other. Here, the design point is unity in the SLS and the ULS when the loads are shifted down and the material properties up in the ULS. Thus, the load distributions in the ULS are obtained by dividing the SLS distributions through safety factors, and the ULS-material property distributions are obtained by multiplying the SLS distributions by the material safety factors.
Below, we examine three materials (CEN, 2004; CEN, 2005a; CEN, 2005b)—steel, timber, and concrete, assuming that the coefficients of the variations are VM = 0.1, 0.2, and 0.3 respectively.
3.2 Permanent load
The permanent load distribution is normal, the cumulative distribution is
3.3 Variable load
The variable load distribution is assumed to be the Gumbel distribution with cumulative distribution
3.4 Materials
The material resistance distribution is assumed to be the log-normal distribution, with the cumulative distribution
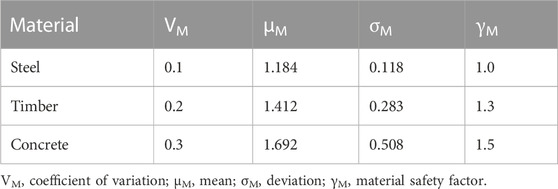
TABLE 1. The parameters of the three examined materials steel, timber, and concrete.
3.5 Basic equations
The reliability calculation utilizes three equations as explained in this section. The safety factor calculation procedure is explained in detail (Poutanen et al., 2011; Poutanen et al., 2021a; Poutanen, 2021), that is why it is explained only concisely here.
When one load L with the cumulative distribution
Both distributions are set with equal characteristic values. The load
When the load comprises the permanent and variable load and the variable load proportion is α in relation to the total load α =
where
The dependent combination is calculated by (Poutanen et al., 2011; Poutanen et al., 2021a; Poutanen, 2021)
4 Results
Failure probabilities are given in Figure 1 as function of load. Unity denotes the characteristic load. Solid lines, steel; dashed lines, timber; and dash-dotted lines, concrete. Black lines apply to permanent loads and red lines to variable loads, respectively.
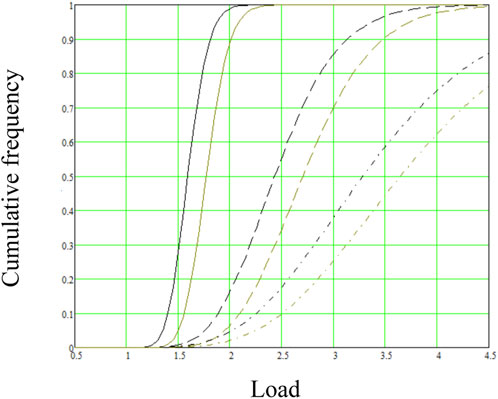
FIGURE 1. Failure probability of steel, solid lines; timber, dashed lines; and concrete, dash-dotted lines. Black lines (lower loads) apply to permanent load and red lines to variable loads, respectively.
The basic materials resist excessive load differently. The 50% failure probability is reached in steel, timber, and concrete at about 70%, 150%, and 250% excessive load. However, the differences are considerably smaller at low probabilities, which are critical in design. Excessive loads for 50-year failure probability Pf = 1/1500 are given in Table 2. These numbers are calculated by
where

TABLE 2. Loads that result in the failure probability Pf = 1/1500; the combination load applies to dependent 50% + 50% combination.
4.1 Load combination
The excessive load calculations provide a framework for comparing various load combination methods. The following comparison is made between three load combination methods: 1, 2, and 4.
The structures are designed for 50 years. As the 50-year variable load is always simultaneous with the permanent load in each structure, no load reduction can be made. Thus, the reference time needs to be 50 years and the reference reliability is 50 years.
These requirements are best met with method 1. However, since the 50-year variable load and the permanent load, clearly, are independent, method 2 provides a feasible combination. However, the predominant method 4 can be regarded as erroneous; it relies on the assumption of random and independent 1-year loads ignoring that the variable load strikes each structure multiple times and each structure definitively encounters the 50-year variable load. Method 4 also incorrectly includes two load reductions: loads are combined independently, and the reliability is calculated for 5-year loads only. Consequently, each load reduction makes unsafe error up to 10% and cumulatively up to 15%.
In Figure 2, failure probability is given as function of load. Dashed line applies to the dependent load combination (method 1), and dotted line depicts the independent load combination (method 2). The solid line denotes the combination rule 8.14,a,b (method 4). Dashed and dotted lines overlap, meaning that the actual loads differ from each other less than 1%.
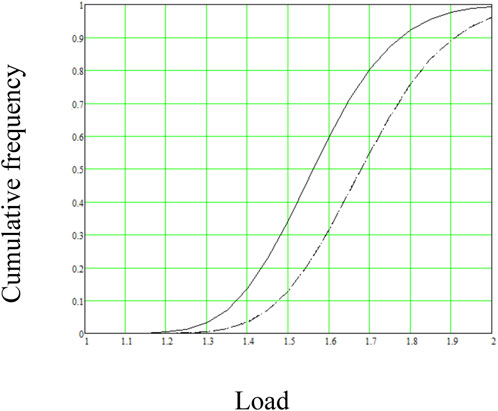
FIGURE 2. Failure probability as function of load calculated dependently (method 1, dashed line); independently (method 2, dotted line which overlaps with the dashed line), and Rule 8.14,a,b of the Eurocodes (method 4, solid line).
5 Discussion
The excessive load resistance of steel is lower than the excessive load resistance of other materials, suggesting that the safety factor of steel
This study showed that the structures designed and constructed according to the Eurocodes should resist at least 20% excessive load over the characteristic loads. The authors have investigated structural failures over several decades, and in the authors’ opinion, about 10% of the failures are due to excessive load and 90% due to other reasons. This estimate was confirmed recently in verbal communication with the experts of the Finnish Safety Investigation Authority, https://www.turvallisuustutkinta.fi. This means that the current structural design and the execution includes uncertainty, which is at least about 20% regarding the overall resistance.
The excessive load calculation shows that the dependent and the independent load combination result in virtually the same outcome when the permanent load and the 50-year variable load are combined. The same conclusion applies to the safety factor calculation (Poutanen et al., 2021a) when the variable load is calculated for 50-year loads without load reduction. However, the dependent combination is correct as it results in correct safety factors and failure probabilities, and the independent combination can be interpreted as contradicting physics and deterministic mechanics (Poutanen et al., 2021b). Further, the group effect demands the dependent load combination (Poutanen et al., 2021b).
6 Conclusion
Timber and concrete structures calculated to the full capacity according to the Eurocodes resist safely about 30% of excessive load with respect to the characteristic load with a lower failure probability than 1/1500 in 50 years. Steel structures resist only about 20% of excessive load, which indicates that the material safety factor of steel
The current structural design and the execution includes uncertainty, which is at least about 20% regarding the overall resistance.
The permanent load and the variable load should be combined dependently, i.e., without applying a load reduction. The load combination should be calculated dependently, meaning that the combination distribution is obtained by adding the partial distributions by fractiles. The reliability needs to be calculated for 50-year loads and for 50-year reliability. Gulvanessian, Calgaro, Holicky.
Data availability statement
The original contributions presented in the study are included in the article/Supplementary Material, further inquiries can be directed to the corresponding author.
Author contributions
Conceptualization, TP and SP; methodology, TP; software, TP; validation, TP, TL, and SP; formal analysis, TP; investigation, TP; resources, TL; data curation, TP; writing—original draft preparation, TP and SP; writing—review and editing, SP and TL; visualization, TP; supervision, TL; project administration, TL. All authors contributed to the article and approved the submitted version.
Funding
SP was supported by Academy of Finland Centre of Excellence in Inverse Modelling and Imaging 2018-2025 (project 353089).
Conflict of interest
The authors declare that the research was conducted in the absence of any commercial or financial relationships that could be construed as a potential conflict of interest.
Publisher’s note
All claims expressed in this article are solely those of the authors and do not necessarily represent those of their affiliated organizations, or those of the publisher, the editors and the reviewers. Any product that may be evaluated in this article, or claim that may be made by its manufacturer, is not guaranteed or endorsed by the publisher.
References
Cen, E. N. (2005a). 1992-1-1:2005, eurocode 2. Design of concrete structures. Brussels, Belgium: CEN.
Draft, C. E. N. prE. N. (2020). 1990:2020 eurocode—basis of structural design. Brussels, Belgium: CEN.
Ferry Borges, J., and Castanheta, M. (1971). Structural safety. Lisbon, Portugal: Laboratorio Nacional de Engenharia Civil.
Gulvanessian, H., Calgaro, J.-A., and Holicky, M. (2002). Designer’s guide to EN 1990, EUROCODE: Basis of structural design. London, UK: Thomas Telford Publishing.
Gulvanessian, H., and Holicky, M.(2005). Using reliability analysis to combine action effects. Proc. Inst. Civ. Eng. Struct. Build. 158, 243–252.doi:10.1680/stbu.2005.158.4.243
Implementation of Eurocodes, J. R. C. (2005). Handbook 2, reliability backgrounds; JRC. Prague, Czech Republic. https://eurocodes.jrc.ec.europa.eu/showpublication.php?id=63.
International Organization for Standardization (2015). ISO 2394, general principles of reliability of structures, list of equivalent terms. Geneva, Switzerland: International Organization for Standardization.
International Organization for Standardization (1987). ISO 8930 general principles of reliability of structures. Geneva, Switzerland: International Organization for Standardization.
Joint Committee on Structural Safety (2022). Reliability-based code calibration. http://www.jcss.byg.dtu.dk/codecal.
Kohler, J., Sørensen, J. D., and Baravalle, M., Calibration of existing semi-probabilistic design codes, Proceedings of the 13th International Conference on Application of Statics and Probability in Civil Engineering, Seoul, Korea, May 2019
New, J. R. C. (2015). European technical rules for the assessment and retrofitting of existing structures, JRC science and policy report. European Commission. https://ec.europa.eu/jrc.
Poutanen, T. (2011). “Calculation of partial safety factors,” in Applications of statistics and probability in civil engineering. Editors M. Faber, J. Köhler, and K. Nishijima (London, UK: Taylor and Francis Group), 303–304.
Poutanen, T. (2021). Code calibration of the Eurocodes. Appl. Sci. 11, 5474. doi:10.3390/app11125474
Poutanen, T., Länsivaara, T., Pursiainen, S., Mäkinen, J., and Asp, O. (2021). Calculation of safety factors of the Eurocodes. Appl. Sci. 11, 208. doi:10.3390/app11010208
Poutanen, T., Pursiainen, S., and Länsivaara, T. (2021b). Combination of permanent and variable load is dependent. Appl. Sci. 11, 4434. doi:10.3390/app11104434
Poutanen, T., Pursiainen, S., Mäkinen, J., and Länsivaara, T. (2018). Combination of permanent and variable loads. Raken. Mek. 51, 1–9. doi:10.23998/rm.65175
Ranta-Maunus, A., Fonselius, M., Kurkela, J., and Toratti, T. (2022). Reliability analysis of timber structures. Espoo: VTT Research Notes 2109. https://www.vtt.fi/inf/pdf/tiedotteet/2001/T2109.pdf.
Keywords: structural reliability, excessive load, independent load combination, dependent load combination, Eurocodes
Citation: Poutanen T, Pursiainen S and Länsivaara T (2023) Excessive load. Front. Built Environ. 9:1204877. doi: 10.3389/fbuil.2023.1204877
Received: 12 April 2023; Accepted: 09 June 2023;
Published: 22 June 2023.
Edited by:
Salvatore Sessa, University of Naples Federico II, ItalyReviewed by:
Davide Pellecchia, University of Naples Federico II, ItalyCopyright © 2023 Poutanen, Pursiainen and Länsivaara. This is an open-access article distributed under the terms of the Creative Commons Attribution License (CC BY). The use, distribution or reproduction in other forums is permitted, provided the original author(s) and the copyright owner(s) are credited and that the original publication in this journal is cited, in accordance with accepted academic practice. No use, distribution or reproduction is permitted which does not comply with these terms.
*Correspondence: Sampsa Pursiainen, c2FtcHNhLnB1cnNpYWluZW5AdHVuaS5maQ==