 Kenji Fujii
- Department of Architecture, Faculty of Creative Engineering, Chiba Institute of Technology, Chiba, Japan
The response of structures under pulse-like ground motions is characterized by the large amount of energy input in a few cycles. Consequently, structures with insufficient strength may suffer severe damage owing to excessive deformation. In a previous paper, the energy-based prediction procedure for the peak and cumulative response of a reinforced concrete (RC) frame building with steel damper columns was proposed (Fujii and Shioda, Buildings, 2023, 13, 401). Although this procedure was verified by comparison to the nonlinear time-history analysis (NTHA) results, the performance of the proposed procedure with pulse-like ground motion records has not been verified yet. In this study, the accuracy of the energy-based prediction procedure for an RC frame building with steel damper columns was investigated by considering pulse-like ground motions. The numerical analysis results reveal that the accuracy of the predicted peak response is satisfactory, which agrees with the results of the author’s previous study. However, the accuracy of the predicted total input energy to the building model depends on the ratio of the pulse period of the ground motion to the effective fundamental period of the building model. The reasons for this underestimation of the total input energy are discussed in this paper.
1 Introduction
1.1 Background and motivation
Pulse-like ground motions have been observed in past earthquakes (1994 Northridge Earthquake, 1995 Kobe Earthquake, 1999 Kocaeli Earthquake, 1999 Chi-Chi Earthquake). The response of structures under such ground motions is characterized by a large amount of energy input in a few cycles. Consequently, structures with insufficient strength may suffer severe damage owing to excessive deformation. Therefore, the evaluation of the peak deformation of structures is essential in the case of pulse-like ground motions.
In a previous paper, the energy-based prediction procedure for the peak and cumulative response of a reinforced concrete (RC) frame building with steel damper columns (SDCs) was proposed (Fujii and Shioda, 2023). In this procedure, two energy-related seismic intensity parameters are considered, namely, the maximum momentary input energy (Hori and Inoue, 2002) and the total input energy (Akiyama, 1985). The peak displacement is predicted by considering the energy balance during a half cycle of the structural response, using the maximum momentary input energy. Then, the energy dissipation demand of the dampers is predicted by considering the energy balance during an entire response cycle using the total input energy. Although this procedure has been verified by comparing the nonlinear time-history analysis (NTHA) results, the performance of this procedure in the case of pulse-like ground motion records has not been verified yet. Therefore, this study investigated the accuracy of the proposed procedure for buildings subjected to pulse-like ground motions.
1.2 Brief review of related studies
1.2.1 Studies on characteristics of near-fault ground motions
The characteristics of near-fault ground motions have been widely investigated (Somerville et al., 1997; Alavi and Krawinkler, 2000; Mavroeidis and Papageorgiou, 2003; Bray and Rodriguez-Marek, 2004; Baker, 2007; He and Agrawal, 2008; Ghahari et al., 2010; Shahi and Baker, 2014; Yang and Zhou, 2015; Quaranta and Mollaioli, 2019; Feng et al., 2021; Sugino et al., 2021; Ghanbari and Fathi, 2022). Somerville et al. (1997) pointed out that large velocity pulses can be observed in the normal-fault direction in near-fault records owing to the forward directivity effect. Many studies have modeled the velocity pulses (Alavi and Krawinkler, 2000; Mavroeidis and Papageorgiou, 2003; He and Agrawal, 2008). Alavi and Krawinkler (2000) modeled the velocity pulses using simple rectangular waves for structural analysis. Mavroeidis and Papageorgiou (2003) proposed a mathematical model for representing the velocity pulses as the product of two sine functions. He and Agrawal (2008) proposed a mathematical model based on the Belarge wavelet. Yang and Zhou (2015) and Sugino et al. (2021) modeled velocity pulses using the Gabor wavelet. The decomposition of the near-fault ground motion records into pulse components and (other) residual components has also been attempted by several studies. Ghahari et al. (2010) proposed a procedure for decomposing the near-fault ground motions into long-period pulses and relatively high-frequency background records using a moving average filtering technique; Quaranta and Mollaioli (2019); Feng et al. (2021) proposed a procedure for decomposing near-fault ground motions using the Variational Mode Decomposition (VMD) technique. Ghanbari and Fathi (2022) proposed a procedure for decomposing near-fault ground motions using empirical Fourier decomposition.
The pulse period (or pulse duration) is a key parameter for appropriately modeling velocity pulses. Several studies (Alavi and Krawinkler, 2000; Mavroeidis and Papageorgiou, 2003; Bray and Rodriguez-Marek, 2004; Baker, 2007; Shahi et al., 2014; Quaranta and Mollaioli, 2019) have pointed out that, although the definition of the pulse period may differ among researchers, the pulse period becomes longer when the moment magnitude (
1.2.2 Studies on response of buildings subjected to near-fault ground motions
The responses of structures under pulse-like ground motions were widely investigated after the 1994 Northridge and 1995 Kobe earthquakes (Hall et al., 1995; Alavi and Krawinkler, 2000; Huang, 2003; Alavi and Krawinkler, 2004; Mavroeidis et al., 2004; Akkar et al., 2005; Kalkan and Kunnath, 2006; Xu et al., 2007; Kojima and Takewaki, 2015a; Alonso-Rodríguez and Miranda, 2015; Kojima and Takewaki, 2015b; Alhan and Öncü-Davas, 2016; Güneş and Ulucan, 2019; Al Shawa et al., 2020; Yalcin and Dicleli, 2020; Mota-Páez et al., 2021). Hall et al. (1995) investigated the response of 20-story steel moment-resisting frame (MRF) building models and a three-story RC base-isolated building model using artificially generated pulse-like ground motions. They found that long-period pulse-like ground motions are critical to such flexible building structures. Alavi and Krawinkler (2000; 2004) investigated the response of generalized steel MRF models using a rectangular pulse wave model. They demonstrated that the response of MRF models strongly depends on the ratio of the pulse period (
To the author’s understanding, the ratio of the pulse period
1.3 Objectives
With the background outlined above, this study addressed the following questions.
(i) How accurate is the proposed procedure for RC MRFs with SDCs subjected to pulse-like ground motions?
(ii) Does the accuracy of the procedure depend on the ratio of the pulse period of ground motions to the effective fundamental period of the building model?
In this study, the accuracy of the energy-based prediction procedure for an RC building with SDCs was investigated by considering pulse-like ground motions. To answer the questions stated above, 8- and 16-story RC MRFs with SDCs were considered. Additionally, 30 pulse-like ground motion records were used. The pulse-like ground motions were divided into two groups in accordance with the pulse period defined in the NGA-West2 ground motion database (Shahi et al., 2014).
The rest of this paper is organized as follows. Section 2 outlines the procedure proposed by the authors (Fujii and Shioda, 2023). Section 3 presents two RC MRFs with SDCs, and introduces the ground acceleration data used in the NTHA. The 30 ground motions are grouped into two groups and scaled such that the predicted peak equivalent displacement of the first modal response reaches the predetermined value. Section 4 describes the validation of the seismic demand predictions. Section 5 discusses the accuracy of the predicted peak equivalent displacement of the first modal response, and the contribution of the first modal response to the cumulative energy input. Then, the accuracy of the cumulative input of the first modal response is investigated. The conclusions drawn from this study and the directions of future research are discussed in Section 6.
2 Outline of prediction procedure
Figure 1 outlines the prediction procedure proposed in previous work by the author (Fujii and Shioda, 2023). As can be seen, this procedure consists of three stages, as summarized below.
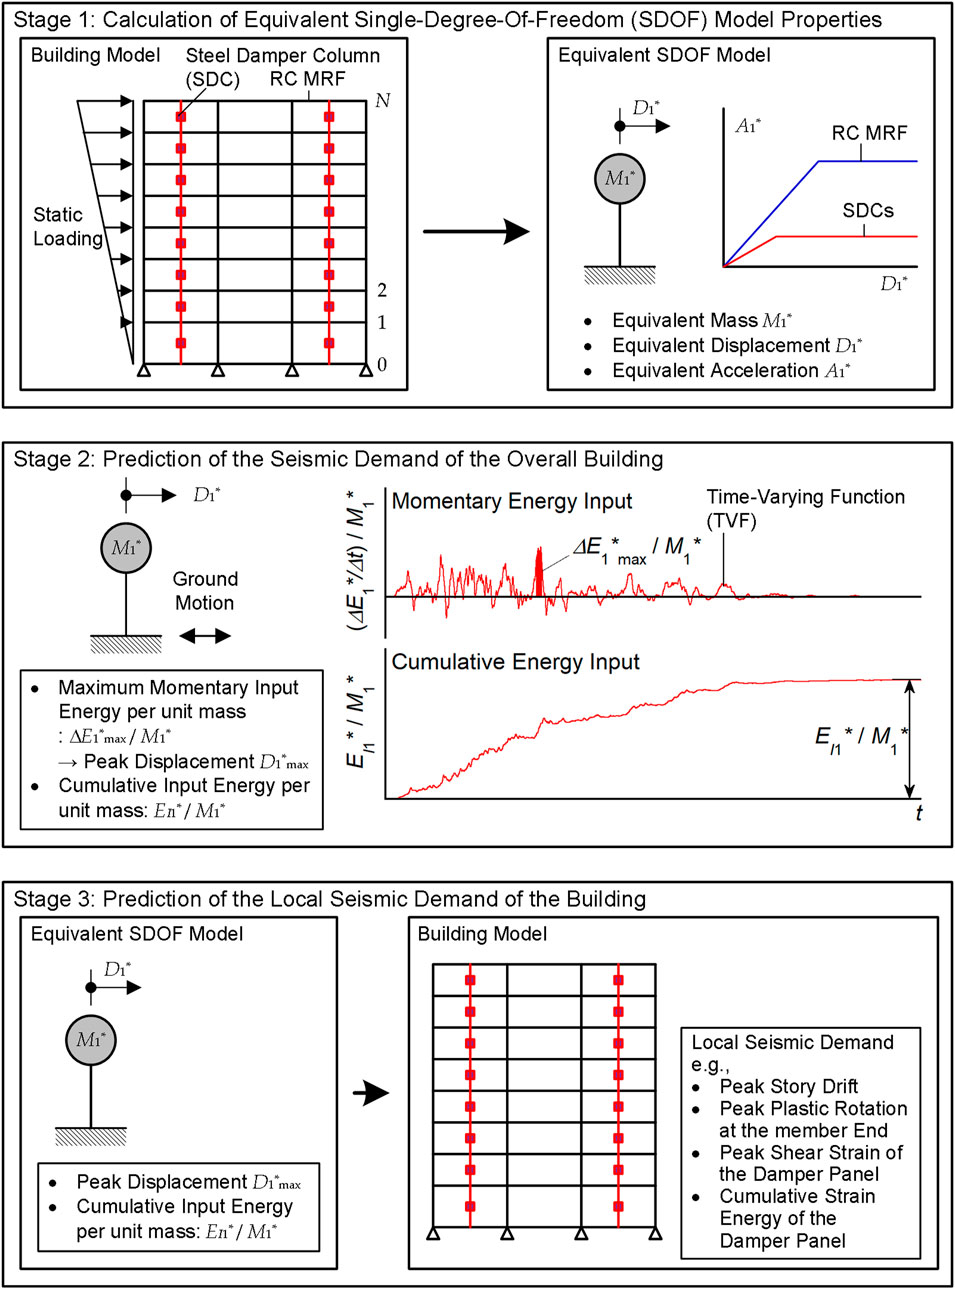
FIGURE 1. Outline of prediction procedure (Fujii and Shioda, 2023).
In Stage 1, the pushover analysis of the building model is carried out to obtain the restoring force–displacement relationship. From this result, the equivalent displacement (
where
In Stage 2, the
The equivalent displacement of the equivalent linear system (
In this procedure, the
where
The total input energy of the entire building model is evaluated as follows:
where
In Stage 3, the local seismic demand of the building model is predicted using the peak and cumulative response of the equivalent SDOF model and the pushover analysis results.
More details on the procedure can be found in a previous paper by the author (Fujii and Shioda, 2023).
3 Building and ground motion data
3.1 Building data
The two planar building models analyzed in this study are 8- and 16-story RC MRFs with SDCs, which are the same as those used in the author’s previous study (Fujii and Shioda, 2023). Figure 2 shows the simplified structural plan and elevation of the RC MRF building models with SDCs. Details on the two structural models can be found in the author’s previous study (Fujii and Shioda, 2023). In this study, the viscous damping ratio of the first modal response of the RC MRFs in the elastic range (
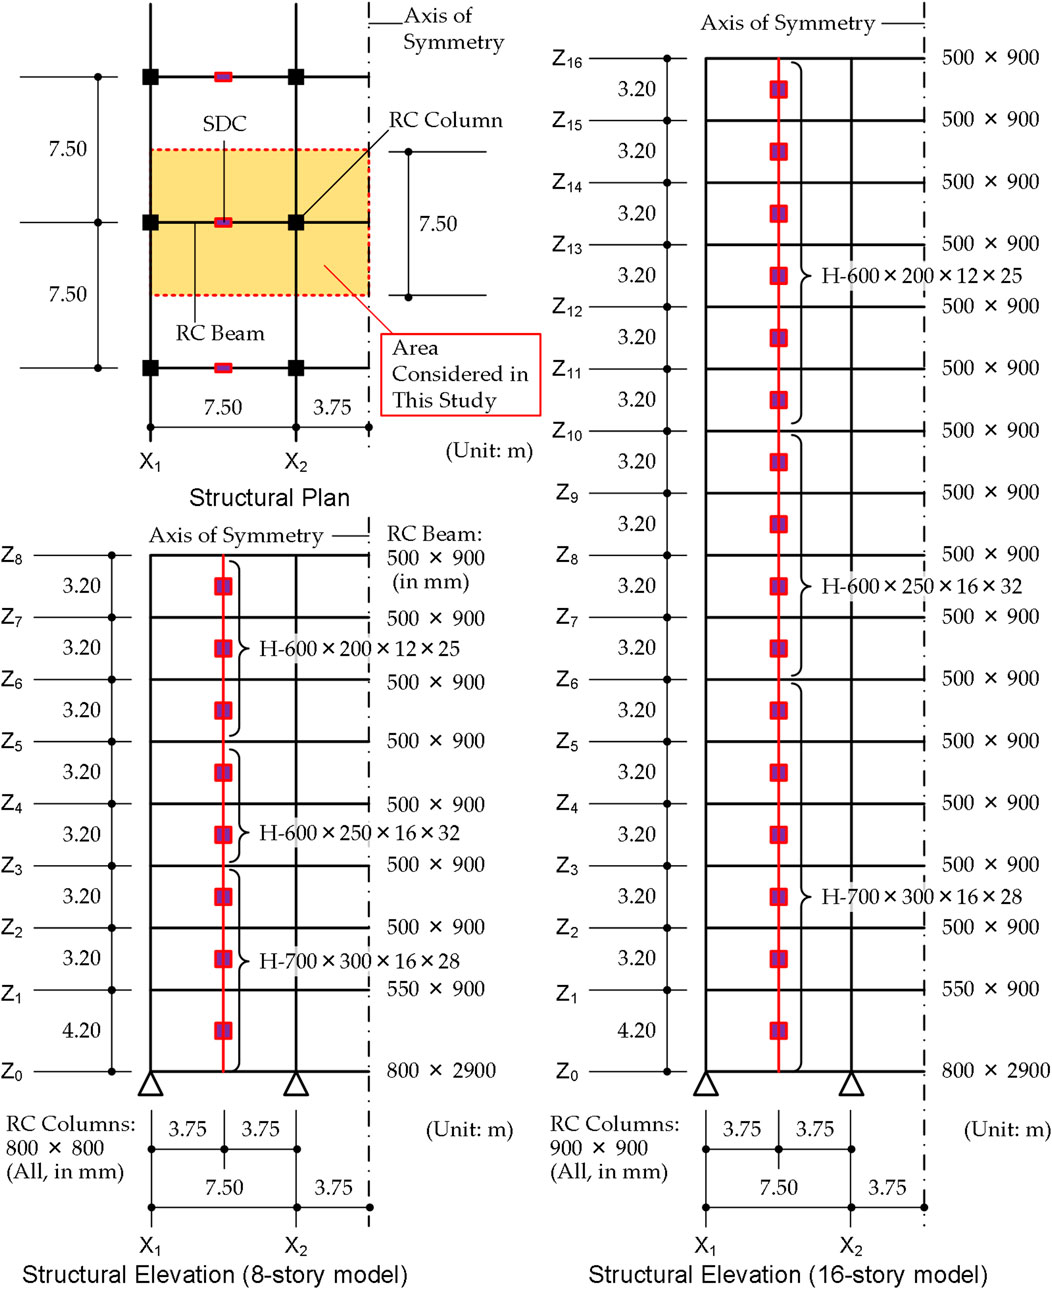
FIGURE 2. Simplified structural plan and elevations of analysis models (Fujii and Shioda, 2023).
Figure 3 shows the capacity curve of the two models calculated based on the pushover analysis results. In this study, the input ground motions were scaled such that the predicted
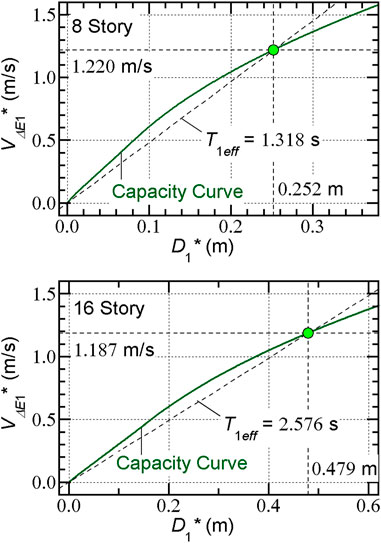
FIGURE 3. Capacity curve of analysis models calculated based on pushover analysis results.
3.2 Ground motion data
As has been shown by the previous studies discussed in Section 1.2, the response of a building structure subjected to pulse-like ground motions is obviously affected by the ratio of the pulse period of the ground motion (
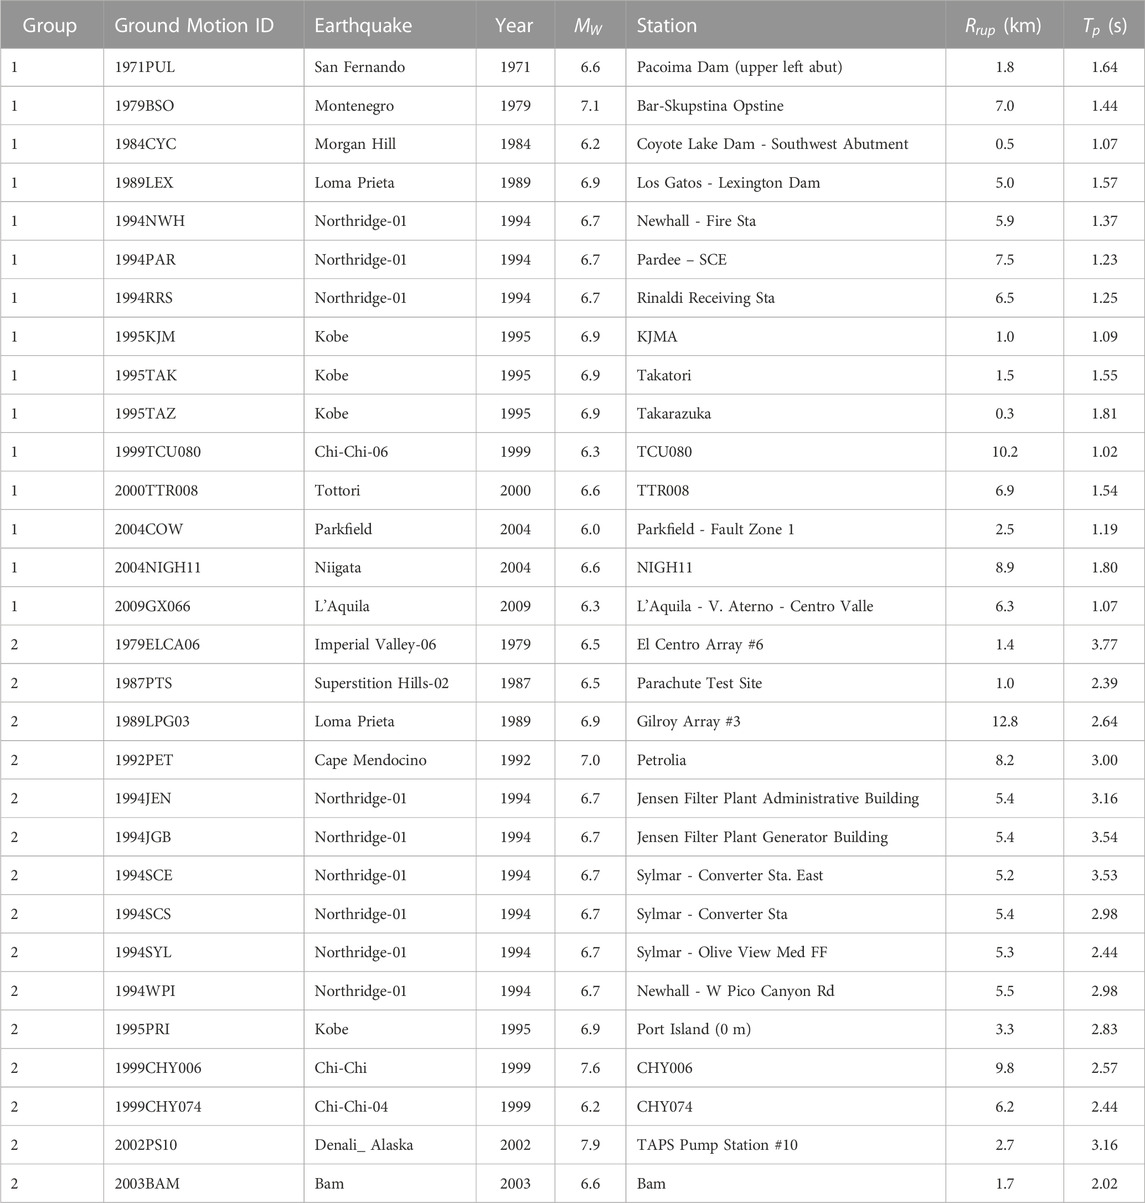
TABLE 1. List of ground motion sets investigated in this study.
It is important to show the range of the ratio
3.3 Analysis method
For the NTHA of building structures subjected to near-fault ground motions, the selection of the axis of the horizontal component is important. According to research on near-fault ground motions, the horizontal component of the fault normal/fault-parallel (FN/FP) directions is critical to structures (Somerville et al., 1997). However, Kalkan and Kwong demonstrated that rotating the ground motions to the FN/FP directions does not always provide the maximum responses at all angles (Kalkan and Kwong, 2013). Güneş and Ulucan (2019) analyzed a 40-story reinforced concrete building model subjected to near-fault pulse-like ground motions. In their study, the direction of the maximum pseudo-velocity spectrum was used instead of the FN direction, because large velocity pulses were observed in the FP direction in the Yarimca records of the 1999 Kocaeli earthquake. Therefore, it is likely that the FN/FP directions cannot be used as the critical axis of the horizontal ground motion.
In this study, the horizontal component axis was calculated based on the author’s previous study (Fujii, 2022). The procedure is described below.
Step 1. Calculate the complex Fourier coefficients of the ground motion components (
where
Step 2. Calculate the following matrix
where
Step 3. Carry out eigenvalue analysis for matrix
Step 4. Calculate the horizontal major component based on the cumulative energy input, as follows:
In the calculation of
Next, the scaling factor (
where
In this study, the horizontal major component
In the NTHA of this study, a computer program developed by the authors in the previous study (Fujii and Miyagawa, 2018) was used.
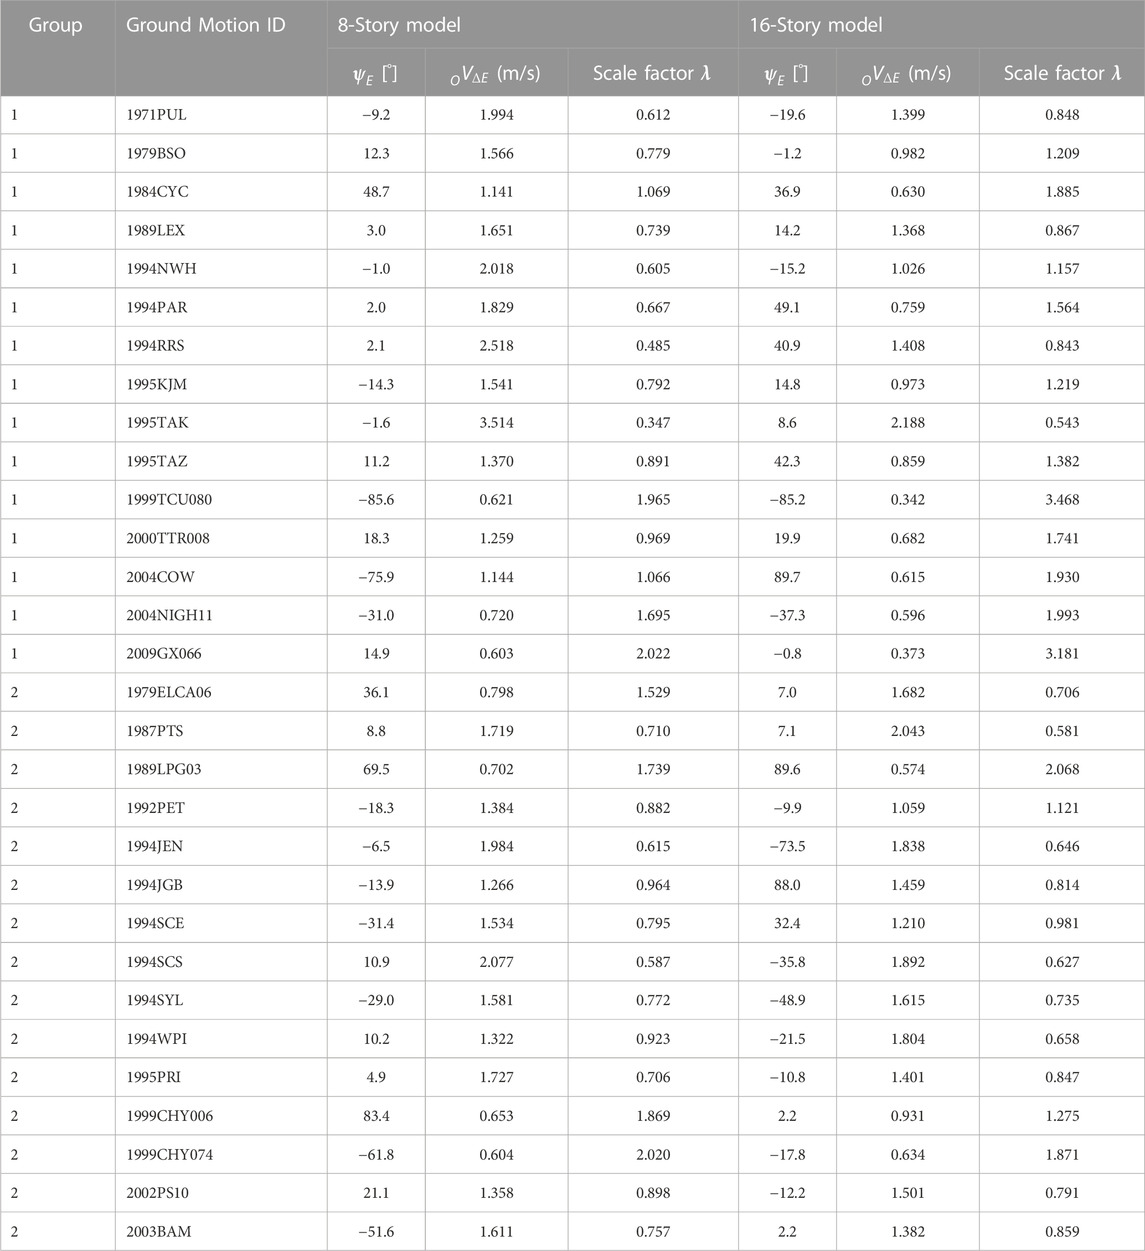
TABLE 2. Angle of horizontal major direction based on cumulative energy input and scale factor of ground motion sets investigated in this study.
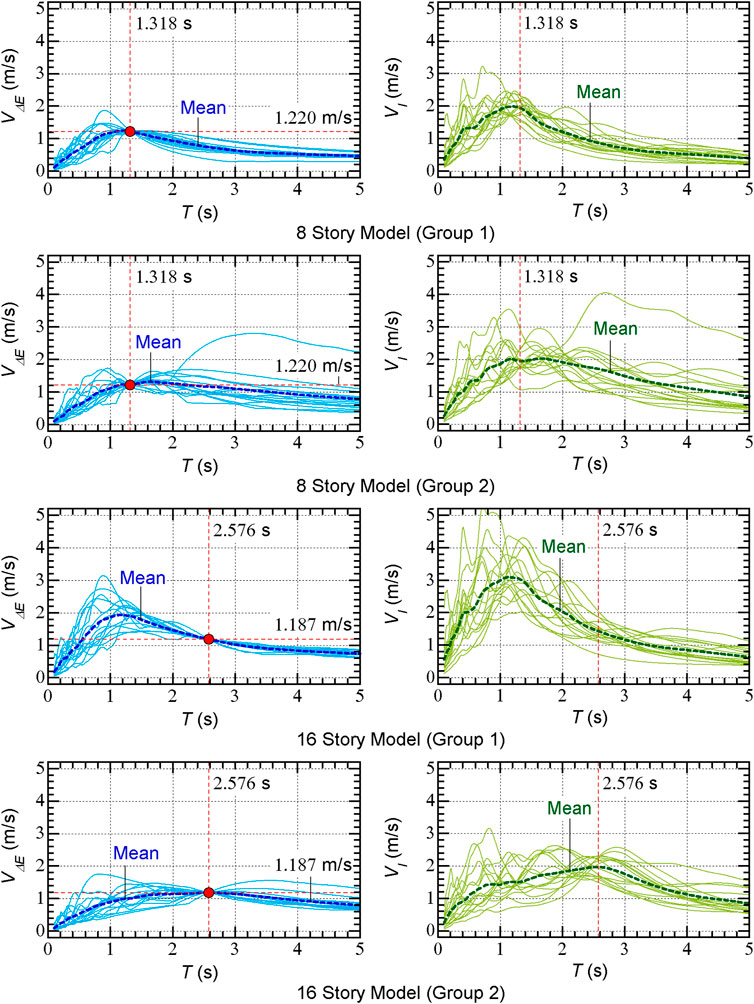
FIGURE 4. Maximum momentary input energy spectra and total input energy spectra of scaled ground motion sets.
4 Analysis results
4.1 Peak response
In the following discussion, the peak response obtained from the pushover analysis results corresponding to the target
Figure 5 compares the predicted peak responses of the 8-story model and the NTHA results; the following local response quantities are compared: (i) the peak relative displacement, (ii) the peak story drift, (iii) the peak plastic rotation at the beam end at the right of column X2 (
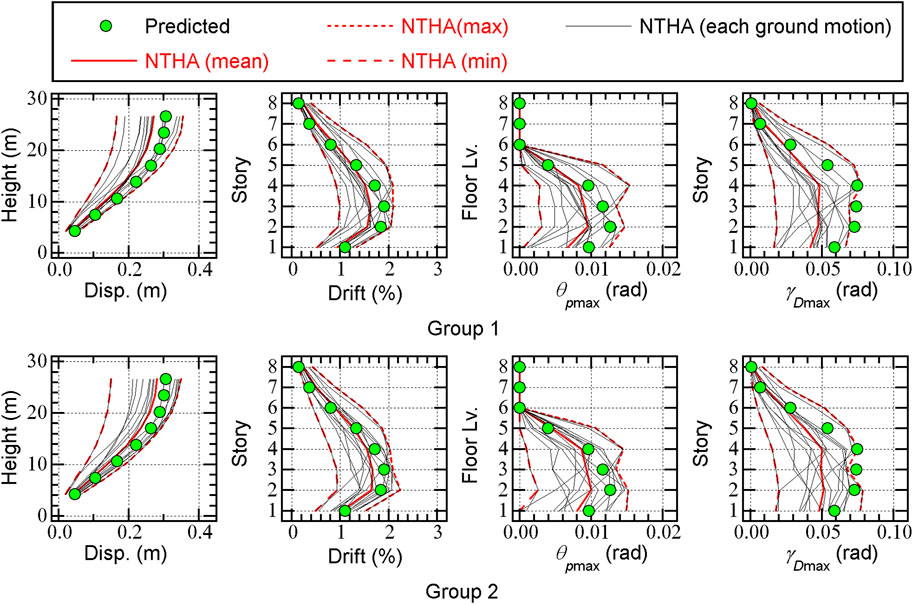
FIGURE 5. Comparisons of peak response of 8-story model.
The following conclusions can be drawn from Figure 5.
The predicted peak relative displacement is between the mean and maximum of the NTHA results at all floors.
The predicted peak story is close to the mean of the NTHA results. Around the second to fourth stories, the predicted peak story drift is larger than the mean of the NTHA results.
The predicted
The precicted
The trends in group 1 for all local response quantities shown in Figure 5 are similar to those in group 2. Therefore, the influence of the pulse period of the ground motion to the peak response of 8-story model is limited.
Figure 6 compares the predicted peak responses of the 16-story model to the NTHA results. The following conclusions can be drawn from Figure 6.
The predicted peak relative displacement is between the mean and maximum of the NTHA results at all floors.
The predicted peak story is larger than the mean of the NTHA results below the mid-story level (7th or 8th story). However, the predicted peak story drift above this level is smaller than that of the mean of the NTHA results.
The predicted
The precicted
The trends in group 1 in the peak story drift,
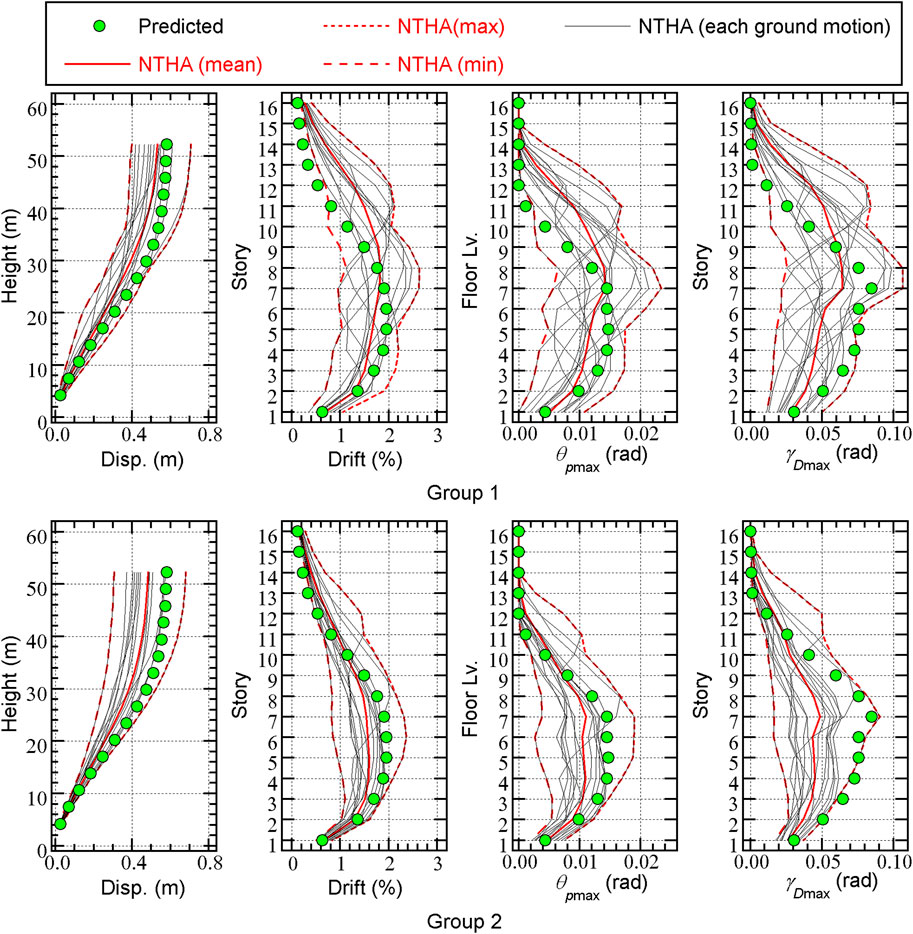
FIGURE 6. Comparisons of peak response of 16-story model.
4.2 Cumulative response
Figure 7 shows comparisons of the predicted total input energy per unit mass obtained from the NTHA results. All response quantities have been normalized by the total mass
For the 8-story model, the predicted total input energy is conservative compared with the NTHA results. The mean of the predicted/NTHA ratio is 1.366 for group 1, and 1.469 for group 2.
For the 16-story model, the predicted total input energy is significantly unconservative compared with the NTHA results for group 1: the mean of the predicted/NTHA ratio is 0.661. However, for group 2, the predicted total input energy is conservative compared with the NTHA results: the mean of the predicted/NTHA ratio is 1.523.
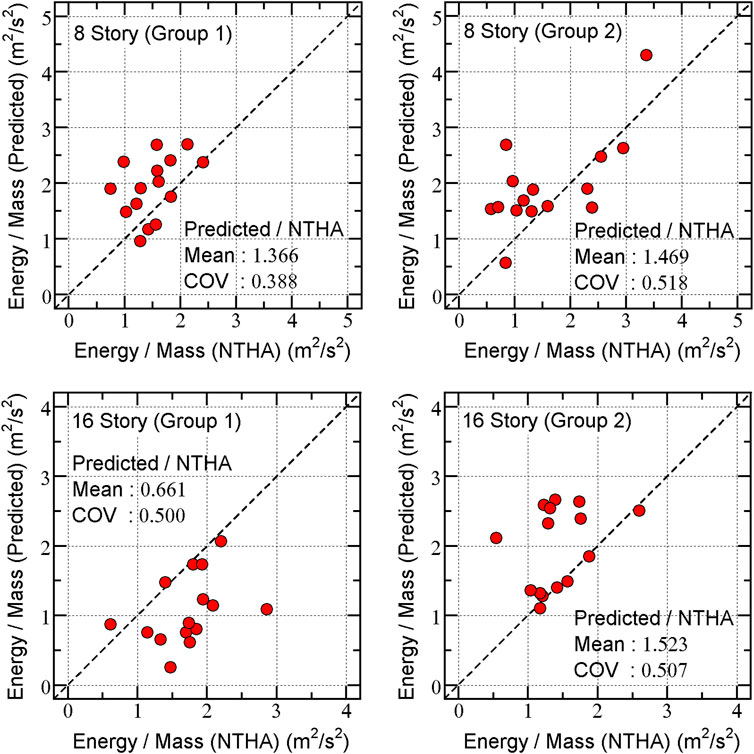
FIGURE 7. Relationships between predicted total input energy per unit mass and that obtained from NTHA.
The reasons for having unconservative predicted total input energy for the 16-story model in group 1 would be (i) the contribution of a higher modal response is large, and (ii) the cumulative energy input of the first modal response at the end of the seismic event cannot satisfactorily predicted using the equivalent linear system. These reasons will be discussed below.
4.3 Summary of analysis results
This section demonstrates the accuracy of the prediction procedure proposed in a previous study (Fujii and Shioda, 2023) for the two pulse-like ground motion groups. The analysis results can be summarized as follows.
For the 8-story model, the accuracy of the predicted peak response is acceptable both in group 1 and group 2. The predicted total input energy is conservative compared with the NTHA results.
For the 16-story model, the accuracy of the predicted peak relative displacement is acceptable. However, the other local response quantities (peak story drift, peak plastic rotation at the beam end, peak shear strain of damper panel) are unconservative in the upper stories, while those in the lower stories are conservative. The accuracy of the total input energy depends on the ground motion group.
Importantly, differences in the accuracy of each analysis case may occur owing to the pulse period of the ground motions. As noted in Section 3.2, the
5 Discussion
This section focuses on (i) the accuracy of the predicted peak equivalent displacement of the first modal response, (ii) the contribution of the first modal response to the cumulative energy input, and (iii) the accuracy of the predicted cumulative input energy of the first modal response. The equivalent velocities of the maximum momentary input energy and cumulative energy (
5.1 Accuracy of predicted peak equivalent displacement of first modal response
Figure 8 shows the comparisons between the capacity curve and the
Most NTHA results are slightly above and very close to the capacity curve.
The predicted peak response point gives a conservative
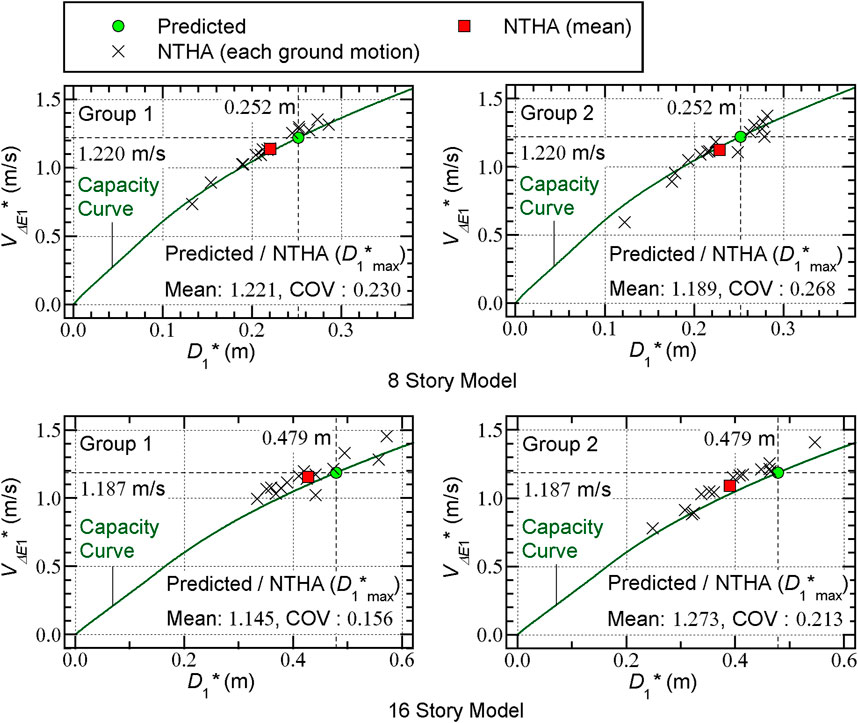
FIGURE 8. Comparisons between capacity curve and VΔE1* – D1*max relationship obtained from NTHA results.
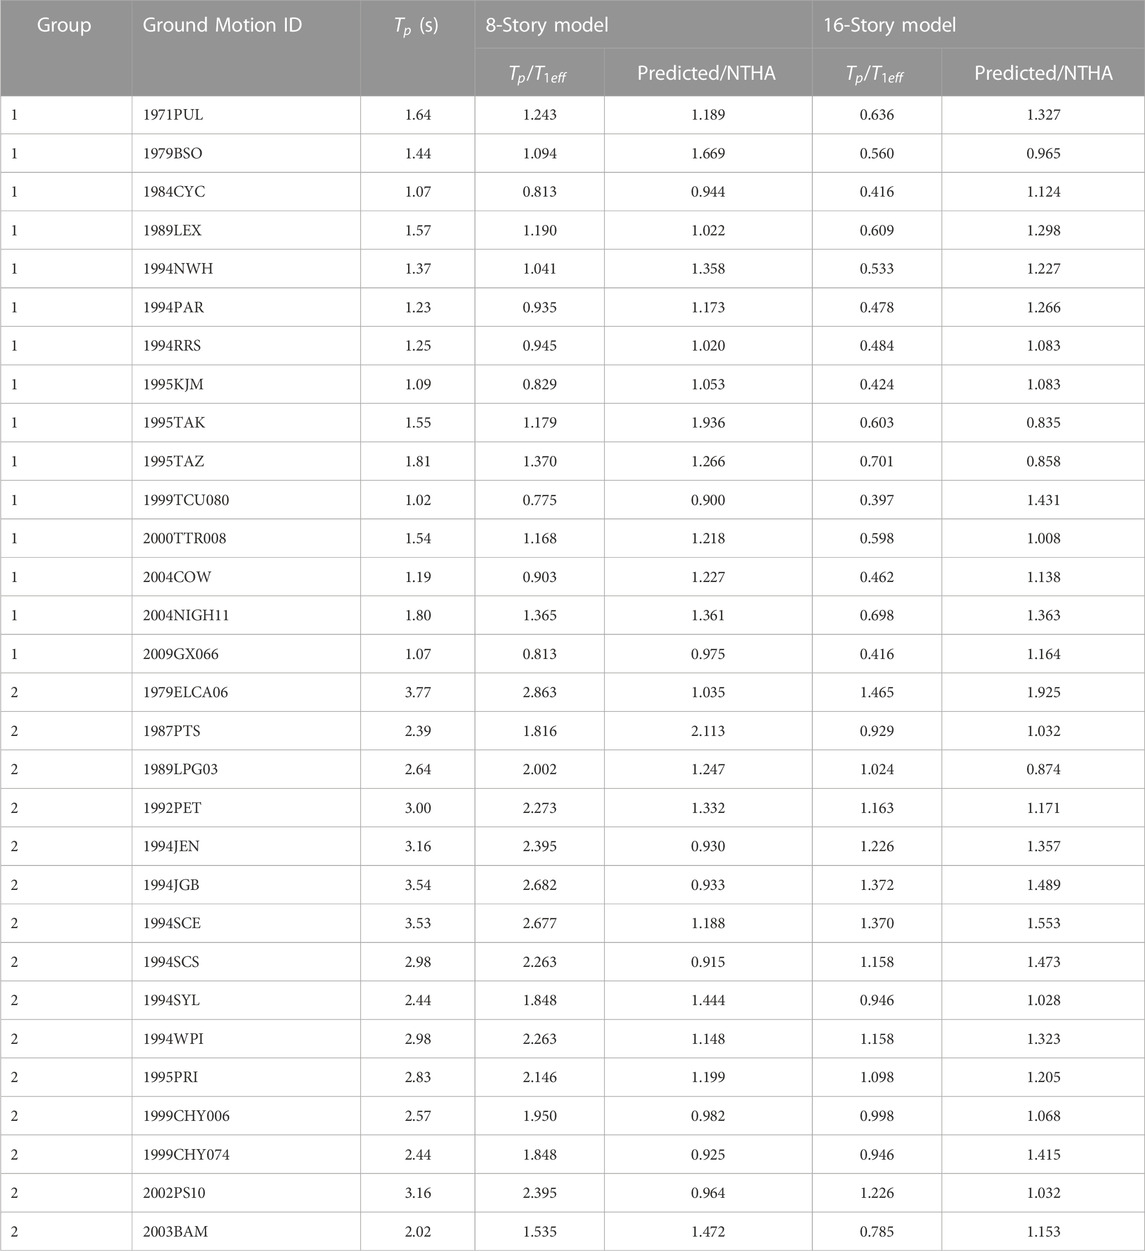
TABLE 3. The
Therefore, as far as
5.2 Contribution of first modal response to cumulative energy input
In the prediction procedure, the contribution of the higher modal response to the total input energy is approximated by assuming the following relationship.
Eq. 14 suggests that the total input energy
Figure 9 shows the relationship between the cumulative input energy of the first modal response (
For the 8-story model, most plots are distributed between
For the 16-story model, the difference between the results for groups 1 and 2 is obvious. For group 1, most plots are distributed below the dotted line
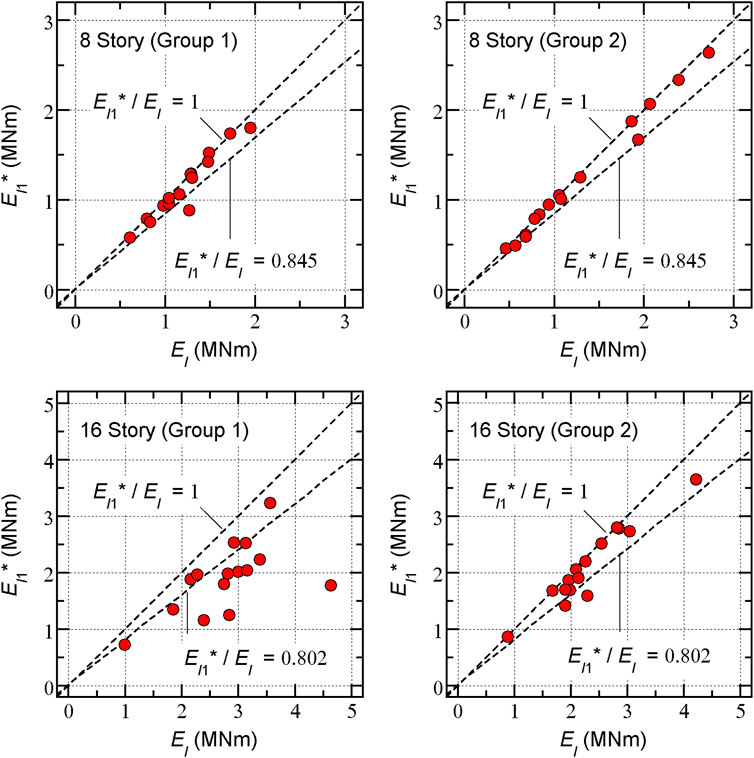
FIGURE 9. Relationships between cumulative input energy of first modal response (EI1*) and total input energy (EI).
The trends shown in Figure 9 are consistent with the results shown in Figure 7. Thus, one of the reasons for the predicted
5.3 Accuracy of predicted cumulative input energy of first modal response
Next, the accuracy of the predicted
For the 8-story model, the predicted
For the 16-story model, the difference in the accuracy of the predicted
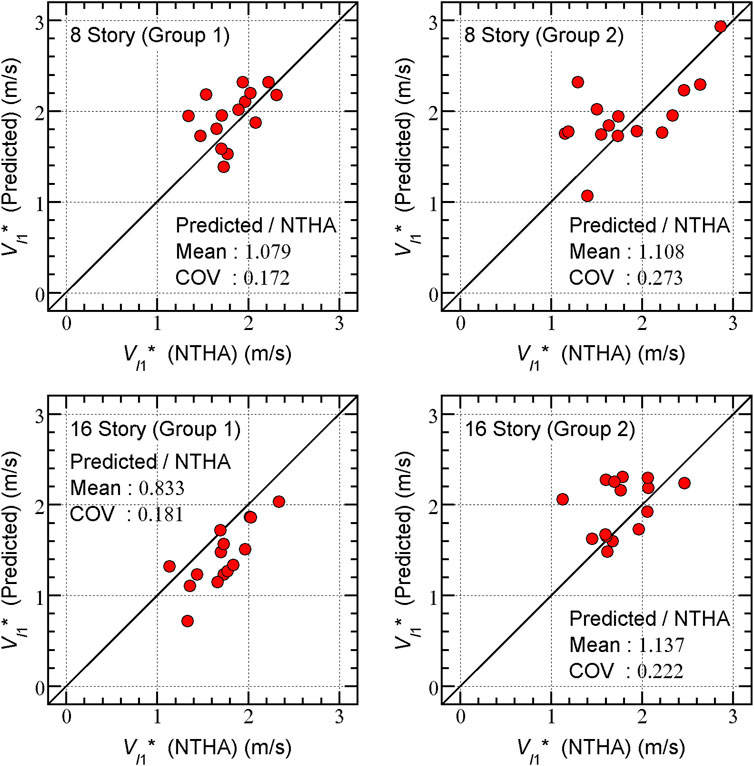
FIGURE 10. Relationships between predicted VI1* and that obtained from NTHA.
Therefore, another reason for the predicted
For the 8-story model, the time-history of
For the 16-story model, however, the time-history of
In contrast, the time-history of
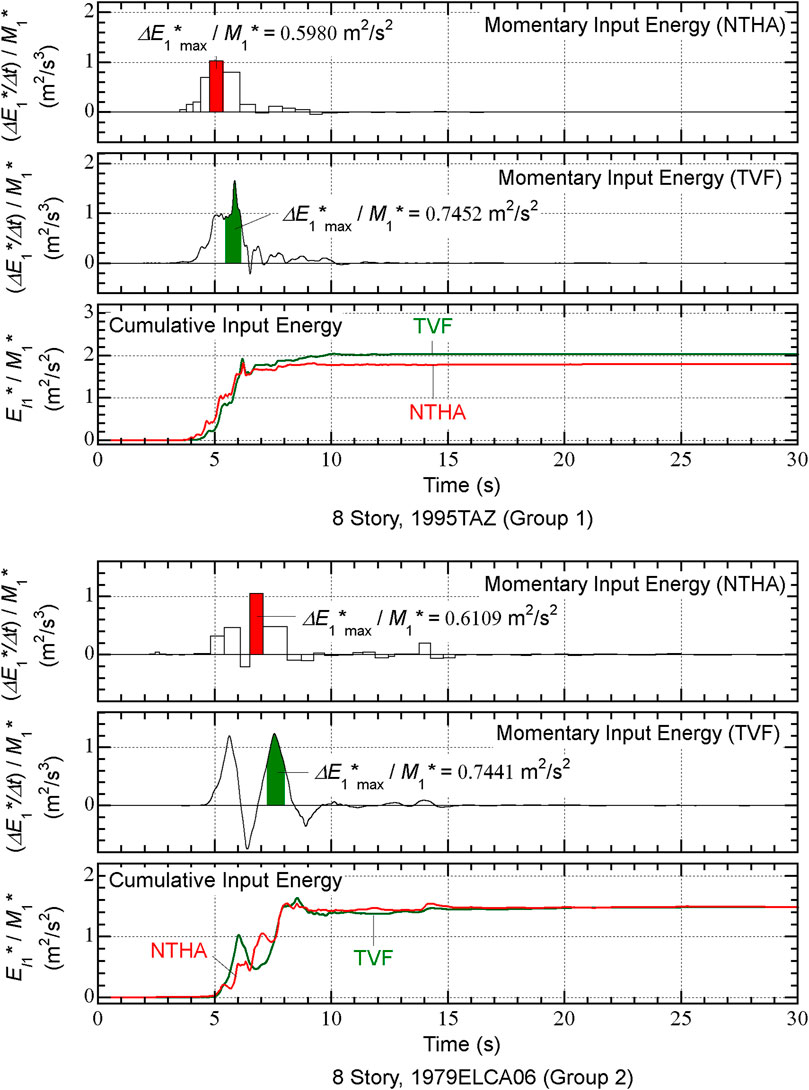
FIGURE 11. Comparisons between time-history of momentary input energy and cumulative input energy (8-story model).
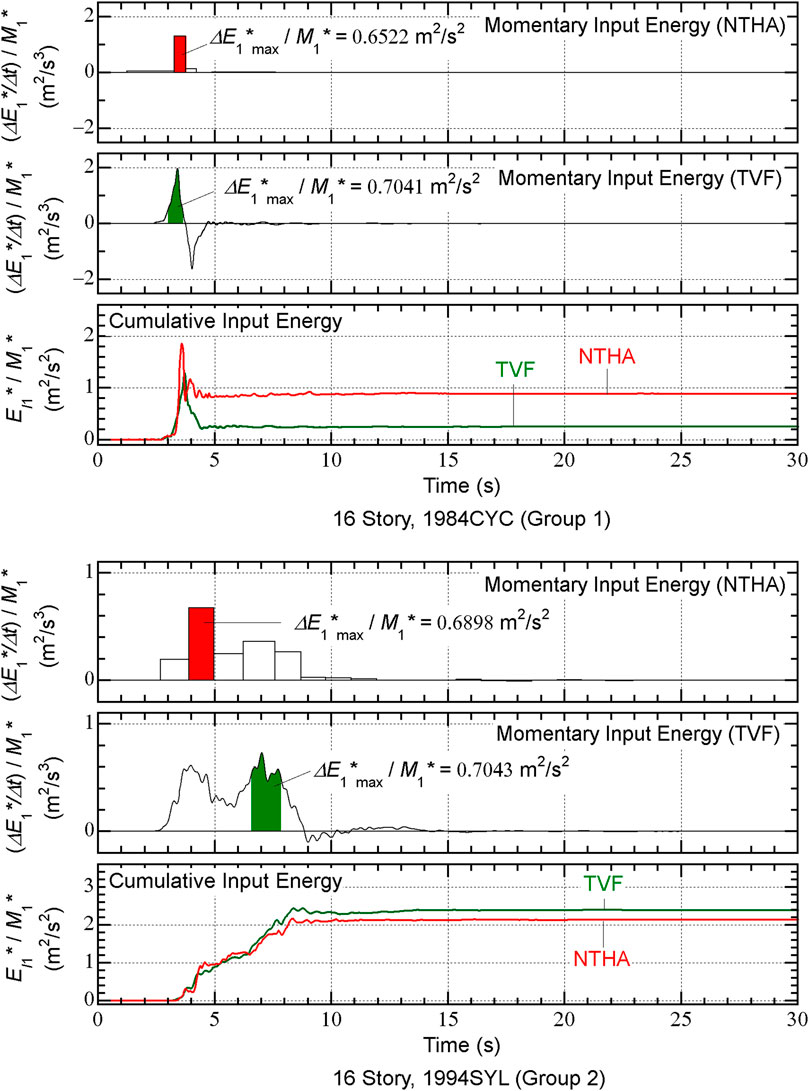
FIGURE 12. Comparisons between time-history of momentary input energy and cumulative input energy (16-story model).
Therefore, the reason for the
5.4 Summary of discussion
The above discussion can be summarized as follows.
As far as
The underestimation of
6 Conclusion
In this study, the accuracy of the energy-based prediction procedure for an RC building with SDCs, which has been proposed in a previous paper by the author (Fujii and Shioda, 2023), was investigated with consideration to pulse-like ground motions. The nonlinear response of 8- and 16-story RC MRFs with SDCs was analyzed using 30 pulse-like ground motion records. The main results and conclusions can be summarized as follows.
The accuracy of the predicted peak response is acceptable for the pulse-like ground motion records of the 8-story model investigated in this study, which agrees with the results of a previous study by the author. The predicted peak local responses (relative displacement, peak story drift, peak plastic rotation at the beam end, peak shear strain of damper panel) are in good agreement with those obtained from the NTHA results.
The predicted peak relative displacement of the 16-story model is also in good agreement with that obtained from the NTHA results. However, for the 16-story model, the other local response quantities (peak story drift, peak plastic rotation at the beam end, peak shear strain of damper panel) are unconservative in the upper stories and conservative in the lower stories. This tendency is significant when the ratio of the pulse period (
The accuracy of the predicted total input energy (
The underestimation of
Notably, the current version of this procedure is reliable when considering low-rise to mid-rise regular buildings. For the 8-story building model considered in this study, this procedure may be reliable in the case of pulse-like ground motions and non-pulse-like ground motions, as shown in a previous study by the author (Fujii and Shioda, 2023). However, for high-rise buildings, such as the16-story building considered in this study, the predicted local responses should be carefully assessed for the following reasons: (i) owing to the influence of higher modal responses, the distribution of local responses may be significantly different compared with that of the predicted responses; (ii) in the case of pulse-like ground motions with a short pulse period, the total input energy may be underestimated. Therefore, the following questions remain unanswered, although the list below is not comprehensive.
What is the criterion of applicability for the current procedure in the case of pulse-like ground motions? Based on the results obtained by this study, the
How can we improve the accuracy of predicting
Data availability statement
The raw data supporting the conclusion of this article will be made available by the authors, without undue reservation.
Author contributions
The author confirms being the sole contributor of this work and has approved it for publication.
Funding
This study received financial support from JFE Civil Engineering and Construction Corp.
Acknowledgments
The original frame model data used in this study were provided by Momoka Shioda, who is a former graduate student of Chiba Institute of Technology. The ground motions used in this study were obtained from the website of the Pacific Earthquake Engineering Research Center (https://ngawest2.berkeley.edu/, accessed on 24 February 2023). We thank Edanz (https://jp.edanz.com/ac) for editing a draft of this manuscript.
Conflict of interest
The author declares that the research was conducted in the absence of any commercial or financial relationships that could be construed as a potential conflict of interest.
Publisher’s note
All claims expressed in this article are solely those of the authors and do not necessarily represent those of their affiliated organizations, or those of the publisher, the editors and the reviewers. Any product that may be evaluated in this article, or claim that may be made by its manufacturer, is not guaranteed or endorsed by the publisher.
Abbreviations
COV, covariance; MRF, moment-resisting frame; NTHA, nonlinear time-history analysis; RC, reinforced concrete; SDC, steel damper column; TVF, time-varying function; VMD, variational modal decomposition.
References
Akiyama, H. (1985). Earthquake resistant limit-state design for buildings. Tokyo, Japan: University of Tokyo Press.
Akkar, S., Yazgan, U., and Gülkan, P. (2005). Drift estimates in frame buildings subjected to near-fault ground motions. J. Struct. Eng. ASCE 131, 1014–1024. doi:10.1061/(asce)0733-9445(2005)131:7(1014)
Al Shawa, O., Angelucci, G., Mollaioli, F., and Quaranta, G. (2020). Quantification of energy-related parameters for near-fault pulse-like seismic ground motions. Appl. Sci. 10, 7578. doi:10.3390/app10217578
Alavi, B., and Krawinkler, H. (2004). Behavior of moment-resisting frame structures subjected to near-fault ground motions. Earthq. Eng. Struct. Dyn. 33, 687–706. doi:10.1002/eqe.369
Alavi, B., and Krawinkler, H. (January 2000). “Consideration of near-fault ground motion effects is seismic design,” in Proceedings of the 13th world conference on earthquake engineering Auckland, New Zealand
Alhan, C., and Öncü-Davas, S. (2016). Performance limits of seismically isolated buildings under near-field earthquakes. Eng. Struct. 116, 83–94. doi:10.1016/j.engstruct.2016.02.043
Alonso-Rodríguez, A., and Miranda, E. (2015). Assessment of building behavior under near-fault pulse-like ground motions through simplified models. Soil Dyn. Earthq. Eng. 79A, 47–58. doi:10.1016/j.soildyn.2015.08.009
Arias, A. (1970). “A measure of earthquake intensity,” in Seismic design for nuclear power plants. Editors R. J. Hansen, and Massachusetts, USA: The MIT Press, 438–483.
Baker, J. W. (2007). Quantitative classification of near-fault ground motions using wavelet analysis. Bull. Seismol. Soc. Am. 97 (5), 1486–1501. doi:10.1785/0120060255
Bray, J. D., and Rodriguez-Marek, A. (2004). Characterization of forward-directivity ground motions in the near-fault region. Soil Dyn. Earthq. Eng. 24, 815–828. doi:10.1016/j.soildyn.2004.05.001
Feng, J., Zhao, B., and Zhao, T. (2021). Quantitative identification of near-fault pulse-like ground motions based on variational mode decomposition technique. Soil Dyn. Earthq. Eng. 151, 107009. doi:10.1016/j.soildyn.2021.107009
Fujii, K. (2022). Influence of the angle of seismic incidence of long-period pulse-like ground motion on an irregular base-isolated building. Front. Built Environ. 8, 1034166. doi:10.3389/fbuil.2022.1034166
Fujii, K., Kanno, H., and Nishida, T. (2019). Formulation of the time-varying function of momentary energy input to a SDOF system by Fourier series. J. Jpn. Assoc. Earthq. Eng. 19, 247–255. doi:10.5610/jaee.19.5_247
Fujii, K., and Miyagawa, K. (June 2018). Nonlinear seismic response of a seven-story steel reinforced concrete condominium retrofitted with low-yield-strength-steel damper columns. Proceeding of the. 16th Eur. Conf. Earthq. Eng. Thessalon. Thessaloniki, Greece
Fujii, K. (2022). Peak and cumulative response of reinforced concrete frames with steel damper columns under seismic sequences. Buildings 12, 275. doi:10.3390/buildings12030275
Fujii, K., and Shioda, M. (2023). Energy-based prediction of the peak and cumulative response of a reinforced concrete building with steel damper columns. Buildings 13, 401. doi:10.3390/buildings13020401
Ghahari, S. F., Jahankhah, H., and Ghannad, M. A. (2010). Study on elastic response of structures to near-fault ground motions through record decomposition. Soil Dyn. Earthq. Eng. 30, 536–546. doi:10.1016/j.soildyn.2010.01.009
Ghanbari, B., and Fathi, M. (2022). Extraction of velocity pulses of pulse-like ground motions using empirical Fourier decomposition. J. Seismol. 26, 967–986. doi:10.1007/s10950-022-10106-8
Güneş, N., and Ulucan, Z. Ç. (2019). Nonlinear dynamic response of a tall building to near-fault pulse-like ground motions. Bull. Earthq. Eng. 17, 2989–3013. doi:10.1007/s10518-019-00570-y
Hall, J. F., Heaton, T. H., Halling, M. W., and Wald, D. J. (1995). Near-source ground motion and its effects on flexible buildings. Earthq. Spectra 11 (4), 569–605. doi:10.1193/1.1585828
He, W. L., and Agrawal, A. K. (2008). Analytical model of ground motion pulses for the design and assessment of seismic protective systems. J. Struct. Eng. ASCE 134 (7), 1177–1188. doi:10.1061/(asce)0733-9445(2008)134:7(1177)
Hori, N., and Inoue, N. (2002). Damaging properties of ground motions and prediction of maximum response of structures based on momentary energy response. Earthq. Eng. Struct. Dyn. 31, 1657–1679. doi:10.1002/eqe.183
Huang, C. T. (2003). Considerations of multimode structural response for near-field earthquakes. J. Eng. Mech. ASCE 129 (4), 458–467. doi:10.1061/(asce)0733-9399(2003)129:4(458)
Kalkan, E., and Kunnath, S. K. (2006). Effects of fling step and forward directivity on seismic response of buildings. Earthq. Spectra 22 (2), 367–390. doi:10.1193/1.2192560
Kalkan, E., and Kwong, N. S. (2013). Pros and cons of rotating ground motion records to fault-normal/parallel directions for response history analysis of buildings. J. Struct. Eng. (N. Y. N. Y). 140 (3), 1–14. doi:10.1061/(asce)st.1943-541x.0000845
Kojima, K., and Takewaki, I. (2015a). Critical earthquake response of elastic–plastic structures under near-fault ground motions (Part 1: Fling-step input). Front. Built Environ. 1, 12. doi:10.3389/fbuil.2015.00012
Kojima, K., and Takewaki, I. (2015b). Critical earthquake response of elastic–plastic structures under near-fault ground motions (Part 2: Forward-directivity input). Front. Built Environ. 1, 13. doi:10.3389/fbuil.2015.00013
Mavroeidis, G. P., Dong, G., and Papageorgiou, A. S. (2004). Near-fault ground motions, and the response of elastic and inelastic single-degree-of-freedom (SDOF) systems. Earthq. Eng. Struct. Dyn. 33, 1023–1049. doi:10.1002/eqe.391
Mavroeidis, G. P., and Papageorgiou, A. S. (2003). A mathematical representation of near-fault ground motions. Bull. Seismol. Soc. Am. 93 (3), 1099–1131. doi:10.1785/0120020100
Mota-Páez, S., Escolano-Margarit, D., and Benavent-Climent, A. (2021). Seismic response of RC frames with a soft first story retrofitted with hysteretic dampers under near-fault earthquakes. Appl. Sci. 11, 1290. doi:10.3390/app11031290
Quaranta, G., and Mollaioli, F. (2019). Analysis of near-fault pulse-like seismic signals through Variational Mode Decomposition technique. Eng. Struct. 193, 121–135. doi:10.1016/j.engstruct.2019.05.003
Shahi, S. K., Jack, W., and Baker, J. W. (2014). An efficient algorithm to identify strong-velocity pulses in multicomponent ground motions. Bull. Seismol. Soc. Am. 104 (5), 2456–2466. doi:10.1785/0120130191
Somerville, P. G., Smith, M. F., Graves, R. W., and Abrahamson, N. A. (1997). Modification of empirical strong ground motion attenuation relations to include the amplitude and duration effects of rupture directivity. Seismol. Res. Lett. 68 (1), 199–222. doi:10.1785/gssrl.68.1.199
Sugino, M., Tanaka, K., and Hayashi, Y. (September 2021). “Proposal of simplified characterization method of pulse-like ground motions,” in Proceedings of the 17th world conference on earthquake engineering (sendai). Sendai, Japan
Xu, Z., Agrawal, A. K., He, W. L., and Tan, P. (2007). Performance of passive energy dissipation systems during near-field ground motion type pulses. Eng. Struct. 29, 224–236. doi:10.1016/j.engstruct.2006.04.020
Yalcin, O. F., and Dicleli, M. (2020). Effect of the high frequency components of near-fault ground motions on the response of linear and nonlinear SDOF systems: A moving average filtering approach. Soil Dyn. Earthq. Eng. 129, 105922. doi:10.1016/j.soildyn.2019.105922
Keywords: reinforced concrete building, steel damper column (SDC), pulse-like ground motion, energy input, pushover analysis
Citation: Fujii K (2023) Energy-based response prediction of reinforced concrete buildings with steel damper columns under pulse-like ground motions. Front. Built Environ. 9:1219740. doi: 10.3389/fbuil.2023.1219740
Received: 09 May 2023; Accepted: 16 June 2023;
Published: 27 June 2023.
Edited by:
Fabrizio Mollaioli, Sapienza University of Rome, ItalyReviewed by:
Giuseppe Quaranta, Sapienza University of Rome, ItalyOnur Merter, İzmir University of Economics, Türkiye
Copyright © 2023 Fujii. This is an open-access article distributed under the terms of the Creative Commons Attribution License (CC BY). The use, distribution or reproduction in other forums is permitted, provided the original author(s) and the copyright owner(s) are credited and that the original publication in this journal is cited, in accordance with accepted academic practice. No use, distribution or reproduction is permitted which does not comply with these terms.
*Correspondence: Kenji Fujii, a2VuamkuZnVqaWlAcC5jaGliYWtvdWRhaS5qcA==