 Chamroeun Se
 Thanapong Champahom
 Wimon Laphrom1
 Sajjakaj Jomnonkwao
 Vatanavongs Ratanavaraha
- 1Institute of Research and Development, Suranaree University of Technology, Nakhon Ratchasima, Thailand
- 2Department of Management, Faculty of Business Administration, Rajamangala University of Technology Isan, Nakhon Ratchasima, Thailand
- 3School of Transportation Engineering, Institute of Engineering, Suranaree University of Technology, Nakhon Ratchasima, Thailand
Introduction: This research aims to identify and understand the risk factors associated with injury severities in accidents occurring at highway–rail grade crossings in the context of the developing country, Thailand.
Method: The mixed logit model was employed by analyzing crash data over 10 years, from 2012 to 2022.
Results: The analysis revealed a number of significant factors associated with severe or fatal crashes. These included accidents that occurred between midnight and 6 a.m., collisions involving pickup cars or heavy trucks, roads with a “no overtaking zone” sign, intersections classified as Type B1 (defined by the presence of only warning posts and horizontal crossing barriers), and intersections without adequate traffic control devices. In contrast, hazard markers on pavements and traverse rumble strips were positively correlated with property damage only crashes, where no injuries were reported.
Discussion: This study provides insights into contributory factors to accidents at highway–rail grade crossing. Based on these key findings, the study recommends increasing nighttime visibility at railway grade crossings, developing targeted education and training programs for pickup car and truck drivers, installing hazard markers and traverse rumble strips, and considering physical barriers, such as bollards or delineators, to discourage overtaking maneuvers near the railway crossing.
1 Introduction
A public highway–rail grade crossing (HRGC), also known as a level crossing, is an intersection where a road or highway and a railroad meet on equal ground. This design permits the crossing of vehicles and trains. These crossings have been designed specifically to facilitate the safe passage of vehicles over railroad tracks. To enhance safety, public HRGCs are typically equipped with warning signs, pavement markings, and, in some cases, traffic control devices, such as flashing lights, gates, and bells. These safety measures are intended to alert drivers to approaching trains, ensuring they arrive at a complete stop and yield the right-of-way before proceeding across the tracks. However, it is essential to note that many of these safety traffic control devices are absent in developing nations, posing a significant safety risk (Tjahjono et al., 2019).
While numerous developed nations have made substantial advancements in reducing road traffic fatalities in recent years, the progress remains highly variable on a global scale. The risk of road traffic fatalities is significantly elevated in low- and middle-income countries, with an average rate of 27.5 per 100,000 population, in contrast to high-income countries, where the average rate stands at 8.3 per 100,000 population (WHO, 2018). Thailand, classified as a middle-income and developing nation, grapples with considerable economic and emotional burdens attributable to road accidents, characterized by a death rate of 32.8 per 100,000 population (WHO, 2018). According to data from the Department of Highways (DOH) in 2004, the total costs associated with traffic accidents in Thailand amounted to 153,755 million baht (approximately 3,460 million USD). Notably, the total costs related to highway-rail grade crossing (HRGC) accidents for the year 2004 were 2,482 million baht, which increased to 4,344 million baht (approximately US$140 million) due to economic growth, representing roughly 0.4 percent of Thailand’s GDP in 2011 (Settasuwacha et al., 2012). This is primarily attributed to the human toll resulting from fatalities and severe injuries. Consequently, it is crucial to identify and comprehend the risk factors associated with fatal and severe crashes, with the aim of devising effective policies and implementation strategies to mitigate these incidents.
Accidents at HRGCs in Thailand have become a significant safety issue, resulting in a considerable number of crashes and deaths over time (Settasuwacha et al., 2012). Several factors are responsible for these accidents, such as insufficient warning systems, driver irresponsibility, visibility issues, train speed, and a lack of education and awareness about the problem. Although HRGC accidents constitute a relatively minor percentage of total accidents compared with other types of collisions, the severe outcomes typically associated with train involvement often command considerable public concern and media coverage.
Investigating the risk factors that affect the severity of crash injuries in public HRGC is vital to devise successful strategies to reduce fatalities and injuries at these sites. The risk analysis associated with the severity of collision injuries on HRGCs may be more nuanced than on conventional roads. This complexity arises from the intricate relationships between road users and the distinct environment of the highway–railroad intersection.
2 Literature review
Several past studies have investigated the factors contributing to HRGC accidents. For instance, Yan et al. (2010) conducted an analysis using Federal Railroad Administration HRGC crash data spanning from 1980 to 2005. Their study compared the annual crash rate before and after installing stop signs at passive crossings, revealing that such installations significantly decreased the annual crash rates. Eluru et al. (2012) used a latent segmentation-based ordered logit model to examine the elements that influence the severity of injuries drivers sustain in vehicle-train collisions at United States HRGCs. They found that the severity of the injury was affected by several key factors, such as the timing of the accident, the driver’s age, weather conditions (e.g., snow or rain), the vehicle’s participation in the crash, and the driver’s actions leading up to the collision.
Meanwhile, Hao and Daniel (2013) analyzed HRGC crashes in the United States from 1997 to 2006, using a conventional ordered probit model. Their findings revealed that adverse weather conditions, reasonably favorable visibility conditions, vehicle speeds over 50 miles per hour (mph), and train speeds exceeding 50 mph at the time of collision were associated with an increased probability of injury or death. Moreover, Hao and Daniel (2014) used an ordered probit model to identify risk factors contributing to injury severity at railroad grade crossings, taking active controls (gates and flashing lights) and passive controls (cross bucks and stop signs) into account. Using crash data from the United States Federal Railway Administration, they identified a number of significant factors that affected the severity of driver injuries at both active and passive highway–rail crossings. These factors included time (rush hour), visibility, vehicle speed, train speed, driver age, area type, traffic volume, and road surface conditions.
Liu et al. (2015) compared the safety outcomes of crashes at HRGCs with passive controls (e.g., Crossbucks and Stop signs) and those with active controls (e.g., flashing lights, gates, audible warnings, and highway signals). Their study found that drivers are more likely to stop at crossings with gates, flashing lights, and audible warnings, leading to less serious injuries. Fan et al. (2015) employed a multinomial logit model to discern crucial factors that influence variations in injury severity, and to investigate the influence of these explanatory variables on three different levels of severity of vehicle-related accidents that occur at HRGCs in the United States. Their findings revealed that when high-speed rail equipment collided with a vehicle, the probability of a fatal outcome increased significantly. Additionally, their analysis indicated that pickup trucks and surfaces made of concrete or rubber were more prone to involvement in more severe accidents. In yet another study, Hao et al. (2015) employed an ordered probit model to explore the variables that influence driver injury severity at HRGCs, considering variations in age and gender among United States motor vehicle drivers. Their findings indicated that older drivers are more likely to sustain fatal injuries when driving passively in open areas, particularly in adverse weather conditions. Conversely, they found that younger male drivers were more susceptible to severe injuries during peak traffic hours while driving at high speeds, and at unpaved HRGCs with passive control.
In Hao et al. (2016a) study, ordered probit models were employed to investigate the factors that influence the severity of injuries among motor vehicle drivers involved in HRGC accidents, specifically focusing on differentiating between time-of-day effects. The findings reveal that the severity of injury among motor vehicle drivers is significantly increased during the a.m. peak, p.m. peak, and p.m. off-peak periods compared with other time intervals. On a different note, Ghomi et al. (2016) employed ordered probit models, association rules, and classification and regression tree algorithms to highlight the primary factors related to injury severity for vulnerable road users in accidents at HRGCs in the United States. Their study found that train speed significantly influences injury severity, and older road users have a higher probability of fatal accidents than their younger counterparts. In a different context, Laapotti (2016) examined fatal HRGC accidents in Finland spanning from 1991 to 2011 and highlighted the effectiveness of active warning devices in reducing fatal crashes. Hao et al. (2016c) assessed the severity of driver injuries sustained in truck accidents at HRGCs in the United States. According to their analysis, specific characteristics of truck driver behavior, including driving under the influence of fatigue during peak hours, emerged as statistically significant predictors of increased injury severity. Wang et al. (2016) used geographically weighted regression to study injuries from rail-trespassing crashes along United States railway tracks. They discovered that people lying or sleeping on or near the tracks were more likely to sustain injuries. Meanwhile, Kang and Khattak (2017) investigated the severity of crashes reported at HRGCs by employing suitable data clustering techniques to account for the unobserved heterogeneity. Their findings underscored a significant correlation between higher train speeds and increased severity of injuries in train-vehicle collisions.
Using the mixed logit model analysis, Mannering et al. (2016) conducted a study to investigate the determinants of driver-injury severity at HRGCs in the United States, considering the presence or absence of aggressive driving behaviors. Younger male drivers who exhibit aggressive driving behaviors are more likely to sustain severe injuries, particularly during peak hours, especially in the morning peak (6–9 a.m.), and in open space areas. Khan and Khattak (2018) used the mixed logit model to identify factors contributing to the severity of injuries sustained by truck and truck-trailer drivers involved in United States crashes. They found higher train speeds, drivers ignoring crossing gates, older driver age, crashes in rural areas, situations where the train hit the truck/truck-trailer, and crashes at crossings with a crossing angle of 60–90° all correlated with more severe injuries. Zhao and Khattak (2018) used a binary logit model of random parameters to study the impact of driver inattention on injury severity in crashes near HRGCs in Nebraska, United States. According to their research, distracted driving causes more severe injuries than attentive driving. In two-vehicle collisions where at least one driver was not paying attention, the likelihood of at least one driver being injured increased by 14.6%.
In their study using latent class clustering, Zhao et al. (2019) used latent class clustering to investigate factors associated with the severity of pedestrian injuries in train-pedestrian collisions at HRGCs, using United States Federal Railroad Administration data. Their research showed that variables such as freight train involvement, direct impact between the train and the pedestrian, the lack of flashing lights and warnings at crossings, rural locations, lower visibility conditions, and older pedestrians all increase the severity of pedestrian injuries. Tjahjono et al. (2019) examined road-railway level crossing crashes in Indonesia between 2013 and 2016, using a traditional ordered logit modeling framework. Their analysis revealed associations between fatal crashes and male drivers, rainy weather, and low traffic volume conditions. Using the mixed logit modeling framework, Khales et al. (2020) analyzed 10 years of crash data, spanning from 2008 to 2017, involving HRGCs in the United States. The results revealed that the crash-contributing factors differed between crossings equipped with active and passive warning devices. In a more recent study, Ahmed et al. (2023) applied a random parameter model, considering variations in means and variances, to identify contributing factors to the severity of injuries in accidents at HRGCs. They found that crashes on main tracks had a higher likelihood of injury and death compared to those on tracks on the yard, siding, or industry. Furthermore, obstructed views of the rail track for drivers were associated with a higher chance of fatalities.
2.1 Methods in highway–rail grade crossing crash injury severity studies
A variety of methodological frameworks have been used in previous studies, including the ordered probit model (Hao and Daniel, 2013; Ghomi et al., 2016), ordered logit model (Tjahjono et al., 2019), geographically weighted regression (Wang et al., 2016), latent class clustering model (Zhao et al., 2019), latent segmentation-based ordered logit (Eluru et al., 2012), mixed binary logit model (Zhao and Khattak, 2018), mixed multinomial logit model (Khan and Khattak, 2018; Khales et al., 2020) unobserved heterogeneity in the means and variance model (Ahmed et al., 2023). The complexities inherent in investigating the severity of injuries in empirical studies make it impossible for researchers to consider every possible crash-related factor that could impact injury outcomes (Mannering et al., 2016). These variables may encompass gender-based physiological differences, the physical characteristics of occupants of different age groups, variations in the influence of passengers on the vehicle, disparities in road conditions, specific vehicle characteristics, and even climatic and environmental factors. Collectively, these less accessible elements are known as unobserved characteristics or unobserved heterogeneities. To achieve unbiased, reliable, and consistent estimates (Mannering and Bhat, 2014), we must address these factors with care. A portion of the cited literature has utilized latent class models and mixed (random parameters) models to account for the effects of unobserved factors in statistical analysis to tackle this issue. Among these studies, only Ahmed et al. (2023) made a concerted effort to capture multilayered unobserved heterogeneity by allowing for potential interaction effects between the means and variances of random parameters and other factors (an approach pioneered by Seraneeprakarn et al. (2017) in studies of crash severity). Besides, HRGC crashes, the mixed logit model with heterogeneous means and variances has been used in a number of studies examining injury severity in various crash types (Se et al., 2022b; Hou et al., 2022; Islam et al., 2023; Se et al., 2023a; Song et al., 2023; Yan et al., 2023). Given the empirical support for the efficacy of this methodology, the mixed logit model, which allows for potential heterogeneity in means and variances, is selected as the framework for modeling injury severity within the context of HRGC crashes.
2.2 Research gap and objective
Although there is existing literature on HRGC crashes, it is essential to note that most of these studies have focused primarily on crash injury severity in developed nations, notably the United States. However, there is a notable research gap in examining the influence of contributing factors on crash severity, especially in developing countries like Thailand. Consequently, there is a pressing need for further research to bridge this geographical bias and improve our understanding of the severity of collisions at the HRGC. The main objective of this study is to evaluate the risk factors associated with the severity of crashes at intersections of HRGC in Thailand, offering two significant contributions. First, it seeks to identify the risk factors that influence the severity of collision injury at these crossings and, subsequently, generate targeted policy recommendations based on these findings. Second, it contributes to the recent literature by employing advanced unobserved heterogeneity, specifically the mixed logit model with heterogeneity in means and variances, a state-of-the-art approach to modeling the severity of crash injuries, to minimize statistical bias resulting from unseen or unobserved factors (Ahmed et al., 2023; Champahom et al., 2023; Se et al., 2021b; Se et al., 2022a; Yan et al., 2022b).
3 Material and method
3.1 Data collection
In this study, the database sourced from the State Railway of Thailand, under the Ministry of Transport (MOT, 2022), offers comprehensive data on HRGC accidents nationwide. This secondary data set includes various crucial factors, including the severity of injuries sustained in accidents, the time of the incidents, the types of vehicles involved, the number of rail tracks, the categorization of areas, vehicle lane counts, the variations in rail sleepers, types of installed traffic signals, prevailing visibility conditions, types of control devices in place and types of railway intersections. This research is based on accident records that span a decade, covering the period 2012 to 2022.
The injury severity classification for each individual involved in a crash is based on a three-point ordinal scale: code 0 = property damage only (PDO) or no injury crash, code 1 = severe/serious injury crash, and code 2 = fatal crash. This injury severity classification aligns with the one used in previous research by Eluru et al. (2012), Hao et al. (2016a), and Hao and Daniel (2014). In the final data sample, the distribution of the severity of the crash injury is as follows: PDO is 15.6%, injury is 47.1%, and fatal injury at 37.3%. Table 1 summarizes the characteristics of the samples utilized in this empirical study. Importantly, the explanatory variables listed in Table 1 are the only information that can be extracted from the primary data source supplied by the State Railway of Thailand. The data sources did not record certain potentially crucial factors, such as train speed, road speed, driver characteristics, and specific crash characteristics. Regarding the data structure, all of the explanatory variables included in the analysis are represented by the binary digits 0 and 1. For example, in the case of the motorcycle indicator, a code of one signifies HRGC crashes involving a motorcycle user, while zero denotes the absence of a motorcycle in the incident. This type of data structure is commonly used in previous studies investigating the severity of crash injuries, regardless of the type of crash (Alogaili and Mannering, 2022; Islam, 2022; Yan et al., 2022b).
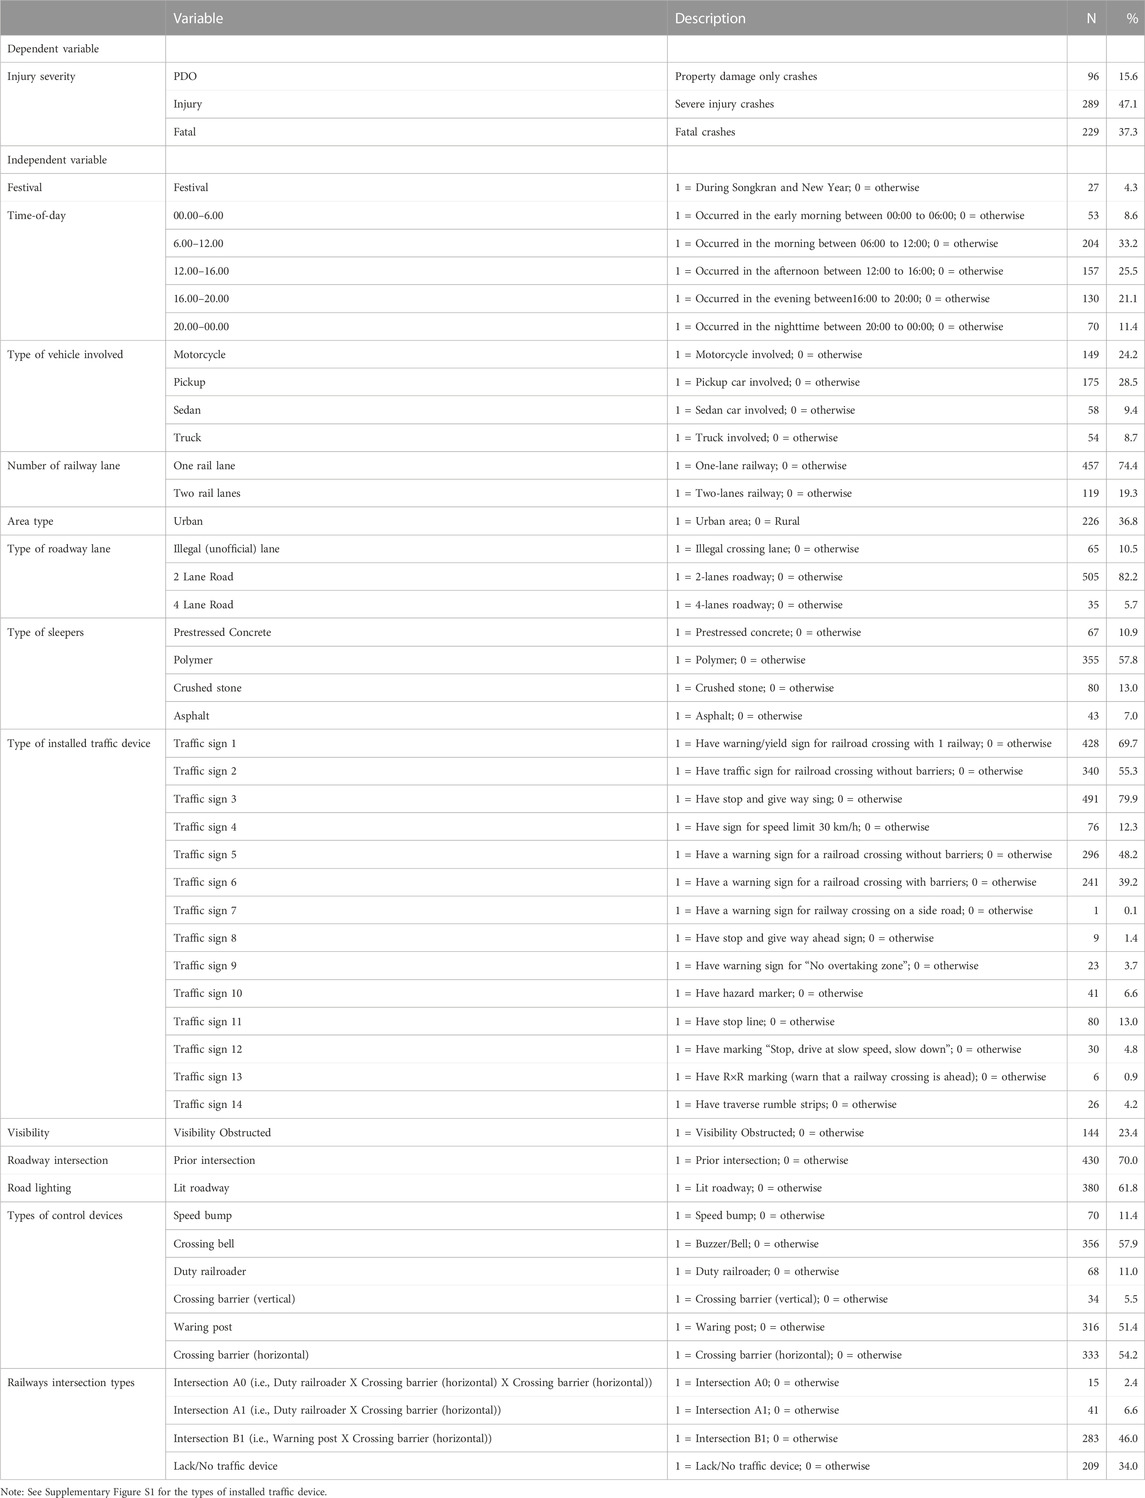
TABLE 1. Descriptive statistics of explanatory variables and severities of the injuries.
From the descriptive statistics (Table 1), in terms of the time of day, we observe that the majority of the crashes occurred from 06:00 to 12:00 (33%), followed by the period from 12:00 to 16:00 (25%), and then from 16:00 to 20:00 (21%). When examining the types of vehicles involved, Table 1 reveals that pickup trucks were involved in 28% of the accidents as the secondary party, while motorcycles were involved in 24% of the accidents. Furthermore, a considerable proportion of crashes (82%) occurred on two-lane roadways at the rail crossing. Crashes caused by obstructed visibility comprised 23% of the crashes, while 61.8% occurred on roads with good lighting. Most of the rail crossings where accidents occurred had a crossing bell (58%), a warning post (51.4%), and a crossing barrier (54%). Among the types of rail intersections, crashes were observed most frequently at B1-type intersections (46%).
3.2 Mixed logit model with heterogeneity in means and variances
Recognizing the significance of unseen influences from unobserved factors (i.e., unobserved heterogeneity), this study employs the mixed logit model with means and variances to investigate the factors influencing the severity of crash injuries at HRGCs in Thailand. This method has recently gained traction due to its increased adaptability to capture a wider range of unobserved characteristics, improved prediction accuracy, and superior model fitting (Hou et al., 2022). Initially, the study begins by defining the injury severity function for crash k that sustains injury severity j, as follows (Washington et al., 2020; Se et al., 2023b):
where
where all terms are previously defined,
From this equation,
In the context of this methodological framework, the null hypothesis H0 posits that there is no significant relationship between the independent variable(s) and the probability of the outcome. The model was computed using a simulated maximum likelihood with 1,000 Halton draws during the estimation phase to reject or accept the null hypothesis. This quantity of draws has been deemed sufficient to ensure reliable and consistent statistical parameter estimations, as evidenced by previous studies (Alogaili and Mannering, 2022; Seraneeprakarn et al., 2017).
To interpret the model’s results more straightforwardly, average marginal effects were calculated across all crash observations. These measurements denote the impact of a single unit change in a specific explanatory variable on the probability of a certain outcome in injury severity. In this research, only binary variables were used, which means that the marginal effect embodies the change in probability when the binary indicator changes from 0 to 1 while keeping other aspects of the factor constant. To compute the average marginal effect across the sample observations, the following formula is employed (Song et al., 2021; Hou et al., 2022):
In this equation,
4 Model evaluation and validation
All coefficients of the explanatory variables were allowed to vary across the crash population during estimation. Following this step, only two variables exhibited significant random parameters: “Traffic sign 1” and “Lack/no traffic device.” Both variables exhibited substantial standard deviations, indicating significant varying effects across the crash population. Among the distributions considered for random parameters, the normal distribution was determined to provide the optimal statistical fit, outperforming the triangular, uniform, and lognormal distributions. A likelihood ratio test was conducted to determine whether these two variables should be included in the model as random parameters to determine if their inclusion would lead to a significantly improved model fit compared to a fixed-effect model. The test is conducted as follows (Washington et al., 2020):
Table 2 presents a statistical fit comparison between fixed- and random-effect models, employing the likelihood ratio test, ρ2, and the Akaike Information Criterion (AIC) (Se et al., 2021a). As shown in Table 2, using “traffic sign 1” and “Lack/no traffic device” as random parameters produces a higher ρ2 and a lower AIC value, indicating a better goodness of fit compared to using them as fixed parameters. The ρ2 value of 0.182 in the random parameter model falls within an acceptable range, consistent with previous studies on the severity of crash injuries (Alnawmasi and Mannering, 2019; Alogaili and Mannering, 2022). Furthermore, the likelihood ratio test results demonstrated that the random parameter models for both factors were statistically superior to the fixed-effect models with a confidence level exceeding 98%. In summary, incorporating random parameters can significantly improve statistical fit, consistent with the findings of previous studies (Ahmed et al., 2023; Khales et al., 2020; Khan and Khattak, 2018).
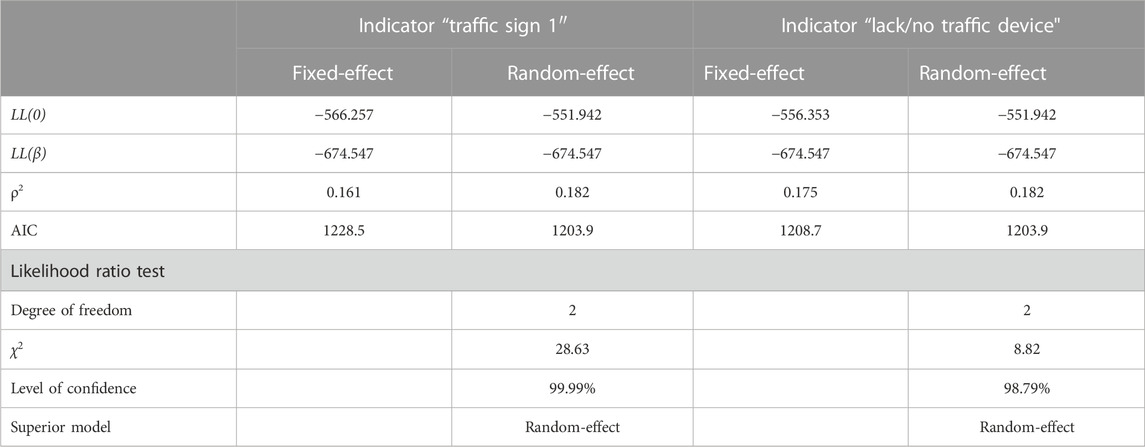
TABLE 2. Statistical fit statistic and likelihood ratio test for model superiority comparison between fixed-effect model and random-effect model.
After identifying the random parameters, the study investigated whether other fixed parameters affected their distribution, including their mean and variance. After conducting individual tests for each parameter, the study did not identify any significant heterogeneity in the means or variances of these parameters. Consequently, the model estimation reverted to the standard mixed logit model.
5 Results and discussion
The results of the mixed logit estimate are detailed in Table 3. Regarding temporal characteristics, the results of the coefficient estimation in Table 3 indicate that accidents at HRGCs occurring between midnight and 6 a.m. are more likely to result in severe injuries. Furthermore, crashes between 6 a.m. and midday also positively correlated with PDO crashes. These findings align with logical explanations. During these hours, reduced visibility due to darkness can pose challenges to drivers and train operators in detecting obstacles and responding promptly. In addition, drivers may experience increased fatigue during the late night and early morning hours, potentially altering their reaction times and decision-making abilities. Another contributing factor could be the reduced traffic volume during these times, leading to higher vehicle speeds and a false sense of security among drivers, thus increasing the likelihood of serious accidents. According to previous studies, accidents on railway tracks at night or in darkness tend to result in more severe injuries (Eluru et al., 2012; Hao and Daniel, 2014).
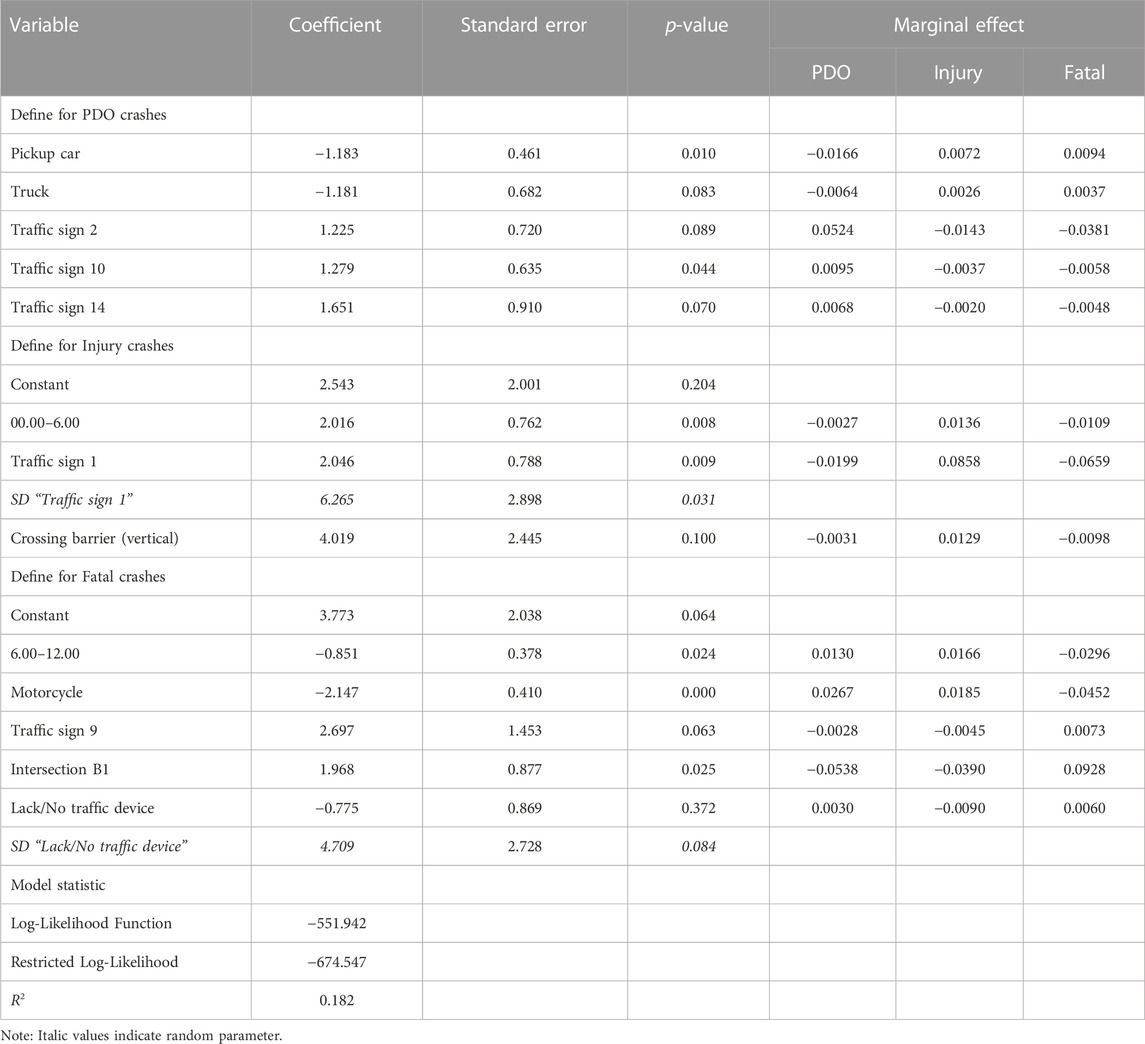
TABLE 3. Mixed logit model result of the severity of HRGC accident injuries in Thailand.
Our findings indicate that accidents at HRGCs involving pickup trucks and heavy trucks are significantly more likely to result in severe injuries and fatalities. Previous studies also observed a similar trend with pickup truck crashes (Fan et al., 2015); however, heavy truck crashes were less likely to result in fatalities (Yan et al., 2010; Hao and Daniel, 2014; Hao et al., 2016b). This could be because pickup trucks and heavy trucks are generally larger and heavier than passenger cars. In collisions with trains, the size and mass of these vehicles can cause more significant damage and a greater risk of severe injuries or fatalities. In addition, passenger cars often have safety features and designs that better protect occupants in collisions. On the contrary, pickup trucks and large trucks may have fewer safety features and less effective crash protection, making their occupants more vulnerable. In the event of a collision, cargo carried by large trucks may shift or spill, resulting in more severe consequences. Typically, larger and heavier vehicles require a greater distance to come to a complete stop. If a vehicle cannot stop in time at a railroad crossing, the collision with a train is more likely to be severe.
Severe injuries and PDO crashes were positively correlated with crashes involving motorcycles as the secondary party. This finding differs somewhat from previous research, such as the 2014 study by Hao and Daniel (2014) in the United States, which found that motorcycle collisions at railroad crossings were more likely to result in severe or fatal accidents. The distinct sociocultural and contextual factors surrounding motorcycle use in Thailand versus the United States may account for this disparity. In the United States, motorcycles are frequently used for recreational purposes, and riders frequently operate motorcycles with larger engines. These powerful motorcycles can attain higher speeds and their riders may be more inclined to ride at substantial velocities, potentially resulting in more severe accidents in railway crossing collisions. On the contrary, in Thailand, motorcycles serve as versatile and ubiquitous modes of transportation for a wide range of daily activities. They are commonly used for family runs, commuting to work or school, and navigating congested urban areas. In addition, many motorcycles in Thailand are equipped with smaller engines, which tend to have lower maximum speeds than their larger engine counterparts. These contextual differences likely influence variations in accident outcomes in motorcycle usage patterns and vehicle specifications. To illustrate the disparity in motorcycle-involved collisions, it is necessary to consider the frequency of these incidents in each setting. In the United States, motorcycle-related accidents at railway crossings account for less than 0.5% of the total number of railway crossing accidents, as reported by Hao and Daniel (2014). In contrast, the prevalence of motorcycle-related railway crossing accidents in Thailand is significantly higher, accounting for a substantial 24.2% of all railway crossing collisions. Consequently, the disparity in motorcycle-involved collisions at railroad crossings between the two nations highlights the importance of considering local contextual factors and usage patterns when interpreting crash data. It also highlights the need for tailored safety measures and interventions in each region to address motorcycle use’s unique characteristics and risks at railway crossings.
Although factors such as the number of railway lanes, the type of area, and the lanes of the roadway were not significantly associated with the severity of the accident injuries, several variables within the group of traffic signs were found to significantly influence the severity of the crash outcomes. Specifically, railway crossings with traffic sign 2 (sign indicating railroad crossing without barriers), traffic sign 10 (hazard marker), and traffic sign 14 (Traverse rumble strips) (see Supplementary Figure S1), were found to be significantly and positively associated with PDO accidents. However, traffic sign 1 (warning for a single-track railroad crossing) was determined to be a random parameter for injury crashes. The normal distribution of this random parameter (mean = 2.046 and standard deviation = 6.265) revealed that 63% of the collisions at intersections with traffic sign 1 were more likely to result in injury collisions, while 37% were more likely to result in fatal injury crashes. Conversely, railway crossings equipped with traffic sign 9, denoting a no-passing zone, were positively associated with fatal injury crashes. When we investigate the dynamics of these crossings, a plausible explanation emerges for this seemingly counterintuitive result. Traffic sign 9 is typically installed at railway crossings in areas with high-speed traffic and frequent overtaking maneuvers. This signage serves as a regulatory measure aimed at improving safety by prohibiting overtaking near the crossing, where doing so could significantly increase the risk of collisions with oncoming trains. However, the mere presence of traffic sign 9 may not be sufficient to effectively deter drivers from overtaking or force them to reduce their speed when approaching the railway crossing. Given these complexities, the positive association between traffic signal nine and fatal injury crashes underscores the need for a multifaceted approach to railway crossing safety.
In terms of types of traffic control, the results showed that railway crossings with vertical moving barriers were positively associated with injury crashes. Furthermore, intersection type B (intersections equipped only with a warning post and a horizontal crossing barrier) was statistically and positively associated with fatal accidents. A variable representing railroad crossings without traffic control devices generated a significant random parameter with a mean of −0.775 and a standard deviation of 4,709. Further interpretation of these distributions reveals that 57% of crashes at these locations were more likely to result in injuries or PDO crashes, whereas 43% of crashes at railroad crossings without traffic control devices are positively associated with fatal injuries. A possible explanation is that railroad crossings lacking traffic control devices frequently lack visual or audible signals to warn drivers and pedestrians of an approaching train. Without warning signals or gates, drivers and pedestrians often have insufficient time to react and safely clear the tracks when a train approaches. Additionally, the absence of traffic control devices may result in risky behavior, such as attempting to outrun an approaching train, underestimating the train’s speed, or disregarding safety precautions. When a collision occurs, these behaviors can have disastrous effects. This finding highlights the critical significance of traffic control devices, such as warning signals, gates, and flashing lights, in reducing the severity of accidents at railroad crossings.
6 Recommendations and implications
The results of the model employed in this study highlight critical factors that impact the severity of driver injuries at HRGCs in Thailand. These insights are invaluable in suggesting potential strategies for accident prevention and injury reduction. The following section elaborates on potential countermeasures and interventions.
Concerning the time of day, the coefficient of the result indicated that crashes occurring between midnight and 6 a.m. were more likely to result in severe injuries. A possible recommendation is to improve visibility at railway grade crossings during night by installing efficient lighting systems. This measure could alert drivers to the presence of crossings and improve their ability to spot approaching trains.
Regarding vehicle types, pickup cars and truck drivers were found to have a higher risk of fatal injuries at railway grade crossings. A potential recommendation is to develop specific education and training programs specifically for truck and pickup drivers, focusing on safety measures and best practices at HRGCs. This could involve raising awareness of associated risks, underlining the importance of stopping and looking for oncoming trains, and providing guidance on safe maneuvering techniques.
Taking into account the association between traffic signs and crash severity, the study found that the presence of hazard markers and rumble strips is positively correlated with PDO crashes, and the probability of fatal outcomes decreases. Therefore, a possible recommendation is to ensure the placement of hazard markers, such as reflectors or delineators, in suitable locations near railway grade crossings. These markers improve visibility and provide clear signals of the presence of a crossing, reducing the likelihood of fatal and injury-related crashes. They could be installed on roads edges, medians, or other strategic locations to effectively alert drivers. In addition, it is recommended to install traverse rumble strips leading to railway grade crossings. These textured or elevated strips on the road generate vibrations and auditory warnings when vehicles approach them, prompting drivers to slow down and exercise caution. This can help decrease the vehicle’s speed when approaching the crossing and lower the probability of accidents. Furthermore, it is suggested to collaborate with relevant transportation agencies to develop guidelines and standards for installing and maintaining hazard markers and traversing rumble strips at railway grade crossings. This would encourage a uniform implementation across different regions and ensure adherence to safety regulations.
Concerning crossings located in areas prone to vehicle overtaking, it is recommended that, along with the “no overtaking zone” sign (traffic sign 9), additional warning signs be installed at the railway crossing. These may include signs that indicate an upcoming railway crossing, emphasizing the need to slow down, exercise caution, and resist oncoming trains. Consideration should also be given to installing physical barriers, such as bollards or delineators, to dissuade drivers from undertaking overtaking maneuvers near the railway crossing. Such barriers can establish both a visual and a physical deterrent that discourages overtaking and urges drivers to maintain safe speeds and position on the road.
Regarding other traffic control devices, crossing intersections equipped only with warning posts or horizontal barriers and those lacking traffic control devices were positively associated with a higher risk of fatal accidents. As a remedy, it is recommended to reassess intersections that currently only employ warning posts or cross horizontal barriers and consider the installation of traffic signals. Traffic signals can effectively regulate vehicle flow and provide clear directions on right-of-way, thus reducing the risk of collisions and improving safety for all road users. In situations where traffic signals may not be necessary, implementing stop signs at intersections should be considered. Stop signs control vehicular movement by forcing drivers to stop completely and yield the right-of-way to the train, consequently improving safety and reducing the risk of serious accidents. Finally, it may also be crucial to conduct safety audits at intersections lacking traffic control devices, to identify potential hazards, and propose suitable safety measures. Safety audits can evaluate sightlines, traffic volumes, and crash history to decide on the most suitable traffic control devices or engineering improvements for each intersection.
7 Conclusion
This research explores risk factors related to the severity of injuries sustained in crashes at railway grade crossings in Thailand. Using a decade’s worth of crash data, from 2012 to 2022, this study sought to identify key risk factors. For this purpose, a random parameter model was utilized, taking into account potential heterogeneity in means and variances. This modeling technique enables the integration of unobserved characteristics into the analysis. The study evaluated three levels of injury severity: PDO, injury, and fatal. A variety of potential risk factors were considered, including the time of the accident, the type of vehicle involved, the number of rail lanes, the type of area, the number of vehicle lanes, the type of railway sleepers, the types of traffic signals installed, visibility conditions, control device types, and types of railway intersections.
The analysis of marginal effects has revealed several factors strongly associated with severe or fatal crashes. These factors include accidents that occur between midnight and 6 a.m., the involvement of pickup trucks or cars, the presence of traffic sign 9 (indicating a no overtaking zone), Intersection Type B1 (featuring warning posts and horizontal crossing barriers), and intersections lacking traffic control devices. On the contrary, factors positively correlated with PDO crashes (no injury) including the presence of traffic sign 2 (indicating a railroad crossing without barriers), traffic sign 10 (signifying hazard markers), and traffic sign 14 (indicating traverse rumble strips). In particular, a new finding in this study is that the effects of pickup cars, trucks, motorcycles, and the traffic sign for a “no overtaking zone” yielded contradictory results compared to previous studies. This discrepancy can be attributed to sociocultural and contextual factors that influence crash characteristics in developing countries such as Thailand as opposed to developed nations such as the United States.
In summary, this study looks at the factors contributing to the severity of driver injuries in accidents at railway grade crossings and discusses potential recommendations to improve traffic safety at HRGCs. The findings offer valuable information for transportation engineers addressing safety concerns at these crossings.
As with any study, there are limitations to this paper. First, the available data for this study lack crucial variables that may influence crash severity outcomes, such as driver characteristics, varying train speeds, varying road speeds, and others. Therefore, relevant authorities should make greater efforts to collect more exhaustive and detailed datasets to facilitate more comprehensive studies. Second, recording specific crash locations would be advantageous for conducting network analysis and creating geographical maps that define risks and safety, thereby enhancing the depth of research in this field.
Data availability statement
The raw data supporting the conclusion of this article will be made available by the authors, without undue reservation.
Author contributions
CS: Conceptualization, Data curation, Methodology, Writing–original draft. TC: Data curation, Methodology, Writing–review and editing. WL: Conceptualization, Writing–review and editing. SJ: Funding acquisition, Project administration, Writing–review and editing. VR: Formal Analysis, Funding acquisition, Project administration, Writing–review and editing.
Funding
The authors declare financial support was received for the research, authorship, and/or publication of this article. This work was supported by Suranaree University of Technology (SUT), Thailand Science Research and Innovation (TSRI), and National Science, Research and Innovation Fund (NSRF) (Project code: 179274).
Conflict of interest
The authors declare that the research was conducted in the absence of any commercial or financial relationships that could be construed as a potential conflict of interest.
Publisher’s note
All claims expressed in this article are solely those of the authors and do not necessarily represent those of their affiliated organizations, or those of the publisher, the editors and the reviewers. Any product that may be evaluated in this article, or claim that may be made by its manufacturer, is not guaranteed or endorsed by the publisher.
Supplementary material
The Supplementary Material for this article can be found online at: https://www.frontiersin.org/articles/10.3389/fbuil.2023.1255762/full#supplementary-material
References
Ahmed, S S., Corman, F., and Anastasopoulos, P C. (2023). Accounting for unobserved heterogeneity and spatial instability in the analysis of crash injury-severity at highway-rail grade crossings: A random parameters with heterogeneity in the means and variances approach. Analytic Methods in Accident Research 37, 100250.
Alnawmasi, N., and Mannering, F. (2019). A statistical assessment of temporal instability in the factors determining motorcyclist injury severities. Anal Methods Accid Res 22, 100090.
Alogaili, A., and Mannering, F. (2022). Differences between day and night pedestrian-injury severities: accounting for temporal and unobserved effects in prediction. Anal Methods Accid Res 33, 100201.
Behnood, A., and Mannering, F. (2017). Determinants of bicyclist injury severities in bicycle-vehicle crashes: a random parameters approach with heterogeneity in means and variances. Anal Methods Accid Res 16, 35.
Champahom, T., Se, C., Jomnonkwao, S., Boonyoo, T., Leelamanothum, A., and Ratanavaraha, V. (2023). Temporal Instability of Motorcycle Crash Fatalities on Local Roadways: A Random Parameters Approach with Heterogeneity in Means and Variances. Int J Environ Res Public Health 20. Available at: https://www.scilit.net/article/edeecf9b5a3ae1679948b12c73c0442a.
Eluru, N., Bagheri, M., Miranda-Moreno, L. F., and Fu, L. (2012). A latent class modeling approach for identifying vehicle driver injury severity factors at highway-railway crossings. Accid. Anal. Prev. 47, 119–127. doi:10.1016/j.aap.2012.01.027
Fan, W., Kane, M. R., and Haile, E. (2015). Analyzing severity of vehicle crashes at highway-rail grade crossings: multinomial logit modeling. J. Transp. Res. Forum. doi:10.5399/osu/jtrf.54.2.4282
Ghomi, H., Bagheri, M., Fu, L., and Miranda-Moreno, L. F. (2016). Analyzing injury severity factors at highway railway grade crossing accidents involving vulnerable road users: a comparative study. Traf Inj. Prev. 17 (8), 833–841. doi:10.1080/15389588.2016.1151011
Hao, W., and Daniel, J. (2014). Motor vehicle driver injury severity study under various traffic control at highway-rail grade crossings in the United States. J. Saf. Res. 51, 41–48. doi:10.1016/j.jsr.2014.08.002
Hao, W., and Daniel, J. R. (2013). Severity of injuries to motor vehicle drivers at highway–rail grade crossings in the United States. Trans. Res. Rec. 2384 (1), 102–108. doi:10.3141/2384-12
Hao, W., Kamga, C., and Daniel, J. (2015). The effect of age and gender on motor vehicle driver injury severity at highway-rail grade crossings in the United States. J. Saf. Res. 55, 105–113. doi:10.1016/j.jsr.2015.08.006
Hao, W., Kamga, C., and Wan, D. (2016a). The effect of time of day on driver's injury severity at highway-rail grade crossings in the United States. J. Traf Trans. Eng. Engl. Ed. 3 (1), 37–50. doi:10.1016/j.jtte.2015.10.006
Hao, W., Kamga, C., and Wan, D. (2016b). The effect of time of day on driver's injury severity at highway-rail grade crossings in the United States. J. Traf Trans. Eng. Engl. Ed. 3 (1), 37–50. doi:10.1016/j.jtte.2015.10.006
Hao, W., Kamga, C., Yang, X., Ma, J., Thorson, E., Zhong, M., et al. (2016c). Driver injury severity study for truck involved accidents at highway-rail grade crossings in the United States. Trans Res Part F Traffic Psychol. Behav. 43, 379–386. doi:10.1016/j.trf.2016.09.001
Hensher, D. A., and Greene, W. H. (2003). The mixed logit model: the state of practice. Transportation 30 (2), 133–176. doi:10.1023/a:1022558715350
Hou, Q., Huo, X., Leng, J., and Mannering, F. (2022). A note on out-of-sample prediction, marginal effects computations, and temporal testing with random parameters crash-injury severity models. Anal. Methods Accid. Res. 33, 100191. doi:10.1016/j.amar.2021.100191
Islam, M., Alogaili, A., Mannering, F., and Maness, M. (2023). Evidence of sample selectivity in highway injury-severity models: the case of risky driving during COVID-19. Anal. Methods Accid. Res. 38, 100263. doi:10.1016/j.amar.2022.100263
Islam, M. (2022). An analysis of motorcyclists' injury severities in work-zone crashes with unobserved heterogeneity. IATSS Res. 46 (2), 281–289. doi:10.1016/j.iatssr.2022.01.003
Kang, Y., and Khattak, A. (2017). Cluster-based approach to analyzing crash injury severity at highway–rail grade crossings. Trans. Res. Rec. 2608 (1), 58–69. doi:10.3141/2608-07
Khales, S. D., Chien, S., Lee, J., and Dimitrijevic, B. (2020). Analysis of the effects of visibility and warning devices on driver injury severity at highway-rail grade crossings considering temporal transferability of data. Int. J. Inj. Control Saf. Promot 27 (2), 243–252. doi:10.1080/17457300.2020.1737139
Khan, W. A., and Khattak, A. J. (2018). Injury severity of truck drivers in crashes at highway-rail grade crossings in the United States. Transp. Res. Rec. 2672 (10), 38–47. doi:10.1177/0361198118781183
Laapotti, S. (2016). Comparison of fatal motor vehicle accidents at passive and active railway level crossings in Finland. IATSS Res. 40 (1), 1–6. doi:10.1016/j.iatssr.2015.12.003
Liu, J., Khattak, A. J., Richards, S. H., and Nambisan, S. (2015). What are the differences in driver injury outcomes at highway-rail grade crossings? Untangling the role of pre-crash behaviors. Accid. Anal. Prev. 85, 157–169. doi:10.1016/j.aap.2015.09.004
Mannering, F. L., and Bhat, C. R. (2014). Analytic methods in accident research: methodological frontier and future directions. Anal. methods Accid. Res. 1, 1–22. doi:10.1016/j.amar.2013.09.001
Mannering, F. L., Shankar, V., and Bhat, C. R. (2016). Unobserved heterogeneity and the statistical analysis of highway accident data. Anal. methods Accid. Res. 11, 1–16. doi:10.1016/j.amar.2016.04.001
Milton, J. C., Shankar, V. N., and Mannering, F. L. (2008). Highway accident severities and the mixed logit model: an exploratory empirical analysis. Accid. Anal. Prev. 40 (1), 260–266. doi:10.1016/j.aap.2007.06.006
MOT (2022). Highway-rail grade crossing crash data. Available at: https://datagov.mot.go.th/.
Se, C., Champahom, T., Jomnonkwao, S., Chaimuang, P., and Ratanavaraha, V. (2021a). Empirical comparison of the effects of urban and rural crashes on motorcyclist injury severities: a correlated random parameters ordered probit approach with heterogeneity in means. Accid. Anal. Prev. 161, 106352. doi:10.1016/j.aap.2021.106352
Se, C., Champahom, T., Jomnonkwao, S., Karoonsoontawong, A., and Ratanavaraha, V. (2021b). Temporal stability of factors influencing driver-injury severities in single-vehicle crashes: a correlated random parameters with heterogeneity in means and variances approach. Anal. Methods Accid. Res. 32, 100179. doi:10.1016/j.amar.2021.100179
Se, C., Champahom, T., Jomnonkwao, S., Kronprasert, N., and Ratanavaraha, V. (2022a). The impact of weekday, weekend, and holiday crashes on motorcyclist injury severities: accounting for temporal influence with unobserved effect and insights from out-of-sample prediction. Anal. Methods Accid. Res. 36, 100240. doi:10.1016/j.amar.2022.100240
Se, C., Champahom, T., Jomnonkwao, S., and Ratanavaraha, V. (2022b). Motorcyclist injury severity analysis: a comparison of Artificial Neural Networks and random parameter model with heterogeneity in means and variances. Int. J. Inj. Control Saf. Promot 2022b, 1–16. doi:10.1080/17457300.2022.2081985
Se, C., Champahom, T., Jomnonkwao, S., Wisutwattanasak, P., Laphrom, W., and Ratanavaraha, V. (2023a). Temporal instability and transferability analysis of daytime and nighttime motorcyclist-injury severities considering unobserved heterogeneity of data. Sustainability 15 (5), 4486. doi:10.3390/su15054486
Se, C., Champahom, T., Wisutwattanasak, P., Jomnonkwao, S., and Ratanavaraha, V. (2023b). Temporal instability and differences in injury severity between restrained and unrestrained drivers in speeding-related crashes. Sci. Rep. 13 (1), 9756. doi:10.1038/s41598-023-36906-7
Seraneeprakarn, P., Huang, S., Shankar, V., Mannering, F., Venkataraman, N., and Milton, J. (2017). Occupant injury severities in hybrid-vehicle involved crashes: a random parameters approach with heterogeneity in means and variances. Anal. Methods Accid. Res. 15, 41–55. doi:10.1016/j.amar.2017.05.003
Settasuwacha, D., Luathep, P., and Taneerananon, P. (2012). Highway-railway grade crossing accident cost in Thailand.
Song, D., Yang, X., Anastasopoulos, P. C., Zu, X., Yue, X., and Yang, Y. (2023). Temporal stability of the impact of factors determining drivers’ injury severities across traffic barrier crashes in mountainous regions. Anal. Methods Accid. Res. 39, 100282. doi:10.1016/j.amar.2023.100282
Song, L., Fan, W. D., and Li, Y. (2021). Time-of-day variations and the temporal instability of multi-vehicle crash injury severities under the influence of alcohol or drugs after the Great Recession. Anal. Methods Accid. Res. 32, 100183. doi:10.1016/j.amar.2021.100183
Tjahjono, T., Kusuma, A., Pratiwi, Y. Y., and Purnomo, R. Y. (2019). Identification determinant variables of the injury severity crashes at road-railway level crossing in Indonesia. Transp. Res. procedia 37, 211–218. doi:10.1016/j.trpro.2018.12.185
Wang, X., Liu, J., Khattak, A. J., and Clarke, D. (2016). Non-crossing rail-trespassing crashes in the past decade: a spatial approach to analyzing injury severity. Saf. Sci. 82, 44–55. doi:10.1016/j.ssci.2015.08.017
Washington, S., Karlaftis, M., Mannering, F., and Anastasopoulos, P. (2020). Statistical and econometric methods for transportation data analysis. United States: Chapman and Hall/CRC.
Yan, X., Han, L. D., Richards, S., and Millegan, H. (2010). Train–vehicle crash risk comparison between before and after stop signs installed at highway–rail grade crossings. Traf Inj. Prev. 11 (5), 535–542. doi:10.1080/15389588.2010.494314
Yan, X., He, J., Wu, G., Zhang, C., Liu, Z., and Wang, C. (2022a). Modeling the temporal relationship between contributing factors and injury severities in rural single-vehicle alcohol-impaired driving crashes: insights from random parameters logit models in the means and variances. Traf Inj. Prev. 23 (6), 321–326. doi:10.1080/15389588.2022.2072491
Yan, X., He, J., Wu, G., Zhang, C., Wang, C., and Ye, Y. (2022b). Differences of overturned and hit-fixed-object crashes on rural roads accompanied by speeding driving: accommodating potential temporal shifts. Anal. Methods Accid. Res. 35, 100220. doi:10.1016/j.amar.2022.100220
Yan, X., He, J., Zhang, C., Wang, C., Ye, Y., and Qin, P. (2023). Temporal instability and age differences of determinants affecting injury severities in nighttime crashes. Anal. Methods Accid. Res. 38, 100268. doi:10.1016/j.amar.2023.100268
Zhao, S., Iranitalab, A., and Khattak, A. J. (2019). A clustering approach to injury severity in pedestrian-train crashes at highway-rail grade crossings. J. Trans. Safe Sec 11 (3), 305–322. doi:10.1080/19439962.2018.1428257
Keywords: railway-grade crossings, injury severity, developing country, Thailand, random parameters, heterogeneity in means and variances
Citation: Se C, Champahom T, Laphrom W, Jomnonkwao S and Ratanavaraha V (2023) Analysis of factors influencing crash injury severities at highway–rail grade crossings accommodating for unobserved heterogeneity. Front. Built Environ. 9:1255762. doi: 10.3389/fbuil.2023.1255762
Received: 09 July 2023; Accepted: 06 October 2023;
Published: 23 October 2023.
Edited by:
Mahdi Rezapour, Independent Researcher, SwitzerlandReviewed by:
Sakdirat Kaewunruen, University of Birmingham, United KingdomFrancisco Alonso, University of Valencia, Spain
Copyright © 2023 Se, Champahom, Laphrom, Jomnonkwao and Ratanavaraha. This is an open-access article distributed under the terms of the Creative Commons Attribution License (CC BY). The use, distribution or reproduction in other forums is permitted, provided the original author(s) and the copyright owner(s) are credited and that the original publication in this journal is cited, in accordance with accepted academic practice. No use, distribution or reproduction is permitted which does not comply with these terms.
*Correspondence: Vatanavongs Ratanavaraha, dmF0YW5hdm9uZ3NAZy5zdXQuYWMudGg=