 H. Omar Ulloa
 Alex Ramirez2†
 Navid H. Jafari
 Ignacio Harrouch
- 1Department of Civil and Environmental Engineering, Louisiana State University, Baton Rouge, LA, United States
- 2Louisiana Coastal Protection and Restoration Authority, Baton Rouge, LA, United States
This technical paper investigates the influence of sample size and geologic characteristics on the geotechnical design of levee embankments. Sample quality plays a vital role in quantifying engineering properties for levee embankment projects, and numerous studies have highlighted the impact of sample disturbance on such engineering properties. Despite this evidence, conventional tube and piston samplers of different diameters continue to be widely used, potentially leading to underestimation of shear strength. The paper focuses on comparing 7.6 cm and 12.7 cm diameter undisturbed Shelby tube samples and CPT data collected from three levee sites in the Greater New Orleans Area, Louisiana, USA, which encompass diverse geologic histories. The study aims to assess the effect of industry used samples size and geology on levee construction costs. The findings provide valuable insights into optimizing sample collection methods and improving geotechnical design for earthen embankments.
1 Introduction
Measuring engineering properties for the geotechnical design of earthen embankments is explicitly linked to the quality of soil sampling. Many studies have focused on quantifying sample disturbance in the engineering behavior of soft clays, along with improving and refining sampling techniques (Hvorslev, 1949; Lefebvre and Poulin, 1979; Baligh et al., 1987; Gilbert, 1992; Lunne et al., 1997; Clayton and Siddique, 1999; Ladd and DeGroot, 2004; DeGroot et al., 2005; Long, 2006). Despite the overwhelming evidence of sample disturbance induced by the conventional tube and piston samplers, they are still commonly used in soft soils (Jafari et al., 2019). Sample disturbance may lead to an underestimation of the undrained shear strength (su), preconsolidation pressure (σ′p), virgin compression index (Cc), and coefficient of consolidation (cv) (Mesri and Castro, 1987; Gilbert, 1992; Ladd and DeGroot, 2004; Jafari et al., 2019). In particular, sample disturbance decreases su and increases the strain at failure for unconsolidated undrained (UU) triaxial tests of normally consolidated cohesive soils (DeGroot and Ladd, 2012), with su possibly approaching half of the in-situ value (Gilbert, 1992). DeGroot and Ladd (2012) also suggest that UU triaxial test results exhibit excessive scatter due to the reliance on the cancellation of three uncontrollable errors. The fast rate of shearing and the disregard for anisotropic effects increases the measured su, while sample disturbance decreases the measured su. Furthermore, UU test results from a poor-quality sample can be 25%–50% lower than the mobilized shear strength (Terzaghi et al., 1996).
For sampling related to flood protection projects, the U.S. Army Corps of Engineers (USACE) Hurricane and Storm Damage Risk Reduction System (HSDRRS) Design Guidelines requires 12.7 cm tube sampling at a maximum of every 300 m of levee along the centerline and toes of the levee (USACE, 2012). However, there is limited evidence suggesting that 7.6 cm borings taken in soft, normally consolidated soils are not suitable and that they should be avoided. The 12.7 cm diameter borings increase the cost and time requirements when compared to the 7.6 cm diameter borings due to the added difficulty in sampling, transportation, and preparation. The 12.7 cm diameter borings are generally performed using a 1.5 m long tube, while the 7.6 cm diameter borings use a 1 m long tube. This raises the question if the increase in site investigation cost is necessary to achieve a more cost-effective design, especially when over tens of kilometers of levees are proposed in the U.S, or if and how 7.6 cm diameter borings can achieve similar results to that of 12.7 cm borings.
Both 12.7 cm and 7.6 cm sampling techniques analyzed in this study use the same drilling and sampling practice, rotary wash with a bentonite drilling mud, an upward discharging bit, and thin-walled Shelby tubes with a fixed-piston type sampler for cohesive soils. Thus, a difference in shear strength is likely attributed to core tube diameter. The area ratio (AR), inside clearance ratio (ICR), and diameter-to-wall thickness ratio (B/t) for both 7.6 cm and 12.7 cm thin-walled tube samplers are all approximately equal. For sampler tubes with dimensions adhering to ASTM (D1587-15), 2022 typical AR values are 9.3% and 10.3%, and B/t values are 46.2 and 41.7 for 7.6 cm and 12.7 cm diameter tubes, respectively. Per USACE guidance for 12.7 cm core tubes, multiple 3.6 cm diameter specimens may be trimmed at the same elevation within an individual sample for three-point triaxial testing. For a 7.6 cm core tube, samples are taken vertically within the same 30 cm (1 ft), which may increase the issue of vertical variability within selected specimens.
Several geotechnical properties and overall behavior of soils are affected by the local depositional geologic environments. Graham and Shields (1985) report that properties such as the soil’s strength at various depths and conditions depend on the geology of the deposit and is affected by various environmental and climatic processes. Koloski et al. (1989) illustrate the connection between geotechnical properties for several types of soils ranging from clays to gravels, including organics, to their geologic characteristics and depositional environments ranging from alluvial to volcanic, including lacustrine. The wide range of this list indicates that there is a strong connection between geotechnical and geological characteristics of all types of soils.
Accordingly, the main objective of this study is to evaluate the effect of sample size and geology on earthen embankment design and construction using 7.6 and 12.7 cm diameter undisturbed Shelby tube samples and CPT data. To achieve this, controlled site investigations conducted at three 3) levee sites within the Greater New Orleans Area, Louisiana, USA that encompass varying geological histories within HSDRRS were analyzed. The study presents a comparative evaluation to assess the effect of the sampling methodologies, which vary in sample diameter and specimen size. Additionally, the data collection for this study offers an opportunity to develop site-specific correlations that are useful for engineering practice.
2 Site description
2.1 General geology of New Orleans
The Greater New Orleans area comprises diverse geologic deposits, such as inland swamps, interdistributary deposits, marsh, natural levee, point bar, and several abandoned distributary channels (Dunbar and Britsch, 2008). The study focuses on three specific sites: Lake Pontchartrain and Vicinity (LPV-02.2), characterized by interdistributary deposits, overlain by levee embankment material, marsh, and natural fill deposits, and underlain by bay floor containing clays, silts, sands, shells, and Pleistocene deposits; West Bank and Vicinity (WBV-14e.2), consisting of interdistributary deposits overlain by swamp deposits, underlain by prodelta and Pleistocene deposits; and West Bank and Vicinity (WBV-09a), predominantly composed of inland swamp deposits underlain by prodelta and Pleistocene deposits. Additional data from the Inner Harbor Navigational Canal (IHNC), West Shore Lake Pontchartrain (WSLP), and additional HSDRRS were included in this study to supplement lab test results for engineering properties (Figure 1). The IHNC site is an inland swamp, while the WSLP site comprises inland swamps, interdistributary, and prodelta deposits (Kolb and Van Lopik, 1958).

Figure 1. Greater New Orleans sites included in shear strength analysis and index property correlations (Google Earth image).
The Greater New Orleans area is characterized by Holocene and Pleistocene deposits, part of the Mississippi Deltaic Plain. Typically, the Holocene fill ranges from 17 to 24 m thick and can reach depths of up to 45 m, where point bar deposits formed by the Mississippi River dip gently towards the Gulf of Mexico (Dunbar and Britsch, 2008). These Holocene deposits mainly consist of organic clays, peats, and high-water content clays, with limited silts and sands (Kolb and Saucier, 1982). Thinner Holocene fills (e.g., 7.5–15 m) can also be found in some areas. Notably, the engineering properties of Holocene and Pleistocene deposits exhibit distinct differences. The Holocene deposits generally display undrained strengths of 10–50 kPa, while undrained strengths of 150–200 kPa were reported in the Pleistocene (Kolb et al., 1975). The local geology and general stratigraphy for each site are described in the following sections (see Figure 1 for locations). The shear strength comparison focuses on LPV-02.2, WBV-09a, and WBV-14e.2 sites, revealing both similarities and differences influenced by construction/stress history and geology across sites.
LPV-02.2, located within the Central Gulf Coastal Plain area, runs parallel to Lake Pontchartrain’s shoreline from the Elmwood Pump Station to the Lake Pontchartrain Causeway Bridge. The underlying interdistributary soft clays exhibit relatively stiffer soil characteristics due to longer stress history from embankment loading and consolidation. Table 1 displays the index properties (from boring logs in Supplementary Figures S1-S3) for each layer at this site, mainly comprising interdistributary deposits. The natural water content (wn), liquid limit (LL), and plasticity index (PI) values align with reported values for interdistributary deposits (Saucier, 1994) (see Figure 2 for histograms). WBV-09a, situated on the west bank of the Mississippi River, is approximately at Mile 70. Prior to the 2012 levee construction, the site was located on virgin/tupelo swamp areas, indicating a shorter construction or stress history. Table 1 presents the engineering index properties (from boring logs in Supplementary Figures S4-S7) for this site, primarily comprised of inland swamp deposits with values consistent with those reported by Saucier (1994). WBV-14e.2, located on the west bank of the Mississippi River and north of Lafitte, LA, had its levee construction completed in 2012. The site investigation (see boring logs in Supplementary Figures S8-S10) revealed the upper 3.7 m consisting of very soft to soft high plasticity clays, with organics and peats layers starting at 1.5 m deep. From 3.7 m to the termination depth of 15.2 m, the soil comprised soft to medium stiff high plasticity clays with occasional layers of silty sand and lean clay lenses. Decaying wood, roots, and shells were encountered throughout the depth. Similar to LPV-02.2, this site is mainly composed of interdistributary deposits.
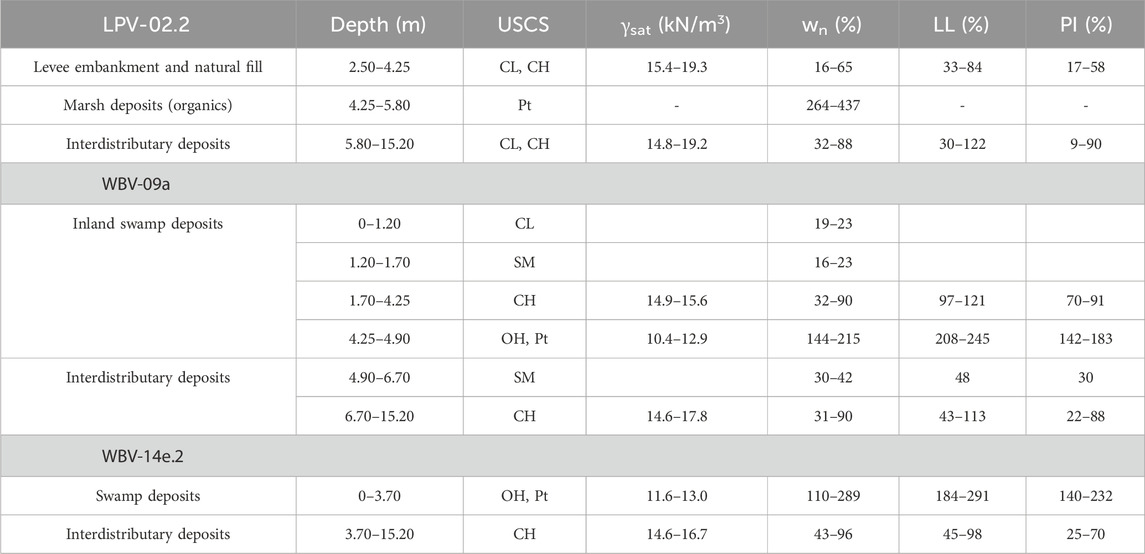
Table 1. Engineering index properties for soils along analyzed sites.
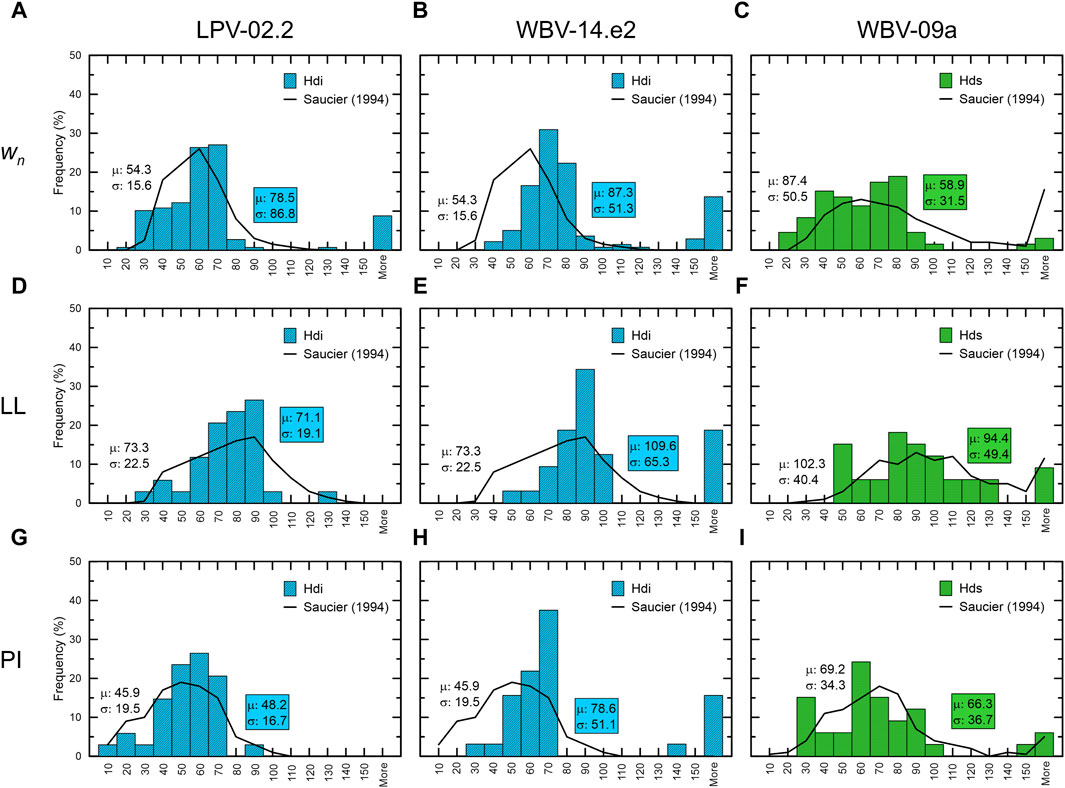
Figure 2. Histograms for wn, LL, and PI for sites LPV-02.2 (A, D, G), WBV-14 (B, E, H), and WBV-09a (C, F, I), respectively. Colored bars represent current analyzed data. Continuous line represents data found in Saucier (1994).
Figure 2 displays histograms for each site’s data (in filled bars) with mean μ) and standard deviation σ) values (enclosed). The black line represents typical values for interdistributary deposits (Hdi) and inland swamp deposits (Hds) as reported by Saucier (1994), with μ and σ for these values (no enclosure). LPV-02.2 (Hdi) data aligns with typical values, especially for LL and PI. Although the μ and σ values for wn are higher, the histogram follows the same distribution as the typical values. WBV-09a (Hds) data also corresponds to typical values, although wn mean and standard deviation are lower than literature values. Nevertheless, the data for the three index properties follow the same distribution. WBV-14e.2 (Hdi) data follows the general distribution of typical interdistributary deposits but with higher frequencies and μ and σ values for all three index properties.
While all three sites generally conform to the distribution of their depositional environments, notable differences exist between interdistributary and inland swamp deposits. Interdistributary deposits approximate a lognormal distribution, while inland swamp deposits exhibit a broader lognormal distribution with tendencies toward a uniform distribution in some areas and higher values for the upper ranges of each index property. This broader distribution is also evident from higher standard deviation values compared to interdistributary deposits (Saucier, 1994). Consequently, differences in site behavior can be expected.
2.2 General index properties
Table 1 summarizes the soil classification and index properties obtained from engineering reports (see Supplementary Figures S1-S10). Water content was collected at 0.30 m intervals along the borings, and unit weight measurements were obtained during the consolidation, UU triaxial, and Unconfined Compression (UC) tests. Correlations with engineering properties were established using available data, including the unit weight and water content correlation presented in Figure 3B, which is particularly significant for soils in the Greater New Orleans area due to the frequent water content measurements during soil investigations (USACE, 2012).
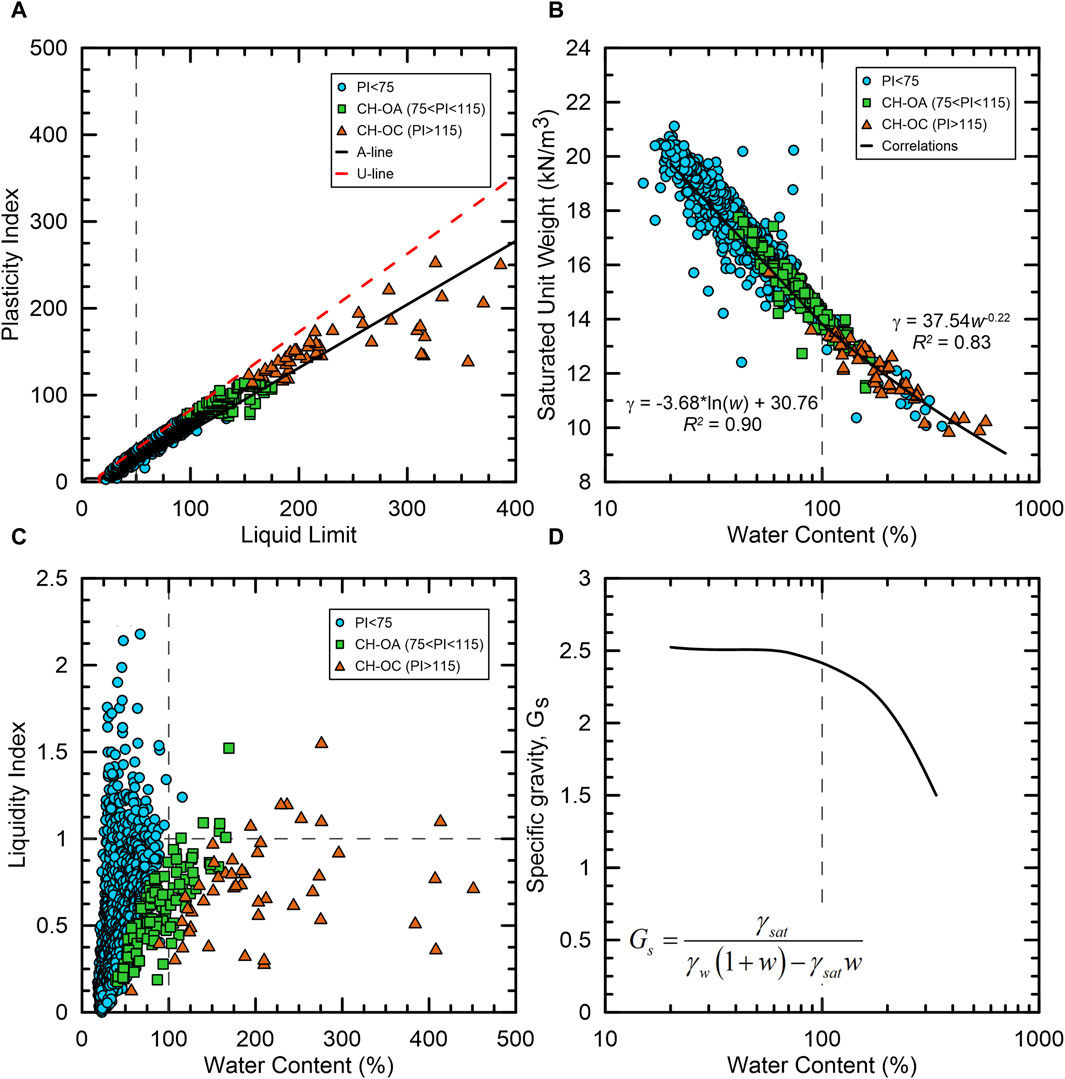
Figure 3. Physical index properties of HSDRRS project sites: (A) Plasticity chart, (B) Saturated unit weight, (C) Liquidity index, and (D) Specific gravity.
Figure 3 shows correlations between engineering index properties from the HSDRRS project sites. CH-OA and CH-OC classifications were used to further separate organic-rich CH soils based on guidance from USACE New Orleans Division (USACE, 2012). In particular, CH-OC corresponds to PI > 115 and CH-OA includes soils with a PI between 75 and 115. Very few points were classified as CH-OB, so they were grouped with CH-OA. Nearly all data falls above the A-line and below the U-line in Figure 3A, classifying it as high plasticity clay to organic clay according to USCS. Figure 3B displays trend lines between saturated unit weight (γsat) and wn, divided into two groups below and above 100%. Figure 3C depicts the relationship between liquidity index (LI) and wn data, with the majority of classified soils exhibiting LI < 1. However, some CL and CH classified soils from the WSLP site show LI values above unity, indicating potential sensitive behavior (Terzaghi et al., 1996). Figure 3D provides an analytical weight-volume relationship for specific gravity (Gs) as a function of wn, where Gs remains relatively constant at 2.5 with wn approaching 100%, typical for inorganic soils (Holtz et al., 2011). In the presence of increasing organic soils (CH-OA and CH-OC), Gs dramatically decreases between wn of 100%–200%. The equation and plot in Figure 3D help determine Gs values from wn for water content values less than <330%.
3 Developing shear strength profiles
3.1 In-situ and laboratory tests
The geotechnical site investigation focused on comparing UU triaxial test results from 7.6 cm (3 in) and 12.7 cm (5 in) Shelby tube borings and assessing their influence on undrained shear. Three borings were performed at each site according to ASTM (D1587-15). All tests were performed to the side of the embankment, at least 30 m away from the embankment centerline so as to avoid the constructed embankment. The investigation was concluded in November 2015 (see Supplementary Figures S1-S10). Additionally, a piezocone penetration test (CPTu) in accordance with ASTM (D5778-20), 2017 was also performed at each site using a 4.5-tonne capacity 10 cm2 cone. Figure 4 shows the general layout of the borings and CPTu. The investigation included UU triaxial, 1-D incremental loading (IL) consolidation, and index properties tests. Moisture content and Atterberg limits tests were conducted in accordance with ASTM (D2216-19), 2007 and ASTM (D4318-17e1), 2010, respectively.
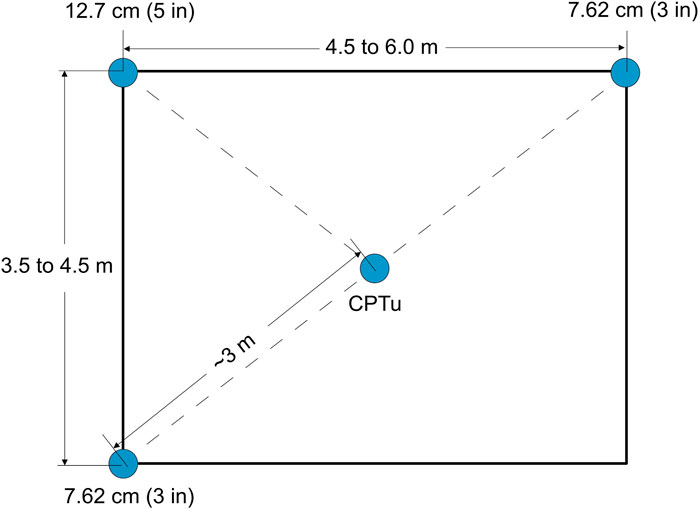
Figure 4. Layout of CPTu and coring locations for LPV and WBV sites.
The UU triaxial tests were carried out in three ways: 1) 1-point 7.1 cm diameter UU triaxial test from the center of a 7.6 cm diameter Shelby tube; 2) 3-point 3.6 cm diameter UU triaxial tests vertically trimmed within the same 30 cm of a 7.6 cm diameter Shelby tube; and 3) 3-point 3.6 cm diameter UU triaxial tests trimmed from quadrants of a 12.7 cm diameter at the same depth, all according to ASTM (D2850-15), 2008. Supplementary Figure S11 provides additional details on the sampling arrangement for the UU tests. The 1-D IL consolidation tests, according to ASTM (D4546-21), 2011, used two diameter specimens: 1) two 5.1 cm diameter samples trimmed from the 7.6 cm diameter Shelby tube; and 2) one 5.1 cm diameter sample and one 10.2 cm diameter sample from a 12.7 cm diameter Shelby tube.
3.2 Shear strength and consolidation data QA/QC
UU triaxial tests and their correlations to CPTu are widely used in U.S. engineering practice (Stark and Delashaw, 1990; Wei et al., 2010; Zein, 2017). However, assessing sample disturbance is challenging as UU triaxial specimens are not reconsolidated to the initial effective stress, limiting the quantification of in-situ versus laboratory void ratio changes, which directly evaluates soil structure (Terzaghi et al., 1996; Lunne et al., 1997; Jafari et al., 2018). Brandon et al. (2011) proposed criteria to classify the quality of three-point UU triaxial tests, based on the following criteria: 1) Peak deviator stress must be reached at an axial strain ≤5%; 2) Mohr circles must have approximately the same diameter; 3) Initial water content and void ratio must be within ±5% from each other; 4) Degree of saturation must be at least 95%; 5) All stress-strain curve should exhibit a smooth appearance; and 6) All specimens should exhibit an approximately equal initial tangent modulus. These criteria were ranked on a one to five scale, with five being the highest quality. If five or more conditions were met, the sample quality was classified as “very good”. If four conditions were met, the sample was assessed as “fair”. If three or less conditions were met, the sample was assigned a “poor” rating. These qualitative classifications correspond to the terminology used by Lunne et al. (1997). Among the 204 data points analyzed, 82 points (40%) were classified as poor and were excluded from shear strength analyses and CPTu correlation (Table 2). Table 2 presents the number of tests analyzed for each combination of core diameter and sample diameter, hereafter referred to as sample designation.
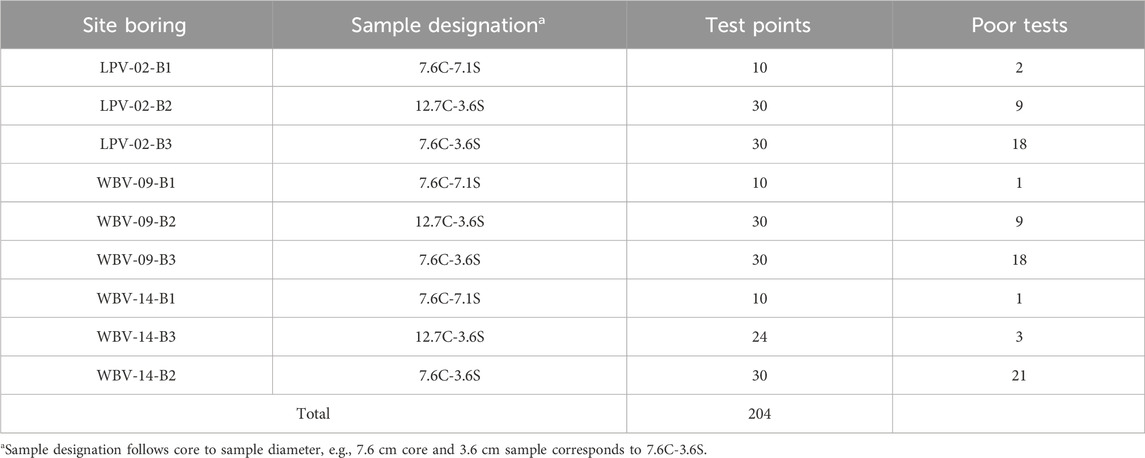
Table 2. Summary of sample quality analyses.
To facilitate the sample size comparison between 7.6 cm and 12.7 cm diameter cores and its effect on earthen embankment design and construction comparison, the 7.1 cm sample from the 7.6 cm was assessed only with the applicable criteria because only one point was tested for each depth. The criteria regarding the peak deviator stress, water content and initial void ratio, and initial tangent modulus were missed in the vast majority of these points. The coefficient of variation (COV) values for the sample arrangements containing three tests per elevation are summarized in Supplementary Figure S13 and presented per site and sample designation. In the LPV site, the poor tests from both the 7.6 cm and 12.7 cm core tubes exhibited higher COV values than the good/fair tests. In the WBV-09 and WBV-14 sites, only the poor tests from the 7.6 core tubes presented higher COV values than the good/fair points. In general, the COV values were higher for the 7.6 cm core tubes compared to those from the 12.7 core tubes only in the LPV-02 and WBV-14 sites. Table 2 summarizes the total number of total and poor tests points for all core tubes and sites.
For the 1-D IL consolidation tests, sample quality was evaluated using three criteria: specimen quality designation (SQD) from Terzaghi et al. (1996), Δe/eo from Lunne et al. (1997), and the one to five ranking proposed by Brandon et al. (2011). Brandon et al. (2011) provided criteria for consolidation tests: 1) Strain upon reloading to in situ vertical stress must be less than 3%; 2) Degree of saturation must be at least 95%; 3) The sample must be taken at a depth greater than 1.5 m; 4) The difference between σ′p as determined by Casagrande and Sowers must be less than 25%; 5) A well-defined break must be observed in the compression curve at the transition from recompression to virgin compression; 6) The End of Primary (EOP) consolidation must be achieved at every load increment; and 7) The time rate of consolidation curves must exhibit a smooth and reasonable shape at each load increment. Terzaghi et al. (1996) introduced SQD as a rating index based on volumetric strain (εv) under in-situ effective vertical stress in a 1-D IL consolidation test, with higher εv values indicating less sample quality. This sample quality characterization applies to cohesive soils with OCR less than three to 5. Furthermore, Lunne et al. (1997) also proposed a methodology to assess sample quality from 1-D consolidation test data and for soils with OCR = one to two.
The available 1-D IL consolidation tests were analyzed according to these criteria (Figure 5). WBV-09 test data showed the lowest quality, possibly due to Holocene deposits undergoing multiple levee embankment loadings, consolidation, and thus strength gain in the LPV site, while the WBV sites, because the construction of the embankments is more recent, were likely still undergoing primary consolidation during the time of the investigation. Additionally, WBV-09a is mainly comprised of inland swamp deposits while the other two sites are mainly composed of interdistributary deposits according to their location (Saucier, 1994). Sample quality decreased with depth, showing good agreement between Lunne et al. (1997) and Terzaghi et al. (1996) methodologies, and aligning with what Brandon et al. (2011) proposed. UU test data indicated that sample size 7.6C-3.6S produced the highest amount of poor data points, while no clear distinction in sample quality was observed when analyzing 1D consolidation data with different core tube/specimen diameters.
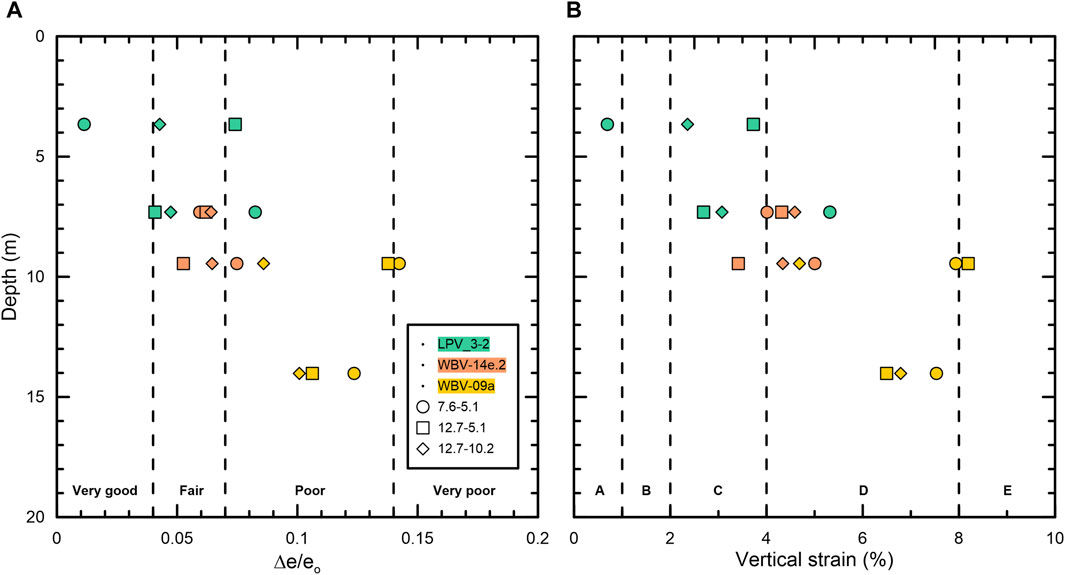
Figure 5. Sample quality from 1-D IL consolidation tests using (A) Lunne et al. (1997) and (B) Terzaghi et al. (1996) assessments.
3.3 CPTu - UU analyses
The calibration of the cone factor (Nkuu) for CPTu data to obtain undrained shear strength (su) was performed using su = (qt - σv)/Nkuu, where qt = corrected cone tip resistance, σv = total stress, and Nkuu = empirical cone factor (Stark and Delashaw, 1990). Stark and Delashaw (1990) reported that Nkuu varied from 8.5 to 13.5 for normally to lightly overconsolidated clays (OCR ∼1 – 5). Wei et al. (2010) reported values of cone factor ranging between 10 and 15. Zein (2017) reported cone factor values of 12–32 for soft Holocene clays in Hungary. The CPTu data was analyzed and plotted for each site, including the laboratory UU triaxial tests for the various sample designations. Nkuu values were varied between 8 and 20 to coincide CPT data with the UU triaxial tests, while being assessed by the su(mob)/σ′v = 0.22 trend line (Figures 6–8). This relationship was initially introduced by Mesri (1975) with σ′p and was used in this study with σ′v to compare to su from normally consolidated soils. These figures show the variation of shear strength through depth. Because the sites have different elevations relative to mean sea level (MSL), elevation is shown as the y-axis instead of depth. Poor sample quality data were excluded from the analysis, and only very good and fair test points were used to create strength profiles. Removing the poor data had a minimal effect on Nkuu values for the 7.6C-7.1S and 12.7C-3.6S sample designations. Nevertheless, the Nkuu values for 7.6C-3.6S sample were reduced from 15 to 13, 13 to 12, and 16 to 13 for the LPV-02.2, WBV-09a, and WBV-14e.2 sites, respectively, and thus, the undrained shear strength slightly increased with improved sample quality. The inclusion of poor quality data increased scatter and uncertainty in design profiles, potentially affecting failure probability predictions in reliability analyses (Duncan, 2000).
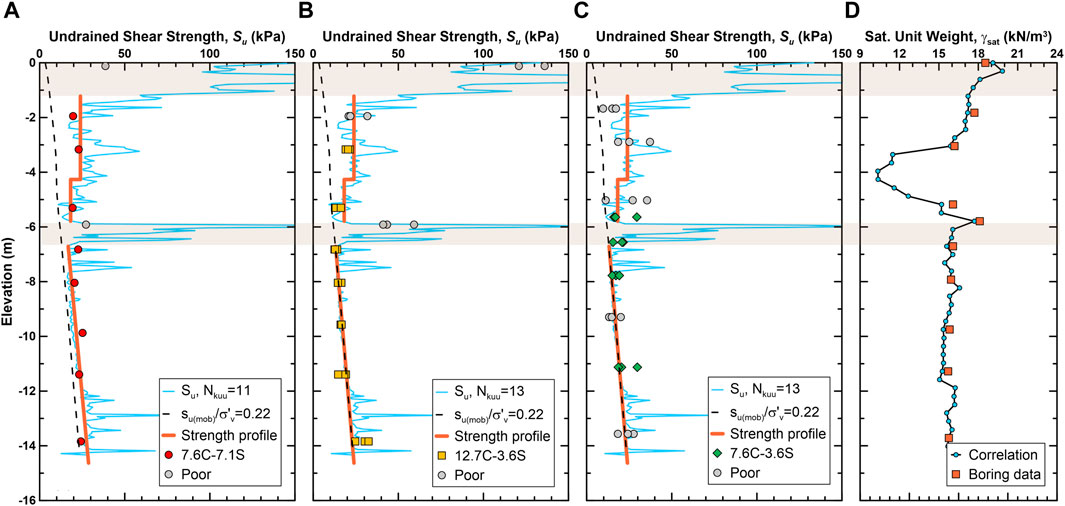
Figure 6. Calibrated CPTu strength profiles (A-C) and unit weight profile (D) at LPV-02.2 site.
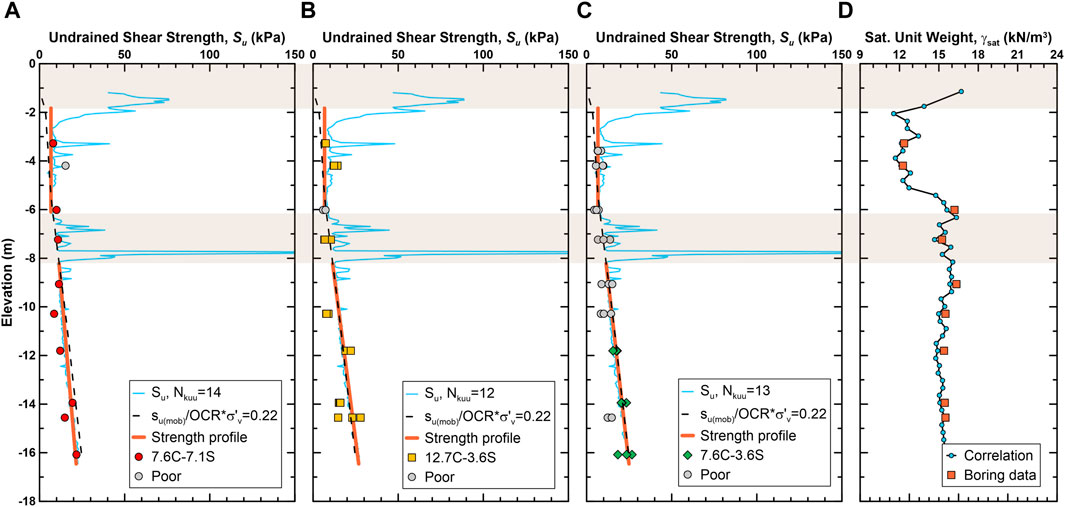
Figure 7. Calibrated CPTu strength profiles (A-C) and unit weight profile (D) at WBV-14e.2 site.

Figure 8. Calibrated CPTu strength profiles (A-C) and unit weight profile (D) at WBV-09a site.
At the LPV-02.2 site, 12.7C-3.6S and 7.6C-3.6S sample designations produced the same Nkuu value and strength profile, likely due to site history and stiffer Holocene deposits. At WBV-14e.2, the Nkuu values varied from 12 to 14. The consolidation tests from this site indicate that the OCR is approximately 1.3 for the interdistributary clay at ∼12 m. When accounting for slight over-consolidation, the su(mob)/σ′p = 0.22 line plots directly over the UU test data. Despite more poor data points, a Nkuu of 13 was estimated for the 7.6C-3.6S data. The WBV-09 site, constructed on virgin swamp areas, showed Nkuu variability from 10 to 15, with the 12.7 cm sampler producing the lowest Nkuu of 10. These deltaic clays are normally consolidated with OCR values of 0.6 – 1. In such environments, a larger sampler diameter may provide a more accurate indication of undrained shear strength, as per HSDRRS design guidelines (USACE, 2012). The average calibrated Nkuu was 13, lower than average values reported in the literature.
Terzaghi et al. (1996) describe that soils under levee embankments undergo three modes of shearing along the failure surface: CU triaxial compression (TC) and triaxial extension (TE) simulate the active and passive modes of shear, respectively, while direct simple shear (DSS) tests simulate the mode of shear along the horizontal or slightly inclined portions of the failure surface. For levee embankments, a general assumption is made that the failure surface consists of equal segments of compression, direct shear, and extension modes of shear. Consequently, an average of the shear strengths obtained by the TC, DSS, and TE tests can be considered as the mobilized shear strength. The best estimate for the average mobilized undrained strength ratio, regardless of the PI and for a sliding circular arc surface, is su(mob) = 0.22 σ′p.
Additionally, Terzaghi et al. (1996) compared UC and UU tests and found that the results from both tests differed only by a small percentage for saturated soft clays and high-quality samples. The sample disturbance in these tests was almost offset by the effect of rapid strain, resulting in the undrained shear strength obtained by UU/UC tests being almost equal to that obtained by TC tests. However, when analyzing su(UC) from Shelby tubes, a 70% reduction in strength was observed when compared to block samples. Accounting for this 70% reduction, an initial relationship of su(TC)/σ′p = 0.32 reduces to 0.22, which is the value reported as the best estimate for mobilized undrained shear strength. Therefore, the effect of rapid strain and compression mode counteracts soil disturbance, and su from UC and UU can be used to determine the mobilized shear strength (see the CPTu-UU strength profiles presented in Figures 6–8).
Furthermore, unit weight profiles are also included in Figures 6–8. These profiles illustrate the γsat values obtained from the borings, along with a comparison to the γsat derived from the correlation with wn (see Figure 3B). The agreement between both is evident, shown by the proximity between both sets of data. This γsat and wn correlation is highly relevant, as it was also used to determine the overburden stress in the CPT profiles.
4 Slope stability analyses
To quantify the influence of sample size on Nkuu values and factor of safety (FS), limit equilibrium slope stability analyses were performed for each site and each sampling method. The cross-sections used in the stability analyses correspond to the as-built levee cross-sections for LPV-02.2 Reach 3-2, WBV-14e.2a Reach IIIc, and WBV-09a Swamp Reach (see Figure 9). For comparison purposes, one failure surface extending into the interdistributary clay was chosen for each profile. Additionally, the hurricane storm surge loading applied for the analyses was 5.5 m, 3.2 m, and 5.5 m for the LPV, WBV-14, and WBV-09 sites, respectively. These hurricane surge loads correspond to a 100-year return interval obtained from the geotechnical report for each site.
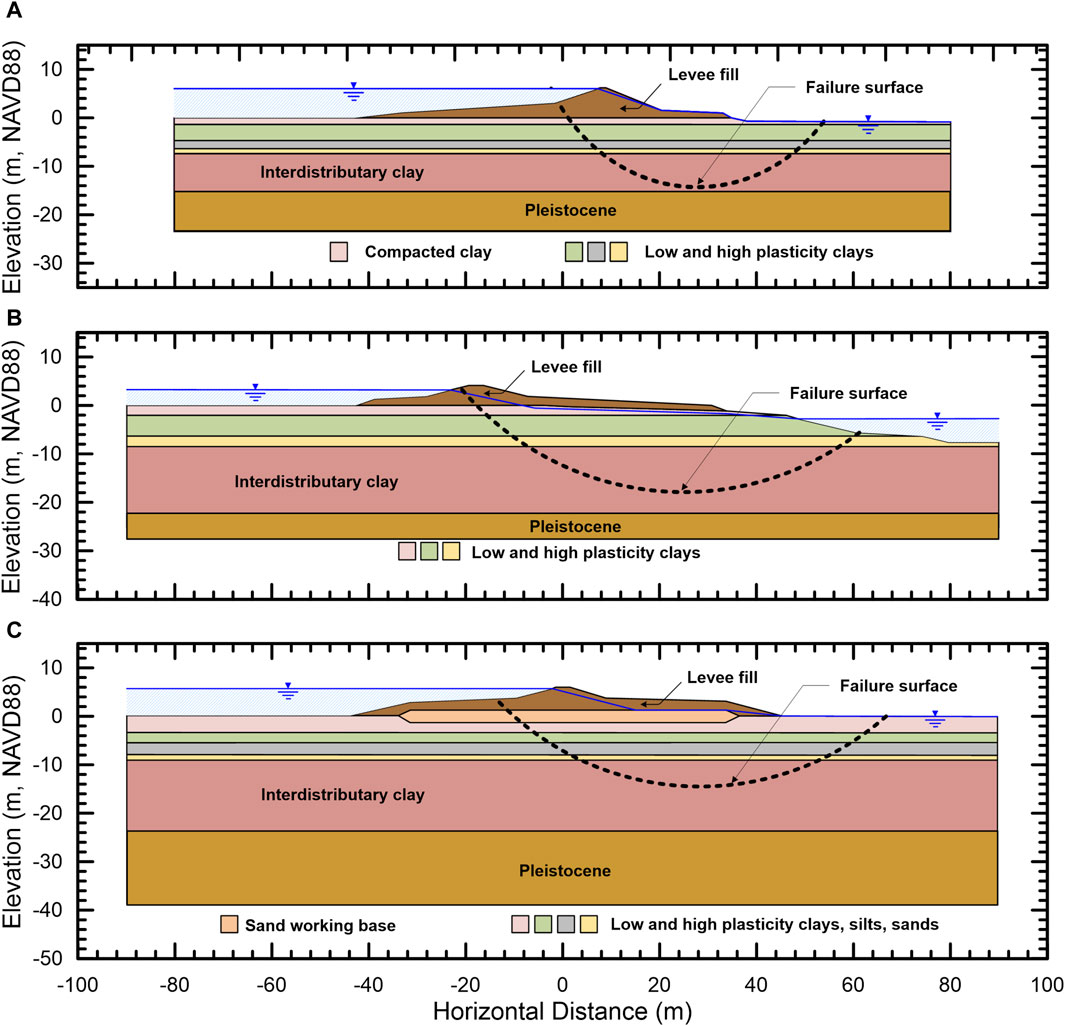
Figure 9. Slope stability cross-sections and critical failure surfaces for (A) LPV-02.2, (B) WBV-14e.2, and (C) WBV-09a.
In Figures 6–8, the shear strength design line (straight, thick line) was selected following the CPTu-estimated su(mob) for all the interdistributary clay layers and used for analyses. However, for the silt layers, values for c’ = 10 kPa (200 psf) and ϕ’ = 15° were assumed (USACE, 2012). Where sand layers were encountered, ϕ’ ranged from 30° to 40° and were determined from CPTu correlations (Robertson and Cabal, 2015). The low and high plasticity clays overlying the interdistributary clays (depth to ∼9.15 m) exhibit similar strengths across the three sampling techniques for each site. These soils exhibit constant strength values as shown in the profiles. In contrast, the interdistributary clay layer found around 9.15 m–15.25 m depth exhibits varying strengths across the three sites. Furthermore, the strength of this layer increases linearly with depth.
All analyses were performed using the GLE/Morgenstern-Price method in Rocscience Slide2 software (Rocscience, 2022). Table 3 presents the summarized results of the slope stability analyses for each sampling technique. For the LPV site, the levees were constructed decades ago, and thus the interdistributary clay layers have previously undergone multiple consolidation stages throughout the years. As a result, a difference in FS was not found between the strength profiles derived from 12.7C to 3.6S and 7.6C-3.6S. A slightly higher FS was reported for 7.6C-7.1S. The boring logs for the interdistributary clay (∼7–14 m) in the LPV site report the presence of silty sand lenses and traces of shell fragments within the CL and CH soils, which might alter the shear strength on some tests. Caution must be exercised when interpreting the UU tests on these depths, specifically with the 7.6C-7.1S sample, considering there is only one-point data per depth. The multiple tests per depth in 12.7C-3.6S and 7.6C-3.6S (samples from the same depth or within 0.30 m, respectively) provide a better understanding of the shear strength along the profile. In general, it can be concluded that sample designation does not influence the FS results at the LPV site.

Table 3. Summary of Nkuu and FS values for each sampling technique.
The WBV-14e.2 site results show a similar trend to that of the LPV site. The sample designation does not highly influence the undrained shear strengths and thus FS. The consolidation tests on this site show an OCR = ∼1.3. All sample designations at this site show similar strength profiles and yield a similar FS. In contrast to what was observed at LPV-02.2, 7.6C-7.1S shows slightly lower shear strength values than 12.7C-3.6S and 7.6C-3.6S. A factor contributing to this may be that the WBV-14e.2 boring log for the 7.6C-7.1S sample shows slightly higher water contents and lower unit weights than the other two sample designations. This trend was not observed in the other two sites. Moreover, because there is only one-point per depth, it is uncertain if additional tests at the same depth of this sample designation may show shear strengths comparable to those of 12.7C-3.6S and 7.6C-3.6S. In general, 12.7C-3.6S and 7.6C-3.6S show similar FS results, and either sample designation could be used to adequately assess slope stability.
The results for the WBV-09a site present a different scenario (Figure 8). The stress history of this levee is limited, with the clay approaching normally consolidated to levee embankment loading only in the past several years. The site’s soft consistency explains why sample designation significantly affects the FS predictions. For example, the FS decreased from 1.75 for 12.7C-3.6S to 1.47 for 7.6C-3.6S, which corresponds to an almost 19% reduction in FS. The FS obtained from 7.6C to 7.1S is 1.26, signifying a reduction of nearly 39% when compared to that of 12.7C-3.6S. This shows that the sample designation provides a controlling influence in the undrained shear strength results for these normally consolidated deltaic soils.
Sample designation does not have a controlling influence on the undrained shear strength on all of the sites, but it does in the inland swamps (WBV-09). The two other sites, LPV and WBV-14, characterized by interdistributary deposits, show consistent FS results across the three sample designations. As stated previously, when comparing the LPV data to the typical values reported by Saucier (1994), the same distribution, and a similar μ and σ can be observed, especially for LL and PI. In addition to the stress history, interdistributary deposits are not highly influenced by varying sampling techniques. WBV-14e slightly drifts from the typical values found in literature, which explains the slight variation in FS values for this site. Inland swamps at WBV-09a are notably susceptible to changes in the sampling technique, mainly due to higher standard deviations in the typical values of the inland swamp environment reported by Saucier (1994) compared to interdistributary deposits (see Figure 2).
5 Practical implications to levee design and construction
The effect of sample designation and geology on levee design and construction practices can be analyzed by examining the differences in FS for each site and sampling technique used. This section focuses on evaluating how these factors impact the selection of the Nkuu factor. Table 3 and previous discussions reveal that, in general, the LPV site exhibits consistent Nkuu values for different sample designations when analyzing CPT and lab data, resulting in similar FS values. The WBV-14 site also shows minimal variations in FS among different sample designations. However, this is not the case for WBV-09, where differences in FS are mainly attributed to geologic factors. WBV-09 is a normally consolidated, deltaic site with no prior levee construction history, primarily composed of inland swamp deposits.
Table 2 displays the number of poor data points for all sample designations. Generally, each sample designation for the three sites has a similar amount of poor data points. The most significant differences are observed in site WBV-14, where sample designation 12.7C-3.6S exhibits better sample quality, while 7.6C-3.6S shows slightly less sample quality compared to the same sample designations in the other two sites. As discussed in previous sections, these poor data points were not utilized in deriving Nkuu values in Figures 6–8. However, when considered, the effect was more pronounced in 7.6C-3.6S, which had the highest number of poor data points, leading to increased Nkuu values. This effect was more significant in the WBV-14 site, which had the most number of low quality tests.
Geology had the most significant impact on the slope stability analysis results. This is evident in the variation of Nkuu and FS values across different sample designations for all sites. The FS results for LPV and WBV-14 sites, characterized as interdistributary deposits, exhibit remarkable similarity. Figure 2 displays histograms of index properties for all sites, along with data from literature. While LPV data aligns well with what was reported in Saucier (1994), WBV-14 data shows slight variation from the literature’s distribution, particularly at higher values of index properties, which explains the slight variation in FS values across sample designations in WBV-14. In contrast, the histogram for the WBV-09 site, characterized as inland swamp, exhibits a broader distribution of index properties, explaining the wider variability in FS across different sample designations.
The cost impacts of variations in FS on levee embankment construction can be quantified by evaluating site investigation and levee embankment fill activities. HSDRRS guidelines require borings to be taken at a maximum of 150 m, alternating between 12.7 cm diameter Shelby tube borings and 7.6 cm diameter Shelby tube borings or CPT. The analyses in this study showed that LPV-02 and WBV-14 sites reported minimal FS variations due to sample designation or geology. Considering a 3 km long levee section, the costs associated with the site investigation (i.e., drilling and sampling, grouting, engineer hours, crew mobilizations) of 12.7 cm borings were approximately 1.5 times higher (a difference of ∼$30,000) than 7.6 cm borings. Because FS variations were negligible due to changes in sample designation, reducing the quantity of 12.7 cm borings in favor of 7.6 cm borings can result in cost savings for site investigation.
In contrast, the WBV-09 site reported high FS variation due to sampling technique and geologic factors. In this case, replacing 12.7 cm borings with 7.6 cm borings is not advisable as this influences Nkuu factor derivation and, consequently, FS. However, samples from 12.7 cm borings yielded higher undrained shear strength values, suggesting possible cross-section optimization by adequately calibrating Nkuu factors from different sample designations. The cross-section presented in Figure 8C for the WBV-09 site was chosen due to its highest variability and clear distinction between sampling techniques. Adhering to the HSDRRS guidelines and considering the same 3.05 km long levee section, using 12.7 cm borings increases site investigation costs. However, the levee fill costs significantly outweigh the site investigation costs. With an FS of 1.75 considering the 12.7C-3.6S sample designation, optimizing the cross-section by reducing its area lowers the FS to 1.47, resulting in a cost reduction of ∼$4.5 million from a total cost of ∼$41.5 million per 3.05 km of levee construction. Such cost savings would be even more significant when considering other levee projects, like the new construction of the West Shore Lake Pontchartrain levee, which spans 30.3 km. Further optimizing the cross-section decreases the FS to 1.26, similar to the result obtained with the 7.6C-7.1S sample, representing a total cost reduction of ∼$6.5 million (15.8%) per 3.05 km of levee construction.
6 Conclusion
Based on the testing data derived from both 7.6 cm and 12.7 cm borings and the slope stability analyses conducted for the different cross-sections examined in this study, the following conclusions are summarized:
• The study demonstrates that sample designation has limited impact on levee design and construction for the LPV and WBV-14 sites, as consistent Nkuu values result in similar FS values. However, for the WBV-09 site, variations in FS are mainly influenced by geologic factors, specifically the site’s normally consolidated, deltaic composition of inland swamp deposits.
• Geology plays a significant role in slope stability analysis, as evident from the variation in Nkuu and FS values across different sample designations for some sites. Sites with prior levee construction and consolidation like LPV-02.2, characterized as interdistributary deposits, exhibit similar FS values. Site WBV-14, which has no prior levee construction but is also mainly comprised of interdistributary deposits, exhibits minimal variation of FS values. On the other hand, the WBV-09 site, comprised of normally consolidated, deltaic soils with no prior construction loading, is characterized as inland swamp and shows wider variability in FS due to a broader distribution of index properties (see Figure 2).
• The cost implications of FS variations on levee embankment construction were assessed. For sites with minimal FS variation due to sample designation or geology (LPV-02 and WBV-14), either 7.6 cm or 12.7 cm borings can produce comparable results, but the 7.6 cm boring is suggested due to its ease of drilling and overall reduced costs during the site investigation. Using more 7.6 cm borings instead of 12.7 cm borings for site investigation can result in cost savings, as 12.7 cm borings are approximately 1.5 times costlier.
• For the WBV-09 site with high FS variation, replacing 12.7 cm borings with 7.6 cm borings is not recommended due to the influence on Nkuu factor derivation and FS. However, calibration of Nkuu factors derived from different sample designations can optimize the cross-section, leading to potential cost reductions in levee fill and construction activities. The optimization process, especially for the 3.05 km levee section, resulted in significant cost savings, and these savings would be more substantial for larger levee projects, emphasizing the importance of careful consideration of sampling techniques to achieve cost-effective levee construction.
Data availability statement
The raw data supporting the conclusion of this article will be made available by the authors, without undue reservation.
Author contributions
HU: Conceptualization, Data curation, Formal Analysis, Methodology, Visualization, Writing–original draft, Writing–review and editing. AR: Data curation, Methodology, Writing–review and editing. NJ: Conceptualization, Methodology, Project administration, Resources, Supervision, Validation, Writing–review and editing. IH: Methodology, Supervision, Validation, Writing–review and editing. BB: Writing–review and editing.
Funding
The author(s) declare that financial support was received for the research, authorship, and/or publication of this article. Support for this research was provided by the Louisiana Coastal Protection and Restoration Authority (CPRA) and administered by Louisiana Sea Grant (LSG) through its Coastal Science Assistantship Program (CSAP).
Acknowledgments
The authors thank James Hance at Eustis Engineering Services and Michael Juneau at Southern Earth Sciences, Inc. for their contribution to field, laboratory, and cone penetration testing.
Conflict of interest
The authors declare that the research was conducted in the absence of any commercial or financial relationships that could be construed as a potential conflict of interest.
Publisher’s note
All claims expressed in this article are solely those of the authors and do not necessarily represent those of their affiliated organizations, or those of the publisher, the editors and the reviewers. Any product that may be evaluated in this article, or claim that may be made by its manufacturer, is not guaranteed or endorsed by the publisher.
Author disclaimer
The contents and views in this paper are those of the authors and do not necessarily reflect those of any consultant, regulatory agency or personnel, or anyone else knowledgeable about the case study referenced. In particular, the contents of this paper/publication are the personal opinions of the author(s) and may not reflect the opinions, conclusions, policies, or procedures of the U.S. Army Corps of Engineers and Louisiana Coastal Protection and Restoration Authority.
Supplementary material
The Supplementary Material for this article can be found online at: https://www.frontiersin.org/articles/10.3389/fbuil.2024.1279383/full#supplementary-material
References
ASTM (D1587-15) (2022). Standard practice for thin-walled tube sampling of fine-grained soils for geotechnical purposes. West Conshohocken, PA: ASTM International.
ASTM (D2216-19) (2007). Standard test methods for laboratory determination of water (moisture) content of soil and rock by mass. West Conshohocken, PA: ASTM International.
ASTM (D2850-15) (2008). Standard test method for unconsolidated-undrained triaxial compression test on cohesive soils. West Conshohocken, PA: ASTM International.
ASTM (D4318-17e1) (2010). Standard test methods for liquid limit, plastic limit, and plasticity index of soils. West Conshohocken, PA: ASTM International.
ASTM (D4546-21) (2011). Standard test methods for one-dimensional swell or collapse of soils. West Conshohocken, PA: ASTM International.
ASTM (D5778-20) (2017). Standard test method for electronic friction cone and piezocone penetration testing of soils, 20. West Conshohocken, PA: ASTM International.
Baligh, M. M., Azzouz, A. S., and Chin, C. T. (1987). Disturbances due to ideal tube sampling. J. Geotechnical Engineering-Asce 113 (7), 739–757. doi:10.1061/(asce)0733-9410(1987)113:7(739)
Brandon, T., Martin, L., Martin, S., and Xu, G. (2011). Strength and compressibility correlations for New Orleans area soils. New Orleans Dist.
Clayton, C. R. I., and Siddique, A. (1999). Tube sampling disturbance - forgotten truths and new perspectives. Proc. Institution Civ. Engineers-Geotechnical Eng. 137 (3), 127–135. doi:10.1680/gt.1999.370302
DeGroot, D. J., and Ladd, C. C. (2012). Geotechnical engineering state of the art and practice: keynote lectures from GeoCongress 2012, 565–607.Site characterization for cohesive soil deposits using combined in situ and laboratory testing
DeGroot, D. J., Poirier, S. E., and Landon, M. M. (2005). Sample disturbance-soft clays. Studia Geotechnica Mech. 27 (3–4), 91–105.
Dunbar, J. B., and Britsch, L. D. (2008). Geology of the New Orleans area and the canal levee failures. J. Geotechnical Geoenvironmental Eng. 134 (5), 566–582. doi:10.1061/(asce)1090-0241(2008)134:5(566)
Duncan, J. M. (2000). Factors of safety and reliability in geotechnical engineering. J. geotechnical geoenvironmental Eng. 126 (4), 307–316. doi:10.1061/(asce)1090-0241(2000)126:4(307)
Gilbert, P. A. (1992). Effect of sampling disturbance on laboratory-measured soil properties. in Army engineer waterways experiment station vicksburg, MS geotechnical lab.
Graham, J., and Shields, D. (1985). Influence of geology and geological processes on the geotechnical properties of a plastic clay. Eng. Geol. 22 (2), 109–126. doi:10.1016/0013-7952(85)90042-0
Hvorslev, M. J. (1949). Subsurface exploration and sampling of soils for civil engineering purposes.
Jafari, N. H., Harris, B. D., Cadigan, J. A., Sasser, C. E., Day, J. W., Kemp, G. P., et al. (2019). Wetland shear strength with emphasis on the impact of nutrients, sediments, and sea level rise. Estuar. Coast Shelf Sci. 229, 106394. doi:10.1016/j.ecss.2019.106394
Jafari, N. H., Harris, B. D., and Stark, T. D. (2018). Geotechnical investigations at the caminada headlands beach and dune in coastal Louisiana. Coast. Eng. 142, 82–94. doi:10.1016/j.coastaleng.2018.04.014
Kolb, C., and Saucier, R. (1982). Engineering geology of new Orleans. Case Hist. Eng. Geol. 5, 75–93. doi:10.1130/REG5-p75
Kolb, C. R., Smith, F. L., and Silva, R. C. (1975). Pleistocene sediments of the new Orleans-Lake Pontchartrain area. Waterw. Exp. Stn.
Kolb, C. R., and Van Lopik, J. R. (1958). Geology of the Mississippi river Deltaic Plain southeastern Louisiana. United States Army Corps of Engineers.
Koloski, J. W., Schwarz, S. D., and Tubbs, D. W. (1989). Geotechnical properties of geologic materials. Eng. Geol. 1, 19–24. in Washington.
Ladd, C. C., and DeGroot, D. J. (2004). Recommended practice for soft ground site characterization: arthur Casagrande Lecture. Cambridge, MA, United States: Massachusetts Institute of Technology.
Lefebvre, G., and Poulin, C. (1979). A new method of sampling in sensitive clay. Can. Geotechnical J. 16 (1), 226–233. doi:10.1139/t79-019
Long, M. (2006). Sample disturbance effects on medium plasticity clay/silt. Proc. Institution Civ. Engineers-Geotechnical Eng. 159 (2), 99–111. doi:10.1680/geng.2006.159.2.99
Lunne, T., Berre, T., and Strandvik, S. (1997). Sample disturbance effects in soft low plastic Norwegian clay. in Symposium on recent developments in soil and pavement mechanics, Rio de Janeiro, Brazil.
Mesri, G. (1975). Discussion of “New design procedure for stability of soft clays”. J. Geotechnical Eng. Div. 101 (4), 409–412. doi:10.1061/ajgeb6.0005026
Mesri, G., and Castro, A. (1987). Cα/Cc concept and Ko during secondary compression. J. Geotechnical Eng. 113 (3), 230–247. doi:10.1061/(asce)0733-9410(1987)113:3(230)
Robertson, P. K., and Cabal, K. L. (2015). Guide to cone penetration Testing for geotechnical engineering, gregg drilling and testing. Signal Hill, CA, United States: Inc.
Saucier, R. T. (1994). Geomorphology and Quaternary geologic history of the lower Mississippi valley, US army engineer waterways experiment station.
Stark, T. D., and Delashaw, J. E. (1990). Correlations of unconsolidated-undrained triaxial tests and cone penetration tests. Transp. Res. Rec. (1278).
Terzaghi, K., Peck, R. B., and Mesri, G. (1996). Soil mechanics in engineering practice. John Wiley and Sons.
USACE (2012). Hurricane and storm damage Risk reduction System design guidelines. New Orleans Dist. Eng. Div.
Wei, L., Pant, R., and Tumay, M. (2010). Evaluation of undrained shear strength of soft New Orleans clay using piezocone. in Proceedings of the 2nd international symposium on cone penetration testing. Huntington Beach, CA, United States: ISSMGE.
Keywords: sample size, geology, cone penetrometer test, embankment, construction
Citation: Ulloa HO, Ramirez A, Jafari NH, Harrouch I and Barth B (2024) Assessing the impact of sample size and geology on earthen embankment design and construction. Front. Built Environ. 10:1279383. doi: 10.3389/fbuil.2024.1279383
Received: 17 August 2023; Accepted: 15 April 2024;
Published: 13 May 2024.
Edited by:
Mounir Bouassida, Tunis El Manar University, TunisiaReviewed by:
Zulqarnain Sajid, University of Technology Petronas, MalaysiaAbedalqader Idries, Langan engineering and environmental services, United States
Copyright © 2024 Ulloa, Ramirez, Jafari, Harrouch and Barth. This is an open-access article distributed under the terms of the Creative Commons Attribution License (CC BY). The use, distribution or reproduction in other forums is permitted, provided the original author(s) and the copyright owner(s) are credited and that the original publication in this journal is cited, in accordance with accepted academic practice. No use, distribution or reproduction is permitted which does not comply with these terms.
*Correspondence: H. Omar Ulloa, b21hci51bGxvYUBjbWMuY29t
†Present Address: H. Omar Ulloa, Geopier, Davidson, NC, United States; Alex Ramirez, Stantec, New Orleans, LA, United States; Ignacio Harrouch, Stantec, Baton Rouge, LA, United States