 Linus Paul Schmitz
 Joschua Gosslar
 Evelien Dorresteijn2
- 1Institute for Structural Design, Technische Universität, Braunschweig, Germany
- 2Institute for Building Materials, Concrete Construction and Fire Safety, Technische Universität, Braunschweig, Germany
- 3Deaprtment of Materials Engineering, Technical University of Munich, Munich, Germany
Rammed earth is a construction material with a long history of traditional manufacturing. Due to its low environmental impact, positive impact on indoor climate and completely recyclable nature, its demand is also increasing in modern construction industry. However, as a consequence of the predominantly manual manufacturing processes, the production of rammed earth components is both inefficient and costly. Through the implementation of automated and robot-aided fabrication processes in the field of rammed earth construction, the opportunity to advance the digitalization of the field can raise to a new level. In this paper, general studies on the interrelation of process and material parameters and their influence on the compaction results were conducted as a basis for the development of a prototypic robotic manufacturing process. The results show that reducing the layer height can significantly decrease the impact energy. Additionally, it was shown that there is a minimum number of strokes and a minimum ramming frequency required for sufficient compaction. Furthermore, a possible workflow for a specific control of the required dry density through variation of the compaction energy with regard to the present moisture content was identified.
1 Introduction
The construction sector is responsible for about 40 percent of the global energy demand. This is due to the processing of materials and their transport to the construction site, as well as the construction, operation and demolition of the buildings themselves (United nations environment program, 2009). Because of the climate crisis and the limitation of natural resources, the construction industry is forced to find alternative materials and construction processes (Khadka and Shakya, 2015). For this, rammed earth offers the potential of a sturdy and environmentally friendly option (Windstorm and Schmidt, 2013). In addition to the possible utilization of exclusively natural components, it is noteworthy that clay, which acts as the binder in earthen construction, is readily available in many parts of the world and can be effectively processed locally. This avoids costs as well as green-house gas emissions due to transport. Likewise, structures can be easily deconstructed and recycled at the end of their use-phase as long as no additives such as cement have been used (Khadka and Shakya, 2015; Giuffrida et al., 2019; Niroumand et al., 2021). In addition, earthen materials possess various advantages in terms of building physics: Massive earthen components provide excellent regulation of indoor climate due to a high thermal mass, as well as its open pore-structure (Giuffrida et al., 2019). Compared to concrete and masonry construction, rammed earth offers lower mechanical strength between 2–4 MPa. However, the lower strength in combination with very low embodied energy could outweigh materials with high strength and high embodied energy in the future. Possible applications include lower residential buildings with one to three stories (Hall and Djerbib, 2004a). Certainly, the manufacturing process remains predominantly artisanal, leading to construction costs that are disproportionately high for a material that is widely available and relatively inexpensive (Minke, 2021). In addition to the compaction work itself, the labor intensity for formwork related works is excessively high with current building techniques, even though the formwork is needed only in the moment of compaction (Keable, 2005). In order to counter these problems, initial approaches have already been developed for an automation of the production, process, for example, through the use of robots (Gomaa et al., 2023).
In our research, a robotic and fully automated process for building structural wall elements, called Robotic Rammed Earth (RRE), is being investigated. The main approach is to replace the time-consuming formwork related work with an active slip form combined with automated feeding and compaction processes (Kloft et al., 2023). In Figure 1 the setup is shown, consisting of a six-axis robot arm suspended from a three-axis gantry, guiding the slipform- and compaction unit (left) and a five-axis, CNC-controlled hopper for controlled feeding of loose material (right). Compared to traditional manufacturing, where the layer height is up to 15 cm (Hall and Djerbib, 2004b; Venkatarama Reddy and Prasanna Kumar, 2010), in the robotic rammed earth process this is reduced significantly in order to reduce the required impact energy of the compaction process. This leads to a substantial reduction of the formwork loading (Schweiker et al., 2021; Kloft et al., 2023). The size of the slipform could be reduced to an absolute minimum that only the area of the active compaction is supported. Also, it is possible to achieve a high and constant compaction quality by an automated process (Kloft et al., 2023).
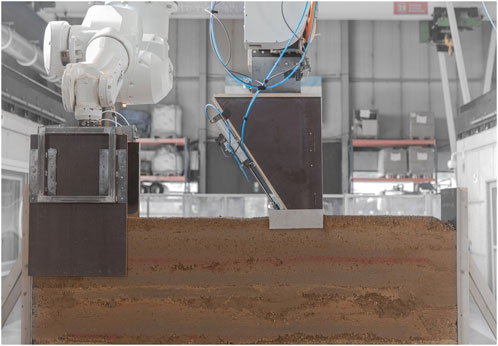
FIGURE 1. Robotic Rammed Earth process at the Institute of Structural Design of Technische Universität Braunschweig (Schweiker et al., 2021).
As a result of the radical change in the production process, current knowledge about the manufacturing of rammed earth has to be revised and complemented by customized experimental tests. Also, due to the digitalized process, basic input data is needed. This stands in contrast to current rammed earth practice, which is mostly based on the verbal transmission of knowledge with loose descriptions of geometric relations (Ávila et al., 2020) and characterized by a lack of standards (Morel et al., 2021; Kloft et al., 2023). To achieve an efficient and optimized process, it is necessary to first determine the required compaction energy to achieve the desired density in the material. Additionally, the minimum impact energy necessary for a sufficient compaction must be identified. Following this logic, investigations into the compaction process will be undertaken within the scope of this research. The test results should give initial information about the compaction behavior in RRE and provide valuable data for further improvement of the general process. Likewise, relevant process parameters, their ranges and their influence on the compaction results are examined and defined in more detail. This will provide an initial foundation for further investigations, advancing the development of a robust manufacturing process with controllable and constant compaction quality.
2 Principles of earth compaction
The structural principle of the rammed earth technique is based on the concept of soil compaction. By applying compaction energy within the confines of a formwork, the loose soil is densified. Rammed earth material can be described as a three-phase system which consists of solid particles, water and air. The compaction process brings the particles closer together as the air is pressed out, resulting in a reduction of volume and, consequently, increased density (Reddy, 2022). Which is of importance as an increased density can lead to an increased compression strength. The compaction process is known from various applications of geotechnical engineering, such as embankments or pavement base courses (Volhard and Ulrich, 2002). Although the compaction tools, such as vibratory rollers differ (Reddy, 2022), the theoretical knowledge on the behavior of earthen materials in the context of construction can be transferred (Giuffrida et al., 2019; Niroumand et al., 2021). The amount of water bound in the material is of particular significance since water absorbed by the clay particles affects the material’s plasticity, making compaction easier. Meaning, the water acts as a sort of lubricant (Attom, 1997; Reddy, 2022). Through subsequent drying, the material finally acquires its full strength (Jaquin et al., 2009).
In order to be able to achieve the highest possible density through the compaction process, it is very important to understand the interaction between various soil parameters and their reciprocal influence. The key parameters are moisture content, compaction energy and the individual material properties (El Nabouch, 2017; Ávila et al., 2020; Reddy, 2022). In Figure 2A the interrelation between material properties and process variables are illustrated schematically.
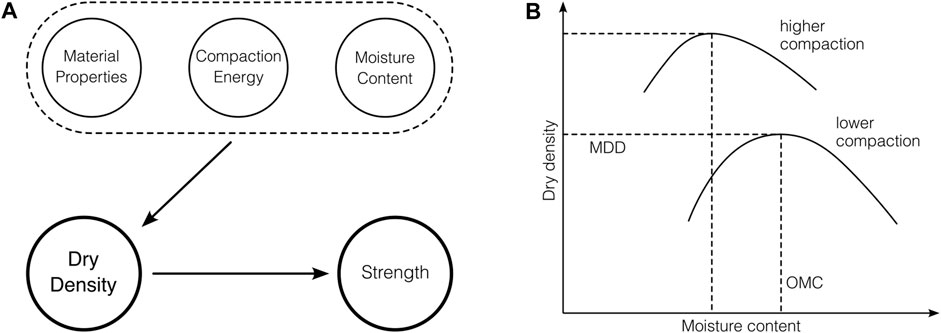
FIGURE 2. (A) Interconnection diagram (B) Schematic Proctor curve according to (Reddy, 2022).
The Proctor test is the most common method in the field of soil mechanics to classify the compaction behavior of an earthen material. Originally, the test was developed to classify the quality of compaction works in road construction. Since the properties of the treated material and the principle of ramming compaction are comparable, it is also suitable to be used in earthen construction (Schroeder, 2010). The test concept of the Proctor test is already used in the broad technical literature for rammed earth (Volhard and Ulrich, 2002; El Nabouch, 2017). It provides the optimum water content (OMC) for a soil to reach the maximum dry density (MDD). The tests makes use of iterative compaction of soil samples with increasing moisture content in a fixed volume and with a clearly defined number of strokes and layers (Abhilash et al., 2019). In Figure 2B, typical Proctor curves for two different compaction energy levels are shown schematically.
It can be observed that for an increasing water content in the material, the achievable dry density first increases to a certain peak and then decreases again. This tipping point is indicated as the Maximum Dry Density (MDD) for a specific compaction energy, which is reached at the so-called Optimum Moisture Content (OMC) (Reddy, 2022). In practical terms, when approaching the highest point of the compaction curve in relation to the dry density axis, the capillary strength of the clay impedes compaction. Meaning, the amount of compaction energy applied is not sufficient to fully disrupt the structure of the clay (Schroeder, 2010). When further increasing the moisture content, compaction is limited by the presence of pore water or capillary tensions, so the compactor bounces back instead of achieving full compaction (Schroeder, 2010). It is also known that a higher compaction energy results in a higher MDD, which can only be achieved at a lower OMC (El Nabouch, 2017). For the standard Proctor test, the soil is compacted with a total compaction energy of 594 kJ/m³, while in a modified Proctor test the total compaction energy amounts to 2,653 kJ/m³ (Author Anonymous, 2012).
3 Materials and methods
3.1 Process parameters
Previous to any practical works, robotic parameters were mapped, investigating their reciprocal influence regarding the compaction process. The input parameters directly influencing the level of compaction are the layer height, the impact energy and the travel speed. These three parameters combined result in the compaction energy, that is applied to the material. In the following paragraphs they will be explained individually.
3.1.1 Impact energy
Impact energy describes the kinetic energy applied to the material in one single stroke, and is of great importance in RRE. Due to the lateral pressure on the formwork during the compaction process, the formwork is loaded. The amount of pressure results from the increment of the individual compaction strokes (Schroeder, 2010; Kloft et al., 2023). Thus, the impact energy becomes an important factor when targeting to minimize the size and weight of the formwork as much as possible. Consequently, the impact energy must also be reduced in order to unload the formwork and raise efficiency. Nonetheless, the impact should not be excessively low; it must still possess enough strength to apply adequate compaction energy across the entire layer height. Due to many unknown parameters, it is difficult to quantify a specific value for the impact energy applied by a hand guided pneumatic rammer. An approach for calculating the resulting impact force based on the piston area is provided by Burroughs (Burroughs, 2010). Making use of this procedure in combination with the stroke height, the impact energy of pneumatic rammers was estimated. The currently used rammer for the RRE process is much smaller than typically used rammers in construction. It should be noted that losses, e.g., due to friction, are not considered.
The compaction with the Proctor-hammer, as well as hand guided rammers, can be calculated by the equation of a falling weight. However, it must be considered that depending on the individual strength of the worker the acceleration of the weight can be raised significantly. Therefore, it is proposed to include gravity twice. In Table 1 the different impact energies are listed for comparison.

TABLE 1. Comparison of the impact energy of different rammer types.
Thus, it can be assumed, that the impact energy delivered by the 4.5 kg hammer of the Proctor test is roughly equivalent to that of the pneumatic rammer used in the current compactor of the RRE process. This will be later considered when choosing the exact parameter levels. It is also clear that the impact energy is already significantly lower than that generated by conventional compaction equipment. The vibratory plate was left out of this consideration, as it is a different compaction method.
3.1.2 Layer height
The layer height describes the height of each compacted layer. All layers combined make up the printed rammed earth volume. Before each new layer can be compacted, the loose material is applied during the charging process. Here, the layer height can be customized by the amount of material poured out. In the context of the RRE process, the choice of the exact layer height can be influenced by several parameters. On one hand, a thinner layer reduces the necessary compaction energy per run, thereby minimizing the impact on formwork loading. This, in turn, allows for ramming with a lower impact or, alternatively, permits the application of more compaction energy per volume. On the other hand, thinner layers result in higher total layer numbers for a component. This increases the required production time, not least due to the higher number of feeding runs required. Likewise, the layer height cannot be reduced arbitrarily, since the maximum grain size becomes the limiting factor with coarser material compositions. The results of initial tests indicate that if the ratio of layer height to grain size is too low, the compression strength may be affected (Kloft et al., 2023).
3.1.3 Travel speed
The travel speed indicates how fast the robot guides the compaction tool along the component surface. Speed and compaction energy with a defined ramming frequency exhibit an inverse relationship. Slower travel speed results in higher compaction energy introduced into the material per run, whereas faster speed leads to a reduction in introduced compaction energy.
Since the experiments were performed in a manual setup, an alternative equivalent parameter had to be found to simulate the compaction by a moving rammer. Therefore, in the further course of the documentation, the reference used will be the number of strokes at one spot. When comparing these two values, a high number of strokes means a slow speed, while a small number of strokes means an accordingly faster speed.
3.1.4 Compaction energy
The value of the compaction energy is a main parameter for the production of rammed earth components and can be used to control the degree of compaction. This describes the amount of effort which is expended to compact the material in order to increase the density. The total applied compaction energy can be influenced by varying the layer height, impact energy and travel speed, or the number of strokes respectively. It is important to balance the parameters in a way that the compaction success is as high as possible. At the same time, however, the process should be kept as efficient as possible. The compaction energy CE is described as the total applied energy per volume V (Burroughs, 2010; Reddy, 2022). For the Proctor experiment, the following equation provides the compaction energy where EI is the impact energy, nL is the number of layers, nS is the number of strokes and V is the volume of the compacted sample.
For the automated process with a pneumatic ramming device, which is guided by a robot along the manufactured building component, a slightly different equation is obtained. Considering the travel speed vT, the frequency f of the rammer, the width of the compacted area bA and the layer height hL the volume-related compaction energy is calculated as follows.
When it comes to specific literature, the comparison of the compaction energy on the construction site and in the laboratory is a discussed topic. The deviation is relevant because the quality and thus also the mechanical properties of the material are closely related to the manufacturing method or, respectively, the intensity of it. Also, the OMC for the optimal manufacturing results depends on the amount of compaction energy. Some estimate the compaction energy achieved on-site at around 1,500–2000 kJ/m³ (Abhilash et al., 2019). Elsewhere, the production methods are roughly compared with the proctor energy levels known from soil mechanics. The standard Proctor level of 590 kJ/m³ would be equivalent to manual processing and the modified test level of about 2,700 kJ/m³ would correspond to processing with pneumatic rammers (Burroughs, 2010; Ávila et al., 2020).
3.2 Material parameters
Also essential for the manufacturing process is the composition of the material itself, with the main influencing factors being the grain size distribution as well as the clay and moisture content. The extent to which the material can be processed to a load-bearing component depends on these parameters. For a robust and adaptable manufacturing process, these factors should not serve as exclusion criteria; however, understanding the effects of individual parameters is crucial for making necessary process adjustments.
3.2.1 Material composition
Earthen materials consist of particles in different sizes which are aggregates (sand and gravel), silt and clay minerals, (Reddy, 2022; Morel et al., 2021; Ávila et al., 2020; Schweiker et al., 2021). For the best compaction results, the material should have a well graded distribution, consisting of fine and coarse portions (Houben and Guillaud, 1994; Hall and Djerbib, 2004a; Arrigoni et al., 2017). With a theoretically optimum distribution, the voids between larger particles are filled with particles of decreasing size. This leads to a maximum density which in turn results in increased strength (Matthew et al., 2012). Since the clay in the material acts as a natural binder, special attention is given to it in the general investigations. The clay particles have a very large specific surface area, which is why they are the main absorber of the contained water. Therefore, the clay content has a significant influence on the OMC as well as the mechanical properties (Liu and Tong, 2017).
However, since only one material mixture is used in the investigations of this article, the clay content and the composition will not be assessed more deeply in the experiments. The material used for the experiments within this research is a common rammed earth mixture available in the industry. The maximum grain size is 22 mm and the raw material has an approximate particle density of 2,200 kg/m³. The clay content is estimated to be about 10%–12% (Okologisch Bauen. Natuürlich mit Lehm, 2024).
3.2.2 Moisture content
The moisture content is a very decisive factor for rammed earth construction. On the one hand, the compaction process is mainly determined by the moisture content, but on the other hand, also from a practical point of view, the moisture content has an influence on the workability of the material. The moisture content is defined as the ratio of the water to the mass of the dry material (Schroeder, 2010). For a given compaction energy, the dry density will reach a maximum when the material is at the OMC. In practical cases, however, the perfect moisture content is at the discretion of the worker. For example, the German guidelines “Earth building rules” recommend that the material are processed in an earth-moist state (Volhard and Ulrich, 2002). Since the optimum moisture content is highly dependent on the processing method and the material composition used, it is difficult to establish specific guideline values. However, even if the moisture content is at the optimum for a relatively low compaction energy, the material could practically still be too wet.
3.3 Test methods
3.3.1 Setup and test procedure
The experimental concept of this research involves investigation on the influence of the abovementioned process relevant parameters on the compaction result. Therefore, the dry density was the chosen evaluation criterion in the experimental concept.
As a basis for the experimental setup, the proctor test setup is used, it consists of a 12.5 cm high, cylindrical steel mold with a diameter of 15 cm and a Proctor-hammer (Figure 3A). The hammers have a weight of 4.5 and 15 kg with a maximum drop height of 45 and 60 cm, respectively. By adding a clamp to the hammer, the drop height can be adjusted manually to achieve different impact energies. The 4.5 kg-hammer is used for most of the experiments. For specimens requiring a higher impact energy, the 15 kg-hammer is used. To avoid influences through the different sized heads of the hammers, an additional top plate is used for compacting the earth. By putting the plate in between during compaction, the impact energy is applied over the entire surface, regardless of which hammer is used. Figure 3B shows the test setup in the laboratory.
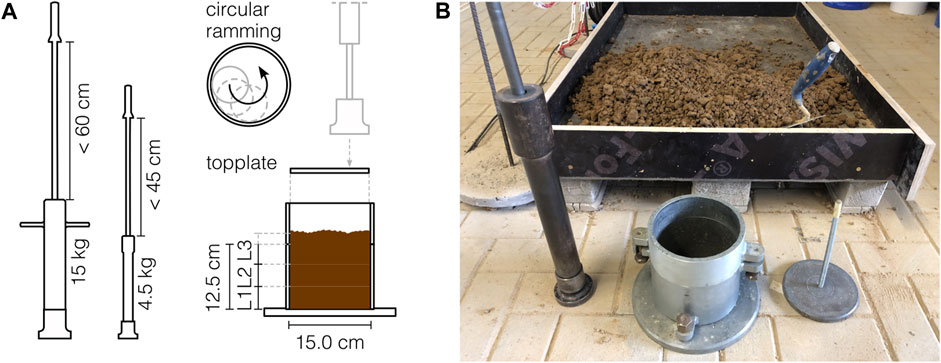
FIGURE 3. (A) Principle of experimental setup (B) Setup at the laboratory.
To precisely determine the material moisture content, the material is dried with an oven at about 100°C, then the moisture content is measured and selectively remoistened to the desired level. Ready-mixed material is stored in sealable buckets and covered with foil to keep the moisture content as constant as possible. Immediately before the manufacturing of a sample, the material is poured out on a platform and again mixed thoroughly. The Material is then filled into the mold and the required number of strokes are applied consequently in a circular motion, using the proctor hammer. Following this procedure, the required number of layers are filled and compacted. After all layers have been compacted, the top piece is removed and the remaining protruding material is cut off with a metal ruler. In this procedure, achieving a flat surface is crucial to ensure uniform volumes among the various samples.
3.3.2 Moisture content monitoring
Given the significance of moisture content in influencing dry density results, special emphasis was placed on it during the experiments. According to the standard test procedure, the samples would be crushed after weighing in order to determine the moisture content directly (Author Anonymous, 2012). However, since the samples were stored for subsequent compressive strength testing, this step was neglected. Instead, the moisture content was monitored during the tests for each sample separately. The dry densities of the samples could be determined and classified accurately by drying material samples in an oven and determining the moisture content by relating the water content to the dry weight with the following equation.
3.3.3 Dry density and compressive strength
After each sample is compacted, the dry density has to be determined which is done by weighing the moist sample mm. The theoretical dry weight md of the sample is calculated by subtracting the water content w. The dry density ρd is then calculated in relation to the volume V (Author Anonymous, 2012).
For a final evaluation, the main criterion of compressive strength would have to be tested. However, initially, the dry density will be used as criterion of the compaction quality. The results will be evaluated based on the compressive tests and findings from literature, applying the commonly approved indicator, the relationship between dry density and compressive strength (El Nabouch, 2017; Abhilash et al., 2019). It is assumed, that specimens with a higher density also have a higher compressive strength. Generally, the dry density ranges from about 1,700 up to 2,200 kg/m³ (Hall and Djerbib, 2004a; El Nabouch, 2017; Ávila et al., 2020), in some cases even up to 2,400 kg/m³ (Röhlen and Ziegert, 2020). Compressive strength values from 1.5 to 4.0 N/mm2 are specified for these cases (Röhlen and Ziegert, 2020). Others give significantly lower values, between 1.5 and 2.5 N/mm2, with exceptions explicitly mentioned (Ávila et al., 2020). The large scatter of compressive strength results can be explained with a lack of standardization. There are many factors that affect the results, such as the size and shape of the samples, the compaction method, and the test procedure itself (Ávila et al., 2020).
3.4 Experimental program
3.4.1 Concept of the investigations
The experimental concept comprises three phases. While the setup and procedure of the compaction experiments remain consistent across all phases, the objectives vary, and different parameters are altered. The range and the selection of the parameters used will be explained in the following sections. A graphical overview on the experimental program is provided in Figure 4. This illustrates the parameters considered and marks the extent to which they were varied or fixed in the individual test phases. The parameter of strokes per layer holds particular significance, it is varied in all three phases but depends on other variable parameters in order to regulate the overall compaction energy level.
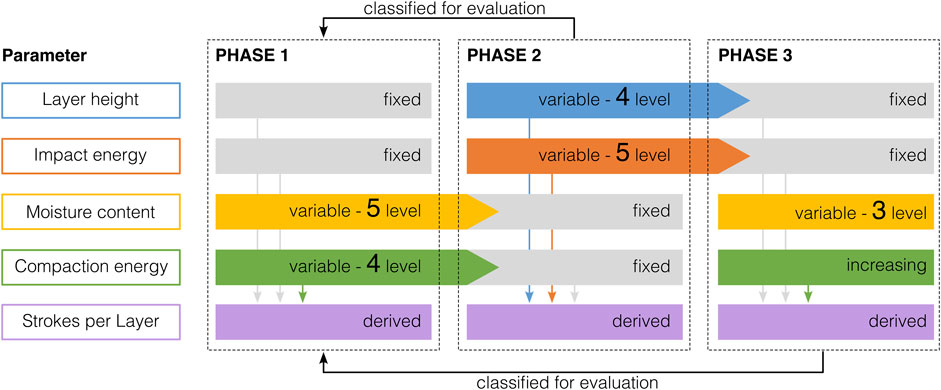
FIGURE 4. Experimental program and parameter variation strategy.
All parameter variations described in the following sections are listed in the Table A1. The samples are marked uniformly so that they can be clearly assigned later on. The labeling results from the respective phase and test series to which they belong. For example, the third sample of the second test series from Phase 2 would be labeled ‘P2.2.3’ accordingly.
3.4.2 Phase 1–effect of moisture content and compaction energy
In the first phase, the goal was to produce Proctor curves for the existing material according to the standardized procedure. The test series conducted here, serve to determine the OMC and the corresponding MDD for each compaction energy level. Additionally, the behavior of the MDD as compaction energy increases is examined. This will provide an initial insight into the minimum required and maximum suitable compaction energy. Furthermore, the compressive strength of the dried proctor samples was determined.
Both the standard of 594 kJ/m³ and the modified compaction energy of 2,653 kJ/m³ level were considered. This decision was made to ensure that the trials are as close as possible to the proven standard procedure. Thus, the initial Proctor curves could be used as a reference to classify the results obtained in the following two test phases. In addition, two further energy levels, each a reduced variant with a compaction energy of 297 and 1,619 kJ/m³, were investigated. These intermediate levels were added to have a broader and more diverse test area. The standard and modified Proctor levels are similar to the standard procedure. Accordingly, the reduced energy levels were realized by reducing the number of strokes per layer.
3.4.3 Phase 2–effect of process parameters at constant compaction energy
In the second phase the influence of different impact energies and layer heights on the compaction results will be investigated. For an unaffected comparison, the test series is performed with a constant compaction energy and moisture content. The parameters of layer height and impact energy are varied in several levels and then combined in every possible constellation. To keep the total compaction energy the same for each sample the third parameter of strokes per layer is varied accordingly.
The aim is to test whether the resulting dry density is influenced if a constant compaction energy is applied with a significantly reduced impact energy. In case of a negative influence this would lead to the assumption, that the impact is too low to reach the bottom of the layer for a successful compaction. The same effect is tested by varying the layer height. In this case another possible effect could occur. With decreasing layer height for a fixed volume height, the number of compaction passes increases. At this point the question arises if the underlying layers will be affected (positively) by compacting overlying layers.
For the layer height the levels are chosen to be 2.5, 3.1, 4.2 and 6.3 cm. These values are obtained by dividing the total height of the test mold of 12.5 cm by the number of layers, which are 5, 4, 3 and 2 respectively. A layer height of under 2.5 cm is not suitable due to a maximum grain size of 22 mm. The range of layer heights is similar to previous investigations on RRE.
The impact energies are varied at levels of 5, 10, 20, 40 and 80 J. The values were chosen this way to have a wide parameter range with a focus on lower values. For the impact energies from 5 to 20 J, the 4.5 kg-hammer is used with a corresponding drop height. Similarly, for the 40 and 80 J levels the 15 kg-hammer is used. In the context of traditional manufacturing, the maximum impact of 80 J would be in line with a hand-held pneumatic rammer. The value of 20 J, on the other hand, would more closely match the edge rammer currently used in the RRE process.
The tests will be performed only at one fixed compaction energy level, which is chosen based on the results of the first phase. According to that, the moisture content is set to the optimum of the selected compaction energy level.
3.4.4 Phase 3–required compaction energy for a minimum dry density
In the last experimental phase, it is planned to evaluate an operational area for the required compaction energy depending on the minimum required dry density and different moisture contents. The target is to provide a graphical solution process based on real test data for adjusting the robot parameters for an efficient manufacturing process. Therefore, the focus is set on the successive increase of strokes per layer, respectively the compaction energy. Starting with only two strokes per layer were increased to a number of 200, which corresponds to a compaction energy of 2,716 kJ/m³ (for a number of three layers). Initially, the steps are positioned closer together to achieve a clearly discretized curve. Subsequently, the steps are enlarged to cover a broader range.
To obtain a suitable range for a robust manufacturing process, several moisture contents are also taken into account. Thus, three different moisture content levels have been chosen, which can be described as very dry, intermediate and wet. The exact values are set depending on the borders of workability of the material. To avoid an excessive increase of samples the parameters of impact energy and layer height are fixed for the test series. The exact values chosen depend on the results of the second phase of the test series.
4 Results
4.1 Phase 1–effect of moisture content and compaction energy
4.1.1 Dry density
In the first experimental phase, Proctor tests were undertaken for the four different compaction energy levels. For each level, five samples with increasing moisture content have been compacted by a fixed procedure.
Figure 5A shows the effect of the compaction energy on the on the appearance of the Proctor samples. The effect of higher compaction due to increased compaction energy is evident in the texture of the samples. The ones subjected to lower compaction energy exhibit more voids, ultimately resulting in lower density. The effect of the moisture content is shown in Figure 5B. Despite identical compaction energies applied to each sample in this series, the impact of increasing moisture content is evident. The surface becomes more plastic of the specimen with the highest moisture. Notably, the sample with a moisture content of 12.9 wt%, the moisture content in the material is so pronounced that the sample deforms under its own weight. This phenomenon is especially distinct in series with lower compaction energy.

FIGURE 5. Effect of the (A) compaction energy and (B) the moisture content on the appearance of the proctor samples.
In Figure 6A the results of the four Proctor test series are shown. The measured values of the material moisture deviate to different extents from the intended values. This is due to the manual mixing and the inhomogeneous material consistency. The achieved dry densities are plotted depending on the specific moisture content of the sample. With an increase in moisture content, the dry density rises to a maximum before subsequently declining. Likewise, it can be recognized that with increasing compaction energy level the maximum of the dry density increases. At the same time, the OMC decreases. This causes the curves representing higher levels of compaction energy to move in positive y- and negative x-direction. The black line represents the zero-air void line (ZAV), which represents a saturation of 100%. The compaction curves will approach this line as the moisture content increases above the optimum (Schroeder, 2010), which can be confirmed. It is also noticeable that the curves of the higher compaction energy have a more pronounced peak compared to the curves representing a lower compaction energy. In conventional manufacturing, this means that the operational area for production is much smaller with high compaction energy. From the maxima of the curves for the reduced standard (297 kJ/m³), standard (594 kJ/m³), reduced modified standard (1,619 kJ/m³) and modified (2,653 kJ/m³) compaction energy levels, it is possible to derive the maximum dry density of 2,009, 2,075, 2,155 and 2,187 kg/m³ and the corresponding OMC of 10.9, 10.3, 7.1 and 6.5 wt%, respectively. Where the values for the most test curves show a clear peak for the OMC and MDD, the results for the standard level show a flatter peak.
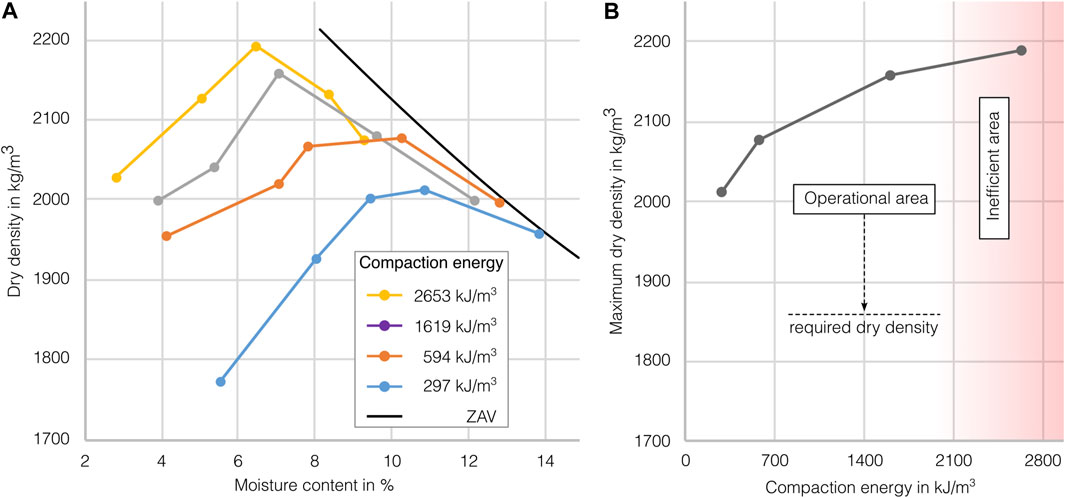
FIGURE 6. (A) Proctor curves for different compaction energy levels (B) Compaction energy and the corresponding maximum dry density.
If the achieved maximum dry densities are plotted against the compaction energy, the result is a gradually flattening ascending curve, see Figure 6B. With increasing compaction energy, the maximum achievable dry density also increases. However, with increasing energy, the resulting gain in dry density decreases, and shows an asymptotic, which means that it approximates a value, which is the random close packing (RCP) of the material particles. Because of the described growing behavior, at a certain point it becomes ineffective to increase compaction energy further. For example, the maximum dry density between the reduced standard and the standard level increases by 3%, from 2,009 to 2,075 kg/m³, which is about 66 kg/m³ higher. This was realized by increasing the compaction energy by 200%, from 297 to 594 kJ/m³. Between the reduced modified and the modified level, the increase of dry density is only from 2,155 to 2,187 kg/m³. Though, the compaction energy here was raised by 1,034 kJ/m³. Thus, the additional input was more than three times higher while the achieved increase in dry density was only about 1.5%. In conclusion drawn from this curve, it can be stated that between the reduced modified and modified compaction energy levels, the ratio of energy to yield starts to deteriorate significantly. Nonetheless, it should be noted that with all compaction energy levels very appropriate densities have been achieved.
4.1.2 Compressive strength
Figure 7 displays the results of the compressive strength test on samples of the standard Proctor and the reduced modified Proctor test. These results should be seen as indicative as the test was performed once per sample. Nevertheless, the compressive strength results generally follow the Proctor curve, which proofs that a higher dry density leads to a higher compressive strength. This relationship between dry density and compressive strength is also found in the literature (El Nabouch, 2017; Abhilash et al., 2019). Furthermore, the individual compressive strength values are satisfactory. According to the German guidelines “Earth building rules”, a minimum of 2 N/mm2 is required for rammed earth structures, and all specimens meet this requirement. Considering the values from the literature and this compression test series, dry densities from around 2000 kg/m³ are considered good.
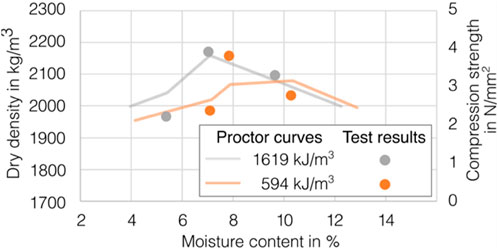
FIGURE 7. Effect of moisture content and compaction energy on compressive strength of rammed earth.
4.1.3 Workability
Besides material compaction, consistency is crucial for efficient manufacturing. In Figure 8 different degrees of material moisture are shown, ranging from dry to wet. As already found, for very dry mixtures, such as 3 and 5 wt% moisture, higher compaction energies are necessary. Even if processability during the process is good with exceptionally dry material conditions, it is observed that segregation occurs. The smaller particles partially settle to the bottom, while the larger grains tend to stay on top. This could lead to problems in the process flow before and during the feeding process. A moisture content of around 7 wt% is the OMC for the reduced modified compaction energy level, which is assumed to be an efficient compaction energy. The workability can be classified as good with reduced tendency to segregation. It was observed that, even with compaction energies exceeding the OMC, i.e., for samples with a moisture content higher than the OMC, the material could still be compacted well. The limitation lies in the inability to achieve higher densities under such conditions.
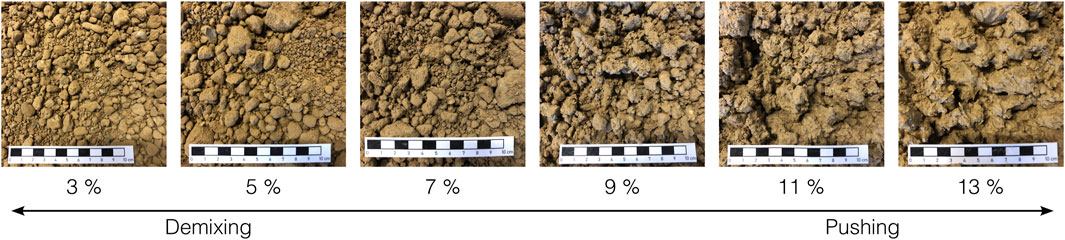
FIGURE 8. Different moisture contents of the material from dry to wet.
A moisture content of 9 wt% is the OMC of the standard compaction level. At this moisture level, the material starts aggregating into smaller lumps, with the advantage that even the largest aggregates in the uncompacted material already have some clay particles adhering to them. As a result, there is virtually no segregation of the material, when mixed carefully. However, at this moisture content level, when higher compaction energies are applied, problems arise because the material is only plasticly deformed by the compactor after the maximum density is achieved. This implies that additional strokes cause the material to move or shift. As a result, when the moisture content further increases, the material becomes more difficult to process. Above 11 wt%, the material appears almost wet and approaches the saturation limit, making it unsuitable for use.
4.2 Phase 2–effect of process parameters at constant compaction energy
The second phase of investigations, focusses on the variation of the parameters layer height, impact energy and the number of strokes. Based on the results of the first phase, the following experiments were conducted at the reduced modified energy level of 1,619 kJ/m³ with a mean moisture content of 7.1 wt%. A rather high value was selected to simulate the experiments on a level with a higher compression strength than the absolute minimum. This is because the RRE process should be able to produce a compressive strength as high as possible. However, it was important to select a value which is still in a suitable range determined in the previous phase.
In Figure 9, the results are plotted for the calculated dry density and the corresponding moisture content. For comparison, the Proctor curve of the compaction energy level used, is shown as well. It can be seen that the dry density scatters around the curve of the standard Proctor test. By averaging the values of the dry density and the moisture content, the center of the scatter plot aligns closely with the Proctor curve. At first glance, this could lead to the assumption that there is no major influence of the investigated parameters. However, the scatter of values may still suggest some effect.
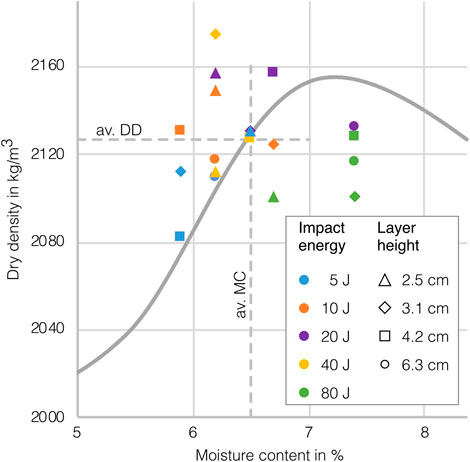
FIGURE 9. Classification of the results from P2 to the corresponding Proctor curve.
For a more detailed evaluation of the effect of these parameters, Figure 10A shows the effect of the layer height on the dry density individually. In order to identify the influence more clearly, the mean values were calculated. This shows that there is only very little effect. Comparing the results with regard to the standardized Proctor curve in Figure 9, each series consists of points below and above the reference curve. This confirms the assumption that the influence of the layer height in the compaction process is negligible. It is important to note, on one hand, that the investigated parameter range is very small. On the other hand, the layer heights in general are very low when compared to traditionally used layer heights.
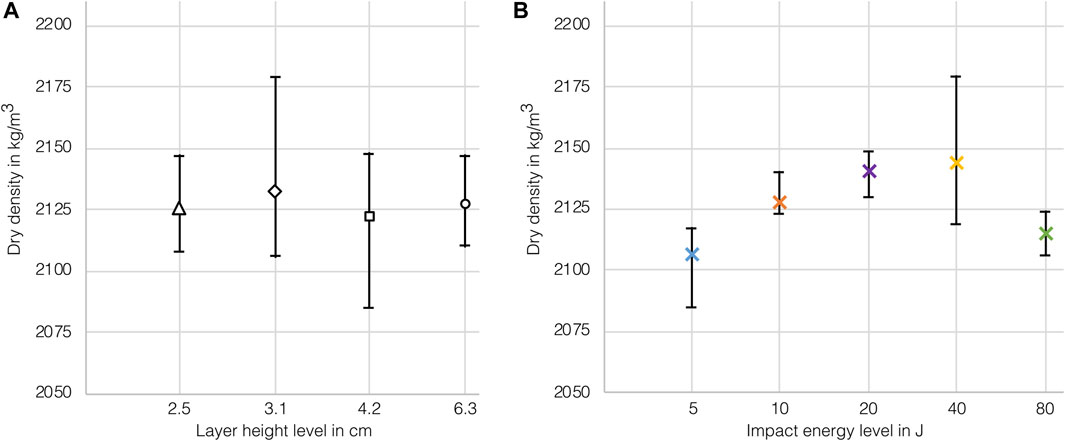
FIGURE 10. Distribution and mean values of dry density for (A) layer height and (B) impact energy levels.
In Figure 10B, the test results are plotted as variation of the dry density at different impact energy levels. Here a significant trend can be observed, with an increasing dry density at increasing impact energy up to 40 J. After that, the efficiency of compaction seems to drop. The highest dry densities were measured for the samples with an intermediate impact energy of 20 and 40 J. A further increase of the impact to 80 J results again lower dry densities. This can be explained by a very low stroke number as the sample with a layer height of 2.5 cm and an impact of 80 J per stroke has the lowest number of strokes per layer (nine). In conclusion, it seems, that an impact of 10–40 J will produce better results than a very high or low impact of 80 or 5 J, respectively.
The highest mean values are observed for 20 and 40 J. However, it is important to acknowledge that the scatter for the 40 J series is considerably high in comparison to the others. This elevated scatter is primarily attributed to the outlier just described. Despite this, the overall variation of values in this configuration is minimal. This suggests that the impact energy has a significant effect.
In consideration of Figure 9, it is evident, that the achieved dry densities for the highest impact are all below the reference curve, confirming the previous observations that the compaction with the highest hammer impact was the least efficient. Especially the measurement points for the 5J-impact are particularly close to the Proctor curve. With one further exception, the remaining points are located above the reference curve. In conclusion, it seems that the variation of the dry density due to different impact energyies on a fixed compaction energy level is not very high. Nevertheless, a slight trend can be determined.
As described in the previous section, the impact energy slightly influences the achievable dry density. In contrast to that the layer height tends to have no effect. But after that, the question remains as to what is the reason for it. A plausible explanation for the lower results of the 5- and 80J-impacts could be attributed to the corresponding stroke numbers. Figure 11, illustrates the various impacts based on the applied strokes per layer. The best results were achieved with about 35–75 strokes per layer. The stroke numbers for the 80J-impact samples of course were very low due to the fixed total compaction energy. Despite the fact that it is certainly possible to compact the entire layer height with high impact energy, the results are comparatively low. Also, the results for the 40J-impact are starting with lower dry densities. With the increase of strokes per layer, which is caused by the variation of the layer height, the results are increasing steadily. This leads to the assumption that for a successful compaction process there is a minimum number of impacts required. In addition to that and in the context of the RRE process, the layer height could still be used to optimize the stroke rate in the compaction process.
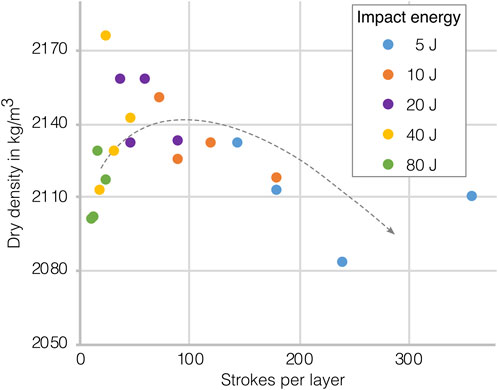
FIGURE 11. Stroke numbers per layer and impact energy.
4.3 P3–relation of compaction energy and moisture content
The third experimental phase was undertaken in order to implement the parameters into the RRE approach. The layer height and the impact energy were fixed. As the compaction is digitally controlled and monitored, it can be assumed, that the process runs with a constant impact energy per stroke. The best results in the previous phase 2 have been achieved by impacts of 20 and 40 J. For the RRE process however, the impact should be as low as possible due to the lateral loading of the formwork and the objective to reduce the end effectors weight. Therefore, reducing the impact energy to 10 J was considered a reasonable compromise. The layer height was set to an intermediate level of 4.2 cm.
4.3.1 Experimental study for increasing compaction energy
Figure 12A, shows the effect of the compaction energy on the dry density for three moisture contents; (1) dry (3.7 wt%) (2) intermediate (7.6 wt%) and (3) wet (8.9 wt%). All curves show an asymptotic growth, which means that the gradient steadily increases and approaches a plateau. Compared to the Proctor curves from phase 1 the results are all within the expected range. It is noticeable, that the higher the material moisture content, the stronger the curves rise in the beginning. However, the growth also decreases faster and the maximum value is reached earlier. Especially for the curve representing the wet material, the plateau is reached already at a compaction energy of about 600 kJ/m³, while the dryer mixes are still increasing at higher compaction energies.
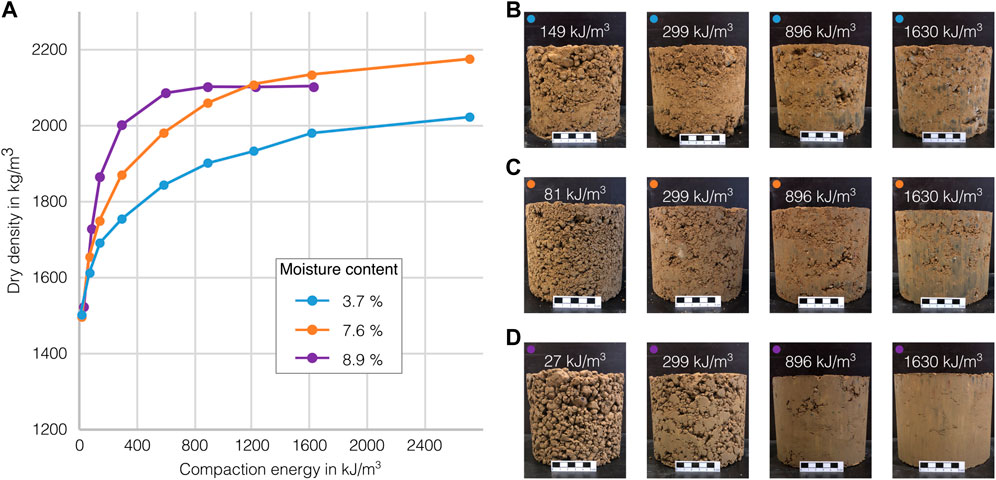
FIGURE 12. (A) Compaction curves for three different moisture contents and selection of samples of (B) dry (MC 3.7%) (C) intermediate (MC 7.6%) and (D) wet (MC 8.9%) series.
In Figures 12A–D selection of samples from each test series is shown. In the two drier test series, the first two samples (7.6 and 3.7 wt%) were not compacted enough to stay in shape. In the series with the wet material, on the other hand, two strokes per layer (6 in total) were already sufficient for the cylinder to hold its shape. Nevertheless, the achieved density of 1,520 kg/m³ is still too low.
Regarding the third sample in each series, it can be observed that with intermediate and wet material, densities exceeding 2000 kg/m³ can be achieved with an energy input of 896 kJ/m³. However, with very dry material, this limit is not reached, even with almost twice the energy input of 1,630 kJ/m³. Here, again the strong correlation of the material moisture and the compaction process becomes evident.
The density of the higher compacted samples of the wet series (purple line) are very high. It can also be observed that the density remains almost unchanged despite a doubling of the compaction energy energy. This illustrates well, how in this case the air was almost completely removed from the pores and further compaction is prevented by the water contained.
4.3.2 Deriving an operational range for the robotic rammed earth process
In order to select the optimum compaction parameters for the robotic manufacturing process, the data of the previous section is analyzed. In Figure 13, the exemplary process is illustrated with the colored area indicating the operational range. It has to be mentioned that the interpolation of these curves was done graphically. For this purpose, the basic properties of the curves were considered, meaning the higher the moisture content, the flatter is the gradient in the beginning and the later will the maximum dry density be reached. Furthermore, the maximum dry density increases with lower moisture content. However, it is important to keep in mind that the compressive strength might be affected if the material is compacted with a moisture content which is significantly higher than the optimum (Burroughs, 2010).
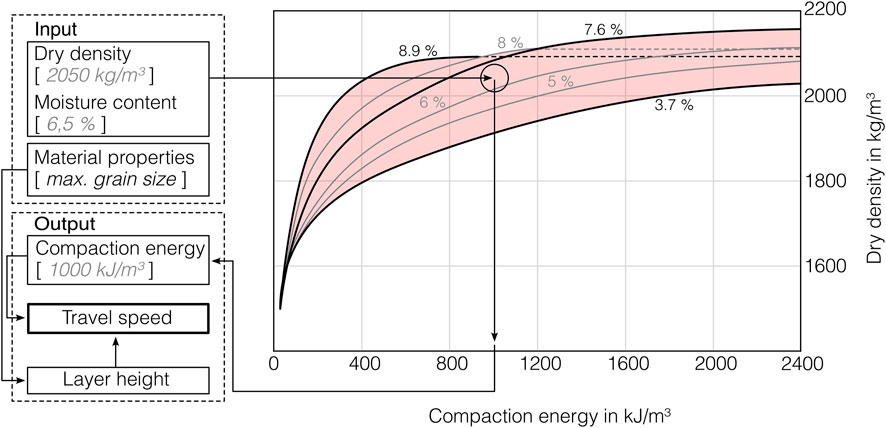
FIGURE 13. Graphical diagram for operational area for the RRE process.
As illustrated on the left side of Figure 13, the compaction energy, depending on the moisture content and the required dry density, can be taken from the diagram. Starting on the horizontal level of the required dry density, the intersection with the actual moisture content can be determined. For example, the dry density derives from the structural requirements and the moisture content could be measured on site or derived from a live monitoring during the manufacturing process. Subsequently, the according compaction energy is marked by the vertical arrow. The layer height is selected based on the material properties and can generally be used to react on practical issues of the process. On the basis of these values, the travel speed can then be set.
If data of this kind can be generated quickly and easily for local materials, this could create data bases that can be used as input parameters for digital manufacturing processes, which could enable the enhancement of the process’s adaptability and uniformity.
5 Discussion
During the investigation, isolated effects could be detected. However, these are within a limited scope. With a larger parameter range of the layer height and the impact energy, the effects might have been more evident. Nevertheless, the range investigated in the present work was specifically chosen to fit the context of the RRE process. This balance is crucial for optimizing parameters, encompassing both reduced impact for formwork unloading and increased speed to ensure a time-efficient manufacturing process. For the application of the results, the transferability into practice as well as the scalability are important factors. The small-scale experiments were conducted under controlled conditions. This especially applies to the influence of the cylindrical formwork: under realistic conditions, a portion of the energy would be lost due to the deformation of the formwork, as well as the partial yielding of the material. Similarly, the cylindrical shape is more convenient in contrast to the usual rectangular shape of wall elements. Irregularities due to compaction in the corners are thus avoided and not taken into account. Nevertheless, these restrictions are useful in the scope of the experimental tests in order to be able to exclude as many unknown factors as possible. However, further tests under real conditions must be carried out in the future to confirm the results. Besides the mold also the manual Proctor hammers differ from the ramming devices on site. What should be mentioned first is the relation between the surface of the compacted volume to the surface of the ramming device or hammer respectively. In most of the experiments a covering top plate was used, which means that the compaction is applied over the entire horizontal surface. Although, previous tests showed that this does not significantly affect the result, the difference to realistic manufacturing conditions, where the rammer surface is much smaller than the surface of the compacted layer, which may allow the material to deflect. Pneumatic rammers have a much higher stroke frequency. Whether this influences the compaction process is not known and has been neglected here.
6 Conclusion
In this paper, a comprehensive study was conducted to investigate the interrelation of process and material parameters and their impact on the compaction and strength of rammed earth with the aim of establishing an automated robotic rammed earth process. It was found, that with the same volume related compaction energy, the reduction of the impact energy (respectively increased stroke number) down to a value of 10 J is possible without major energy losses. Impact energies higher than 40 J result in slightly reduced densities due to the low number of compaction strokes. From this, it could be derived that a minimum number of strokes of 35–75 is required for sufficient compaction. In contrast, the layer height has a negligible influence on the compaction process within the investigated parameter scope. This would allow to use this parameter for the process adjustment according to different material conditions. Furthermore, a range for the minimum required compaction energy, depending on the existing material moisture, could be identified. The studies showed that in a range of about 4–9 wt% material moisture, the applied compaction energy can be reasonably selected between approximately 150 to 2,000 kJ/m³, according to the required dry density. The findings of this work can be used as input data for the further development of the compaction unit of a Robotic Rammed Earth process. In future research on this topic, the findings on compaction behaviour could be implemented in the digitized process. By using live or rapid on-site measurements of moisture content and density, the compaction energy could be adjusted during production. This would improve the process robustness with regards to a uniform level of compaction regardless of local conditions and varying material properties.
Data availability statement
The original contributions presented in the study are included in the article/Supplementary material, further inquiries can be directed to the corresponding author.
Author contributions
LS: Conceptualization, Investigation, Methodology, Visualization, Writing–original draft. JG: Conceptualization, Supervision, Writing–review and editing, Funding acquisition, Methodology, Project administration, Validation. ED: Supervision, Validation, Writing–review and editing. DL: Resources, Supervision, Writing–review and editing. HK: Conceptualization, Funding acquisition, Project administration, Resources, Supervision, Writing–review and editing.
Funding
The author(s) declare financial support was received for the research, authorship, and/or publication of this article. The present research activities are part of the project “GOLEHM2–Mobiler, robotischer Stampflehm”, by the initiative “GOLEHM”, funded by the WIR!-program for regional structural change, which is issued by the German Federal Ministry of Education and Research.
Acknowledgments
The authors would like to thank the institute of geomechanics and geotechnics for the provision of test equipment, as well as the company Conluto for providing earth materials.
Conflict of interest
The authors declare that the research was conducted in the absence of any commercial or financial relationships that could be construed as a potential conflict of interest.
Publisher’s note
All claims expressed in this article are solely those of the authors and do not necessarily represent those of their affiliated organizations, or those of the publisher, the editors and the reviewers. Any product that may be evaluated in this article, or claim that may be made by its manufacturer, is not guaranteed or endorsed by the publisher.
References
Abhilash, H. N., and Morel, J.-C. (2019). “Stress–strain characteristics of unstabilised rammed earth,” in Earthen dwellings and structures. Editors B. Reddy, M. Mani, and P. Walker (Singapore: Springer Transactions in Civil and Environmental Engineering. Springer). doi:10.1007/978-981-13-5883-8_18
Arrigoni, A., Pelosato, R., Dotelli, G., Beckett, C. T., and Ciancio, D. (2017). Weathering’s beneficial effect on waste-stabilised rammed earth: a chemical and microstructural investigation. Constr. Build. Mater. 140, 157–166. doi:10.1016/j.conbuildmat.2017.02.009
Attom, M. F. (1997). The effect of compactive energy level on some soil properties. Appl. Clay Sci. 12, 61–72. doi:10.1016/S0169-1317(96)00037-3
Author Anonymous (2012). Din 18127: baugrund, untersuchung von Bodenproben - proctorversuch - [2012-09-00]. German: DIN-Regelwerk Deutsche Normen.
Ávila, F., Puertas, E., and Gallego, R. (2020). Characterization of the mechanical and physical properties of unstabilized rammed earth: a review. Constr. Build. Mater. 270, 121435. doi:10.1016/j.conbuildmat.2020.121435
Burroughs, S. (2010). Recommendations for the selection, stabilization, and compaction of soil for rammed earth wall construction. J. Green Build. 5, 101–114. doi:10.3992/jgb.5.1.101
El Nabouch, R. (2017). Mechanical behavior of rammed earth walls under Pushover tests. HAL science, Lyon: Civil Engineering. Université Grenoble Alpes.
Giuffrida, G., Caponetto, R., and Cuomo, M. (2019). An overview on contemporary rammed earth buildings: technological advances in production, construction and material characterization. IOP Conf. Ser. Earth Environ. Sci. 296, 012018. doi:10.1088/1755-1315/296/1/012018
Gomaa, M., Schade, S., Bao, D. W., and Xie, Y. M. (2023). Automation in rammed earth construction for industry 4.0: precedent work, current progress and future prospect. J. Clean. Prod. 398, 136569. doi:10.1016/j.jclepro.2023.136569
Hall, M., and Djerbib, Y. (2004a). Rammed earth sample production: context, recommendations and consistency. Constr. Build. Mater. 18, 281–286. doi:10.1016/j.conbuildmat.2003.11.001
Hall, M., and Djerbib, Y. (2004b). Moisture ingress in rammed earth: Part 1—the effect of soil particle-size distribution on the rate of capillary suction. Constr. Build. Mater. 18, 269–280. doi:10.1016/j.conbuildmat.2003.11.002
Houben, H., and Guillaud, H. (1994). Earth construction: a comprehensive guide. London: CRAterre., & Intermediate Technology Publications.
Jaquin, P. A., Augarde, C. E., Gallipoli, D., and Toll, D. G. (2009). The strength of unstabilised rammed earth materials. Géotechnique 59, 487–490. doi:10.1680/geot.2007.00129
Khadka, B., and Shakya, M. (2015). Comparative compressive strength of stabilized and un-stabilized rammed earth. Mater Struct. 49, 3945–3955. doi:10.1617/s11527-015-0765-5
Kloft, H., Gosslar, J., and Fernández-Barba, D. (2023). Robotische Fabrikation von Bauteilen aus Stampflehm. Bonn.
Liu, Q., and Tong, L. (2017). Engineering properties of unstabilized rammed earth with different clay contents. J. Wuhan. Univ. Technol.-Mat Sci. Ed. 32, 914–920. doi:10.1007/s11595-017-1690-y
Matthew, R. H., Rick, L., and Meror, K. (2012). Modern earth buildings: materials, engineering, construction and applications, 33. Cambridge: Woodhead Publishing Series in Energy.
Minke, G. (2021). Building with earth: Design and technology of a sustainable architecture. Fourth and revised edition. Basel: Birkhäuser Verlag GmbH.
Morel, J.-C., Charef, R., Hamard, E., Fabbri, A., Beckett, C., and Bui, Q. B. (2021). Earth as construction material in the circular economy context: practitioner perspectives on barriers to overcome. Philos. Trans. R. Soc. Lond B Biol. Sci. 376, 20200182. doi:10.1098/rstb.2020.0182
Niroumand, H., Akbari, R., Khanlari, K., Gültekin, A. B., and Barcelo, J. A. (2021). A systematic literature review of rammed earth walls. Soil Mech. Found. Eng. 58, 295–301. doi:10.1007/s11204-021-09742-y
Okologisch Bauen. Naturlich mit Lehm (2024). Conluto - vielfalt aus Lehm. Available at: https://www.conluto.de/.
Reddy, B. V. V. (2022). Compressed earth block & rammed earth structures. Singapore: Springer Nature Singapore.
Röhlen, U., and Ziegert, C. (2020). Lehmbau-Praxis: planung und Ausführung, 3., aktualisierte und erweiterte Auflage. Beuth Praxis. Berlin, Wien, Zürich: Beuth Verlag GmbH.
Schroeder, H. (2010). Lehmbau: mit Lehm ökologisch planen und bauen; mit 55 Tabellen, 1. Wiesbaden: Aufl. Vieweg+Teubner.
Schweiker, M., Endres, E., Gosslar, J., Hack, N., Hildebrand, L., Creutz, M., et al. (2021). Ten questions concerning the potential of digital production and new technologies for contemporary earthen constructions. Build. Environ. 206, 108240. doi:10.1016/j.buildenv.2021.108240
United nations environment program (2009) Building and climate change. Available at: https://www.uncclearn.org/wp-content/uploads/library/unep207.pdf. Accessed 20 June 2023
Venkatarama Reddy, B. V., and Prasanna Kumar, P. (2010). Embodied energy in cement stabilised rammed earth walls. Energy Build. 42, 380–385. doi:10.1016/j.enbuild.2009.10.005
Volhard, F., and Ulrich, R. (2002). Lehmbau regeln: begriffe baustoffe bauteile, 2., korrigierte auflage. Wiesbaden: Vieweg+Teubner Verlag.
Windstorm, B., and Schmidt, A. (2013). A report of contemporary rammed earth construction and research in north America. Sustainability 5, 400–416. doi:10.3390/su5020400
Appendix
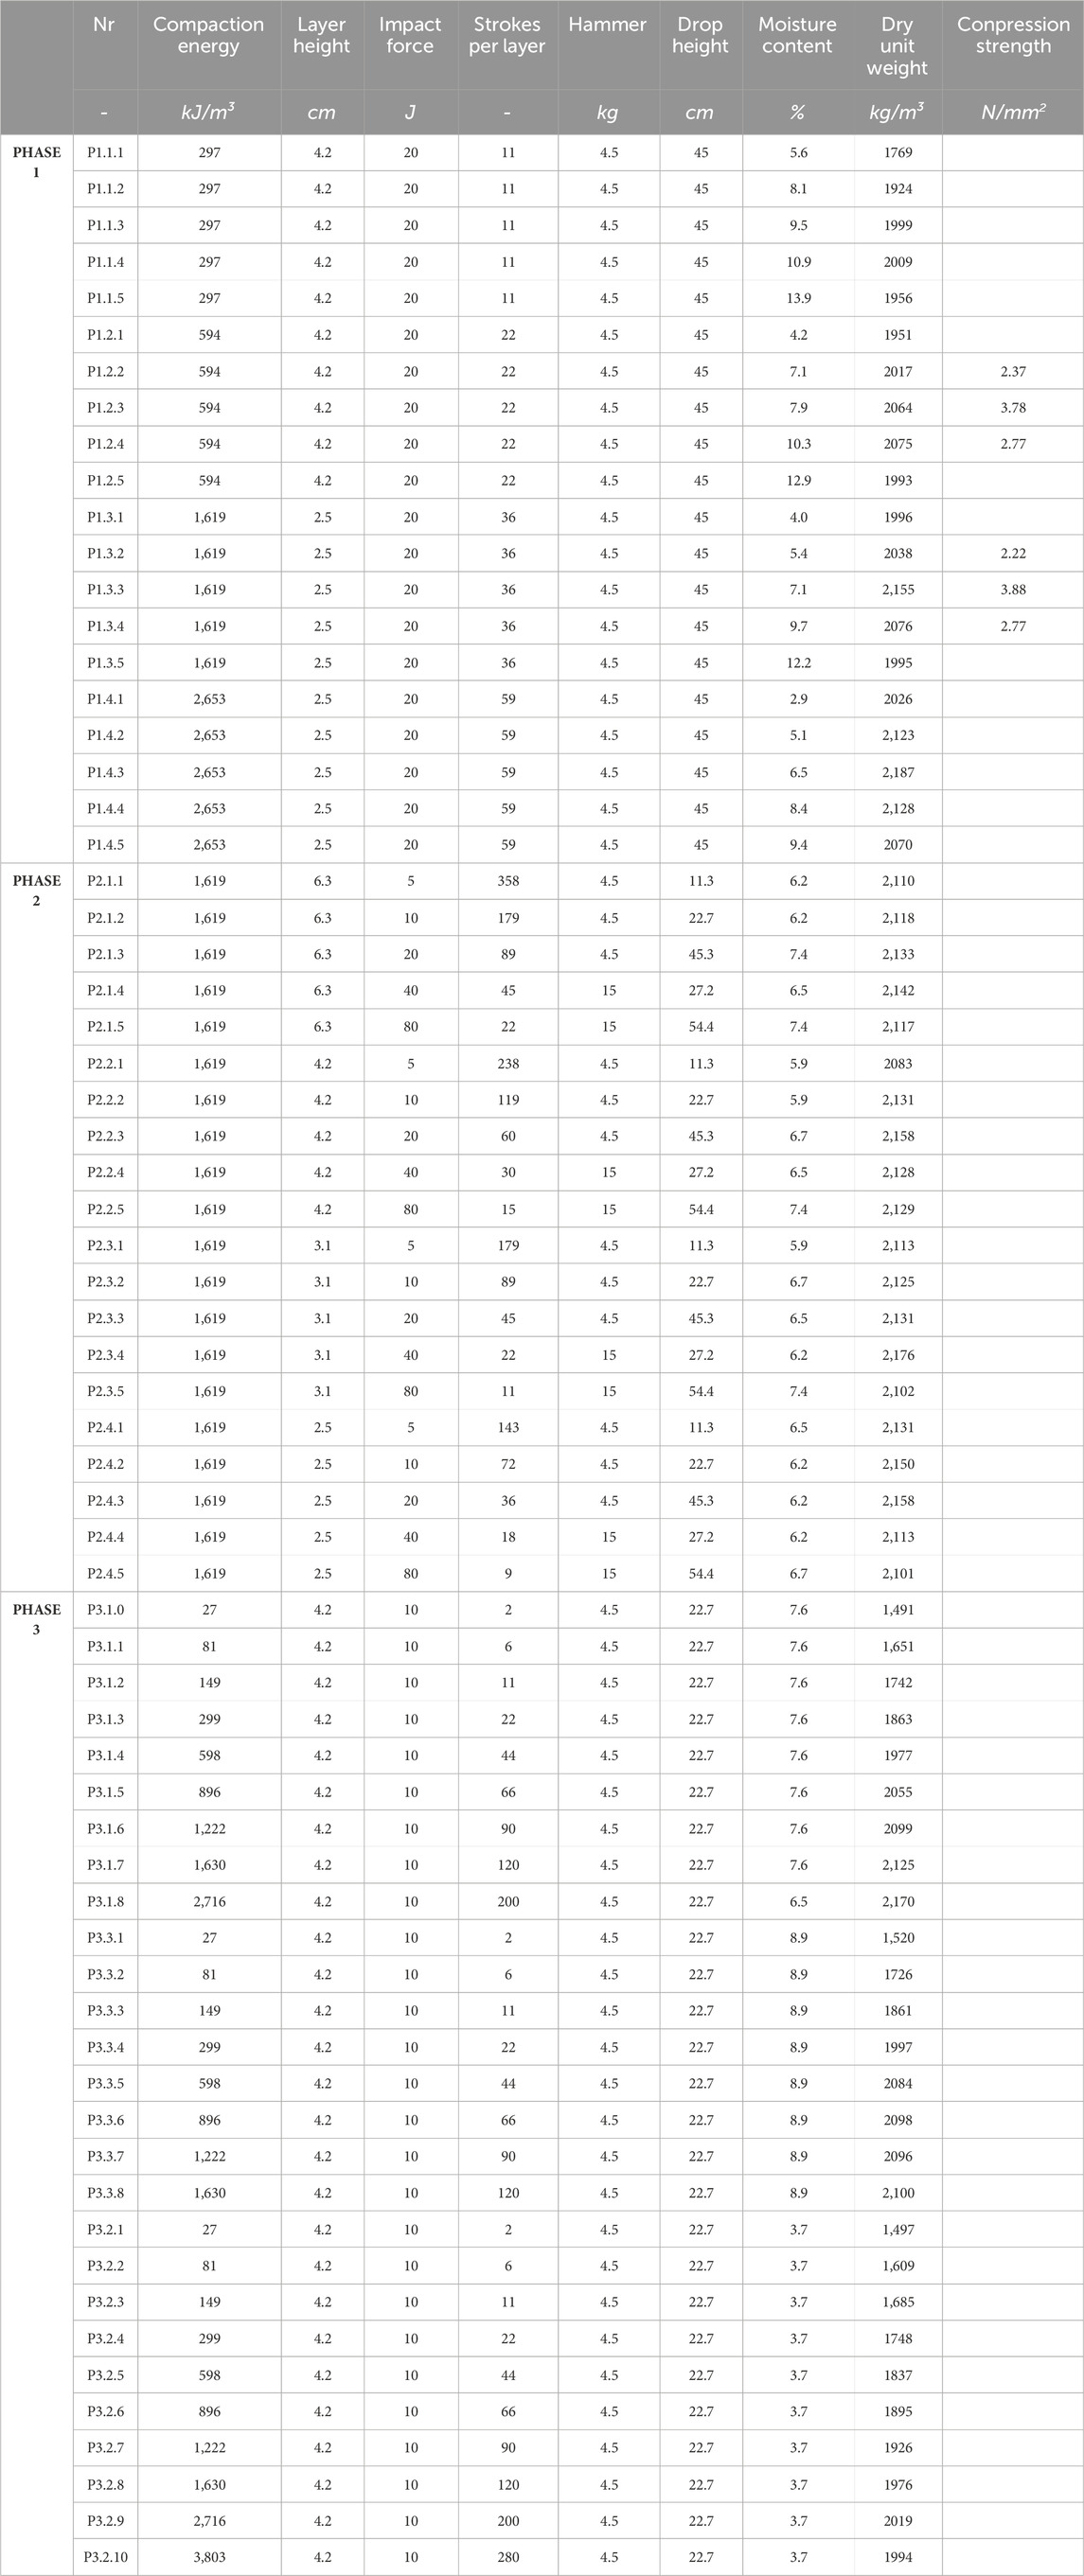
TABLE A1. Supplementary Material: Experimental data of Phases 1,2 and 3.
Keywords: robotic rammed earth (RRE), earth construction, additive manufacturing (AM), digital fabrication, compaction energy, impact energy, layer height
Citation: Schmitz LP, Gosslar J, Dorresteijn E, Lowke D and Kloft H (2024) Experimental investigations on the compaction energy for a robotic rammed earth process. Front. Built Environ. 10:1363804. doi: 10.3389/fbuil.2024.1363804
Received: 31 December 2023; Accepted: 26 January 2024;
Published: 14 February 2024.
Edited by:
Pshtiwan Shakor, Sulaimani Polytechnic University, IraqReviewed by:
Anastasiia Puzatova, Immanuel Kant Baltic Federal University, RussiaSathvik Sharath Chandra, Dayananda Sagar College of Engineering, India
Copyright © 2024 Schmitz, Gosslar, Dorresteijn, Lowke and Kloft. This is an open-access article distributed under the terms of the Creative Commons Attribution License (CC BY). The use, distribution or reproduction in other forums is permitted, provided the original author(s) and the copyright owner(s) are credited and that the original publication in this journal is cited, in accordance with accepted academic practice. No use, distribution or reproduction is permitted which does not comply with these terms.
*Correspondence: Joschua Gosslar, ai5nb3NzbGFyQHR1LWJyYXVuc2Nod2VpZy5kZQ==
†These authors share first authorship