 Sindhuja Ranganath
 Stephen McCord
 Volker Sick
- Global CO2 Initiative, Department of Mechanical Engineering, University of Michigan, Ann Arbor, MI, United States
This study presents a whole building life cycle assessment for a 265 m2 end-terrace home built in Michigan, United States. The study scrutinized the embodied carbon footprint of conventional construction materials, focusing on high-impact materials like concrete, steel, gypsum, paint, and insulation. Stages from raw material extraction to transportation and processing of the raw materials into finished products and transportation of finished products to the site are considered. The baseline materials contributed to approximately 28,450 kg CO2e, equivalent to 107.35 kg CO2e/m2. A notable reduction in the embodied carbon footprint, ranging from 19% to 39%, was observed by substituting with ‘like-for-like’ alternatives. However, the study highlighted challenges in shifting to low-embodied carbon materials, primarily due to limited market readiness and scalability of some eco-friendly options. The study also assessed the feasibility of these alternatives using the United States Department of Energy’s “Technology Readiness Level” framework, examining their current production capacity, estimating potential future demand, and identifying key development areas to meet net-zero carbon goals effectively. This comprehensive approach underscores the complexity of transitioning to low embodied-carbon building practices while balancing feasibility and environmental impact.
1 Introduction
The global construction industry significantly impacts resource usage and emissions. It consumes 60% of raw materials by mass (Zabalza et al., 2011), 15% of the world’s freshwater resources (Ramesh et al., 2010), and generates 25% of all waste (Mokhlesian and Holmén, 2012). It accounted for 36% of global energy use and 39% of energy-related greenhouse gas (GHG) emissions in 2017 (International Energy Agency and United Nations Environment Programme, 2018). More than a fourth of those were embodied carbon emissions associated with producing building materials and construction activities (Bowles et al., 2022). This sector ranks third in the United States in greenhouse gas emissions (Li et al., 2010). From September 2022 to September 2023, Michigan issued about 18,900 residential building permits for constructing single and multi-family homes (U.S. Census Bureau, 2023b). According to American Home Shield, which analyzed Zillow listings, Michigan’s average residential unit size was approximately 160 m2 (American Home Size Index, 2022). This implies approximately 3 million m2 of residential construction during that period. Stable trends in residential permits issued from 2018 to 2023 suggest Michigan’s yearly residential construction area is about 3 million m2.
Manufacturing some conventional construction materials like concrete, steel, construction plastics can be carbon-intensive (Magwood and Huynh, 2023). Studies have demonstrated that 50% of life cycle emissions occur during the “Cradle-to-Gate”-A1-A3 stages of building construction (Orr et al., 2020). Despite this construction volume, decarbonization efforts in the building sector are primarily focused on reducing operational GHG emissions, with national and state initiatives aiming for zero energy-related emissions by 2050 (Magwood and Huynh, 2023). Although some studies have pointed out that operational emissions could possibly vary from 60% to 80% over the building’s lifetime (Iddon and Firth, 2013; NREL, 2023). Minimum performance standards and building energy codes are increasing in scope and stringency across countries, and efficient and renewable building technologies are accelerating (IEA, 2023). Direct emissions from the buildings sector decreased in 2022 compared to 2021 despite temperatures driving up heating-related emissions in certain regions (IEA, 2023). These developments indicate significant progress in managing operational emissions in the building sector.
Therefore, prioritizing A1-A3 stages is crucial in reducing the overall carbon footprint. Following this, attention should also be given to the transportation of finished products to the site-A4, which usually accounts for under 10% of the total embodied carbon, and the installation of these products on-site-A5, contributing between 1% and 5% of the emissions (Orr et al., 2020). This sequential focus on A1-A3, followed by A4-A5, aligns with the identified impact distribution across the life cycle stages. In recent years, multiple studies have been directed toward reducing the carbon footprint of construction materials, focusing on exploring alternative materials and techniques applicable to various infrastructural elements, including homes, roads, and pavements (Sherwood and Telford, 1995; Venkatarama et al., 2003; Monahan and Powell, 2011; Rahman et al., 2014; Balaguera et al., 2018; Zhang et al., 2018; Pranav et al., 2020). These studies underscore the importance of adopting lower carbon-intensive practices across the entire construction industry to achieve meaningful progress toward low embodied carbon scenarios.
The initial stages of a building’s life cycle offer a significant opportunity for architects, engineers, and builders to implement strategies to reduce the carbon footprint. Decisions made during these phases can lead to substantial reductions in embodied carbon, emphasizing the responsibility of industry professionals. In contrast, the later stages of a building’s life cycle present different challenges. The influence over carbon reduction shifts to home-owners and end-users. The effectiveness of reducing emissions during these stages significantly depends on the awareness and commitment of the occupants toward sustainability practices. In conclusion, effectively reducing emissions in the building sector requires a holistic approach that addresses embodied and operational carbon emissions. This strategy begins at the earliest stages of a building’s conception, well before the architect’s drawing phase, and extends beyond the end-users, considering the end-of-life of building materials. It emphasizes the need for increased awareness and active involvement from all stakeholders in the building lifecycle.
As of 2021, 70% of the 128.5 million United States households were single-family dwellings, reflecting the predominant preference of Americans (US Census Bureau, 2023a). Furthermore, the average area of United States houses has increased by 21% since the 1970s (Centre for Sustainable System, 2023), and in 2021, 1.7 million single-family housing projects were constructed in the United States (Bloomberg News, 2022) with a median size of about 214 m2 (US Census Bureau, 2022). These imply that 2021 witnessed about 363 million m2 of new construction in the United States. Such trends underscore the importance of understanding and addressing the environmental implications of housing choices. In light of the above, the current study focused on a prototypical single-family townhouse in Southeast Michigan, spanning an area of 265 m2. This house includes three floors, three bedrooms, 2.5 bathrooms, a porch, an unfinished basement, and an attached garage.
This study conducts a Life Cycle Assessment (LCA) to assess the embodied carbon impact of a 265 m2 end-terrace home in Southeast Michigan, focusing on replacing conventional building materials with low embodied carbon alternatives without altering the building’s structure. Emphasizing technological readiness levels (TRLs), it evaluates the scalability of these alternatives and their market penetration. The research identifies materials and techniques needing further development for effective decarbonization, bridging the gap between theoretical exploration and practical implementation in construction. This approach significantly advances the movement toward low embodied carbon building practices.
2 State of the art
In recent years, research has been conducted to improve LCA methodologies to better capture the environmental impacts of construction. For instance, research proposed dynamic LCAs, such as semantic-based real-time assessments, addressing temporal and spatial variation (Fnais et al., 2022). Simultaneously, tools like Embodied Construction Carbon Calculator (EC3), One Click LCA, and Athena Impact Estimator have been developed to conduct WBLCA exclusively. Research also assesses the environmental impacts of emerging technologies through LCA, recommending methodological adaptations for prospective LCA and highlighting the importance of considering future technology alternatives and varied data sources (Arvidsson et al., 2018).
Numerous studies have explored substituting concrete with wood structures in low carbon construction research. Studies have also independently explored alternative concrete design mixes. However, a notable gap exists in examining the comprehensive WBLCA that incorporates the utilization of low embodied carbon iterations of embodied carbon-intensive building materials without significantly changing the building structure while assessing the practicality of the substitution through TRL assessment. A study demonstrated the substitution for a few high-impacting materials like walls and roofing systems (Zhang et al., 2014). However, alternatives for other high-impacting construction materials like concrete, gypsum, steel, and vinyl are needed, and the technological readiness of these low embodied carbon alternatives needs to be assessed. A recent study summarized the cradle-to-gate embodied emissions of 780 homes built across Southern Canada and the United States (Magwood, 2016). The study found that the embodied emissions of these homes varied from 72 to 561 kg CO2e/m2 of conditioned floor area in North America. Essential high-impact materials identified included concrete, insulation, cladding, interior surfaces, windows, roofing, and wooden frames. The analysis suggested that using commercially available, affordable, and code-compliant materials could reduce emissions by 30%–50%. However, while aligning with the general findings of the current analysis presented in this document, it did not provide a detailed quantification of the embodied carbon of the alternative materials, nor did it assess the technological maturity of these “best” alternatives.
An LCA shows that natural assemblies like light straw clay, cob, and rammed earth outperform conventional materials regarding energy use, emissions reduction, and other environmental impact categories across all climatic conditions (Ben-et al., 2021). However, utilizing materials like rammed earth and straw clay would require altering the baseline structure of the building. Research conducted in Norway shows that cross-laminated timber (CLT) structures exhibit 25% lower GHG emissions in production stages and 13% lower emissions across all life cycle stages for CLT (Eliassen et al., 2019). An extension of this study found that incorporating biogenic carbon reinforces CLT’s environmental advantages (Andersen et al., 2021). A similar analysis in Sweden reveals that materials like wood frames and cellulose insulation significantly outperform concrete and treated wood regarding environmental impact across various construction stages for Nordic climatic conditions (Petrovic et al., 2019). Studies in India (Desai and Bheemrao, 2022) and China (Chen et al., 2021) underline the environmental benefits of using timber over concrete in residential buildings, specific to the local conditions. In Finland, timber apartments had the lowest carbon footprint. However, the research also highlighted the better performance of hybrid buildings (timber and concrete) over fully reinforced concrete structures (Rinne et al., 2022). This work also supports the adoption of hybrid buildings, which offer solutions to challenges like sagging, vibration, and acoustic issues through judicious use of wood, presenting a compelling alternative to purely timber-based construction.
While many of the studies mentioned an earlier focus on substituting concrete with wooden structures, there are some suggesting alternative concrete design mix approaches. For example, three alternative design mixes were proposed to replace 100% Ordinary Portland cement (OPC) concrete (Manjunatha et al., 2021). A life cycle assessment showed that OPC concrete had a higher carbon footprint than an alternative design mix using 100% ground granulated blast-furnace slag and pozzolana Portland cement (Manjunatha et al., 2021). The environmental impact of producing CO2-cured concrete blocks has consistently been lower in all impact categories compared to producing traditional Portland concrete blocks (Chang et al., 2016). Lower-carbon concrete production was also demonstrated from alternative materials like ground granulated blast furnace slag, recycled aggregate, biochar, and the use of biomass fly ash (Khung, 2022; Luca et al., 2023).
In conclusion, this study uniquely combines WBLCA, TRL evaluation, and market analysis to provide a holistic perspective on key low-embodied carbon construction materials. It innovatively integrates these aspects to identify hotspots in the early building life cycle stages, substituting high-impact materials with alternatives without altering the structure of the building, and assesses the practicality of these substitutions. This approach effectively bridges the gap between material innovation and real-world implementation in the construction industry, offering a comprehensive system-level perspective on building practices.
3 Methodology
The bill of materials for the townhouse was obtained through a private communication with the builder. This provided detailed information on the construction materials and techniques used. As the house was constructed without a specific focus on sustainability, it is assumed for this study that the material quantities represent a typical townhouse in the United States. The foundation was made of 20 MPa concrete, reinforced with steel, and insulated using polystyrene foam. The wall construction utilized softwood lumber studs and was covered with gypsum board for a smooth finish; this surface was painted. The fenestrations were composed of wooden doors and plastic windows. The flooring slab was made of softwood lumber plywood, softwood lumber joists, oriented stranded board (OSB), and finished with vinyl tile. The construction included softwood lumber for the structural columns and steel sections for the framing. The roof comprised a softwood truss system, supporting asphalt shingles, and an underlayment roofing system. The house was well-insulated with blown-in cellulose in the attic, mineral wool batts in the walls, and a high-density polyethylene plastic wrap on the exterior for enhanced energy efficiency and moisture barrier. Externally, the house was cladded in vinyl siding, chosen for its low maintenance and longevity. Figure 1 shows the components of the house, and Table 1 summarizes the construction materials used.
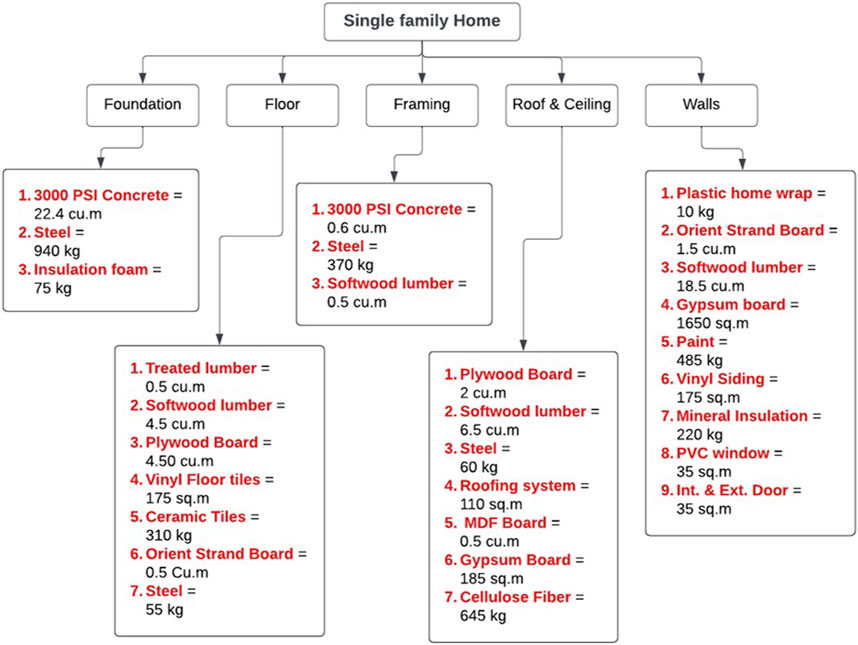
Figure 1. Key components of the single family home under consideration.
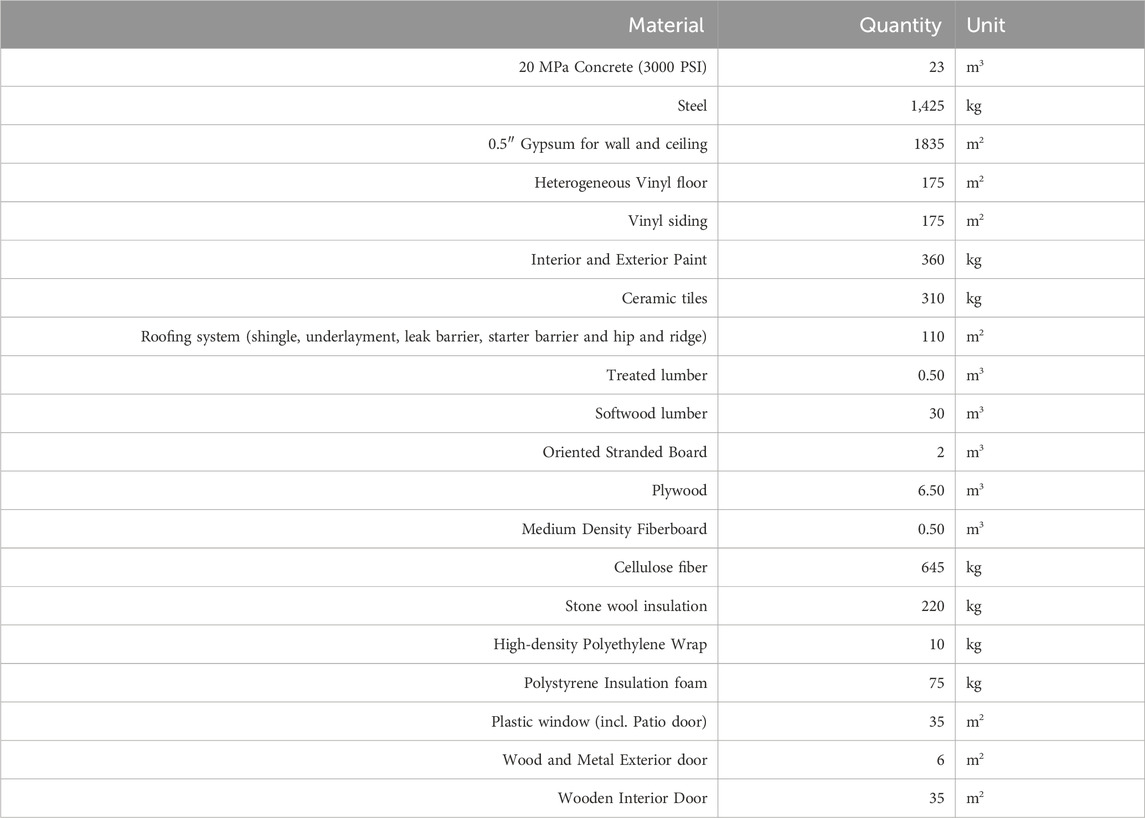
Table 1. Materials used in the construction of the single-family home (per the builder).
To evaluate the embodied-carbon footprint of the end-terrace home, a cradle to construction-site-gate LCA was conducted per ISO 14044 standards. The LCA methodology adopted in this research was delineated into three primary phases: defining the goal and scope, gathering the life cycle inventory, and assessing the embodied carbon footprint. Defining the objective and scope necessitates the determination of the functional unit, which, for this study, was set as “1 m2” of the building. The system boundaries were clearly outlined, encompassing stages such as raw material acquisition, often denoted as A1 in the Environmental Product Declarations (EPDs), transportation of these materials to processing facilities-A2, processing of the raw materials-A3, and their subsequent transportation to construction sites-A4. The on-site installation phase-A5 was excluded due to its small (yet non-negligible) contribution to structural embodied carbon; it is also a variable influenced by construction methods, material choices, and site setup (Orr et al., 2020).
Figure 2 shows the system boundary considered in the LCA of the study. A market study of current production capacities for alternatives complemented the research assessing the embodied carbon footprints of construction materials. This study aimed to gauge the market readiness of eco-friendly options. This market analysis was crucial in understanding these alternatives’ technological readiness and market penetration potential, ensuring their feasibility for fulfilling the needs of Michigan’s construction sector.
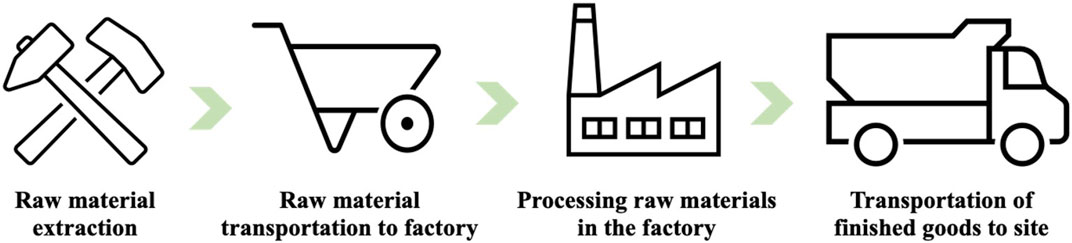
Figure 2. System boundaries considered in the present study.
This analysis recognizes the progress made by state and federal initiatives in improving the energy mix, thus operational emissions are not included. The American Society of Heating, Refrigerating and Air-Conditioning Engineers (ASHRAE) notes that buildings in the United States are responsible for 40% of carbon emissions, with 80% stemming from electricity consumption and the remainder from fossil fuel combustion for heating and other building needs (Rumsey et al., 2021). However, there’s a shift towards clean, carbon-neutral electricity. For instance, Duke Energy aims to deliver 100% carbon-neutral energy by 2050. Moreover, 12 states and 160 cities have set official targets to source 100% of their electricity from clean energy by 2050 (Rumsey et al., 2021). According to a National Renewable Energy Laboratory (NREL) study, emissions from the electricity grid are projected to decrease by over 60% by 2040 (Kaufman et al., 2022). The NREL’s Cambium Model’s mid case prediction shows around a 50% reduction in the greenhouse gas emission for national average electricity grid (Gagnon et al., 2023).
This study focuses on assessing the upfront embodied carbon emissions during the construction of a single-family home, intentionally excluding end-of-life (EOL) considerations. The study examines “like-for-like” material substitutions without substantial alterations in their basic composition, which means EOL emissions for substitutes are not significantly different from those of the conventional choices. For materials where substitutes differ fundamentally from the conventional choice, EOL considerations are qualitatively addressed within Sections 4.13–4.17.
Although studies indicate that EOL emissions can account for up to 15% of a building’s total carbon footprint, incorporating them into this analysis was beyond the scope of the study. The average service life of residential buildings in the United States is estimated at 61 years (Aktas and Bilec, 2012), and materials like concrete and steel typically last throughout the building’s entire life. Some construction materials longevity also varies from 5 to 100 years (Seiders et al., 2019; Statista, 2023a), making it challenging to predict future disposal and recycling technologies. Buildings also comprise components with diverse EOL characteristics regarding reusability and recyclability. The variability in how end-users manage these materials at EOL—whether through landfilling, recycling, reusing, or incineration—adds to this complexity. Additionally, regional differences in waste management practices, regulations, and infrastructure introduce further variability in EOL assessments. These factors collectively contribute to the challenges of accurately incorporating the EOL phase in a WBLCA.
A parallel study conducted to determine the carbon footprint values from EPDs sourced from the EC3 tool (Embodied Construction Carbon Calculator tool) for each construction material proved inconclusive and could not be used in lieu of a detailed WBLCA model. The limitation of EPDs in this context was their inability to effectively compare the environmental performances of different materials, such as concrete and wood. This difficulty stemmed from the requirement that materials be functionally equivalent and assessed under identical methodologies and life cycle modules—a challenging alignment given the distinct Product Category Rules (PCRs) governing different EPDs. Thus, a more integrated approach like WBLCA is needed for thorough environmental performance analysis (Lewis et al., 2021).
4 Results and discussion
The carbon footprint of a 265 m2 baseline home built using conventional materials (Table 1) encompassing stages A1-A4 was calculated to be approximately 28,450 kg CO2 e (107.35 kg CO2e/m2), aligning with findings from another research (Magwood, 2016). The current study identified several materials with a high impact on the overall carbon footprint of the building construction, including concrete, steel, insulation, interior surfaces (such as vinyl tile and paint), cladding (specifically vinyl siding), and plastic windows. Research has independently identified similar materials as significant contributors to the carbon footprint in construction (Magwood, 2016). Table 2 illustrates each material’s embodied carbon intensity or the carbon footprint per unit quantity of the material A1-A4 emissions, and Table 3 further expands on this by presenting the carbon emissions attributed to A1-A4 stages to each baseline material used in home construction.
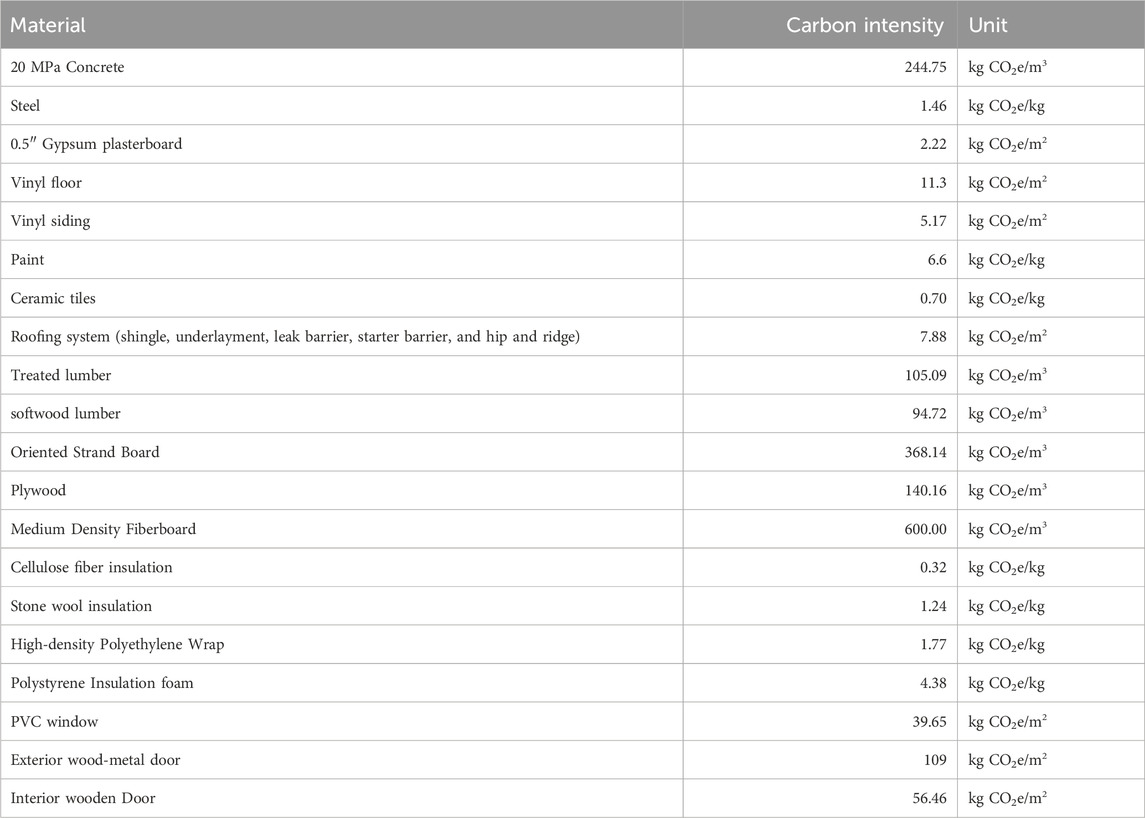
Table 2. A1-A4 Embodied carbon intensity of each material used in the conventional baseline home under consideration.
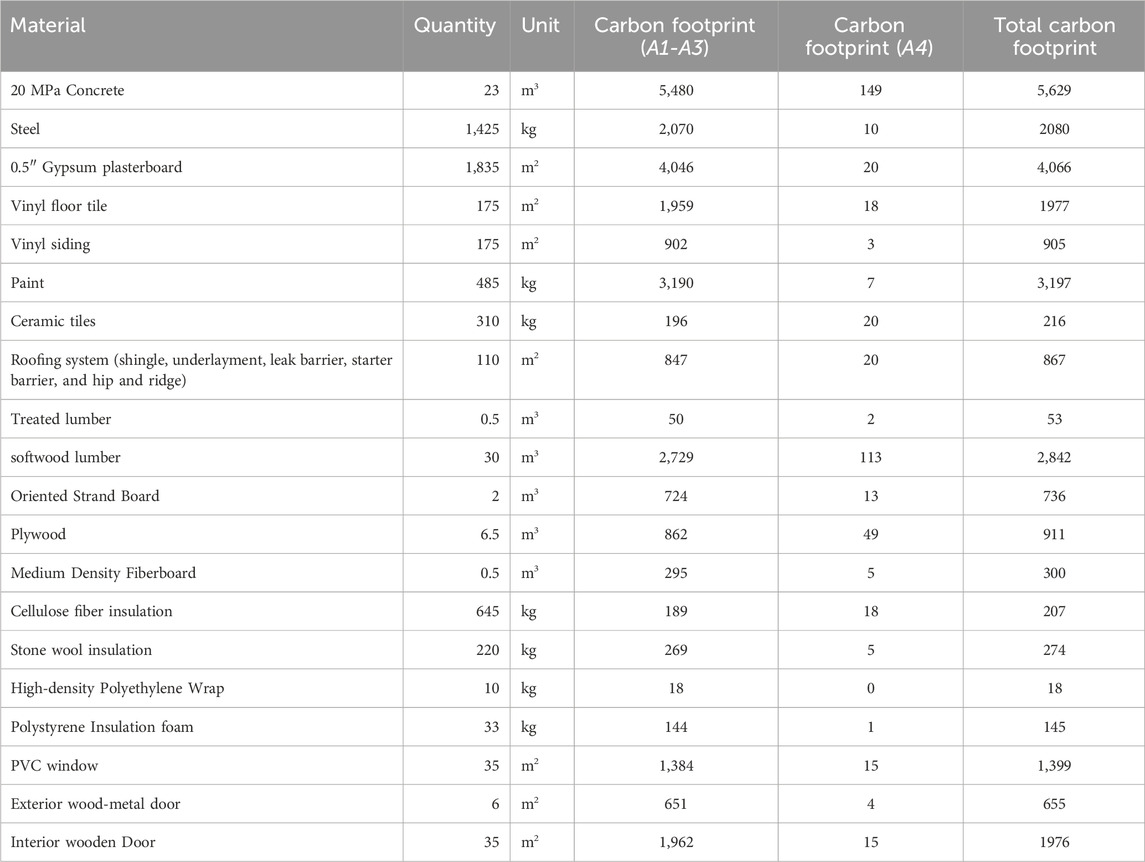
Table 3. The A1-A4 carbon footprint of baseline materials for end terrace house (Unit kg CO2e).
The current study took a selective approach in considering alternatives (Zhang et al., 2014). For instance, wooden products and roofing systems exhibit high carbon intensity and should have been prioritized for alternatives. It is essential to highlight the significant impact that biogenic carbon in wood has on the overall carbon footprint assessment of wood products. Despite its importance, the conservative methodology utilized in this study does not account for this factor, potentially leading to an overstated carbon footprint for wood products. Research indicates that while standards do acknowledge the importance of considering temporary carbon storage in LCAs of wood products, there remains a lack of agreement regarding a standardized methodology for incorporating this accounting (Head et al., 2021). Consequently, to simplify the calculations, biogenic carbon accounting has been omitted from this study’s scope. Conversely, solar roofs were suggested as an alternative to the roofing system. However, the environmental impact of solar roofs is measured in terms of their ability to offset grid energy’s operational emissions or (kg CO2e/kWh) (Ali et al., 2022). Since operational emissions were not the focus of this study, this alternative was not included in the calculations. This approach reflects a strategic focus on embodied carbon emissions, prioritizing materials with high carbon intensity for replacement with low-carbon alternatives that do not require altering the house’s structure while considering the materials’ scalability to penetrate the market.
Figure 3 summarizes the changes in embodied carbon intensities for various materials compared to baseline values. The absolute values of the embodied carbon intensity for each material are normalized to 1 for the baseline cases. In the case of concrete, employing a mix design that included mineralized CO2 aggregates led to a notable decrease in upfront embodied carbon emissions relative to traditional mix designs. Steel produced entirely from recycled materials exhibited a significant reduction in global warming potential (GWP) in comparison to standard steel. Plasterboard utilizing 100% synthetic gypsum from flue gas desulfurization (FGD) also resulted in a reduced embodied greenhouse gas profile compared to traditional plasterboard. Examining vinyl products, engineered flooring emerged as a more environmentally friendly option over standard vinyl flooring, while vinyl siding offered advantages over wooden siding. Paint formulated with partially recycled materials displayed a marked decrease in embodied carbon footprint versus conventional acrylic paint. Insulation made entirely from recycled materials achieved the lowest carbon footprint when assessed against both its partially recycled and non-recycled counterparts. Finally, wooden windows were found to have a preferable environmental impact in contrast to PVC windows. Section 4.1 explains each material and its alternatives in detail.
4.1 Alternative materials assessment in detail
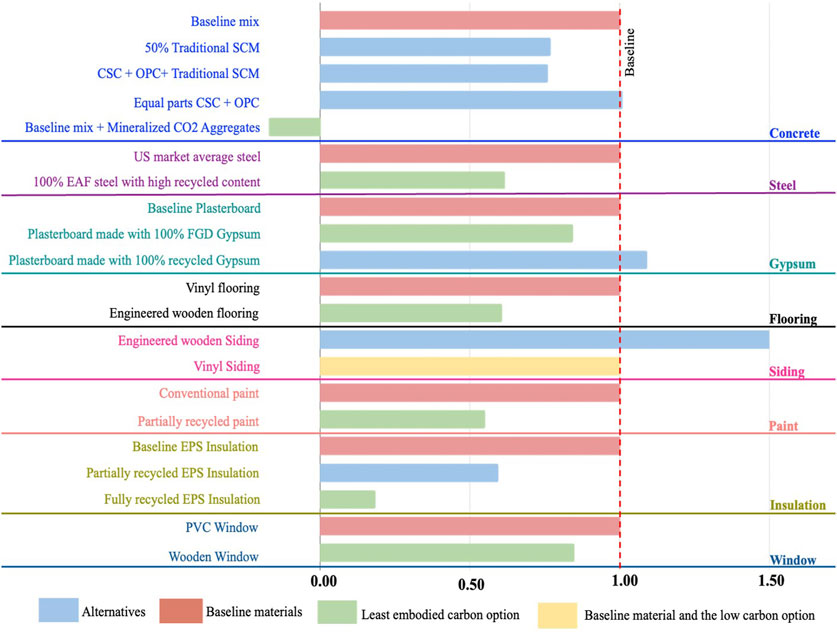
Figure 3. Normalized embodied carbon of baseline and proposed alternative construction materials in the single-family home.
4.1.1 Concrete
The average concrete strength typically utilized in similar applications, viz., constructing various basement structures in residential buildings, is assumed to be 20 MPa. The 20 MPa (3000 PSI) mix design with a 2,400 kg/m3 density is based on the NRMCA regional benchmark design for the “Great-Lakes Midwest region.” Table 4 presents the quantities of raw material used in making the “baseline mix.” The A1-A3 emissions for 1 m3 of this concrete are 238 kg CO2 e/m3. The total A1-A4 emissions for all concrete used are listed in Table 3.
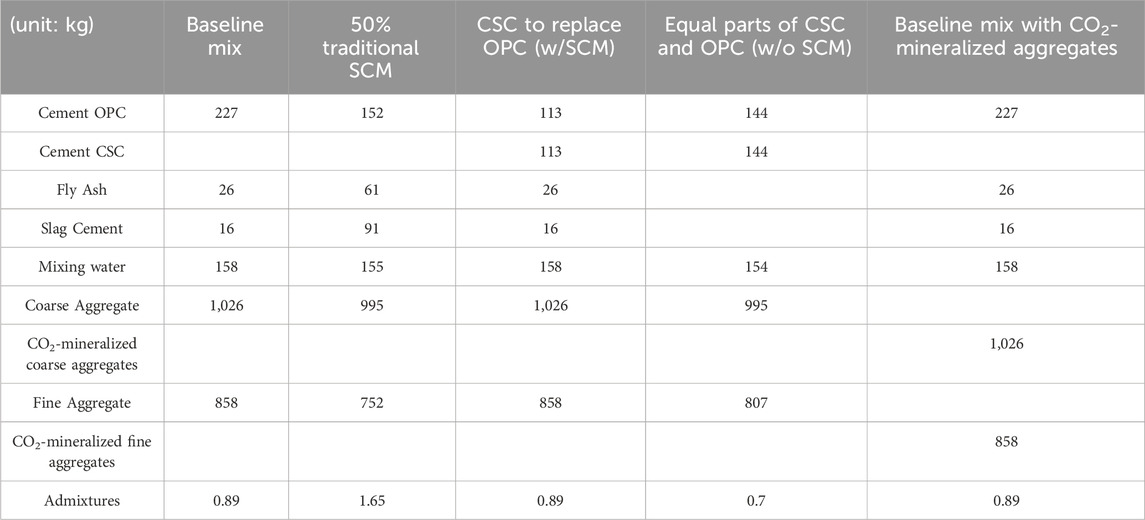
Table 4. Essential raw materials for 1 m3 of 20 MPa concrete mix (3000 PSI).
The alternatives proposed to reduce the embodied carbon intensity of traditional concrete were:
a. Using a design mix with 50% traditional Supplementary Cementitious Materials (SCM) (NRMCA, 2019)
b. Replacing OPC with Calcium Silicate cement (CSC) (Meyer et al., 2018)
c. Replacing conventional fine and coarse aggregates with CO2-mineralized aggregates (Blue Planet Systems, 2023)
The proposed alternatives are only a few out of multiple possibilities that could reduce the carbon footprint of concrete.
a) Traditional SCM: Substituting 50% of OPC with traditional SCM followed the NRMCA’s 3000-50FA/SL standards. The mix comprised 30% slag and 20% fly ash (Table 4). This substitution achieved a 23.3% reduction in the design mix’s embodied carbon intensity A1-A4, amounting to about 4,317.6 kg CO2e for the 23 m3.
Fly ash, a byproduct of coal combustion, is considered burden-free regarding its carbon footprint when used in concrete design mixes. The impacts are cut off at the point of electricity production in coal-fired power plants. Unused fly ash accumulating in open sites can potentially harm the environment due to its heavy metal content (arsenic, mercury, lead, cadmium), which can leach into the soil when in contact with water, thus polluting natural resources (Verma et al., 2016; Wang et al., 2022). Therefore, incorporating fly ash in concrete serves as a dual benefit: reducing cement use and managing toxic waste. Nonetheless, the Department of Energy highlights a decline in fly ash and slag quantities due to the decommissioning of coal and Basic Oxygen Furnace (BOF) steelmaking facilities. Despite declining availability, fly ash and slag remain economically viable substitutes with a significant presence in Michigan. Thus, the TRL is assessed at 9.
b) Calcium silicate-based cement (CSC) to replace OPC: Of late, other OPC alternatives like natural pozzolans, limestone cement, Limestone Calcined Clay Cement (LC3), and CSC have been researched (Khung, 2022; Hanifa et al., 2023). The current study identified CSC as an alternative due to its growing popularity (Solidiatech, 2023). CSC shares raw material similarities with OPC but is distinct in its production. It is a reduced-lime, non-hydraulic calcium silicate cement produced at lower temperatures, reducing the cement plant’s energy requirement and, thus, CO2 emissions by 30% (Meyer et al., 2018).
A hypothetical concrete mixture modified from the baseline mixture, incorporating 50% CSC as a substitute for OPC while retaining the traditional SCM content, was proposed (Table 4). This substitution resulted in a 24% reduction in embodied carbon intensity, translating to a carbon footprint of 4,270 kg CO2e for 23 m3 of concrete. Utilizing equal parts OPC and CSC without traditional SCM did not yield significant carbon savings. This outcome is attributed to the low to no carbon footprint associated with the traditional SCM, such as fly ash and slag, which are by-products of other industrial processes. While CSC presents a viable partial substitute for OPC at TRL of 7 (Lehne and Preston, 2018; Hanifa et al., 2023), its advantages are less pronounced when compared with readily available SCMs like fly ash and slag.
c) Mineralized CO2 aggregate: Aggregates form 81% of the baseline concrete mix. Replacing all fine and coarse aggregates with CO2-mineralized synthetic limestone aggregates in the baseline mix resulted in a 117% reduction in the embodied carbon intensity, equating to a −960 kg CO2e footprint for 23 m3 of concrete. This negative value indicates CO2 sequestration during mineralization. Mineral Carbonation is a process where CO2 is permanently converted to stable carbonates, mimicking natural limestone rock weathering (Seifritz, 1990; Hanifa et al., 2023). Production technologies are maturing towards commercial scale (Mitsubishi Corporation, 2020) with TRL 6 in the United States (Zoldosova and Truncellito, 2021; Hanifa et al., 2023). Examples of TRL 9 ‘accelerated carbonization’ technologies exist (Hanifa et al., 2023), however none are currently operational in the US. Studies have also demonstrated that the carbon footprint of the concrete mix made with these aggregates could be reduced further if the design mix used cement from production facilities where the CO2 was captured to produce the aggregates (Hanifa et al., 2023).
The analysis also examined the total quantity of essential raw materials required to meet the demands of the alternative design mix for the projected construction of 3 million m2 of housing in Michigan each year. A 20% variance in the estimation is assumed based on a comparative analysis of the quantity of concrete used in 40 single-family homes (Arceo et al., 2021). Including the variance in the projections aims to provide flexibility and realism, accounting for potential fluctuations in future concrete requirements for housing developments.
A key consideration is the availability of alternative materials. The estimated demand for concrete is roughly 260,000 ( ± 20%) m³. This volume would require about 16,000 ( ± 20%) tonnes of fly ash and 24,000 ( ± 20%) tonnes of slag for “50% traditional mix.” In 2021, the national supply was 25.4 million tonnes of fly ash and 2.6 million tonnes of slag (DoE, 2023). About 29,000 ( ± 20%) tonnes of CSC would be needed for the proposed design mix using CSC and traditional SCM. Additionally, replacing traditional aggregates with low-carbon alternatives would necessitate around 500,000 ( ± 20%) tonnes of mineralized-CO2 fine and coarse aggregates. However, the production of CSC and such aggregates is still in the early stages and cannot yet meet these full requirements.
4.1.2 Steel
Steel, primarily used as fabricated reinforcement and sectional beams, is produced globally through two main methods. The Blast Furnace-Basic Oxygen Furnace (BF-BOF) route accounts for 71% of global steel production (Economics 243 Fall, 2018), transforming iron ore into pig iron in a blast furnace (Fan and Friedmann, 2021). This method contributes to around 70% of CO2 emissions in the iron and steel industry and resists most decarbonization technologies (Fan and Friedmann, 2021). The second method, Electric Arc Furnace (EAF) steelmaking, heats materials like steel scraps and pig iron using electricity (Fan and Friedmann, 2021), potentially reducing carbon footprints by 40%–60% compared to BOF, depending on the plant’s location (Steel Tiles International, 2020). In 2021, around 70% of United States steel production used the EAF method, and in 2022, the United States imported approximately 24% of its steel (Steel Manufacturers Association, 2021; Burns, 2023; Steel Production, 2023). The study assumed a steel composition blend of 70% EAF and 30% BOF steel, reflecting domestic production and imports in the United States. This blend resulted in an embodied carbon intensity of 1.45 kg CO2 e/kg of steel. With high recycled content, the EAF route reduced embodied carbon intensity by 38%. Therefore, 1,425 kg of steel with over 90% recycled content in EAF had a carbon footprint of 1,282 kg CO2 e. The A1-A4 emissions for steel are detailed in Table 3.
The carbon footprint can be reduced further if the electricity used to make the steel can be cleaner (Solomon, 2023). The estimated quantity of recycled steel produced using the EAF to fulfill Michigan’s residential construction demand is about 23,000 ( ± 36%) tonnes. The variance is estimated based on the projected concrete requirement of 260,000 ( ± 20%) m3 and research demonstrating that 70–100 kg of steel would be required per m3 of concrete (One Click LCA, 2023). The United States steel industry is well-equipped to meet the demand for reinforcing steel, producing about 8 million tonnes annually, with over 97% recycled content (CSRI, 2023). Additionally, United States steel mills can produce over 9 million tons of structural steel yearly (AISC, 2018). This significant production capability and established market presence suggest a TRL of 9.
4.1.3 Gypsum
Gypsum is one of the most abundantly used materials in residential construction, ranking just after wood. In residential construction, a 0.5 lightweight and regular core gypsum board with an area density of 6.6 kg/m2 is commonly used (Bushi, 2020). To reduce the embodied carbon intensity compared to the baseline gypsum plasterboard, the low carbon alternatives proposed were:
a. Gypsum Board made of 100% Flue Gas Desulfurization Synthetic (FGD) Gypsum
b. Recycling gypsum board
a) FGD Gypsum: Approximately 2,600 million m2 of gypsum boards were sold in the United States in 2021 (Crangle, 2023). Members of the Gypsum Association (GA) in North America produce and ship over 90% of the gypsum board used in the United States and Canada (Bushi, 2020). Based on the weighted average material inventory illustrated by the GA, about 30% of the gypsum used in making gypsum plasterboard was naturally mined (Bushi, 2020). Replacing natural gypsum with FGD would eliminate all the environmental impacts associated with the mining of natural gypsum. Using FGD gypsum in panel products is recognized by the EPA as an important contribution to materials management (US EPA OLEM, 2016).
The desulfurization process involves wet scrubbers and forced oxidation to reduce SO2 emissions, and the gypsum produced is mineralogically identical to natural gypsum (Baran et al., 2021). FGD gypsum is considered a recovered “waste” material and is used burden-free other than those burdens necessary for input in manufacturing gypsum boards (Bushi, 2020). This makes FGD gypsum an ideal substitute for mined gypsum in wallboard manufacturing (Cheol et al., 2012). When plasterboards were made of 100% FGD gypsum, the embodied carbon intensity was reduced by 15.6%, reducing the carbon footprint of 12 tonnes (1836 m2) of gypsum to 3,440 kg CO2 e. Research shows that fully substituting natural gypsum with FGD gypsum reduced the carbon footprint of calcined gypsum by 25% (Fořt and Černý, 2018). The environmental impacts attributed to FGD gypsum include separation, dewatering, transportation, and calcination (Fořt and Černý, 2018). With 78.8% of the ‘utilized FGD gypsum’ going into plasterboard production, this well-established technology’s TRL is assessed at 9 (American Coal Ash Association, 2022).
b) Recycling gypsum board: Around 64% of drywall waste originates from new construction (Roskoskey, 2007), with about 12% of new construction drywall wasted during installation (Roskoskey, 2007). Gypsum board recycling involves gathering waste from various sites—manufacturing, construction, deconstruction, reconstruction, and transporting it to Material Recovery Facilities (MRFs). At MRFs, manual sorting removes metals, plastics, and other debris. Waste drywall contaminated with mold or paint, especially from pre-1978 structures with lead paint, is unsuitable for recycling and is discarded (Ndukwe and Yuan, 2016). Recyclable drywall undergoes paper separation, crushing, and dehydration in a furnace, which consumes significant energy (Suárez et al., 2016). The resulting recovered material usually consists of approximately 93% gypsum, 6% paper, and less than 1% waste (Ndukwe and Yuan, 2016). However, replacing freshly mined gypsum with recycled gypsum does not significantly reduce CO2 emissions because an average gypsum board made in North America contains only about 30% natural gypsum (Bushi, 2020). However, with the anticipated decrease in the availability of Coal Combustion Products (CCPs) like fly ash, slag, and FGD gypsum due to the gradual decommissioning of coal power plants (Baran et al., 2021), considering drywall recycling as a method to produce new drywall could become more relevant in the future with improved technologies.
The demand for recycled drywall in North America is low (Ndukwe and Yuan, 2016); manufacturers have stringent requirements for incorporating recycled gypsum into new drywall production. The paper content in drywall waste influences the amount of recycled gypsum allowed in new drywall, as it directly affects the fire rating of the plasterboard (Pichtel, 2014). Michigan’s statewide general recycling rate is around 18%, with Wayne County at 25%, while the national rate is 32%. This is partly due to the lower tipping fees for trash disposal (Matheny, 2021). While a fully developed technology, gypsum recycling is hindered from becoming more widely adopted. Nevertheless, the main advantage of recycling gypsum is to prevent it from ending up in landfills, where it poses environmental risks. When drywall waste decomposes in landfills, bacteria produce hydrogen sulfide gas, which smells like rotten eggs, is flammable, and poses health hazards such as eye and respiratory irritation and headaches. If ignited, this gas turns into sulfur dioxide, contributing to acid rain (Jang and Townsend, 2001; Naeth and Wilkinson, 2013; Ndukwe and Yuan, 2016).
Approximately 9.5 tonnes of gypsum are used for constructing an average 160 m2 Michigan home (Roskoskey, 2007). Extrapolating from this, an estimated 180,000 tonnes (27 million m2) of plasterboard are required to satisfy Michigan’s annual residential construction needs. Study shows that plasterboard comprises 91.5% calcinated gypsum (Bushi, 2020), so 165,000 tonnes of FGD gypsum would be required to satisfy Michigan’s plasterboard requirement. In 2021, the availability of FGD gypsum was listed as 17.86 million tonnes in the United States (American Coal Ash Association, 2022).
The United States generates 292.4 million tons of municipal solid waste annually, with nearly half going to landfills. Construction and demolition materials comprise over 50% of landfill content, with gypsum panels comprising about 2.5% of the debris (Hines and Egger, 2023), or at least 3.6 million tons (∼545 million m2). To fulfill Michigan’s annual plasterboard requirement (180,000 tonnes) at about 20% recycling rate into new plasterboard (EPA, 2015), 720,000 tons (∼109 million m2) can be generated in the United States.
4.1.4 Vinyl
4.1.4.1 Flooring
546.36 million m2 of vinyl tiles were sold in 2021 in the United States (Feldman, 2022). It is highly resistant to mold, mildew, and moisture, making it one of the most popular and cost-effective flooring options for residences where occasional spills and moisture are a concern (World Floor Covering Association, 2023). The product used to construct the baseline was heterogeneous vinyl flooring, a multi-layer product used in light commercial and residential interiors. 175 m2 of floor area was covered with vinyl tile in the baseline home. The proposed alternative to vinyl flooring was engineered wooden flooring, constructed using multiple wood veneers bonded together in an MDF board as the core layer. The maturity of these materials is at TRL 9. Eco-friendly engineered wooden flooring is cost-effective compared to solid wood flooring, thus gaining significant traction in North America (North America Wood Flooring Market Share, 2022; Bruce, 2023; Plank, 2023). Replacing vinyl flooring with engineered wood reduced the embodied carbon intensity by 39.4%, translating to approximately 1,198 kg CO2e carbon footprint for 175 m2 of flooring. In 2022, the United States produced 164.0 million m2 of engineered wooden flooring, and the new construction end-use segment accounted for 95.4 million m2. Assuming that 50%–90% of the total area of new single-family homes will have flooring, an estimated 1.5 million to 2.7 million m2 of engineered wooden flooring would be required to meet Michigan’s housing demand of 3 million m2.
4.1.4.2 Siding
Vinyl siding has been popular because of its low maintenance and cost-effectiveness (Dryhome, 2014). Vinyl siding was the primary exterior wall material for 26% of new single-family homes in the United States (Plastics News, 2022). 63% of the homes in East North Central states (Michigan, Indiana, Illinois, Wisconsin, and Ohio) had their exteriors made of vinyl siding. About 175 m2 of vinyl siding was used for the baseline home. Engineered wooden siding, as a mature alternative at TRL 9, is gaining attention in the construction industry. This composite wood siding is created by breaking down wood into its basic fibers, which are then reassembled with a resin system to form hard panels (Puettmann et al., 2016). These panels possess unique properties, distinguishing them from traditional wood siding (Puettmann et al., 2016). However, replacing vinyl siding with engineered wooden siding did not significantly reduce embodied carbon intensity in the current analysis. Recent research also demonstrates similar findings (Dodge and Liu, 2018; Bowyer et al., 2019; Royal Building Products, 2022). Studies have found that vinyl siding is more environmentally and economically efficient than other industry options (Dodge and Liu, 2018; Bowyer et al., 2019; Royal Building products, 2022). Despite this, there are concerns regarding using polyvinyl chloride (PVC) in siding. Classified as a dangerous form of plastic, PVC is challenging to recycle conventionally and is known for its potential to release toxic gases during processing (What Is Vinyl, 2021). The Vinyl Siding Institute is increasing its recycling efforts, but many recycling centers are reluctant to handle PVC products due to their complex nature to recycle (Vinyl Siding, 2023). While over 500,000 tonnes of vinyl material are recycled annually in the United States and Canada, post-consumer material comprises less than a fifth of the total use (Ned Monroe, 2023). Given these complications, there is a clear need to improve the technology for manufacturing wooden siding to reduce the embodied carbon intensity associated with engineered wooden siding. Assuming that the area of the outer walls requiring siding is about 50%–90% of the total floor area of the house, the estimated quantity of siding needed to fulfill Michigan’s annual construction demand is approximately 1.5 million to 2.7 million m2.
4.1.5 Paint
In 2020, 5.016 billion liters of paint were produced in the United States (Statista, 2023b). Over 57% were used in architectural and decorative applications. Acrylic paints are the market leader in the architectural paint segment, accounting for more than 42.0% of the overall use (U.S. Paints, 2023). Acrylic paints cover about 5 m2/L for double coat applications (Blaze PaintRite and Pros, 2022), were used in the baseline home. It is a water-based paint utilizing acrylic polymer emulsion as its binder. This composition gives acrylic paint its notable quick-drying characteristic, durability, and resistance to fading (Lewis, 2021). 1,825 m2 of the interior walls and ceilings required about 485 kg of paint for double coat application.
The demand for low-embodied carbon paints is rising, driving growth in the waterborne paints and coatings market (U.S. Paints, 2023). Over the past decade, the paint industry’s sustainability efforts have expanded from focusing on individual products to encompassing the entire supply chain (Paiano et al., 2021), influenced by the increasing adoption of eco-friendly paints and stricter environmental regulations (U.S. Paints, 2023). This industry-wide shift emphasizes minimizing toxic elements and transitioning from solvent-based to water-based products (Paiano et al., 2021). Research has identified two notable strategies for boosting low carbon footprint: first, the exploration of alternative raw material sources by substituting standard paint components (like TiO2 and synthetic additives) with organic-based alternatives, and second, the conversion of waste paint into new paint products (Paiano et al., 2021). To reduce the embodied carbon intensity of conventional paint, the proposed alternative in the current research was to use acrylic paint made of 55% virgin raw materials and 45% post-consumer and unused paints from construction sites (Paiano et al., 2021). This approach reportedly resulted in a 45% reduction in embodied carbon intensity. Consequently, for 485 kg of paint used, this method reduced the overall carbon footprint to 1,172 kg of CO2e. The carbon footprint of the surplus paint allocated to recycling is only transportation of the paint to paint to the processing facility and thereafter.
Major paint companies are currently focused on creating non-toxic, eco-friendly paints (Ma, 2021). Alongside this shift, there is a growing need to address paint recycling, as leftover paint significantly contributes to household hazardous waste (American Coating Association, 2016). Effective recycling methods are crucial for repurposing or responsibly disposing of these paints, supporting the industry’s move towards environmentally friendly products. Technical solutions were discussed to be potentially replicable at an industrial scale to recycle unused paint (Dunmade, 2012). Additionally, EPD for paint made from post-consumer paints was published (AGÉCO and Bushi, 2018). Despite the growing interest in recycling post-consumer unused paint, research indicates that the literature is still limited (Paiano et al., 2021). Thus, the TRL of these recycling technologies is currently evaluated at level 5, indicating that they are in mid-stage development.
To project future paint requirements, each square meter of a home’s floor area was assumed to correspond to 4 ( ± 30%) m2 of wall and ceiling area. Therefore, each square meter of the home would require approximately 0.8 ( ± 30%) liters or ∼1 kg of paint. For 18,900 homes with an average 160 m2 floor area, approximately 2.5 ( ± 30%) million liters or 3,300± 30% tonnes of paint would be needed. In the United States, about 10% of architectural paint sold remains unused, and with 1.23 billion liters acrylic paint produced annually (U.S. Paints, 2023; US EPA OLEM, 2015), this results in approximately 123 million liters (∼165,000 tonnes) of waste paint. For making new paint mixtures with 45% post-consumer recycled content to meet Michigan’s annual residential construction requirement, the required waste acrylic paint is estimated at 1,500 ( ± 30%) tonnes.
4.1.6 Expanded polystyrene (EPS) insulation
Recent research highlights the significant role of insulation materials in a building’s embodied carbon, with certain types being more carbon-intensive (Lstiburek, 2021; Magwood and Huynh, 2023; Tsikos, 2023). The baseline home considered in the study used four types of insulation: cellulose fiber in the attic, mineral wool batts in the walls, high-density plastic wrap externally, and polystyrene foam in the basement slab. However, the current study adopts a targeted approach to analyzing alternatives. Given that cellulose fiber and mineral wool batts are already recognized for their lower embodied carbon (Magwood, 2016), and the contribution of the plastic wrap to the overall Global Warming Potential (GWP) of the building was less than 0.05%, only EPS was considered for finding alternatives. With 376,840 tonnes of EPS produced in the United States in 2023 (USA Expandable Polystyrene EPS Market - Size, 2023), the study focuses on EPS insulation, emphasizing its significant potential for reducing GWP in light of its increasing market demand. Figure 4 shows the embodied carbon intensities of all types of insulation under consideration in the baseline home.
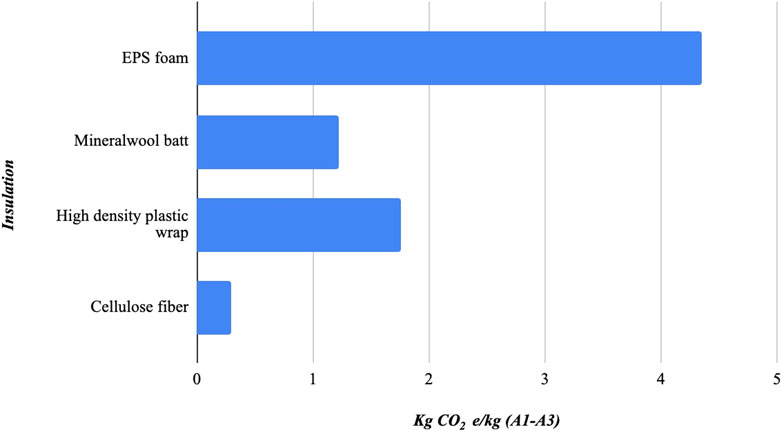
Figure 4. Embodied carbon intensities of all types of insulation used in the baseline home.
In Metro Detroit’s Climate Zone 5A, basements require insulation with a minimum R-value of R-10 (Michigan Energy Code, 2015). The baseline home used two 38 mm thick EPS foam insulation boards in the basement slab to comply with the regulation, achieving an overall R-value of about 10 (Assuris et al., 2021). The basement, constituting 12% of the house’s total area (approximately 32 m2), required 33 kg of EPS insulation. The current study proposed using recycled EPS foam to reduce embodied carbon. Replacing 45% of virgin materials with recycled EPS reduced the carbon footprint by 40.7%, making it 86.7 kg CO2 e for 33 kg of insulation. If 100% recycled EPS was used, the reduction in embodied carbon intensity could reach approximately 82.5%, lowering the carbon footprint to 25.36 kg CO2 e for the same amount of insulation.
To estimate Michigan’s future EPS insulation demand, around 20% of homes in the state were considered to have basements (Richards-Purpura, 2021). With an annual construction of about 18,900 new houses at an average size of 160 m2, this translates to approximately 3,800 homes with basements. Assuming the basement constitutes about 12.5% (with a ± 2.5% variation) of the total floor area of the area, each basement would average 20 ( ± 20%) m2. If at least R-10 EPS insulation was used in the basement slabs, the yearly requirement is estimated to be 7.75 ( ± 20%) tonnes of EPS foam. In 2019, the United States recycled 19,685 tons of post-consumer EPS insulation and 41,000 tons of post-industrial EPS insulation (InsulationCorp, 2020). With an annual recycling rate of at least 60,000 tonnes, this could suffice for the just one state’s 100% recycled EPS foam needs, this requirement has to be extended to suffice the nation’s need.
4.1.7 Windows
The baseline home incorporated PVC window frames and sash with double glazing. However, replacing these with wooden frames, a mature technology at TRL 9, resulted in a 15% reduction in embodied carbon intensity. This change lowered the carbon footprint of 35 m2 of windows to 1,185 kg CO2e. Further improvements in carbon reduction are anticipated by using recycled glass. The market for wooden windows and doors in the United States peaked in 2020 and was expected to grow by nearly 1.5% annually (Statista, 2023c). The demand for windows varies greatly and is specific to each project. Hence a future projection of window usage has not been established.
4.2 Discussion
This study focused on materials with high embodied carbon, such as concrete, steel, gypsum, vinyl, paint, windows, and insulation, underscoring their significant impact on the overall carbon footprint of a single-family home. This work has demonstrated that replacing traditional materials with suitable alternatives could lead to embodied carbon emission reductions between 19% and 39%. Figure 5 presents an overview of individual material contributions to the total embodied carbon for three different cases. It is important to note that material replacements were selected such that the buildings’ structural integrity or functionality was not compromised. When the current landscape of alternative construction materials is scrutinized, it becomes apparent that several high-potential materials are in their infancy, with production quantities that are not yet on par with market demand. For instance, although highly effective in carbon reduction, mineralized-CO2 aggregates are currently produced only in very limited quantities. Table 5 summarizes the current production capacities of various alternatives throughout the United States and the projected estimates required to meet Michigan’s annual demand.
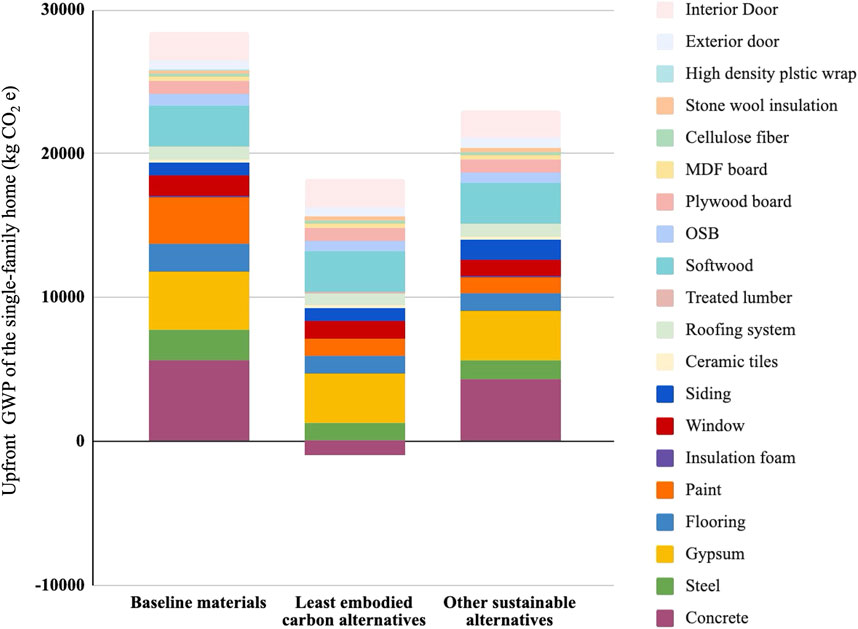
Figure 5. Overview of individual material contributions to the total embodied carbon (A1-A4 emissions) of the single family home for three different material substitution scenario. Darker colors represent materials that are substituted with like-for-like alternatives.
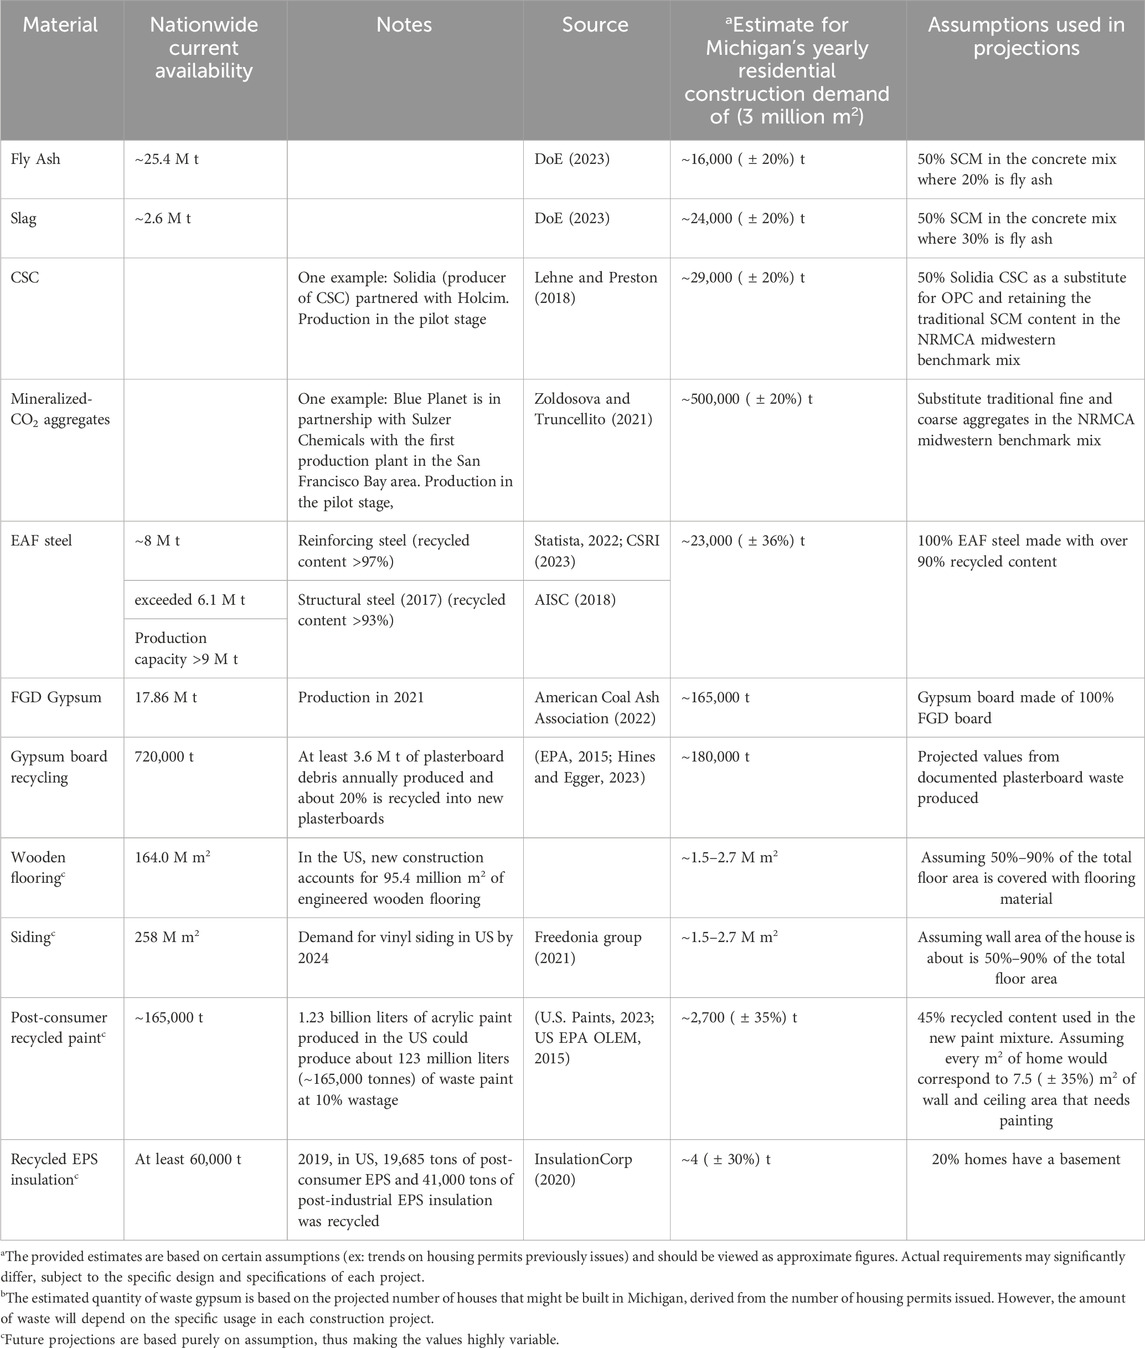
Table 5. Current production capacity of the low embodied carbon options and projected estimate to meet Michigan’s annual material demand (M = Million, t = metric tonnes, ∼ = approximately).
The transition to low-carbon alternatives is not without its challenges, as indicated by the Technology Readiness Level (TRL) summary table (Table 6) and the quadrant graph (Figure 6) provided in the study. These analytical tools reveal a nuanced landscape where some materials demonstrate high carbon savings yet have a lower TRL, reflecting an emergent market availability and technological maturity stage. This disparity underscores the necessity for targeted investments and intensified research and development efforts to enhance such materials’ scalability and market penetration.
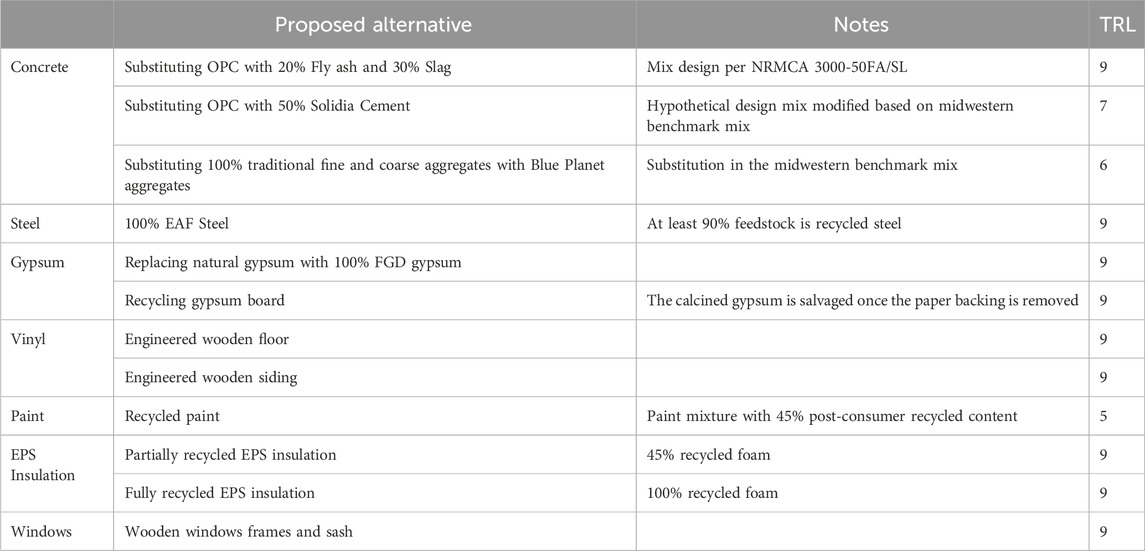
Table 6. TRL of the various like-for-like alternatives proposed in the study.
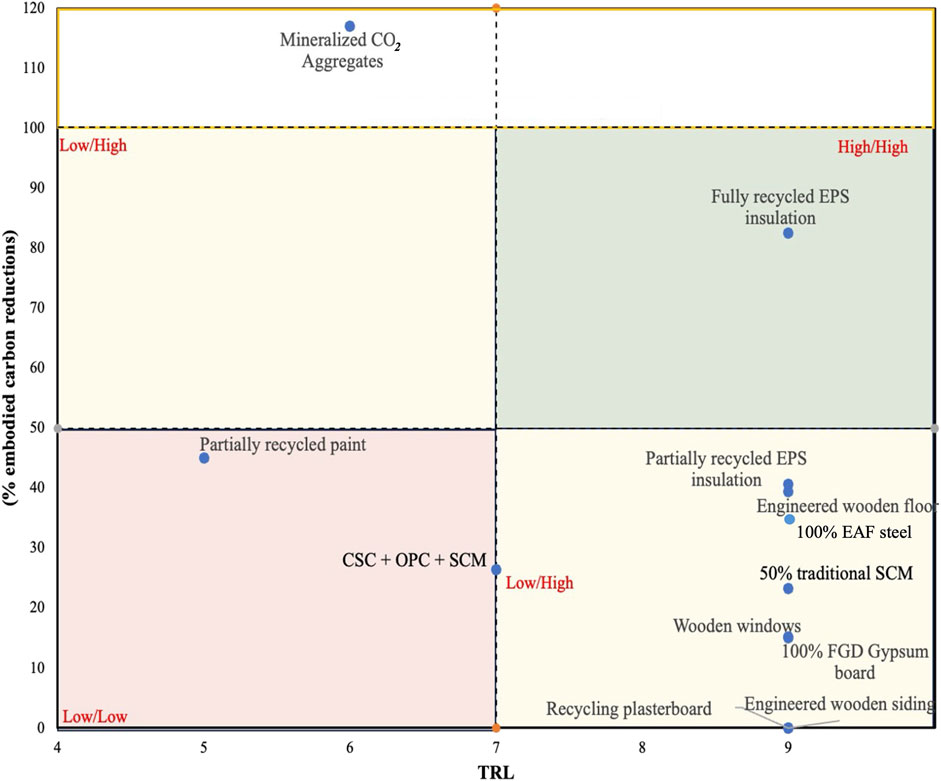
Figure 6. The potential reduction of embodied carbon for most impactful materials varies over a wide range. It is critically important to note that some promising materials have not yet reached market readiness and availability to meet the needs of the construction industry.
4.2.1 High impact, early development technologies (low TRL, high carbon savings)
Mineralized-CO2 aggregates, exhibiting a remarkable potential for embodied carbon reduction, are currently in their developmental infancy. Their substantial environmental promise necessitates focused efforts to enhance their technological readiness. This advancement could be significantly bolstered by development funding, strategic partnerships, and the formulation of policies that actively encourage using such materials.
4.2.2 Established and effective technologies (high TRL, high carbon savings)
Fully recycled EPS insulation stands out as a leading example in low-carbon construction materials, offering significant carbon savings and high technological readiness. This material sets a benchmark in combining environmental benefit and practical utility in the building sector. The key challenge and opportunity with fully recycled EPS insulation lies in expanding its adoption. This adoption could be strengthened by bolstering consumer education and reinforcing supply chain sustainability.
4.2.3 Mature Technologies with Room for Improvement (High TRL, Lower Carbon Savings)
Utilizing Coal Combustion Product (CCP) by-products in concrete mix and gypsum boards, along with technologies like wooden windows and partially recycled EPS foam, are already well-integrated in the market, though they offer moderate levels of carbon savings. Some mature technologies like engineered wooden siding and recycled gypsum board do not demonstrate any carbon savings. The primary focus for these technologies should pivot towards incremental innovation. This involves optimizing production processes by incorporating renewable energy sources, employing low-emission transportation methods, and enhancing material properties through advanced material science.
4.2.4 Emerging technologies with limited impact (low TRL, low carbon savings)
CSC used with OPC and SCM and using post-consumer recycled paint to produce fresh paint mixtures are characterized by low TRLs and carbon savings. These technologies are in the early stages of development and have not yet realized their full potential for carbon reduction. Development should be two-pronged: refining the technology for readiness and scalability and innovating within it for greater environmental impact. This involves optimizing production processes by incorporating renewable energy sources, employing low-emission transportation methods, enhancing material properties through advanced material science, leveraging recycling technology advancements, improving supply chain logistics for waste materials, and developing better formulations. These steps can boost both the TRL and carbon savings potential of these materials.
5 Conclusion
The study evaluated the carbon footprint of conventional materials used in the construction of a 265 m2 single-family home, which resulted in an embodied carbon footprint of approximately 28,450 kg CO2e, or 107.35 kg CO2e/m2. The substitution of these materials with established low embodied carbon alternatives resulted in a significant decrease in the home’s embodied carbon footprint to around 17,300 kg CO2e, or roughly 65.3 kg CO2e/m2 as demonstrated in Figure 5. Although the production of most alternative materials in the United States is sufficient to meet the imminent demands of Michigan’s construction sector, innovative alternatives in the concrete industry—which significantly affect environmental impact—have not yet achieved the necessary scale of production. Recycled EPS insulation is one material that is technologically mature and is able to reduce around 80% of the carbon footprint of the EPS insulation compared to virgin EPS insulation. But most high TRL like-for-like sustainable substitutes show less than 50% reduction in embodied carbon compared to their conventional counterparts.
The task ahead involves a concerted effort to bridge the gap between current production capacities and the prospective demand from Michigan, further the Midwest and the country’s robust construction sector. While the substitutes are well established in the market, effort must be underpinned by strategic investments in technology, targeted research to enhance material properties and production processes, and policy frameworks that incentivize the adoption of alternative materials and reducing the embodied carbon of widely adopted substitutes. By doing so, the construction industry can significantly contribute to the states, and indeed the nation’s, carbon reduction targets, setting a benchmark for alternative practices in residential building projects. There’s a wide range of opportunities in the low-embodied carbon materials sector. High-impact, early-stage technologies need extensive research and development for market readiness. For novel materials like mineralized CO2 aggregates and CSC, steps like financial incentives, building code modifications, and concrete PCR incorporating CCUS are crucial so that relevant EPDs could be produced to aid procurement. Established technologies should focus on market expansion to become the norm. Mature but less effective technologies require targeted innovation.
Data availability statement
The original contributions presented in the study are included in the article/supplementary material, further inquiries can be directed to the corresponding author.
Author contributions
SR: Writing–review and editing, Writing–original draft, Visualization, Software, Methodology, Investigation, Formal Analysis, Data curation, Conceptualization. SM: Writing–review and editing, Validation, Supervision, Resources, Methodology, Conceptualization. VS: Writing–review and editing, Validation, Supervision, Resources, Project administration.
Funding
The author(s) declare financial support was received for the research, authorship, and/or publication of this article. This work was supported by the Global CO2 Initiative at the University of Michigan.
Conflict of interest
The authors declare that the research was conducted in the absence of any commercial or financial relationships that could be construed as a potential conflict of interest.
The author(s) declared that they were an editorial board member of Frontiers, at the time of submission. This had no impact on the peer review process and the final decision.
Publisher’s note
All claims expressed in this article are solely those of the authors and do not necessarily represent those of their affiliated organizations, or those of the publisher, the editors and the reviewers. Any product that may be evaluated in this article, or claim that may be made by its manufacturer, is not guaranteed or endorsed by the publisher.
References
Agéco, G., and Bushi, L. (2018). Epd - boomerang Interior recycled latex paints Report No: #1761-3445. Available from: https://www.peintureboomerang.com/wp-content/uploads/2020/04/PL106_Laurentide_EPD_20112017.pdf.
AISC (2018). Made in America | American Institute of steel construction. Available from: https://www.aisc.org/why-steel/made-in-america/ (Accessed December 10, 2023).
Aktas, C. B., and Bilec, M. M. (2012). Impact of lifetime on US residential building LCA results. Int. J. Life Cycle Assess. 17 (3), 337–349. doi:10.1007/s11367-011-0363-x
Ali, A., Koch, T. W., Volk, T. A., Malmsheimer, R. W., Eisenbies, M. H., Kloster, D., et al. (2022). The environmental life cycle assessment of electricity production in New York state from distributed solar photovoltaic systems. Energies 15 (19), 7278. doi:10.3390/en15197278
American Coal Ash Association (2022). 2021 coal combustion product (CCP) production and use survey report. Available from: https://acaa-usa.org/wp-content/uploads/2022/12/2021-Production-and-Use-Survey-Results-FINAL.pdf.
American Coating Association (2016). ACA and PaintCare®: steering a post-consumer paint solution. Report No: no 24 vol 1. Available from: https://www.paint.org/wp-content/uploads/dlm_uploads/2019/11/ib-paintcare.pdf.
American Home Size Index (2022). The 2022 American home size Index. Available from: https://www.ahs.com/home-matters/real-estate/the-2022-american-home-size-index/ (Accessed November 21, 2023).
Andersen, C. E., Rasmussen, F. N., Habert, G., and Birgisdóttir, H. (2021). Embodied GHG emissions of wooden buildings—challenges of biogenic carbon accounting in current LCA methods. Front. Built Environ. 7, 729096. doi:10.3389/fbuil.2021.729096
Arceo, A., Tham, M., Guven, G., MacLean, H. L., and Saxe, S. (2021). Capturing variability in material intensity of single-family dwellings: a case study of Toronto, Canada. Resour. Conservation Recycl. 175, 105885. doi:10.1016/j.resconrec.2021.105885
Arvidsson, R., Tillman, A., Sandén, B. A., Janssen, M., Nordelöf, A., Kushnir, D., et al. (2018). Environmental assessment of emerging technologies: recommendations for prospective LCA. J Industrial Ecol. 22 (6), 1286–1294. doi:10.1111/jiec.12690
Assuris, I., McCollum, C., and Mellentine, J. (2021). EPS INSULATION-EPD. North America EN. Available from: https://transparencycatalog.com/company/eps-industry-alliance.
Balaguera, A., Carvajal, G. I., Albertí, J., and Fullana-i-Palmer, P. (2018). Life cycle assessment of road construction alternative materials: a literature review. Resour. Conservation Recycl. 132, 37–48. doi:10.1016/j.resconrec.2018.01.003
Baran, E., Czernik, S., Hynowski, M., Michałowski, B., Piasecki, M., Tomaszewska, J., et al. (2021). Quantifying environmental burdens of plasters based on natural vs. Flue gas desulfurization (FGD) gypsum. Sustainability 13 (8), 4298. doi:10.3390/su13084298
Ben-Alon, L., Loftness, V., Harries, K. A., and Cochran Hameen, E. (2021). Life cycle assessment (LCA) of natural vs conventional building assemblies. Renew. Sustain. Energy Rev. 144, 110951. doi:10.1016/j.rser.2021.110951
Blaze PaintRite Pros (2022). How much does a gallon of paint cover and what tools to use. Available from: https://www.paintritepros.com/blog/how-much-does-a-gallon-of-paint-cover/ (Accessed December 14, 2023).
Blue Planet Systems (2023). Blue Planet systems IMPACT. Available from: https://www.blueplanetsystems.com/impact (Accessed November 20, 2023).
Bloomberg News (2022). BNN U.S. Housing starts rise unexpectedly on multifamily building - BNN bloomberg. Available from: https://www.bnnbloomberg.ca/u-s-housing-starts-rise-unexpectedly-on-multifamily-building-1.1709813 (Accessed November 17, 2023).
Bowles, W., Cheslak, K., and Edelson, J. (2022). Lifecycle GHG impacts in building codes. Portland, OR: New Buildings Institute. Available from: https://newbuildings.org/wp-content/uploads/2022/04/LifecycleGHGImpactsinBuildingCodes.pdf.
Bowyer, J., McFarland, A., Henderson, C., and Jacobs, M. (2019). Environmental assessment of house cladding products. Report No.: 11. Minneapolis, MN, United States: Dovetail Partners. Inc. Available from: https://www.researchgate.net/publication/336778283_Environmental_Assessment_of_House_Cladding_Products.
Bruce (2023). Solid hardwood vs engineered hardwood | Bruce wood flooring. Available from: https://www.bruce.com/en-us/resources/solid-vs-engineered-hardwood-flooring.html (Accessed December 5, 2023).
Burns, S. (2023). AISI releases annual statistical report for 2022. American Iron and Steel Institute. Available from: https://www.steel.org/2023/06/aisi-releases-annual-statistical-report-for-2022/ (Accessed November 27, 2023).
Bushi, D. L. (2020). An industry average cradle-to-gate life cycle assessment of 1/2” lightweight and 5/8” type X conventional gypsum board for the USA and Canadian markets.
Centre for Sustainable Sysytem (2023). Center for sustainable systems residential buildings factsheet. Ann Arbor: University of Michigan. Available from: https://css.umich.edu/publications/factsheets/built-environment/residential-buildings-factsheet (Accessed December 12, 2023).
Chang, D., Hroncova, B., Liguori, E., Xu, X., and Yang, J. (2016). Life-cycle assessment of Portland concrete and solidia technologies concrete production. Available from: https://prezi.com/-3d_4m2c_fmu/comparative-life-cycle-assessments-of-traditional-manufactur/.
Chen, C. X., Pierobon, F., Jones, S., Maples, I., Gong, Y., and Ganguly, I. (2021). Comparative life cycle assessment of mass timber and concrete residential buildings: a case study in China. Sustainability 14 (1), 144. doi:10.3390/su14010144
Cheol Lee, J., L Bradshaw, S., B Edil, T., and H Benson, C. (2012). Quantifying the benefits of using flue gas desulfurization gypsum in sustainable wallboard production. CCGP J. 4, 17–20. doi:10.4177/ccgp-d-10-00007.1
Crangle, R. (2023). Gypsum statistics and information | U.S. Geological survey. Available from: https://www.usgs.gov/centers/national-minerals-information-center/gypsum-statistics-and-information (Accessed November 27, 2023).
CSRI (2023). CRSI: concrete reinforcing steel Institute. Schaumburg, IL, United States: The Institute. Available from: https://www.crsi.org/about-us/the-institute/ (Accessed December 10, 2023).
Desai, A., and Bheemrao, N. (2022). Life cycle assessment of construction materials and its environmental impacts for sustainable development. Mater. Today Proc. 65, 3866–3873. doi:10.1016/j.matpr.2022.07.171
Dodge, B., and Liu, R. (2018). “Comparing exterior wall finishes using life-cycle assessment,” in Healthy, intelligent and resilient buildings and urban environments (Syracuse, NY, United States: International Association of Building Physics IABP), 289–294. Available from: https://surface.syr.edu/ibpc/2018/BE8/1 (Accessed December 6, 2023).
DoE (2023). Pathways to commercial liftoff: low-carbon cement. Washington DC: Department of Energy. Available at: https://liftoff.energy.gov/wp-content/uploads/2023/09/20230918-Pathways-to-Commercial-Liftoff-Cement.pdf.
Dryhome (2014). Why vinyl is still the most popular choice for siding - DryHome roofing and siding. Available from: https://www.dryhome.com/why-vinyl-siding-is-still-most-popular/ (Accessed December 6, 2023).
Dunmade, I. (2012). Recycle or dispose off? Lifecycle environmental sustainability assessment of paint recycling process. RE 2 (6), 291–296. doi:10.5923/j.re.20120206.07
Economics 243 Fall (2018). 2016 BOF and EAF steels: what are the differences. Available from: https://econ243.academic.wlu.edu/2016/03/07/bof-and-eaf-steels-what-are-the-differences/ (Accessed November 27, 2023).
Eliassen, A. R., Faanes, S., and Bohne, R. A. (2019). Comparative LCA of a concrete and steel apartment building and a cross laminated timber apartment building. IOP Conf. Ser. Earth Environ. Sci. 323 (1), 012017. doi:10.1088/1755-1315/323/1/012017
EPA (2015). Drywall | US EPA archive document. Available from: https://archive.epa.gov/epawaste/conserve/tools/warm/pdfs/Drywall.pdf.
Fan, Z., and Friedmann, S. J. (2021). Low-carbon production of iron and steel: technology options, economic assessment, and policy. Joule 5 (4), 829–862. doi:10.1016/j.joule.2021.02.018
Feldman, S. (2022). Scoring flooring: industry stats for 2021. United States: Floor Covering News. Available from: https://www.fcnews.net/2022/06/scoring-flooring-industry-stats-for-2021/ (Accessed December 5, 2023).
Fnais, A., Rezgui, Y., Petri, I., Beach, T., Yeung, J., Ghoroghi, A., et al. (2022). The application of life cycle assessment in buildings: challenges, and directions for future research. Int. J. Life Cycle Assess. 27 (5), 627–654. doi:10.1007/s11367-022-02058-5
Fořt, J., and Černý, R. (2018). Carbon footprint analysis of calcined gypsum production in the Czech Republic. J. Clean. Prod. 177, 795–802. doi:10.1016/j.jclepro.2018.01.002
Freedonia group (2021). Global vinyl siding (cladding) - market size, market share, market leaders, demand forecast, sales, company profiles, market research, industry trends and companies. Available from: https://www.freedoniagroup.com/industry-study/global-vinyl-siding-cladding-3954.htm (Accessed December 10, 2023).
Gagnon, P., Sanchez Perez, P. A., Obika, K., Schwarz, M., Morris, J., Gu, J., et al. (2023). Cambium 2023 scenario descriptions and documentation golden, CO; report No: NREL/TP-6A40-88507. Available from: https://www.nrel.gov/docs/fy24osti/88507.pdf.
Hanifa, M., Agarwal, R., Sharma, U., Thapliyal, P. C., and Singh, L. P. (2023). A review on CO2 capture and sequestration in the construction industry: emerging approaches and commercialised technologies. J. CO2 Util. 67, 102292. doi:10.1016/j.jcou.2022.102292
Head, M., Magnan, M., Kurz, W. A., Levasseur, A., Beauregard, R., and Margni, M. (2021). Temporally-differentiated biogenic carbon accounting of wood building product life cycles. SN Appl. Sci. 3 (1), 62. doi:10.1007/s42452-020-03979-2
Hines, S., and Egger, S. (2023). Recycling gypsum | walls and ceilings. Available from: https://www.wconline.com/articles/95109-recycling-gypsum (Accessed December 10, 2023).
Iddon, C. R., and Firth, S. K. (2013). Embodied and operational energy for new-build housing: a case study of construction methods in the UK. Energy Build. 67, 479–488. doi:10.1016/j.enbuild.2013.08.041
IEA (2023). IEA buildings - energy system. Available from: https://www.iea.org/energy-system/buildings (Accessed December 18, 2023).
InsulationCorp (2020). The truth behind EPS recycling. Allentown, PA, United States: Insulation Corporation of America. Available from: https://insulationcorp.com/the-truth-behind-eps-recycling/ (Accessed December 10, 2023).
International Energy Agency and United Nations Environment Programme (2018). 2018 Global Status Report: towards a zero-emission, efficient and resilient buildings and construction sector. Europe: International Energy Agency and United Nations Environment Programme. Available from: https://iea.blob.core.windows.net/assets/30a31866-26ed-4c57-9d6f-3d382442b3fb/2018_Global_Status_Report.pdf.
Jang, Y. C., and Townsend, T. (2001). Sulfate leaching from recovered construction and demolition debris fines. Adv. Environ. Res. 5 (3), 203–217. doi:10.1016/s1093-0191(00)00056-3
Kaufman, Z., Klammer, N., Podder, A., and Pless, S. (2022). “A scalable method for decarbonizing modular building solutions,” in Pacific grove, California renewable energy laboratory. NREL/CP-5500-82516. Available from: https://www.nrel.gov/docs/fy22osti/82516.pdf.
Khung, D. (2022). Life cycle assessment (LCA) and cost-benefit analysis for low carbon concrete and cement mix designs. U. N. (UN) Sustain. Dev. Solutions Netw. (SDSN), 44. Available at: https://irp.cdn-website.com/be6d1d56/files/uploaded/Low%20Carbon%20Concrete%20LCA%20and%20Cost-Benefit%20Whitepaper_Updated-aec30a40.pdf
Lehne, J., and Preston, F. (2018). Making concrete change. Available from: https://www.chathamhouse.org/sites/default/files/publications/2018-06-13-making-concrete-change-cement-lehne-preston-final.pdf.
Lewis, C. (2021). What is acrylic paint? - acrylic paint uses, ingredients, and more art in context. Available from: https://artincontext.org/what-is-acrylic-paint/ (Accessed December 8, 2023).
Lewis, M., Huang, M., Waldman, B., Carlisle, S., and Simonen, K. (2021). EPD requirements in procurement policies. Seattle, WA: Carbon Leadership Forum, University of Washington. Available from: https://carbonleadershipforum.org/epd-requirements-in-procurement-policies/ (Accessed December 1, 2023).
Li, X., Zhu, Y., and Zhang, Z. (2010). An LCA-based environmental impact assessment model for construction processes. Build. Environ. 45 (3), 766–775. doi:10.1016/j.buildenv.2009.08.010
Lstiburek, J. (2021). GM-2101: guide for building conditioned unvented attics and unconditioned unvented attics with fiberglass and mineral wool insulation | buildingscience.com. Available from: https://buildingscience.com/documents/guides-and-manuals/gm-2101-guide-building-conditioned-unvented-attics-and-unconditioned (Accessed December 9, 2023).
Luca, A., Antonio, G., Scalia Giada, L., Fata Concetta Manuela, L., and Rosa, M. (2023). Life cycle assessment of a new industrial process for sustainable construction materials. Ecol. Indic. 148, 110042. doi:10.1016/j.ecolind.2023.110042
Ma, Z. (2021). 9 best zero-VOC and nontoxic paint brands to transform your space MyDomaine. Available from: https://www.mydomaine.com/nontoxic-paint-brands (Accessed December 8, 2023).
Magwood, C. (2016). Carbon smart straw bale structural insulated panels. Available from: https://www.greenbuildermedia.com/blog/carbon-smart-straw-bale-structural-insulated-panels (Accessed December 9, 2023).
Magwood, C., and Huynh, T. (2023). The hidden climate impact of residential construction 2023. RMI. Available from: https://rmi.org/insight/hidden-climate-impact-of-residential-construction/.
Manjunatha, M., Preethi, S., Malingaraya, M. H. G., and Niveditha, K. N., (2021). Life cycle assessment (LCA) of concrete prepared with sustainable cement-based materials. Mater. Today Proc. 47, 3637–3644. doi:10.1016/j.matpr.2021.01.248
Matheny, K. (2021). “Detroit free press,” in Michigan sucks at recycling. Blame plentiful and cheap landfills. Available from: https://www.freep.com/story/news/local/michigan/wayne/2021/01/04/michigan-recycling-landfills/4099956001/ (Accessed November 27, 2023).
Meyer, V., De Cristofaro, N., Bryant, J., and Sahu, S. (2018). Solidia cement an example of carbon capture and utilization. KEM 761, 197–203. Available at: https://doi.org/10.4028/www.scientific.net/KEM.761.197.
Michigan Energy Code (2015). “Chapter 11: [RE] energy efficiency, Michigan residential code 2015,” in Michigan residential codes 2015. Available from: https://up.codes/viewer/michigan/mi-residential-code-2015/chapter/11/re-energy-efficiency#11 (Accessed December 9, 2023).
Mitsubishi Corporation (2020). Mitsubishi corporation use of CO2 in concrete/partnership with blue Planet systems corporation. Available from: https://www.mitsubishicorp.com/jp/en/pr/archive/2020/html/0000046043.html (Accessed November 27, 2023).
Mokhlesian, S., and Holmén, M. (2012). Business model changes and green construction processes. Constr. Manag. Econ. 30 (9), 761–775. doi:10.1080/01446193.2012.694457
Monahan, J., and Powell, J. C. (2011). An embodied carbon and energy analysis of modern methods of construction in housing: a case study using a lifecycle assessment framework. Energy Build. 43 (1), 179–188. doi:10.1016/j.enbuild.2010.09.005
Moura, M. C. P., Smith, S. J., and Belzer, D. B. (2015). 120 Years of U.S. Residential housing stock and floor space. PLoS ONE 10 (8), e0134135. doi:10.1371/journal.pone.0134135
Naeth, M. A., and Wilkinson, S. R. (2013). Can we build better compost? Use of waste drywall to enhance plant growth on reclamation sites. J. Environ. Manag. 129, 503–509. doi:10.1016/j.jenvman.2013.08.012
Ndukwe, I., and Yuan, Q. (2016). Drywall (gyproc plasterboard) recycling and reuse as a compost-bulking agent in Canada and North America: a review. Recycling 1 (3), 311–320. doi:10.3390/recycling1030311
Ned Monroe (2023). Vinyl recycling. Available from: https://www.vinylinfo.org/pressroom/pvc-recycling-grant-program/.
North America Wood Flooring Market Share (2022). North America wood flooring market share report, 2030 report No: gvr-3-68038-047-7, 92. Available from: https://www.grandviewresearch.com/industry-analysis/north-america-wood-flooring-market (Accessed December 5, 2023).
NREL (2023). NREL innovations help consumers invest in our Planet | news | NREL. Available from: https://www.nrel.gov/news/features/2023/nrel-innovations-help-consumers-invest-in-our-planet.html (Accessed April 22, 2023).
NRMCA (2019). NRMCA member national and regional LCA benchmark (industry average) report – V 3.0. Pennsylvania, United States: Athena Sustainable Materials Institute.
One Click LCA (2023). One Click LCA help centre average quantities of reinforcement in concrete. Available from: https://oneclicklca.zendesk.com/hc/en-us/articles/360020943800-Average-Quantities-of-Reinforcement-in-Concrete (Accessed November 27, 2023).
Orr, J., Gibbons, O., and Arnold, W. (2020). A brief guide to calculating embodied carbon. Struct. Eng. 98 (7), 22–27. doi:10.56330/jznx5709
Paiano, A., Gallucci, T., Pontrandolfo, A., Lagioia, G., Piccinno, P., and Lacalamita, A. (2021). Sustainable options for paints through a life cycle assessment method. J. Clean. Prod. 295, 126464. doi:10.1016/j.jclepro.2021.126464
Petrovic, B., Myhren, J. A., Zhang, X., Wallhagen, M., and Eriksson, O. (2019). Life cycle assessment of building materials for a single-family house in Sweden. Energy Procedia 158, 3547–3552. doi:10.1016/j.egypro.2019.01.913
Pichtel, J. (2014). Waste management practices. 0. Boca Raton: CRC Press. Available from: https://www.taylorfrancis.com/books/9781466585195 (Accessed November 27, 2023).
Plank, V. (2023). Solid hardwood vs engineered flooring: which is right for you? Available from: https://vermontplankflooring.com/blog/solid-hardwood-vs-engineered-flooring/ (Accessed December 5, 2023).
Plastics News (2022). Vinyl siding leads residential cladding market by volume. Available from: https://www.plasticsnews.com/news/vinyl-siding-leads-residential-cladding-market-volume (Accessed 2023 December 6).
Pranav, S., Aggarwal, S., Yang, E. H., Kumar Sarkar, A., Pratap Singh, A., and Lahoti, M. (2020). Alternative materials for wearing course of concrete pavements: a critical review. Constr. Build. Mater. 236, 117609. doi:10.1016/j.conbuildmat.2019.117609
Puettmann, M., Bergman, R., and Oneil, E. (2016). Cradle-to-gate life cycle assessment of North American hardboard and engineered wood siding and trim production. CORRIM, 77. Available at: https://www.fpl.fs.usda.gov/documnts/pdf2016/fpl_2016_puettmann002.pdf
Rahman, M. A., Imteaz, M., Arulrajah, A., and Disfani, M. M. (2014). Suitability of recycled construction and demolition aggregates as alternative pipe backfilling materials. J. Clean. Prod. 66, 75–84. doi:10.1016/j.jclepro.2013.11.005
Ramesh, T., Prakash, R., and Shukla, K. K. (2010). Life cycle energy analysis of buildings: an overview. Energy Build. 42 (10), 1592–1600. doi:10.1016/j.enbuild.2010.05.007
Richards-Purpura, H. (2021). “Foundation systems of Michigan,” in Which Michigan cities have the most basements? Available from: https://www.drymich.com/resources/basement-waterproofing/michigan-cities-have-the-most-basements/ (Accessed December 10, 2023).
Rinne, R., Ilgın, H. E., and Karjalainen, M. (2022). Comparative study on life-cycle assessment and carbon footprint of hybrid, concrete and timber apartment buildings in Finland. IJERPH 19 (2), 774. doi:10.3390/ijerph19020774
Roskoskey, D. (2007). Recycling drywall. Available from: https://www.michigan.gov/-/media/Project/Websites/egle/Documents/Policies-Procedures/MMD/Op-Memo-111-23.pdf?rev=848919f0b43d4d38ab8d93912f68e70d.
Royal Building Products (2022). Vinyl siding: a surprising way to go green | LiveAbodeTM | royal building products LiveAbode. Available from: https://www.royalbuildingproducts.com/liveabode/vinyl-siding-a-surprising-way-to-go-green/ (Accessed December 6, 2023).
Rumsey, E., Le Garrec, J., and Levasseur, A. (2021). How building decarbonization can transform HVAC. ASHRAE J. 63 (9). https://link.gale.com/apps/doc/A689991717/AONE?u=anon∼af77da49&sid=googleScholar&xid=e0b30886.
Seiders, D. D., Ahluwalia, G., Melman, S., Quint, R., Chaluvadi, A., Liang, M., et al. (2019). National association of home builders/bank of America home equity study of life expectancy of home components.
Seifritz, W. (1990). CO2 disposal by means of silicates. Nature 345 (6275), 486. doi:10.1038/345486b0
Sherwood, P. T., and Telford, T. (1995). Alternative materials in road construction: a guide to the use of waste, recycled materials, and by-products. London: New York: American Society of Civil Engineers, Publications Sales Dept, 124.
Solidiatech (2023). San antonio: solidia advances | solidia TechnologiesTM. Available from: https://www.solidiatech.com/solidia-technologies-commissions-pilot-line-at-expanded-headquarters-facility-in-san-antonio-texas/ (Accessed November 21, 2023).
Solomon, M. R. M. I. (2023). Opportunities for near-zero-emissions steel production in the great lakes. Available from: https://rmi.org/gap-analysis-for-near-zero-emissions-steel-production-in-the-great-lakes/ (Accessed November 27, 2023).
Statista (2022). U.S.: production of steel concrete reinforcing bars 2021. Available from: https://www.statista.com/statistics/191761/production-of-steel-concrete-reinforcing-bars-in-the-us-since-2000/ (Accessed December 10, 2023).
Statista (2023a). Life span of construction materials U.S. by source. Available from: https://www.statista.com/statistics/756177/us-construction-material-life-span-source/ (Accessed November 18, 2023).
Statista (2023b). U.S. paint and coatings production volume 2023. Available from: https://www.statista.com/statistics/1261305/paint-and-coatings-production-volume-us/ (Accessed December 8, 2023).
Statista (2023c). Wood door and window manufacturing in the U.S. Available from: https://www.statista.com/statistics/1193541/market-size-wood-door-window-manufacture-usa/ (Accessed December 10, 2023).
Steel Manufacturers Association (2021). Steel manufacturers association. Available from: https://steelnet.org/ (Accessed November 27, 2023).
Steel Production (2023). American iron and steel Institute. Available from: https://www.steel.org/steel-technology/steel-production/ (Accessed November 27, 2023).
Steel Tiles International (2020). Emissions for BF-BOF vs DR-EAF. Available from: https://www.proquest.com/openview/f473b22b3c99ea9d1700a6eae52cd2f9/1?pq-origsite=gscholar&cbl=1056347 (Accessed November 27, 2023).
Suárez, S., Roca, X., and Gasso, S. (2016). Product-specific life cycle assessment of recycled gypsum as a replacement for natural gypsum in ordinary Portland cement: application to the Spanish context. J. Clean. Prod. 117, 150–159. doi:10.1016/j.jclepro.2016.01.044
Tsikos, M. (2023). The role of insulation in whole-life carbon optimisation One Click LCA® software. Available from: https://www.oneclicklca.com/the-role-of-insulation-in-whole-life-carbon-optimisation/ (Accessed December 9, 2023).
USA Expandable Polystyrene (EPS) Market - Size (2023). Share and manufacturers. Available from: https://www.mordorintelligence.com/industry-reports/united-states-expandable-polystyrene-eps-market (Accessed December 9, 2023).
US Census Bureau (2022). CHARS - highlights. Available from: https://www.census.gov/construction/chars/highlights.html (Accessed November 21, 2023).
U.S. Census Bureau (2023a). FRED, federal reserve bank of St Louis FRED, federal reserve bank of St. Louis; new private housing units authorized by building permits for Michigan. Available from: https://fred.stlouisfed.org/series/MIBPPRIV (Aceesed November 21, 2023).
US Census Bureau (2023b). American housing survey (AHS). Available from: https://www.census.gov/programs-surveys/ahs.html (Accessed October 24, 2023).
US EPA OLEM (2015). Paint products stewardship initiative. Available from: https://www.epa.gov/evaluate/paint-products-stewardship-initiative (Accessed December 9, 2023).
US EPA OLEM (2016). Sustainable management of industrial non-hazardous secondary materials. Available from: https://www.epa.gov/smm/sustainable-management-industrial-non-hazardous-secondary-materials (Accessed November 27, 2023).
U.S. Paints (2023). U.S. Paints and coatings market analysis report, 2020-2027. Available from: https://www.grandviewresearch.com/industry-analysis/us-paints-coatings-market (Accessed December 7, 2023).
Venkatarama Reddy, B. V., and Jagadish, K. S. (2003). Embodied energy of common and alternative building materials and technologies. Energy Build. 35 (2), 129–137. doi:10.1016/s0378-7788(01)00141-4
Verma, C., Madan, S., and Hussain, A. (2016). Heavy metal contamination of groundwater due to fly ash disposal of coal-fired thermal power plant, Parichha, Jhansi, India. Cogent Eng. 3 (1), 1179243. doi:10.1080/23311916.2016.1179243
Vinyl Siding (2023). Can vinyl siding Be recycled? | unlimited siding. Available from: https://www.unlimitedsiding.com/vinyl-siding-recycled/ (Accessed December 7, 2023).
Wang, C. qiang, Liu, K., Huang, D. ming, Chen, Q., Tu, M. jie, Wu, K., et al. (2022). Utilization of fly ash as building material admixture: basic properties and heavy metal leaching. Case Stud. Constr. Mater. 17, e01422. doi:10.1016/j.cscm.2022.e01422
What Is Vinyl (2021). Vinyl siding recycling: everything you need to know! What is vinyl. Available from: https://www.whatisvinyl.com/vinyl-siding-recycling/ (Accessed December 6, 2023).
World Floor Covering Association (2023). Vinyl flooring. Available from: https://wfca.org/page/vinyl-flooring (Accessed December 4, 2023).
Zabalza Bribián, I., Valero Capilla, A., and Aranda Usón, A. (2011). Life cycle assessment of building materials: comparative analysis of energy and environmental impacts and evaluation of the eco-efficiency improvement potential. Build. Environ. 46 (5), 1133–1140. doi:10.1016/j.buildenv.2010.12.002
Zhang, W., Tan, S., Lei, Y., and Wang, S. (2014). Life cycle assessment of a single-family residential building in Canada: a case study. Build. Simul. 7 (4), 429–438. doi:10.1007/s12273-013-0159-y
Zhang, Z., Wong, Y. C., Arulrajah, A., and Horpibulsuk, S. (2018). A review of studies on bricks using alternative materials and approaches. Constr. Build. Mater. 188, 1101–1118. doi:10.1016/j.conbuildmat.2018.08.152
Zoldosova, D., and Truncellito, D. (2021). Sulzer and Blue Planet announce partnership to reduce CO2 emissions to sustainably transform the cement industry. Available from: https://www.sulzer.com/en/shared/news/210614-sulzer-and-blue-planet-announce-partnership-to-sustainably-transform-the-cement-industry (Accessed November 27, 2023).
Keywords: whole building life cycle assessment (WBLCA), alternative construction materials, technology readiness level (TRL), cradle-to-construction-site-gate, embodied carbon, LCA, house
Citation: Ranganath S, McCord S and Sick V (2024) Assessing the maturity of alternative construction materials and their potential impact on embodied carbon for single-family homes in the American Midwest. Front. Built Environ. 10:1384191. doi: 10.3389/fbuil.2024.1384191
Received: 08 February 2024; Accepted: 28 March 2024;
Published: 19 April 2024.
Edited by:
Fatemeh Pariafsai, Texas A and M University, United StatesReviewed by:
Roberto Minunno, Curtin University, AustraliaRoksana Jahan Tumpa, Central Queensland University, Australia
Faezeh Salehi, Texas A and M University, United States
Copyright © 2024 Ranganath, McCord and Sick. This is an open-access article distributed under the terms of the Creative Commons Attribution License (CC BY). The use, distribution or reproduction in other forums is permitted, provided the original author(s) and the copyright owner(s) are credited and that the original publication in this journal is cited, in accordance with accepted academic practice. No use, distribution or reproduction is permitted which does not comply with these terms.
*Correspondence: Sindhuja Ranganath, c2luZGh1cnBAdW1pY2guZWR1