 Chuanglian Luo1,2
 Yanfei Niu
- 1Guangzhou Guangjian Construction Engineering Testing Center Co. Ltd., Guangzhou, China
- 2GuangDong Engineering Technology Research Cencer of Building Health Monitoring and Security Early Warning, Guangzhou, China
- 3School of Civil Engineering, Guangzhou University, Guangzhou, China
This study predicted the fatigue life (N) of UHPC incorporated with different volume fractions (
1 Introduction
UHPC has emerged as a novel cementitious composite material, renowned for its high strength and exceptional durability (Yin et al., 2022; Song et al., 2018; Zhou and Uchida, 2017). As a result, it has found widespread application in the construction of large bridges and high-rise buildings (Amran et al., 2022). Notably, a significant number of these structures operate under cyclic loading conditions (Niu et al., 2022b; Niu et al., 2022a; Gao et al., 2022). However, due to the inherent discreteness resulting from the multiphase and inhomogeneous nature of concrete materials at the meso-level, there is considerable variability in the fatigue test results for concrete. Therefore, it is crucial to accurately characterize the fatigue life distribution of UHPC to ensure its reliable performance in such structures. Ganesh (Ganesh and Murthy, 2022) delved into the impact of stress levels (S) on the fatigue life (N) of UHPC and established that the scattered fatigue life (N) data can be statistically analyzed using the two-parameter Weibull distribution. This finding was further corroborated by Niu (Niu et al., 2022b), providing a robust framework for characterizing the fatigue behavior of UHPC. Therefore, due to its physically valid assumptions and robust experimental verification, the two-parameter Weibull distribution is chosen as an efficient method for quantitatively describing the distribution of fatigue life. Typically, the parameters of the Weibull distribution (the shape parameter α and the characteristic life u) are directly obtained using the graphical method. However, Singh (Goel et al., 2012) observed significant differences between the parameters derived from the graphical method and those obtained through the method of moments (Singh and Kaushik, 2003) and maximum likelihood estimation (Goel and Singh, 2014). Consequently, it is imperative to utilize the graphical method, the method of moments, and the method of maximum likelihood to calculate the parameters α and u, enabling a more accurate assessment of their variations. This comprehensive approach will enhance our understanding of the fatigue life distribution of UHPC, providing a more reliable basis for structural design and evaluation.
The number of fatigue cycles that UHPC can endure under a specific stress level can be represented by S-N curves. Makita and Brühwiler (2014) employed the Wohler equation to plot the S-N diagram in order to predict the fatigue life of UHPC under constant amplitude tensile fatigue cycles. However, it is important to note that the applied minimum fatigue stress,
Due to the heterogeneity of the UHPC composition, especially with the incorporation of steel fibers, the fatigue life exhibits significant fluctuations, which poses challenges in accurately predicting the fatigue behavior of UHPC. Therefore, it is imperative to incorporate the failure probability (
This study conducted an investigation into UHPC with different fiber volume fractions under varying applied stress levels. Subsequently, the parameters of fatigue equations representing the S-N curves were estimated, rendering these equations suitable for predicting the flexural fatigue strength of UHPC. The failure probability (
2 Experimental program
2.1 Materials and mixtures composition
The cementitious materials employed in this study were PII 52.5 portland cement and silica fume, the size distribution is shown in Figure 1 and the chemical composition is presented in Table 1. The silica fume contains 98% SiO2 with the averaged diameter of 0.2 μm. By using particle packing theory, the fine aggregate with two ranges (0.160–0.315 mm and 0.63–1.25 mm) was adopted to increase the stacking density. Superplasticizer, solid content 30%, was introduced to improve the workability for a low water-binder ratio fresh matrix. The properties of the steel fiber were presented in Table 2. The UHPC mixtures adopted to cast the tested specimens are listed in Figure 2. The water binder ratio (W/C) was 0.16 and the binder-sand ratio was 1:1, as shown in Table 3.
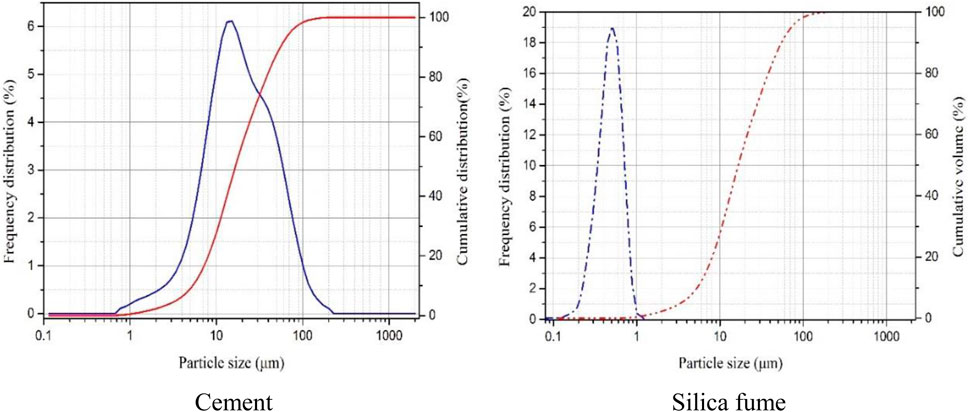
Figure 1. Particle size distribution of the cement and silica fume.
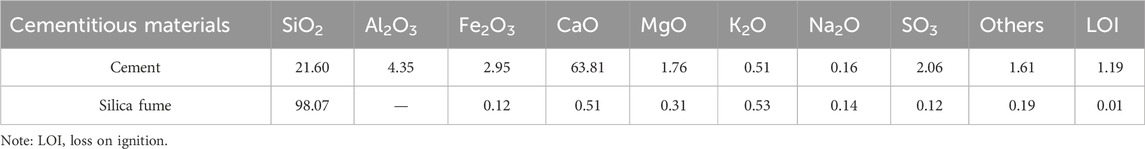
Table 1. Chemical compositions of the cementitious materials.
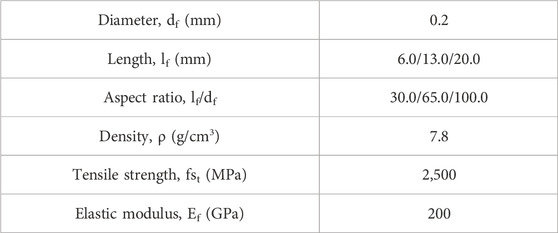
Table 2. Properties of the steel fiber.
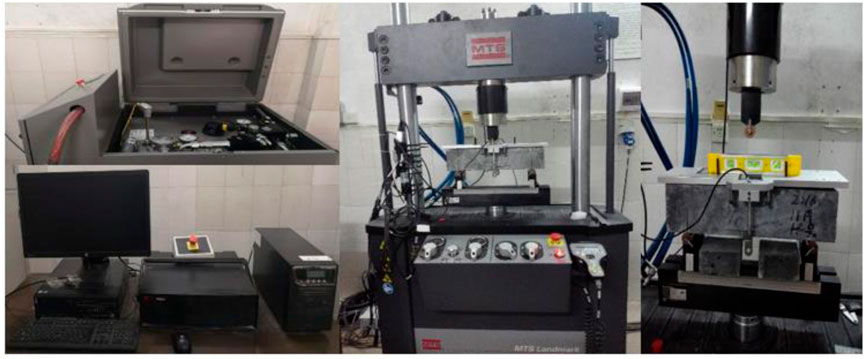
Figure 2. Mechanical test setup for measurement of UHPC specimen fatigue strength during cyclic flexural loading.
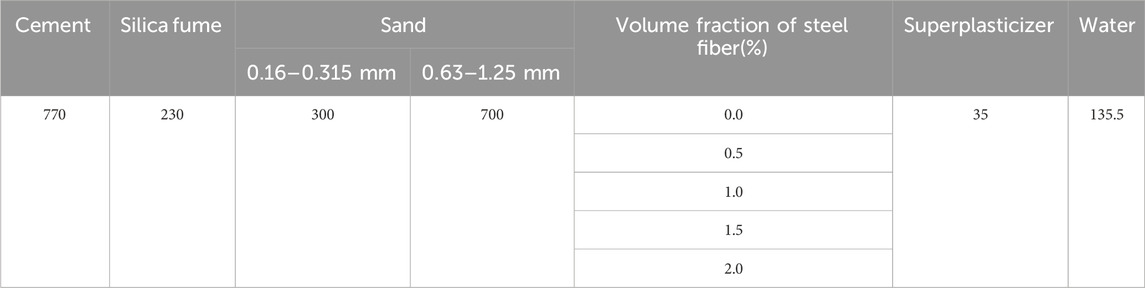
Table 3. Proportions of components in the UHPC mixture (
The mixing process was conducted in a double horizontal shaft mortar mixer with a volume fraction of 100 L. At the beginning of the mixing process, cement and silica fume were premixed for 2 min. Two types of silica sands with different particle diameters were added and stirred for another 5 min. Water and superplasticizer were then poured into the dry mixture and stirred for 10 min to provide the mortar matrix with considerable fluidity and viscosity. Finally, a small amount of steel fibers were added gradually into the fresh matrix and stirred for 5 min to improve the dispersion of steel fibers. The mixture was then poured along a single side of a mold to achieve a similar orientation distribution of the steel fibers, which can greatly improve the bending property of the specimen. The mold was vibrated for 90 s to enhance the compactness of the mixture. After the fresh concrete poured into the mould, the plastic sheets were covered on the top surface of the prepared specimens to reduce the water evaporation, then the hardened specimens were cured at room temperature for 24 h before demolding; Subsequently, the tested specimens were maintained into the water tank for 90 days to minimize the effect of the strength increase of the UHPC during the fatigue testing.
2.2 Fatigue testing
The dimensions of the tested specimens were 100 mm × 100 mm × 400 mm. Three beams were selected to measure the flexural strength and their values were averaged. A total of ten beams were utilized to assess the flexural fatigue strength. Based on the fatigue testing data, S-N diagrams were plotted for UHPC under various stress levels. To establish the appropriate stress levels, initial static flexural testing was conducted using a 100-kN MTS testing machine. The span for the flexural testing was set at 300 mm, and the loading frame operated in displacement-control mode with a constant rate of 0.02 mm/min, as shown in Figure 2. The static flexural stress of UHPC specimens containing fiber volume fractions of 0.5%, 1.0%, 1.5%, and 2.0% were 42.31, 54.47, 58.42, and 69.05 kN, respectively. For the fatigue testing, a loading frequency of 8 Hz was used with a constant-amplitude sinusoidal waveform. At present, there is no unified regulation for fatigue loading frequency. According to the performance of the testing machine, the cost and period of the test, the loading frequency of 5–15 Hz is usually adopted. When the loading frequency is between 100–900 times per minute, it has no obvious effect on the fatigue strength of concrete (Wu et al., 1995). If the loading speed is too slow, the creep will increase, and the fatigue strength or life will be reduced. In this paper, the loading frequency of 480 times per minute is selected, which is within a reasonable range.
Initially, the load was linearly increased to the average value,
3 Results and discussion
3.1 Fatigue test results
To establish the appropriate cyclic load stress level, it is crucial to first evaluate the flexural strength of the UHPC. The flexural strength of UHPC exhibits a positive correlation with fiber content. Specifically, when the fiber volume content (
The fatigue lives of UHPC specimens containing different volumes of steel fibers (
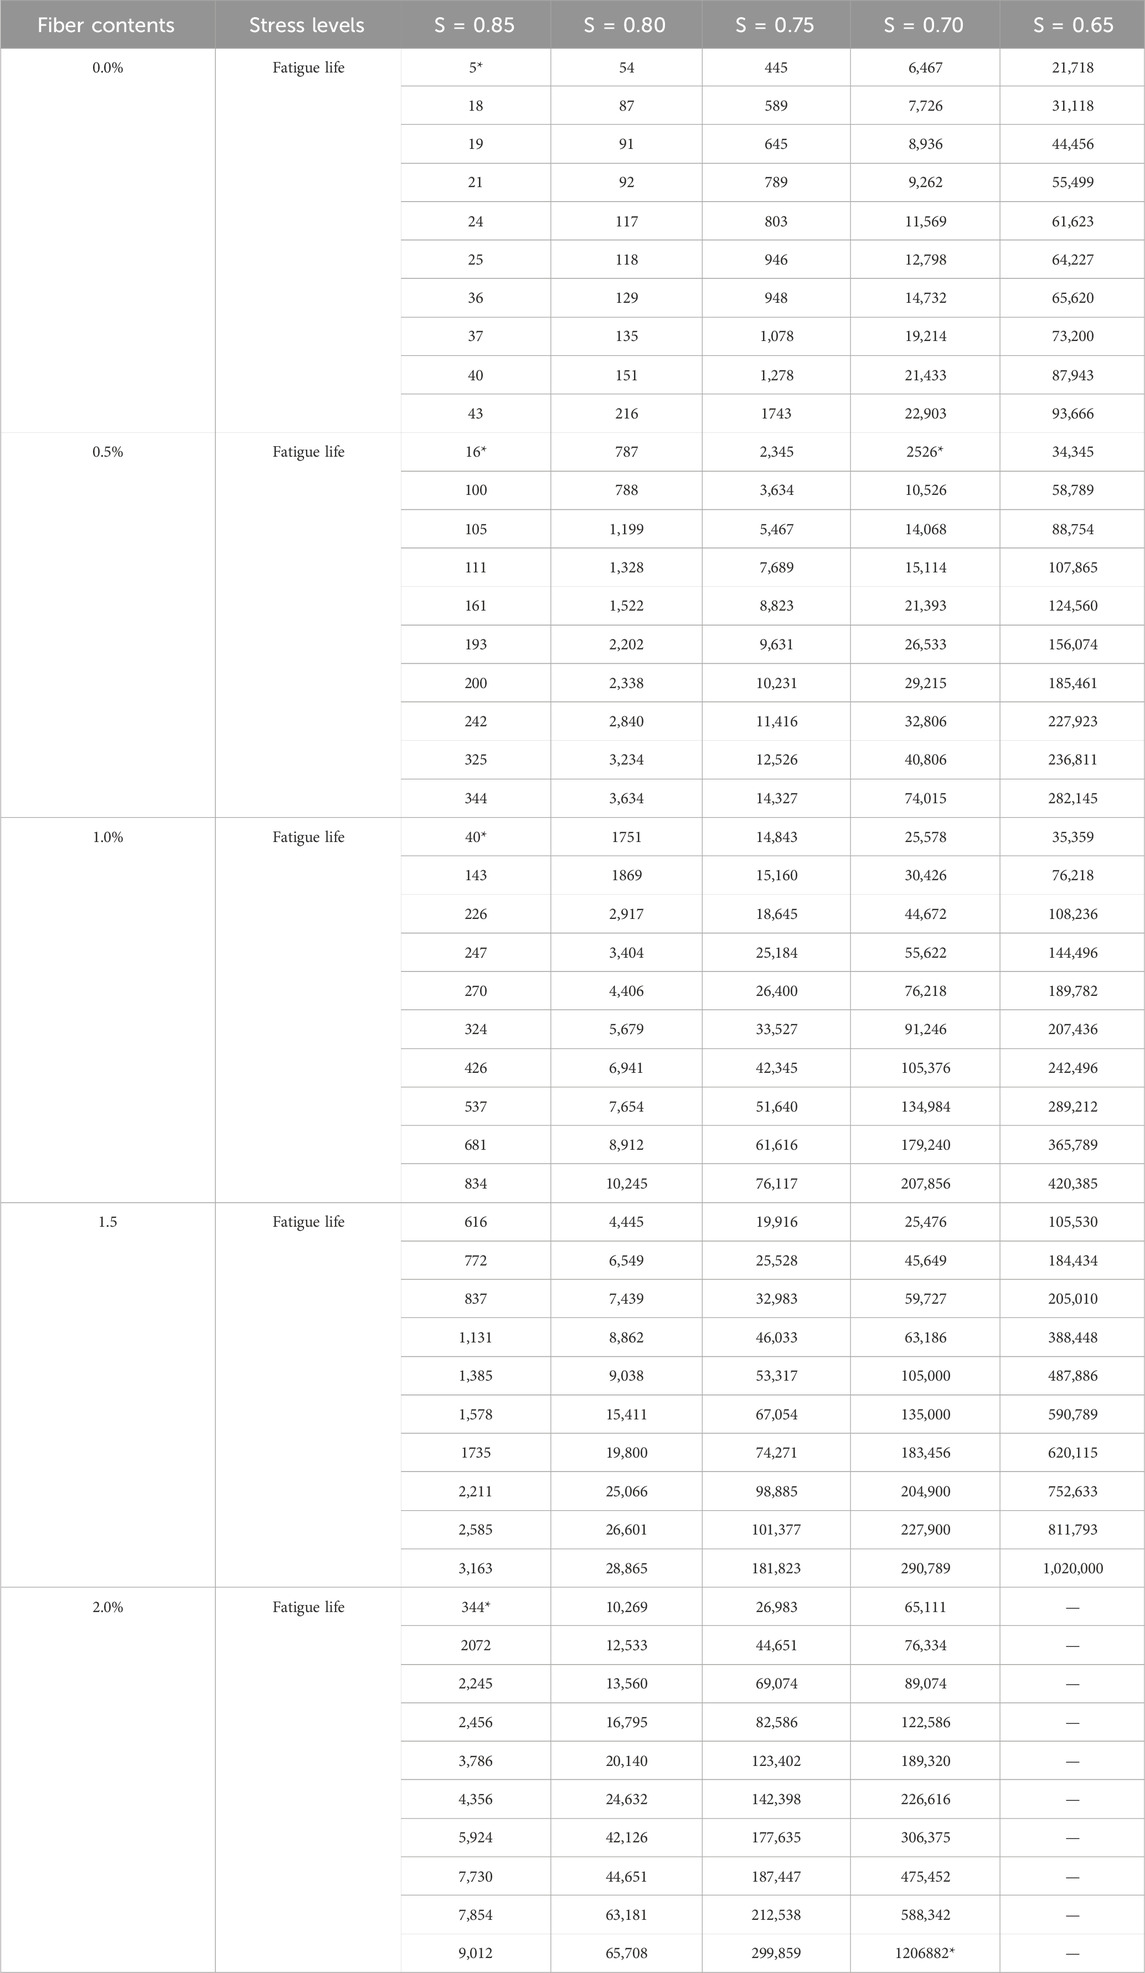
Table 4. Fatigue life data for UHPC with various of fiber contents.
3.2 Distribution of fatigue life
Due to the inherent uncertainties arising from internal defects in concrete structures and the inhomogeneous distribution of fibers, the fatigue life of UHPC exhibits significant variability. Consequently, numerous mathematical probability models have been proposed to statistically analyze the distribution of UHPC’s fatigue life. Presently, the Weibull distribution stands as a commonly employed mathematical probability statistical model for analyzing the fatigue life distribution of concrete, offering a robust framework for quantifying and understanding this complex phenomenon.
The Weibull probability distribution function f(n) and cumulative distribution function
n: specific value of random variable N; α and u: shape parameter of Weibull distribution and characteristic value of fatigue life, respectively;
According to Equation 2, the survival function of fatigue life, that is, the reliability function
For steel-fiber-reinforced concrete, assumed that the minimum fatigue life of the Weibull distribution function in practice is
After logarithm fetch on Equation 4 twice, the linear relation can be demonstrated as (Li et al., 2021):
For the Equation 5, the relationship between
To verify the fatigue life distribution of the UHPC using Equation 5, the fatigue life (N) of the UHPC under a certain stress level (S) allowed to be sorted in ascending order. And the reliability function
i: sequence number of a fatigue data value in the sequence of fatigue life; k: number of the tested specimens under cyclic loading with an given stress level; if there existed a linear relationship between
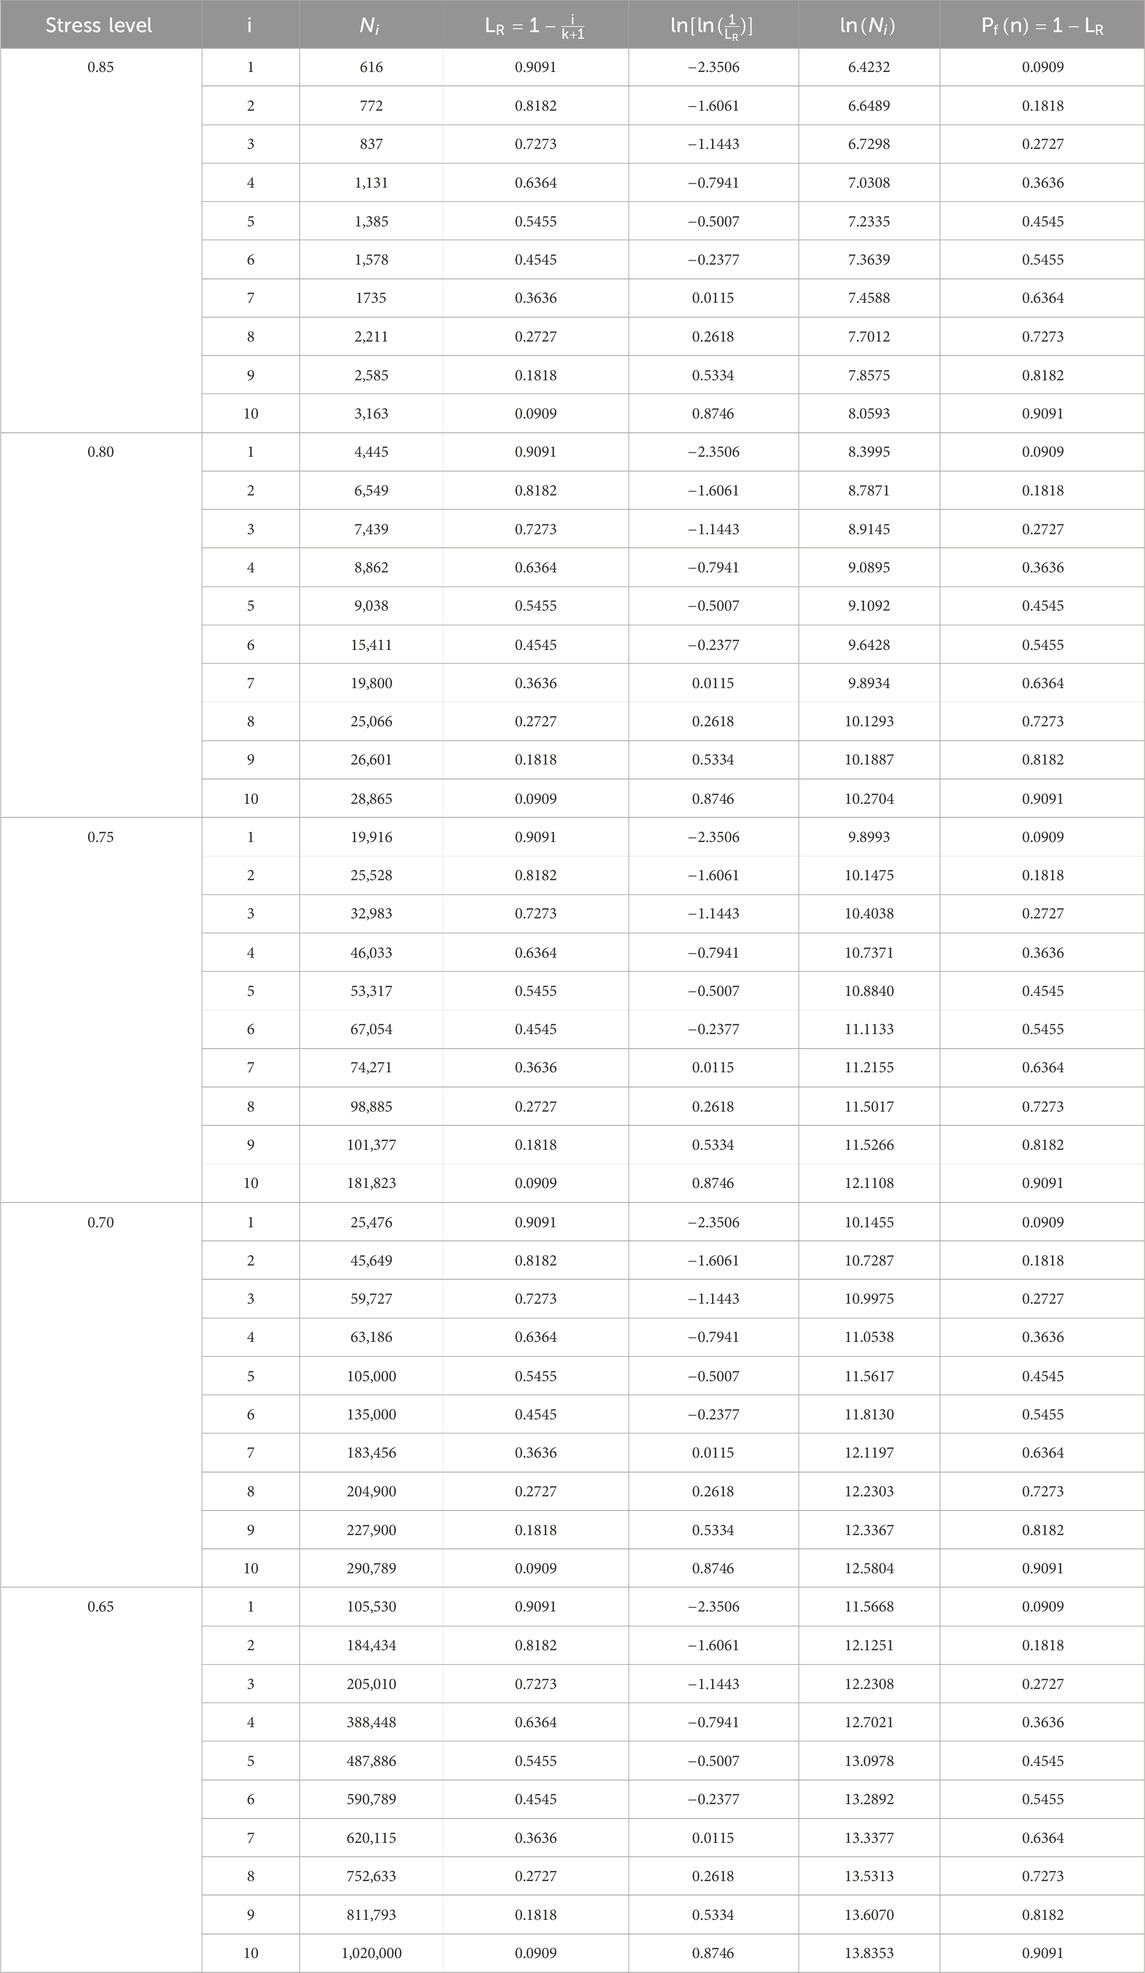
Table 5. Relationships between
Using the same method, the relationship between the fatigue life of the UHPC and the reliability function
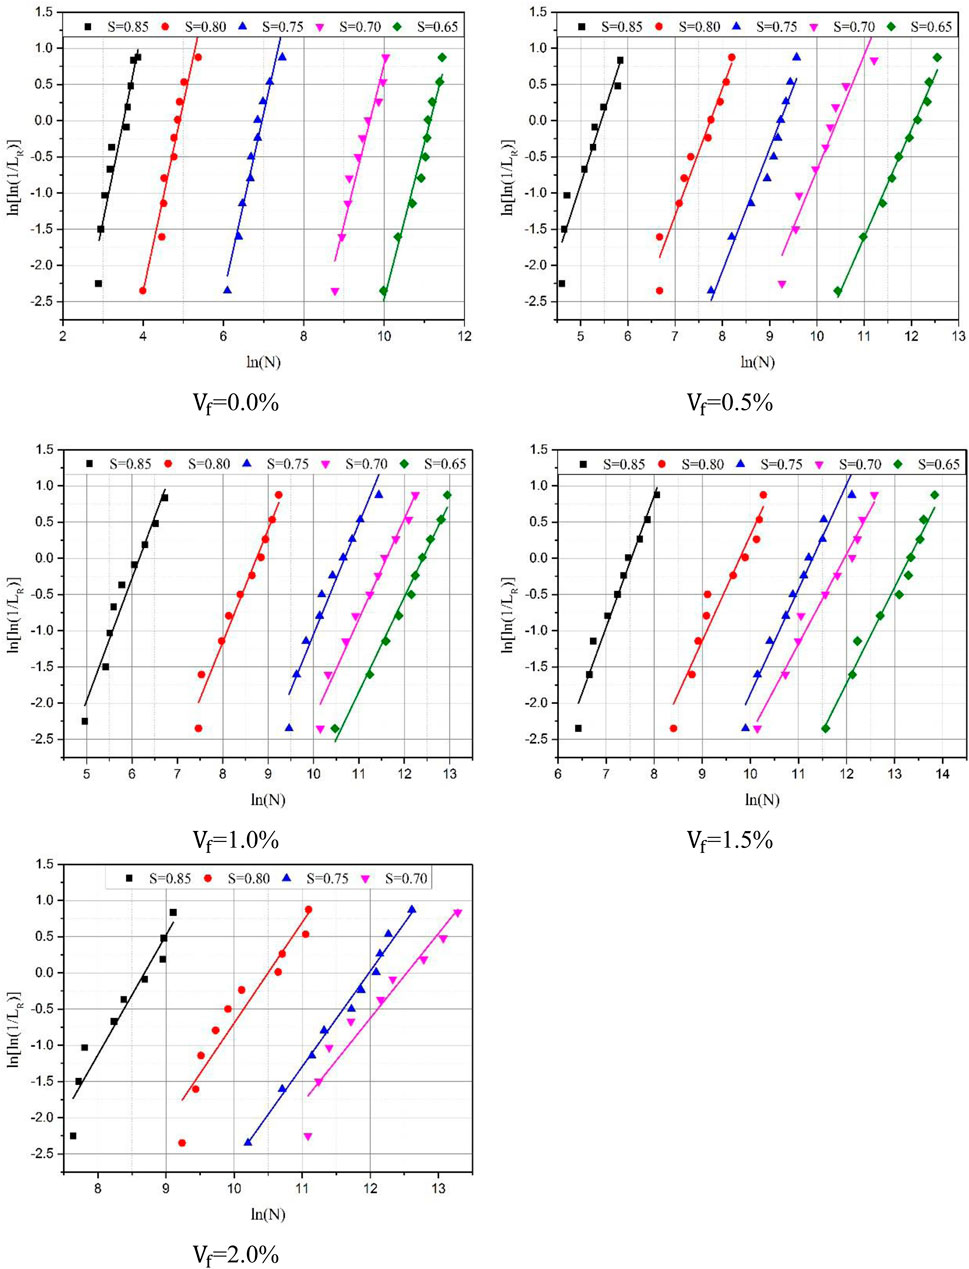
Figure 3. Graphical analysis of fatigue life data for UHPC.
3.3 Determination of the weibull distribution parameters
3.3.1 Graphical method
The graphical method not only determines whether the fatigue life of UHPC adheres to the Weibull distribution function but also enables the extraction of critical parameters such as the shape parameter α and the characteristic fatigue life u. Through linear regression analysis, the slope and intercept of the line correspond to α and u, respectively, as illustrated in Figure 3.
3.3.2 Method of moment
To evaluate the distribution parameters of the Weibull functions using the method of moments, it is required an appropriate sample moments (mean and variance of the samples), which can be calculated by the following Equations 7, 8 (Thai et al., 2021):
Sample moments:
E(n): average expected value; T(x): gamma function.
Sample variance:
μ = E(n): the average value of the fatigue tested data under an given stress level.
According to Equations 7, 8, the coefficient of variation (CV) of the fatigue life of the UHPC can be calculated as follows:
Equations 10, 11 can be used to evaluate the Weibull function distribution parameters (α and u), respectively.
3.3.3 Maximum likelihood equation
The maximum likelihood equation is expressed as follows (Li et al., 2021):

Table 6. Weibull distribution parameters of UHPC.
With the same fiber volume content, the shape parameter α exhibited a decreasing trend as the stress level increased. Specifically, under higher stress levels, the shape parameter α decreased significantly, indicating a narrower scatter range in the fatigue life data. Conversely, at lower stress levels, the decrease in α was more gradual, suggesting a wider variation in fatigue life. This contrasting behavior underscores the complexity of fatigue life distribution in UHPC, particularly across different stress levels. Figure 4 presents the mean change of the shape parameter α in the Weibull function of UHPC with various steel fiber content. Notably, the average value of the shape parameter α for UHRC (
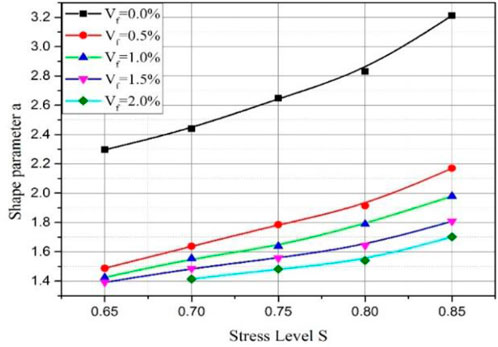
Figure 4. Effect of steel fiber contents and stress levels on the shape parameter of UHPC.
3.3.4 Distribution of fibers on fracture surface
It is evident that the distribution characteristics of fibers on the fracture surface of UHPC are closely related to fatigue life. To evaluate the fiber distribution, an image technique was used, as shown in Figure 5. The fiber number was quantified by the fiber dispersion coefficient, as shown in Equation 15 (Teng et al., 2020) and the distribution characteristics of fiber orientation and pullout length were evaluated by Equations 16, 17, respectively.
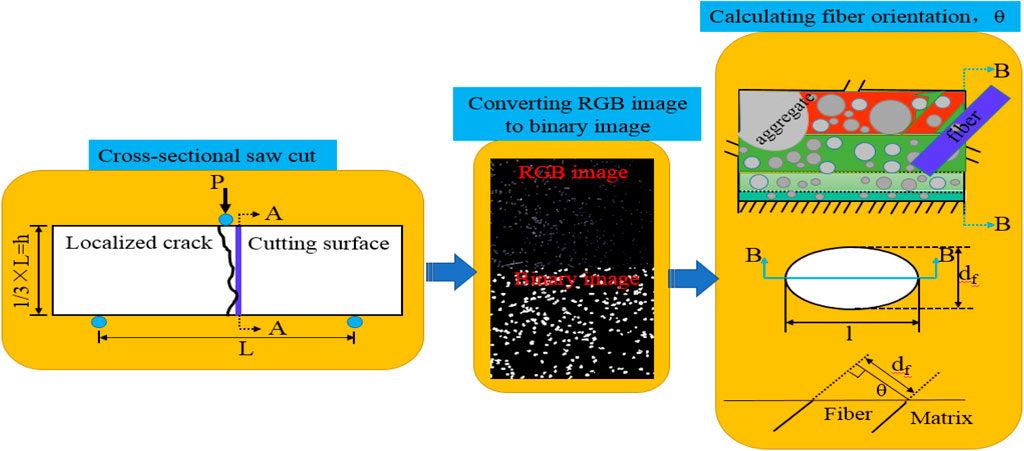
Figure 5. Program of an image technique.
Where α is the fiber dispersion coefficient, x0 is the average number of steel fibers in each unit, xi is the measured number per unit, and n is the total number of units.
Where
Where p(θ) is the probability distribution function, p and q are shape parameters with values greater than 1/2, and the values of θ range from 0 to π/2.
The fiber dispersion coefficients (α) of the UHPC contained 0.5%, 1.0%, 1.5% and 2.0% steel fiber, were 0.86, 0.83, 0.80 and 0.74, respectively. The fiber dispersion coefficient was close to 1, indicating that the fibers were well distributed in UHPC. With the increase of fiber contents, the dispersion coefficient gradually decreased, which means the uniformity of fiber distribution on the fracture surface decreased, thus leading to an increase in the discreteness of UHPC fatigue life.
The probability density distribution of fiber orientation for UHPC is represented in Figure 6. The fiber orientation was more concentrated at 20°–60°. This, in turn, affected the fatigue life of the UHPC. A comparison with the results of Xia et al. (Sahoo et al., 2021) showed that their proposed two-parameter exponential could accurately predict the probability density distribution of fiber orientation. The probability distribution function of the pull-out lengths of UHPC was expressed in Figure 7. After UHPC cracking, fibers across the cracks provided a bridging action, improving the fatigue life of UHPC, especially the stable crack propagation stages, which accounts for about 75% of the entire fatigue life.
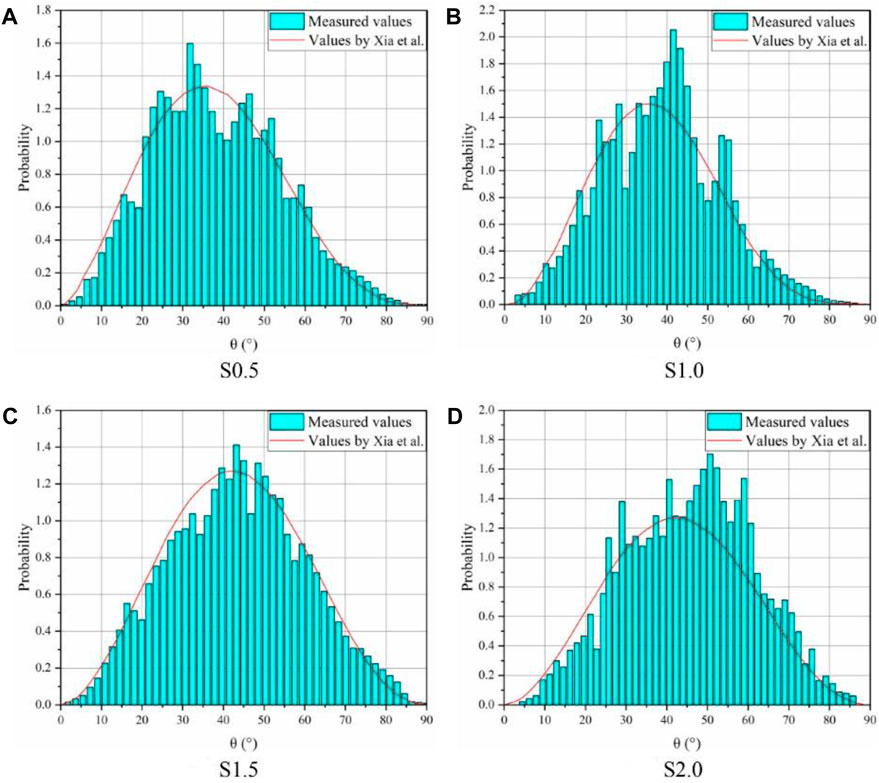
Figure 6. Probability density distribution of orientation for UHPC with different fiber contents.
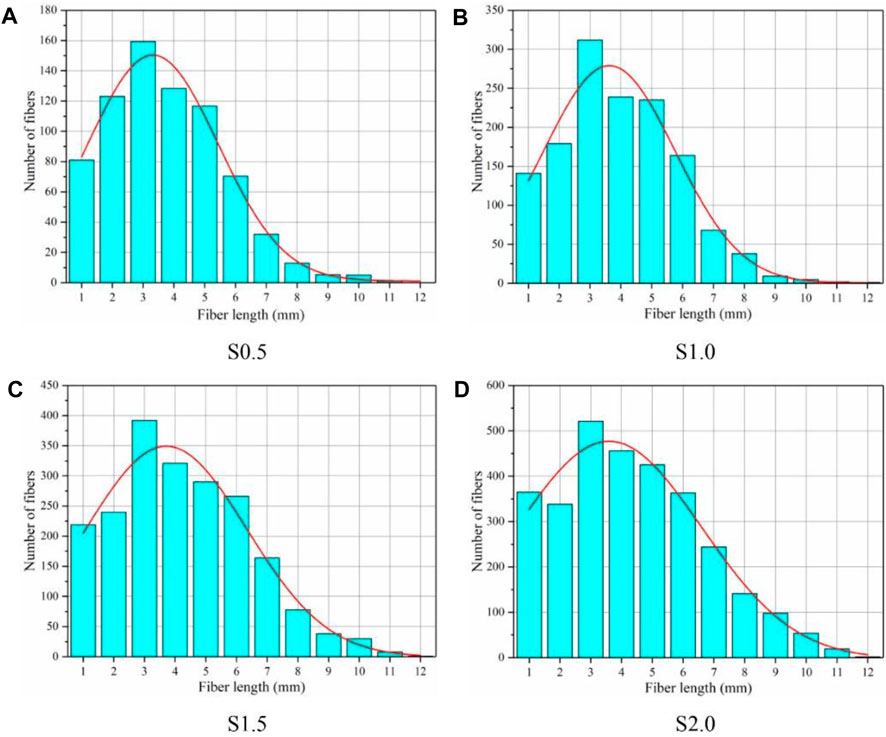
Figure 7. Probability density distribution of fiber lengths for UHPC with different fiber contents.
3.3.5 Test of goodness of fit
The shape parameter α and characteristic fatigue life u in the Weibull distribution function were quantitatively assessed using the image method, moment method, and maximum likelihood estimation method. To enhance the credibility of the α and u values obtained through these methods and to verify the efficacy of the Weibull probability distribution function in analyzing the fatigue life distribution of UHPC, the Kolmogorov-Smirnov (K-S) test was employed to conduct a goodness-of-fit analysis on the fatigue life data as shown in Equation 18. This approach, as outlined in (Singh et al., 2005c), allowed for a rigorous evaluation of how well the Weibull distribution matched the actual fatigue life data, providing further validation for its application in modeling the fatigue behavior of UHPC.
Table 7 presents the results obtained by the K-S method for the case of S = 0.80 for the UHPC incorporated with the steel fiber volume
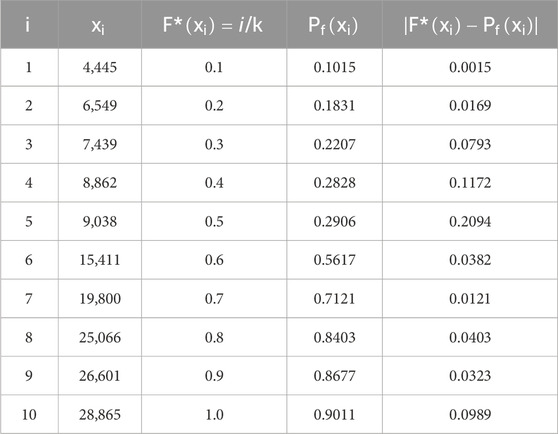
Table 7. K-S test for fatigue life.
When the stress level is S = 0.80, the maximum difference in the Kolmogorov-Smirnov (K-S) test table for the fatigue life of UHPC with a steel fiber content of
3.4 S-N relationship for UHPC
Due to the discrete fatigue life of concrete, different mathematical models based the fatigue testing data was developed the fatigue life. Kaushik (EFNARC, 2005) and Singh et al. (2005b) applied the Wholer equation, Equation 19, to build up the mathematical dependence of the stress level S and fatigue life N.
Tepfers (Baek-Sik, 1979) introduced the concept of stress ratio R, which was based on Wohler’s equation. This stress ratio allowed for a redefined relationship between the stress level S and fatigue life N, as follows:
β: material coefficient.
Vesic (1969) proposed using a power function to clarify the relationship between the S and N, as shown in Equation 21:
By conducting a linear regression analysis on the S-N curves, the coefficients A and B in Equation 16 can be determined, as illustrated in Figure 8. Utilizing the fatigue testing data, a quantitative evaluation of the relationship between S, N, and R is performed, enabling the determination of the value of β. Subsequently, Equation 20 can be employed to predict the fatigue life of UHPC. Similarly, C1 and C2 can be calculated through linear regression analysis, as demonstrated in Figure 8.
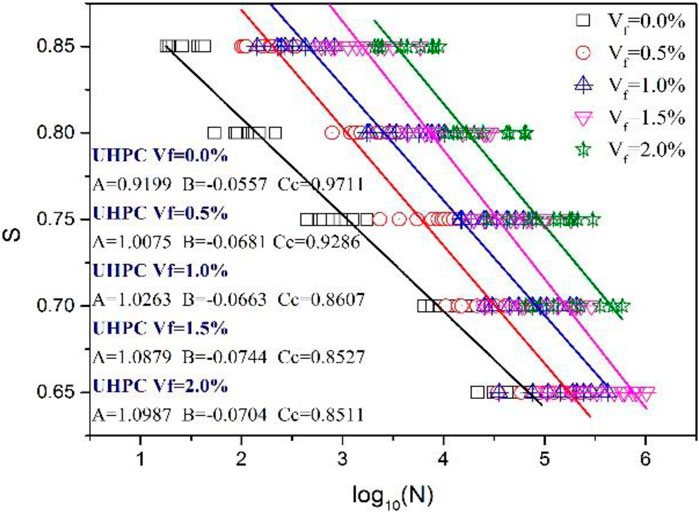
Figure 8. Calculations of coefficient for UHPC.
3.5 Failure probability using S-N relationships for UHPC
The actual test results reveal that the fatigue life data of UHPC still demonstrated large dispersion when the fatigue test procedure is strictly controlled. Therefore, the S-N relationship becomes more convincing with the introducing the failure probability
First, the fatigue life test data of UHPC with different fiber content under a certain stress level sorted in descending order, as presented in Tables 4. Then, the reliability function
The family of S–N–
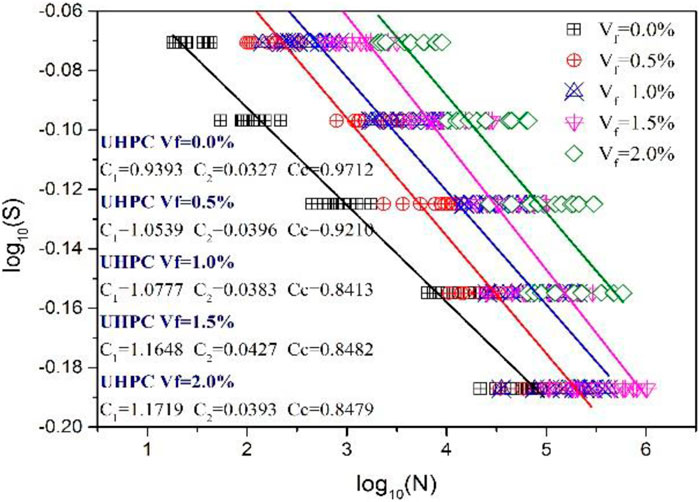
Figure 9. S-N-
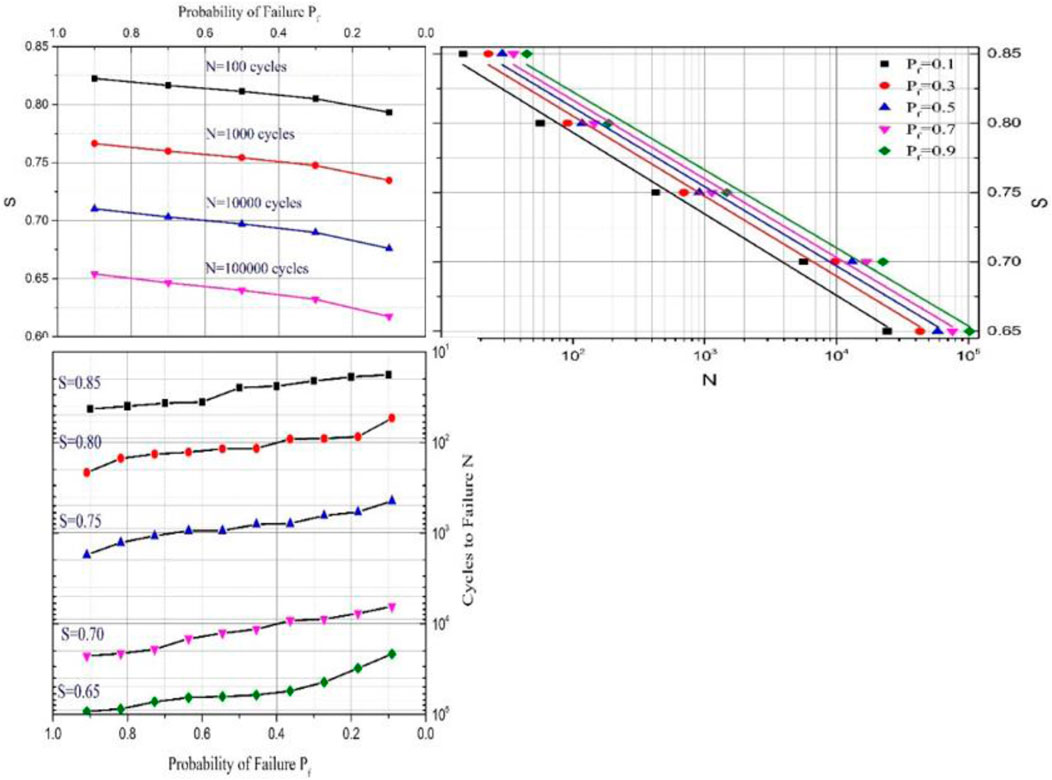
Figure 10. S-N-

Figure 11. S-N-
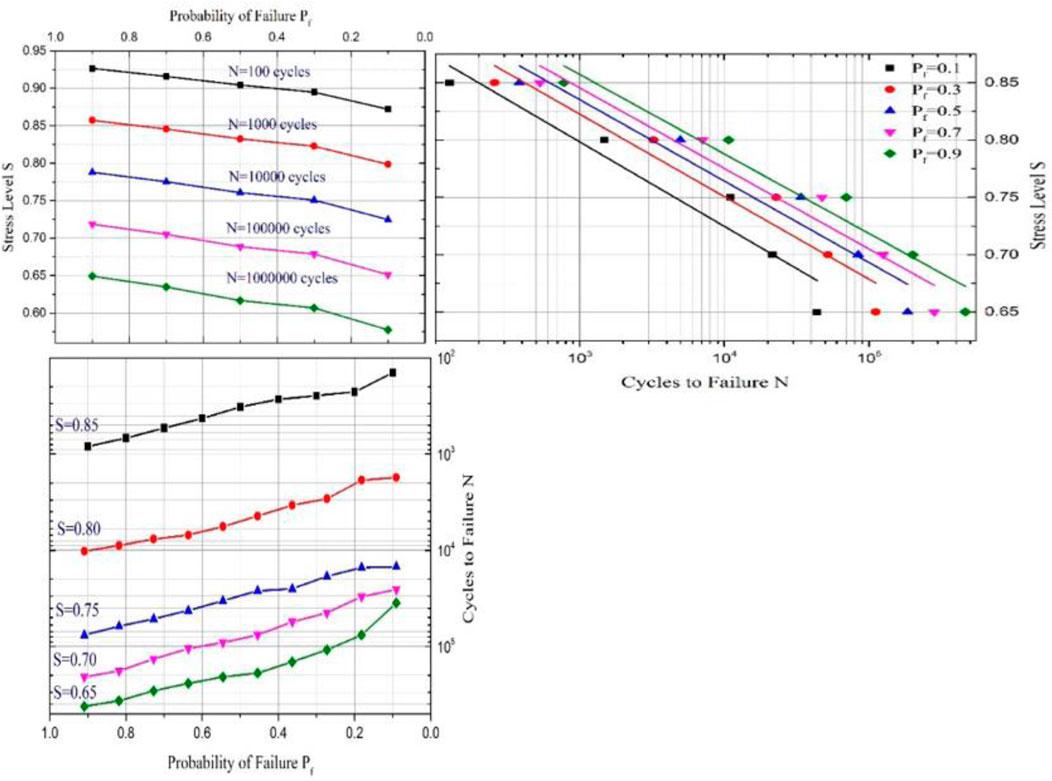
Figure 12. S-N-
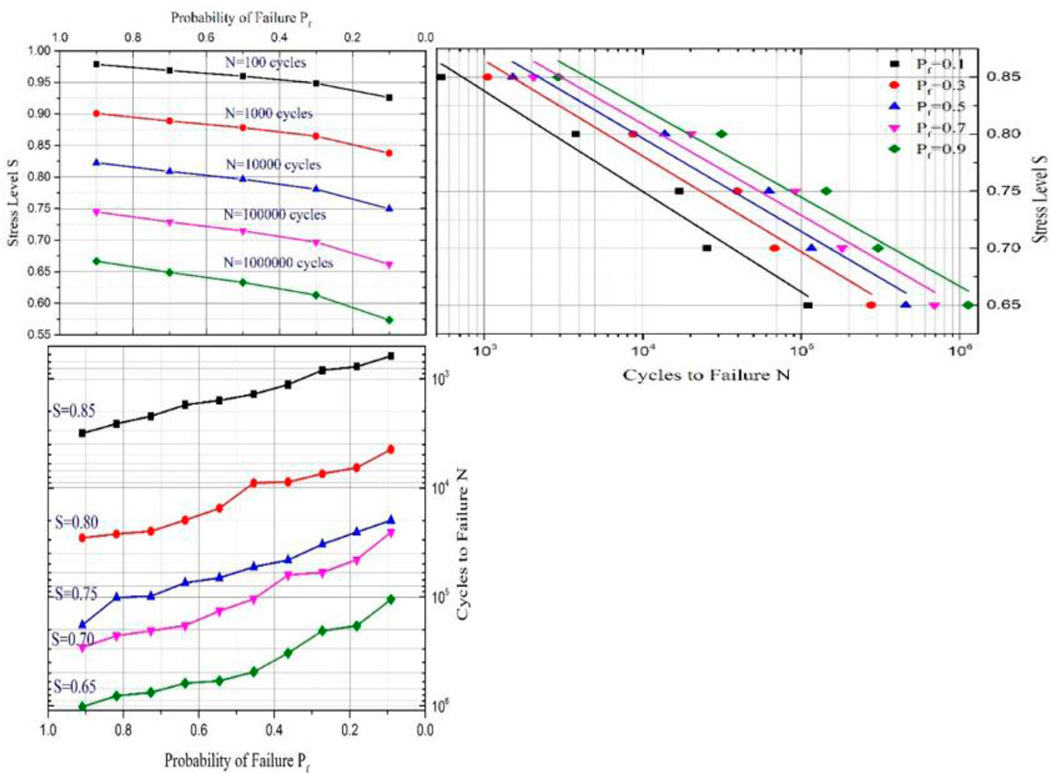
Figure 13. S-N-
Figures 9–13 Figures 14 present the family of S-N-
a, b and c: experimental coefficients.
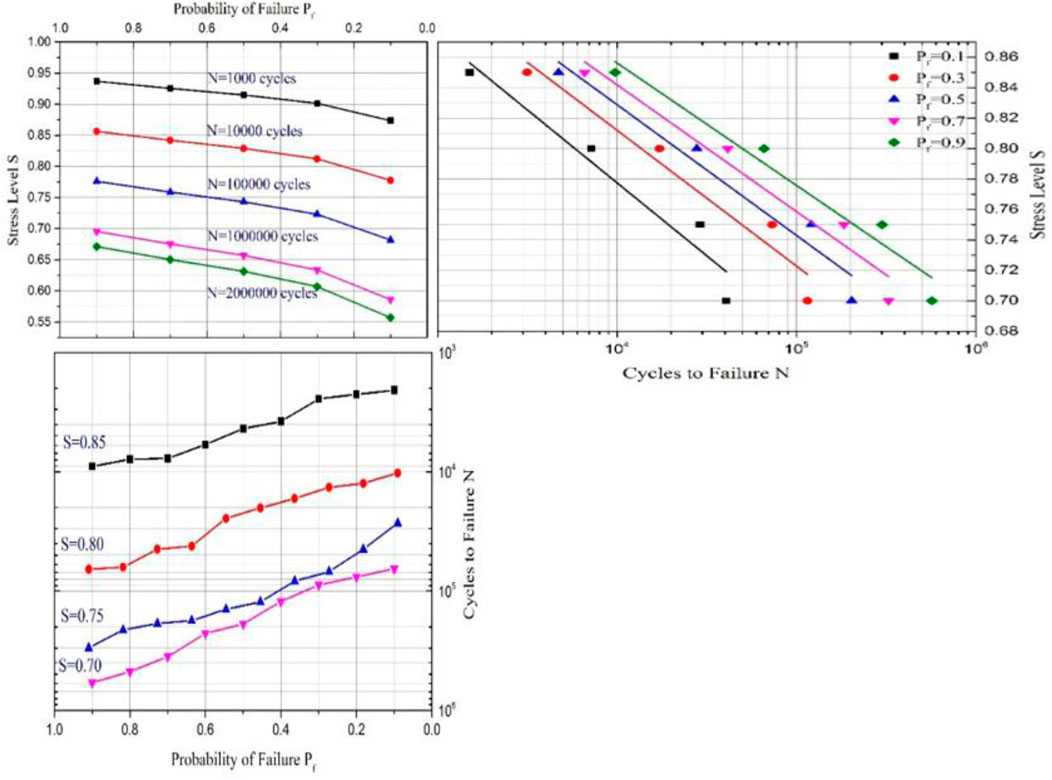
Figure 14. S-N-
The S-N-
UHPC (
UHPC (
UHPC (
UHPC (
UHPC (
Based on the experimental coefficients obtained in this study, the predicted curves are presented alongside the fatigue test curves in Figures 9–13. A slight discrepancy exists between the predicted and experimental curves, indicating that Equation 25 is appropriately used for evaluating the fatigue life of UHPC under various stress levels with a specified survival or failure probability.
4 Conclusion
This study evaluated the fatigue life (N) of UHPC reinforced with different volume fractions (
(1) The fatigue life is essentially linearly distributed, and the minimum correlation coefficient is 90.74%, that is, the fatigue life of UHPC conforms to the Weibull parameter distribution.
(2) The discretization of the fatigue life of UHPC increased with the increase of fiber content.
(3) The quantitative relation between S and N were also describe quantitatively and the fatigue life of UHPC under different stress levels can be predicated.
(4) The mathematical models aimed to predicated the fatigue life of the UHPC with different fiber content at a given failure probability were established.
Data availability statement
The datasets presented in this study can be found in online repositories. The names of the repository/repositories and accession number(s) can be found in the article/supplementary material.
Author contributions
CL: Writing–original draft, Writing–review and editing. PY: Data curation, Methodology, Writing–review and editing. YN: Writing–original draft, Writing–review and editing. YZ: Project administration, Validation, Writing–review and editing. CC: Writing–review and editing, Project administration, funding acquisition
Funding
The author(s) declare that financial support was received for the research, authorship, and/or publication of this article. The financial assistance received from National Youth Natural Science Foundation of China (Project No. 52108200), GuangDong Basic and Applied Basic Research Foundation (2023A1515011444).
Conflict of interest
Authors CL and PY were employed by Guangzhou Guangjian Construction Engineering Testing Center Co. Ltd.
The remaining authors declare that the research was conducted in the absence of any commercial or financial relationships that could be construed as a potential conflict of interest.
Publisher’s note
All claims expressed in this article are solely those of the authors and do not necessarily represent those of their affiliated organizations, or those of the publisher, the editors and the reviewers. Any product that may be evaluated in this article, or claim that may be made by its manufacturer, is not guaranteed or endorsed by the publisher.
References
Amran, M., Huang, S.-shan, Onaizi, A. M., Makul, N., Abdelgader, H. S., and Ozbakkaloglu, T. (2022). Recent trends in ultra-high performance concrete (UHPC): current status, challenges, and future prospects. Constr. Build. Mater. 352, 129029. doi:10.1016/j.conbuildmat.2022.129029
Baek-Sik, T. R. (1979). Fatigue strength of plain, ordinary, and light weight concrete. Am. Soc. Civ. Eng. 8 (42), 159–167.
EFNARC (2005). The European guidelines for self-compacting concrete, specification, production and use, 68.
Ganesh, P., and Murthy, R. (2022). Flexural fatigue strains of constituent materials in strengthened RC beams with UHPC strips. Int. J. Fatigue 21, 107351. doi:10.1016/j.ijfatigue.2022.107351
Gao, P., Ye, G., Huang, H., Qian, Z., Schlangen, E., Wei, J., et al. (2022). Incorporating elastic and creep deformations in modelling the three-dimensional autogenous shrinkage of cement paste. Cem. Concr. Res. 160, 106907. doi:10.1016/j.cemconres.2022.106907
Goel, S., and Singh, S. P. (2014). Fatigue performance of plain and steel fibre reinforced self compacting concrete using S–N relationship. Eng. Struct. 74, 65–73. doi:10.1016/j.engstruct.2014.05.010
Goel, S., Singh, S. P., and Singh, P. (2012). Flexural fatigue strength and failure probability of self compacting fibre reinforced concrete beams. Eng. Struct. 40, 131–140. doi:10.1016/j.engstruct.2012.02.035
Hacène, H., Ghofrane, B., and Gérard, D. (2014). Flexural fatigue performance of metal steel fibre reinforced mortar – influence of fibre aspect ratio and type. Constr. Build. Mater. 58, 166–170. doi:10.1016/j.conbuildmat.2014.02.016
Huang, J., Qiu, S., and Rodrigue, D. (2022). Parameters estimation and fatigue life prediction of sisal fibre reinforced foam concrete. J. Mater. Res. Technol. 20, 381–396. doi:10.1016/j.jmrt.2022.07.096
Jun, Z., Li, G., Wang, Z., and Zhao, X. L. (2019). Fatigue behavior of concrete beams reinforced with glass- and carbon-fiber reinforced polymer (GFRP/CFRP) bars after exposure to elevated temperatures. Compos. Struct. 229, 111427. doi:10.1016/j.compstruct.2019.111427
Li, L., Guan, J., Peng, Y., Yin, Y., and Li, Y. (2021). A Weibull distribution-based method for the analysis of concrete fracture. Eng. Fract. Mech. 256, 107964. doi:10.1016/j.engfracmech.2021.107964
Li, L., Xu, L., Huang, Le, Xu, F., Huang, Y., Cui, K., et al. (2022). Compressive fatigue behaviors of ultra-high performance concrete containing coarse aggregate. Cem. Concr. Compos. 128, 104425. doi:10.1016/j.cemconcomp.2022.104425
Makita, T., and Brühwiler, E. (2014). Tensile fatigue behaviour of ultra-high performance fibre reinforced concrete (UHPFRC). Mater. Struct. 47 (3), 475–491. doi:10.1617/s11527-013-0073-x
Niu, Y., Huang, H., Wei, J., Jiao, C., and Miao, Q. (2022b). Investigation of fatigue crack propagation behavior in steel fiber-reinforced ultra-high-performance concrete (UHPC) under cyclic flexural loading. Compos. Struct. 282, 115126. doi:10.1016/j.compstruct.2021.115126
Niu, Y., Wei, J., and Jiao, C. (2022a). Multi-scale fiber bridging constitutive law based on meso-mechanics of ultra-high performance concrete under cyclic loading. Constr. Build. Mater. 354, 129065. doi:10.1016/j.conbuildmat.2022.129065
Oh, B. H. (1986). Fatigue analysis of plain concrete in flexure. Struct. Eng. 112 (2), 273–288. doi:10.1061/(asce)0733-9445(1986)112:2(273)
Sahoo, S., Lakavath, C., and Prakash, S. S. (2021). Experimental and analytical studies on fracture behavior of fiber-reinforced structural lightweight aggregate concrete. J. Mater. Civ. Eng. 33 (5), 126281. doi:10.1061/(asce)mt.1943-5533.0003680
Sahu, M., Ghosh, A., Kumar, J., Singh, S., and Palit Sagar, S. (2022). Weibull parameter-based probability distribution for predicting creep life of power plant materials: a non-destructive approach. Mater. today 59, 1111–1118. doi:10.1016/j.matpr.2022.03.024
Savastano, S., Santos, S., Radonjic, M., and Soboyejo, W. (2009). Fracture and fatigue of natural fiber-reinforced cementitious composites. Cem. Concr. Compos. 31 (4), 232–243. doi:10.1016/j.cemconcomp.2009.02.006
Shao, Yi, and Claudia, P. (2022). Ostertag, Bond-slip behavior of steel reinforced UHPC under flexure: experiment and Prediction. Cem. Concr. Compos. (133), 104724. doi:10.1016/j.cemconcomp.2022.104724
Singh, S. P., and Kaushik, S. K. (2001). Flexural fatigue analysis of steel fiber-reinforced concrete. ACI Mater J. 98, 306–312.
Singh, S. P., and Kaushik, S. K. (2003). Fatigue strength of steel fibre reinforced concrete in flexure. Cem. & Concr. Compos. 25, 779–786. doi:10.1016/s0958-9465(02)00102-6
Singh, S. P., Mohammadi, Y., and Kaushik, S. K., Flexural fatigue analysis of steel fibrous concrete containing mixed fibers. ACI Mater J., 2005b,102:438–444.
Singh, S. P., Singh, B., and Kaushik, S. K. (2005a). Probability of fatigue failure of steel fibrous concrete. Mag. Concr. Res. 57, 65–72. doi:10.1680/macr.57.2.65.58701
Singh, S. P., Singh, B., and Kaushik, S. K. (2005c). Probability of fatigue failure of steel fibrous concrete. Mag. Concr. Res. 57, 65–72. doi:10.1680/macr.57.2.65.58701
Song, Q. L., Yu, R., Shui, Z. H., Wang, X. P., Rao, S. D., and Lin, Z. W. (2018). Optimization of fiber orientation and distribution for a sustainable Ultra-High-Performance Fiber Reinforced Concrete (UHPFRC): experiments and mechanism analysis. Constr. Build. Mater. 169, 8–19.
Teng, L., Meng, W., and Khayat, K. H. (2020). Rheology control of ultra-high-performance concrete made with different fiber contents. Cem. Concre. Res. 138, 106222. doi:10.1016/j.cemconres.2020.106222
Thai, D.-K., Nguyen, D.-L., Pham, T.-H., and Doan, Q. H. (2021). Prediction of residual strength of FRC columns under blast loading using the FEM method and regression approach. Constr. Build. Mater. 276, 122253. doi:10.1016/j.conbuildmat.2021.122253
Vesic, A. S. (1969). Analysis of structural behavior of road test rigid pavements. Highw. Res., 291–294.
Wu, Z., Zhao, G., and Huang, C. (1995). Concrete fatigue fracture characteristics. J. Civ. Eng. 28 (3), 59–65.
Yin, T., Yu, R., Liu, K., Wang, Z., Fan, D., Wang, S., et al. (2022). Precise mix-design of Ultra-High-Performance Concrete (UHPC) based on physicochemical packing method: from the perspective of cement hydration. Constr. Build. Mater. 352, 128944. doi:10.1016/j.conbuildmat.2022.128944
Zhang, B., Yu, J., Chen, W., Sun, H., Chen, S., and Wang, H. (2022). Interfacial properties between ultra-high performance concrete (UHPC) and steel: from static performance to fatigue behavior. Eng. Struct. 273, 115145. doi:10.1016/j.engstruct.2022.115145
Zhao, B., Geng, C., Song, Z., Pan, J., Chen, J., Xiao, P., et al. (2024). A fatigue fracture phase field model considering the effect of steel fibers in UHPC. Eng. Fract. Mech. 300, 109981. doi:10.1016/j.engfracmech.2024.109981
Keywords: fatigue life, UHPC, weibull distribution, probability failure, fatigue failure probability
Citation: Luo C, Yang P, Niu Y, Zhang Y and Cheng C (2024) Analytical method of incorporating failure probability to predict the fatigue life of ultra-high-performance concrete (UHPC). Front. Built Environ. 10:1403245. doi: 10.3389/fbuil.2024.1403245
Received: 19 March 2024; Accepted: 28 June 2024;
Published: 09 September 2024.
Edited by:
Yanping Zhu, University of Mount Union, United StatesReviewed by:
Peng Zhang, Zhengzhou University, ChinaMd. Mashfiqul Islam, Florida State University, United States
Copyright © 2024 Luo, Yang, Niu, Zhang and Cheng. This is an open-access article distributed under the terms of the Creative Commons Attribution License (CC BY). The use, distribution or reproduction in other forums is permitted, provided the original author(s) and the copyright owner(s) are credited and that the original publication in this journal is cited, in accordance with accepted academic practice. No use, distribution or reproduction is permitted which does not comply with these terms.
*Correspondence: Yanfei Niu, eWFuZmVpLm5AZ3podS5lZHUuY24=