 Guangming Li
 Ruming Feng
- Red Bay Laboratory, Shanwei, China
As offshore wind farms move into deeper waters, around 80 m, the high costs necessitate replacing bottom-fixed turbines with floating offshore wind turbines, which require mooring systems to maintain stability within design limits. Data from previous projects in China indicate that mooring systems can constitute about 20% of the total investment. Thus, reducing mooring system costs can significantly benefit the development of next-generation floating wind farms. This paper discusses the reliability analysis of mooring chains for floating wind turbines to optimize inspection plans and strategies, thereby saving on maintenance costs over their design lifetime. A case study on S-N curve based fatigue reliability analysis is conducted using both Monte Carlo Simulation and First Order Reliability Method (FORM), with consistent results from both methods. Additionally, three sensitivity analysis cases identify key parameters for the fatigue reliability analysis.
1 Introduction
Recently, offshore wind power has drawn more attention due to its intrinsic advantages. One of the primary advantages is the better quality of the wind resources in offshore locations, where the wind speed is usually greater and steadier (Hong et al., 2015; Dong and Yuan, 2023; Xiang et al., 2023). As offshore wind farms enter into deeper waters, especially for those deeper than 80 m, the traditional bottom-fixed offshore wind turbines such as mono-piles, tripods, or jackets will lose economic advantages. A new concept of floating offshore wind turbine (FOWT) becomes a more feasible and cost-saving solution. Generally, FOWTs can be categorized into four different types, i.e., the SPAR type, the semi-submersible type, the TLP type, and the barge type (Jonkman, 2009).
For FOWTs, the mooring system is one of the most important systems, accounting for approximately 20% of the total project investment. Therefore, the design and maintenance of the mooring systems for FOWTs play an important role in minimizing the total cost. The mooring system design requires a large number of design cycles with the satisfaction of the complex design constraints to achieve an economically competitive solution (Heyl and Duggal, 2009). An optimized mooring design shall keep both the translational and rotational motion of an FOWT within acceptable limits. To save design costs, a Harmony Search based mooring optimization program has been applied to study an optimum cost as a function of safety factor and required maximum offset of the offshore floating structure by finding anchor leg component size and declination angle (Ryu et al., 2007).
For FOWTs, there are usually four categories of mooring systems. First, a catenary mooring system is, by far, the most widely used due to its simple design and installation. The restoring force of the FOWT is mainly provided by the self-weight of the catenary chain. The main drawback of this mooring type lies in its large footprint. Second, a semi-taut mooring system, see Figure 1, can reduce the total length of the mooring lines and footprint, the restoring force of which depends on the stretching of the line material. Nevertheless, this type has an inclination angle with the seabed, which can exert an uplift force on the anchor foundation. The Single Point Mooring (SPM) system, as a third category see Figure 2, is suitable for ship-shaped floaters, of which the mooring line top ends are fastened to a tower or turret with bearings to allow the floater weather-vane freely to minimize the environmental loads. The fourth type of mooring system is tension-legs, which is suitable for the TLP-type FOWT. Compared to the SPAR- or SEMI-type FOWT, the TLP-type FOWT tends to be lighter, smaller, and more stable, especially in harsh environments. However, the investment cost of the tension-leg mooring system is much higher than the former ones.
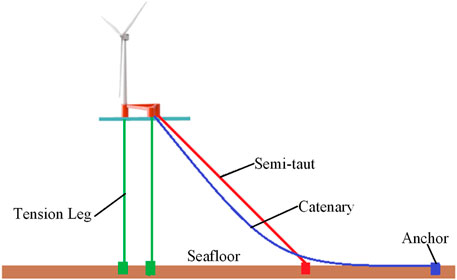
Figure 1. Schematic of typical mooring categories for a FOWT.
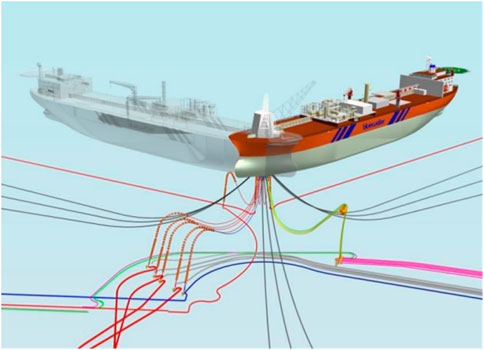
Figure 2. Single point mooring system.
Permanent mooring systems shall be designed to remain offshore for decades and unable to be sheltered no matter how catastrophic the storms encountered are during operation. Hence, these mooring systems are designed with adequate capacity to withstand all design extreme conditions, which consist of the ULS, ALS, and FLS according to DNVGL-OS-E301 (DNVGL-OS-E301, 2015). Although great attention has been paid to permanent mooring design, it has been reported that there are failure accidents of offshore moorings from time to time, with an approximate failure probability on an order of 1.0 × 10⁻³. Previous industry experience shows the primary reason for mooring line failure is the deterioration of the line components over time, i.e., corrosion-induced or fatigue-induced. As is known, the consequences of a mooring line failure may include risk to personnel, damage to dynamic cables, collisions with adjacent FOWTs and subsea infrastructures, repair or replacement costs, production loss, and even public reputation damage. Therefore, cost-effective and efficient inspection and monitoring programs, for the mooring system of FOWTs, shall be developed to detect any potential degradation or deterioration early enough to prevent a significant economic loss.
For the development of FOWTs in China, there are several demonstration application projects in the industry so far. Most of the projects have chosen a 3 × 3 whole catenary chain solution for the station-keeping system. As is known to all, offshore mooring chains have been widely used for many years, no matter for temporary or permanent mooring systems in the offshore industry. Two types of chain links, i.e., stud and studless as shown in Figure 3, are widely used for offshore mooring applications. Stud chain links are preferable for temporary mooring lines, while studless chains are more common for permanent moorings. The reasons for the wide application of chain links lie in their easier handling and installation, torsional free properties, and high resistance to wear and abrasion when in contact with other interfaces. The available steel grades for offshore moorings are R3, R3S, R4, R4S, R5, and R6 with increasing tensile strength. Therefore, this paper focuses mainly on the reliability and integrity management of mooring chains for FOWTs.
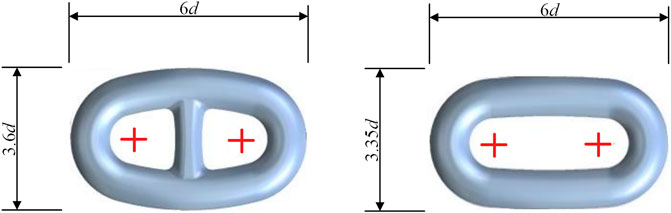
Figure 3. Stud chain link (left) and studless chain link (right).
The main damage and degradation mechanisms, for a chain-made mooring line, include corrosion, wear, and fatigue, which are always present and unavoidable, especially in offshore environments. Steel structures are often affected by corrosion during use (Tong et al., 2023; Zhu et al., 2023; Duan et al., 2024; Wu et al., 2024; Yu et al., 2024). The corrosion of chain links, see Figure 4, is defined as a material loss due to an electrochemical attack by ambient surroundings. The corrosion rate is highly dependent on the ambient water temperature, marine growth, flow velocity, oxygen content, microbiological beings attacks, etc. The wear of the chain is defined as a progressive loss of material on surfaces due to relative motion between adjoining links. The wear rate depends on the axial line load and the number of rotation cycles between consecutive links. Hence, the mooring chain is usually protected against corrosion and wear using appropriate coatings. Moreover, fatigue is a degradation process for mooring chains due to cyclic loads over a long period which can gradually reduce the strength of the material and eventually trigger a failure. Usually, there are three stages for a fatigue-induced failure, i.e., crack initiation, steady crack propagation, and rapid crack propagation (Chen et al., 2024).
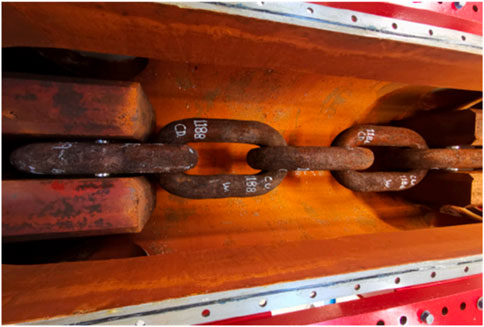
Figure 4. The general and pitting corrosion of mooring chains (Mendoza et al., 2022).
An integrity management program shall be developed to ensure that the mooring system can fulfill its function requirement during the design lifetime with controlled deterioration rates. According to API RP 2I, the need for a rigorous, effective inspection of mooring hardware is apparent because most of the mooring failures involved faulty mooring components including corroded or physically damaged wire-rope or chain, or mooring hardware of inferior quality. This recommended practice gives good detail on how to perform inspections for mooring line components (API RP 2I, 2008). Based on in-service inspection data, the reliability analysis is an effective method to assess the failure probability of each mooring component, which can be combined to calculate the risk of the whole mooring line or system. The risk can be of great help in developing the mooring component discard criteria or an optimized mooring inspection frequency and strategy to save maintenance costs. For the mooring system of FOWTs, an in-service inspection plan shall be developed after the installation based on an assumed deterioration rate throughout its service lifetime. Developing a comprehensive and well-optimized in-service inspection plan is quite challenging and there is always room for improvements. For a well-developed in-service inspection plan, not only the obvious degradations such as general corrosion, pitting corrosion, and excessive abrasion, but also the smaller-sized defects such as fatigue cracks, and wire strand breaks can be identified and located. Based on the periodical inspection results, some unexpected anomalies or degradation rates may be identified. Under this circumstance, a reliability assessment can be performed to determine whether the initial in-service inspection plan shall be updated or adjusted to address newly identified anomalies to achieve consistent integrity for the whole mooring system during its service lifetime.
Structural reliability analysis can directly quantify how uncertainties in input parameters can affect the structural response. A large amount of previous research has been done for the development of structural reliability analysis methods. Early work on the reliability theories mainly consists of (Cornell, 1968; Hasofer and Lind, 1974). The first-order second moment (FOSM) theories are an early simplified method for reliability analysis (Ang and Tang, 1984; Madsen et al., 1986; Ditlevsen and Madsen, 1996; Nowak and Collins, 2012). For FOSM, each random variable is depicted by only the mean and the variance for reliability calculation. Later on, a joint probability distribution of all uncertain random variables is introduced, and the probability of failure can be integrated directly concerning the limit state function on the failure domain. For this level of reliability analysis, the approximate simulation methods, such as first order reliability method (FORM) (Zhao and Ono, 1999; Melchers and Andre, 2018; Zhao et al., 2020) and second order reliability method (SORM) (Huang et al., 2018; Rackwitz, 2001), together with more advanced techniques such as Monte Carlo Simulation (MCS) (Cardoso et al., 2008; Zhang et al., 2010) and Importance Sampling Methods (ISM) (Zhang, 2012; Shayanfar et al., 2018) are widely used worldwide. Among these, the algorithm of MCS is straightforward and suitable for highly nonlinear limit state function problems. The accuracy of an MCS analysis is mainly dependent on the total number of sample points. If the failure probability is on an order of 1 × 10⁻³, then the total sample points shall be on an order of 1.0×10⁵ to obtain satisfactory accuracy. Later on, the response surface method (RSM) was developed for the structural reliability analysis when the limit state function has no closed form. In this method, a transfer function correlates the input parameters to the structural response which can be obtained approximately in terms of the response surface function. The work of (Bucher and Bourgund, 1990; Rajashekhar and Ellingwood, 1993) laid a foundation for RSM, further developed by (Zheng and Das, 2000; Yu et al., 2002).
For decades, reliability-based and risk-based approaches have been widely employed for developing and optimizing the inspection plans for offshore structures, to list just a few of them (Madsen et al., 1990; Moan et al., 2000; Faber, 2002; Goyet et al., 2002; Straub and Faber, 2006; Rezende et al., 2024). The Bayesian decision theory has been adopted to minimize the overall maintenance costs including costs of failures, repairs, and inspections. Based on structural reliability analysis, the risk-based inspection plan can also be developed for offshore structural components subject to fatigue damage, see work of (Fujita et al., 1990; Moan and Song, 2000; Li and Zou, 2024; Meng et al., 2024; Oyegbile and Muskulus, 2024).
Recent research on the analysis of offshore mooring chains is relatively limited. Bergara et al. (Bergara et al., 2022) have adopted analytical, numerical, and experimental methods to assess fatigue crack propagation in offshore mooring chains under service conditions. Peunte et al. (Peunte et al., 2024) evaluate various spectral fatigue assessment methods for estimating damage caused by stress loads for offshore mooring systems and dynamic cables. Zhao et al. (Zhao et al., 2023) analyzed the system reliability of the mooring system for a floating offshore wind turbine based on an environmental contour approach.
This paper focuses on the reliability analysis of the offshore mooring chains for FOWTs. The methodology on formulating the limit state functions for chain strength and fatigue failure modes is presented, followed by the numerical simulation algorithm of FORM to solve the reliability index and probability of failure. A detailed case study is performed on S-N curve based fatigue reliability analysis, coupled with a parametric study to identify the dominant parameters of the fatigue reliability analysis.
2 Methodology on chain reliability analysis
A typical offshore mooring system for a FOWT consists of mooring line segments, connectors, anchor foundation, chain jack, chain stop, fairlead, etc. Data from recognized international standards shows that the anchor foundations and connectors typically have much higher reliability on strength and fatigue than mooring line segments made of chain links. Hence, this study focuses on the mooring chain reliability analysis for FOWTs.
The reliability analysis of offshore mooring chains shall consider both the ultimate and fatigue limit states. As mentioned in the introduction section, the failure modes for offshore mooring chains mainly consist of general corrosion, wear, and fatigue. The results of mooring chain reliability analysis can be directly incorporated into a risk-based inspection plan, which is by far the most effective method for developing the in-service inspection plan for offshore structures. The advantage of employing a risk-based inspection method for developing the in-service inspection plan lies in that the new condition data collected by periodical inspections can be timely incorporated to update and optimize the in-service inspection plan for the future.
Typically, there are four major steps for reliability analysis of offshore mooring chains: 1) Select an appropriate target reliability level based on the consequence of failure; 2) Formulate the limit state function of each failure mode and identify the random variables in the function; 3) Specify the distribution types and the statistical parameters, such as the mean value and COV, for all the random variables involved; 4) Compute the reliability of the mooring chain for the considered failure mode.
The ultimate limit state function for the structural reliability of a mooring line can be defined by Eq. 1. The probability of failure of the mooring line can be computed by Eq. 2.
where R denotes the mooring line strength resistance, Sp denotes the mooring line pre-tension, and Se denotes the extreme mooring line tension under extreme storm conditions.
where R is the line resistance, t is the time period considered, usually in years, Xp denotes a model uncertainty factor considering the possible variation of the nominal pre-tension of the mooring line, Sp can be taken as the deterministic pre-tension of the mooring line by design, Xe denotes a model uncertainty parameter for the evaluation of the extreme mooring line tension, and Se(t) denotes the extreme mooring line tension at the considered time period of t (yrs).
For the fatigue reliability analysis of mooring chains of FOWTs, both the T-N curve based, S-N curved based, or fracture mechanics based fatigue reliability analyses can be chosen. Compared to the third fracture mechanics method, the former two are relatively well-developed and straightforward to implement. A drawback of the T-N curve based or S-N curve based method is that the fatigue reliability cannot be updated according to the new condition data collected during the in-service inspection. If this issue has to be considered, the fracture mechanics based reliability analysis must be chosen.
For the S-N curve based fatigue reliability analysis, the Miner-Palmgren model (Miner, 1945) is adopted to formulate the limit state function. Based on Miner’s rule, the fatigue damage D can be computed by Eq. 3. Let f (s) be the probability density function of the stress range in mooring chains under considered sea states. The total fatigue damage to chain links can be estimated by Eq. 4.
where ni is the number of stress cycles in ith sea-state, Ni is the number of cycles to cause the fatigue crack under a constant stress amplitude for ith sea-state, and Ns is the total number of sea-states considered.
where n is the total number of stress cycles for a considered time period, K is the intercept of the S-N curve, m is the slope of the SN curve, and E (sm) is the expected value of the random stress-range distribution to the power of m.
Therefore, the limit-state function for the S-N curve based fatigue reliability analysis can be formulated by Eq. 5. Similarly, the limit state function for the T-N curve based fatigue reliability can be formulated by Eq. 6. For a narrow-banded Gaussian process, the stress range peaks follow a Rayleigh distribution. The mean value of the tension range for a short-term sea state can be estimated by Eq. 7.
where ∆ is the fatigue resistance, usually taken as 1.
where R denotes the ratio of the tension range of the mooring line to nominal breaking strength.
where Rσ is the standard deviation of the combined low and wave frequency tension range, and Γ(∙) denotes the gamma function.
Therefore, for a short-term sea state, the T-N curve based fatigue limit stat function can be eventually written as Eq. 8. However, the wave-induced long-term stress range response of offshore structures follows a Weibull distribution. The expected value of the mth order of the stress range can be approximated by Eq. 9. Hence for a long-term sea state, the S-N curve based fatigue limit stat function can be written as Eq. 10.
where v is the number of stress cycles per year on average, T is the time period considered, Xw is a model uncertainty coefficient for wave loading estimation, A and B are the Weibull distribution parameters respectively, and m and K are the S-N curve related parameters respectively.
As for the fracture mechanics based fatigue reliability analysis, the crack growth can be formulated by using Paris Law (Paris and Erdogan, 1963) as follows:
where a is the crack depth in chain links, N is the number of stress cycles, C and m are crack growth parameters of the chain material, and ΔK is the stress intensity factor range, which can be calculated by Eq. 12.
where Y(a) is the geometry function of the crack. Combining Eq. 11, 12, and doing an integration from the initial crack depth a0 to the final crack depth ac, Eq. 13 can be obtained.
For a long-term sea state, the fracture mechanics based fatigue limit stat function can be eventually formulated as Eq. 14. After the formulation of the limit state functions for different failure modes of mooring chains, the FORM, SORM, or MCS numerical methods can be used to compute the probability of failure Pf and the reliability index β.
where a0 is the initial crack depth, ac is the final crack depth, v is the number of stress cycles per year on average, T is the time period considered, Xw and XY are the model uncertainty coefficients for wave loading estimation, and geometry function calculation respectively, A and B are the Weibull distribution parameters respectively.
As is known, the offshore mooring line is a series system that may fail if any of its chain links or components fail. If considering a mooring line consists of a total of N joints or components, and assuming the events of failure for different joints are mutually independent, then the probability of failure of the mooring line can be computed by Eq. 15. Finally, the reliability of index βs of the mooring line can be calculated by Eq. 16.
where Pfs and Pfi denote the system and single joint probability of failure respectively.
where Φ-1(∙) denotes the inverse of the standardized normal distribution function.
The algorithm of FORM for a reliability analysis can be summarized according to the reference (Melchers and Andre, 2018) as follows:
1) Initialize the checkpoint vector, such as
2) Use Rosenblatt or Nataf transformation to transform all basic random variables to standard Normal distributed random variables,
3) Transform the limit state function from X-space to standardized normal Y-space by
4) Use the relations of
5) A new iteration point can be updated by
6) Use an inverse transformation relationship
7) Update the iteration step by m = m + 1, repeat the iteration procedure from step2 to step6 until the reliability index
3 Case study analysis
Now a case study is performed concerning the S-N curve based fatigue reliability analysis, the limit state function of which is Eq. 10. Both the FORM and MCS methods are employed for the computation of the probability of failure and the reliability index. For the case study, a total of five random variables are identified in the limit state function, i.e., the fatigue resistance ∆, the intercept of the S-N curve K, the model uncertainty factor for wave loading estimation Xw, and two Weibull distribution related parameters A and B. The distribution of these random variables and their statistical parameters are assumed and summarized in Table 1 below.
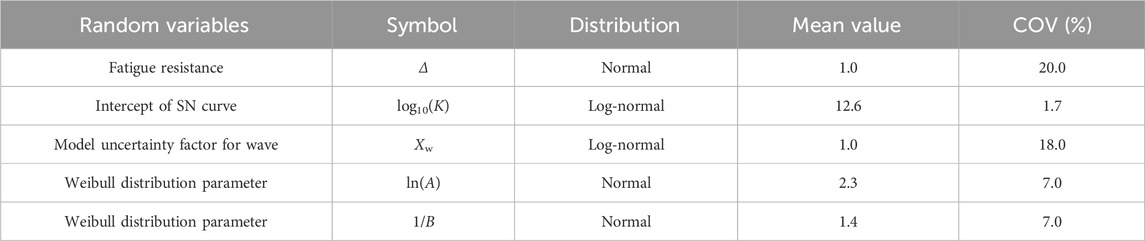
Table 1. The assumed distribution and statistical parameters of the random variables.
To perform the S-N curve based fatigue reliability analysis by using the FORM method, the basic random variables should all be transformed into a Normal distribution
By coupling a new transformation of Eq. 19, the equivalent limit station function in Eq. 18 can be further transformed into a standardized Normal distribution
In Eq. 21, the first derivative of the gamma function is quite complicated. To obtain an explicit expression of the first derivative of the gamma function, the following Laplace’s approximation formula (Wang, 2016) can be employed to approximate the gamma function by omitting the higher order terms.
Take the first derivative of Eq. 22 for x, Eq. 23 can be obtained. By substitution of the explicit expression of the derivative of the gamma function into Eq. 21, the first derivative of the limit state function for the X5 can be written as Eq. 24.
By using a mapping relationship as shown in Eq. 19, the first derivative
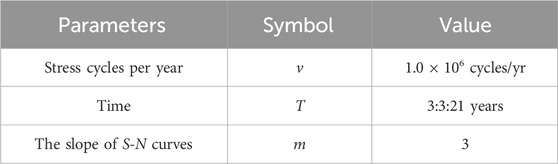
Table 2. The assumed constant parameters for the base case analysis.
After performing the analysis by using the MCS and FORM simulation method, the following results can be obtained, as shown in Table 3. From the results shown in Table 3, it can be seen that the reliability index, for the S-N based reliability analysis subject to a long-term sea-state, matches very well between the MCS analysis and FORM analysis. The largest relative difference between the two methods is only 1.46%. What is worth mentioning is that the CPU run time, during the simulation, for MCS analysis is much longer than that of the FORM analysis.
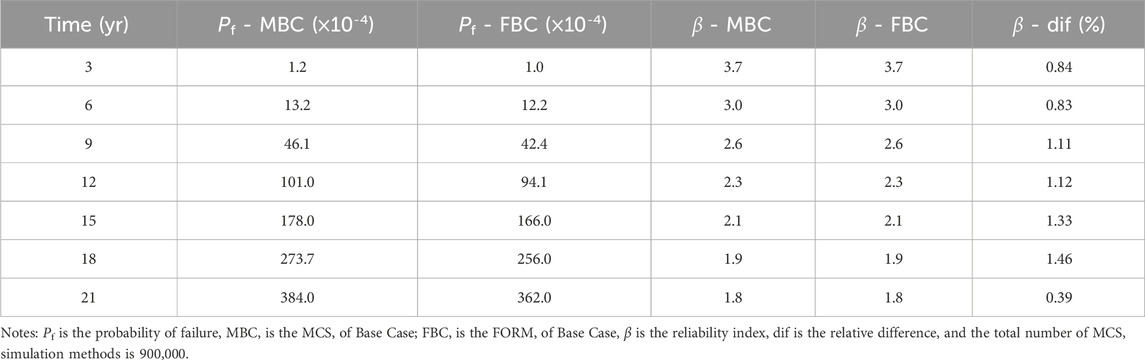
Table 3. Results summary for the base case of S-N curve reliability analysis.
4 Sensitivity analysis
A total of three sensitivity analysis cases are performed to identify the dominant parameters for the S-N curve based fatigue analysis. The first sensitivity analysis is on the S-N curve based fatigue analysis by changing the average number of stress cycles per year while keeping the remaining parameters the same as the base case. Taking ν = 1.0 × 10⁶ cyc/yr as the base case (marked as Case2), the average number of stress cycles chosen for sensitivity analysis is ν = 0.5 × 10⁶ cyc/yr (marked as Case1) and ν = 2 × 10⁶ cyc/yr (marked as Case3) respectively. The results of this sensitivity analysis are summarized in Table 4.
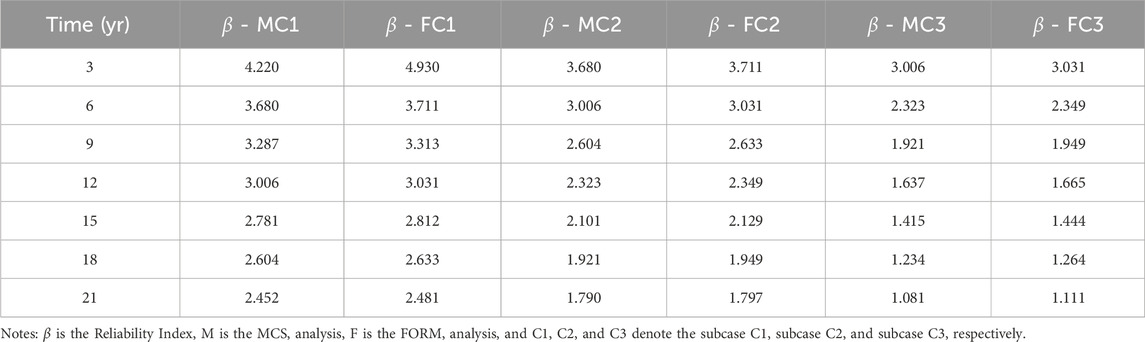
Table 4. Results summary of the first sensitivity analysis.
Based on the data summarized in Table 4 and Figure 5 can be plotted to show the variation trends of the fatigue reliability index for both time and the sensitivity parameter. The second sensitivity analysis is on the S-N curve based fatigue analysis by changing the COV (Coefficient of Variation) of fatigue resistance while keeping the remaining parameters the same with the base case. Taking COV(Δ) = 20% as the base case (marked as Case6), the other two COVs of fatigue resistance chosen for sensitivity analysis are COV(Δ) = 1% (marked as Case4) and COV(Δ) = 10% (marked as Case5) respectively. The results of the second sensitivity analysis are summarized in Table 5.
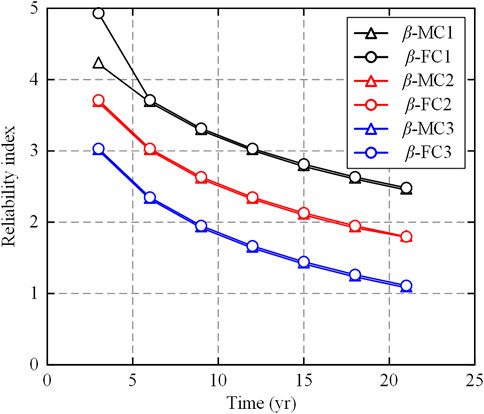
Figure 5. Plotting of results for the first sensitivity analysis.

Table 5. Results summary of the second sensitivity analysis.
Based on the data shown in Table 5, the following Figure 6 can be plotted to show the variation trend of the fatigue reliability index concerning both time and the sensitivity parameter. The third sensitivity analysis is on the S-N curve based fatigue analysis by changing the COV of the Weibull distribution parameters A and B while keeping the remaining parameters the same with the base case. Taking COV(A) = COV(B) = 7% as the base case (marked as Case7), the other COV values of the Weibull distribution parameters chosen for sensitivity analysis are COV(A) = COV(B) = 10% (marked as Case8) and COV(A) = COV(B) = 13% (marked as Case9) respectively. The results of the third sensitivity analysis are summarized in Table 6.
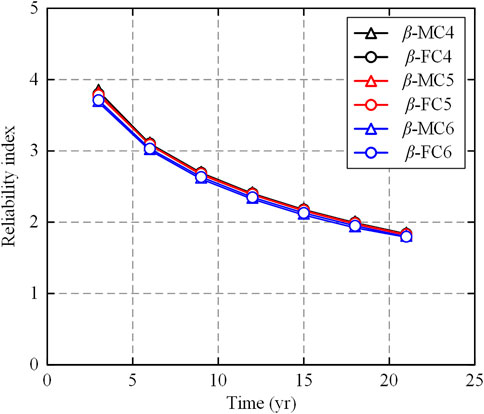
Figure 6. Plotting of results for the second sensitivity analysis.
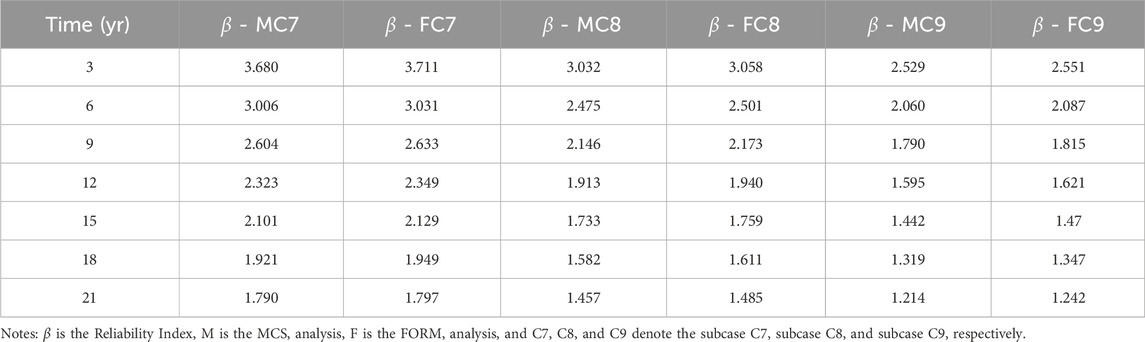
Table 6. Results summary of the third sensitivity analysis.
Based on the data shown in Table 6, the following Figure 7 can be plotted to show the variation trend of the fatigue reliability index for both time and sensitivity parameters. From the sensitivity analysis results shown in Figure 5 to Figure 7, it can be seen that the fatigue reliability indices simulated by MCS and FORM agree with each other well except for one point in Figure 5. The reason for this mismatch point is not very clear since the FORM code for all remaining subcases works well. Possibly, for this specific subcase when compared to MCS analysis, the FORM may introduce a relatively large error when the failure probability becomes small enough. In Figure 6, the resulting plots from subcase 4 to subcase 6 almost overlap each other, which means the S-N curve based fatigue reliability index is not sensitive to the variation of the COV of the fatigue resistance. However, the resulting plots shown in Figure 5 and Figure 7 demonstrate that the S-N curve based fatigue reliability index is quite sensitive to the variation of the average number of stress range cycles per year and the COVs of the parameters in long-term Weibull distribution. Hence, more attention should be paid to these sensitive parameters for mooring chain fatigue reliability analyses in the future.
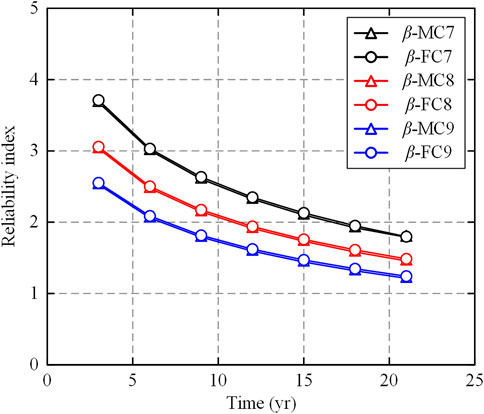
Figure 7. Plotting of results for the third sensitivity analysis.
5 Conclusion
This paper addresses the reliability analyses for offshore mooring chains for FOWTs, the procedure on how to perform the reliability analysis using both the MCS and FORM is presented in great detail. The methodology on how to perform the strength and fatigue reliability of offshore mooring lines is introduced.
A case study is performed for the S-N curve based fatigue reliability analysis when the mooring chain link is subject to long-term sea states. Two popular numerical methods, i.e., the MCS and FORM, are employed to compute the probability of failure and reliability index. It can be seen that the fatigue reliability analysis results agree well between the two adopted methods with relative differences in fatigue reliability indices for subcases no larger than 1.46%. For the third year, the probability of failure for the S-N curve based fatigue reliability is relatively small, on an order of 1 × 10⁻⁴. However, with the increase of years, the fatigue failure probability increases rapidly. After about 13 years, the fatigue probability of failure will be on an order of 1 × 10⁻². Therefore, the fatigue probability of failure for offshore mooring lines has a tight bearing on sea-state conditions and the total exposure time. What is worth mentioning is that the MCS is more time-consuming from the computational efficiency perspective. However, the derivation of the first derivative by using the FORM method is tricky and time-consuming, especially when the expression of the limit state function is complicated and highly nonlinear.
The results from the three sensitivity analysis cases demonstrate that the fatigue reliability indices are quite sensitive to the average stress cycles per year and the COVs of the Weibull distribution parameters, but not to the variation of the COV of the fatigue resistance. For the first parametric study, when the annual stress cycles change from 0.5 × 10⁶ cyc/yr to 2 × 10⁶ cyc/yr, the fatigue reliability indices decrease rapidly. While for the third parametric study, only a 3% COV for the Weibull distribution parameters can incur an obvious drop in the fatigue reliability indices, which indicates the S-N curve based fatigue reliability analysis is significantly sensitive to the parameters of the Weibull distribution. Therefore, accurate predictions of the annual stress cycles and the Weibull distribution parameters will dramatically improve the prediction accuracy of the S-N curve based fatigue reliability index.
Data availability statement
The original contributions presented in the study are included in the article/Supplementary Material, further inquiries can be directed to the corresponding author.
Author contributions
GL: Conceptualization, Data curation, Investigation, Methodology, Writing–original draft, Writing–review and editing. TP: Investigation, Software, Writing–original draft. RF: Conceptualization, Data curation, Investigation, Writing–review and editing, LZ: Methodology, Visualization, Writing–review and editing.
Funding
The author(s) declare that no financial support was received for the research, authorship, and/or publication of this article.
Conflict of interest
The authors declare that the research was conducted in the absence of any commercial or financial relationships that could be construed as a potential conflict of interest.
Publisher’s note
All claims expressed in this article are solely those of the authors and do not necessarily represent those of their affiliated organizations, or those of the publisher, the editors and the reviewers. Any product that may be evaluated in this article, or claim that may be made by its manufacturer, is not guaranteed or endorsed by the publisher.
References
Ang, A., and Tang, W. (1984). Probability concept in engineering planning and design. New York: Wiley.
Bergara, A., Arredondo, A., Altuzarra, J., and Martinez-Esnaola, J. (2022). Fatigue crack propagation analysis in offshore mooring chains and the influence of manufacturing residual stresses. Ocean. Eng. 257, 111605. doi:10.1016/j.oceaneng.2022.111605
Bucher, C., and Bourgund, U. (1990). A fast and efficient response surface approach for structural reliability problems. Struct. Saf. 7 (1), 57–66. doi:10.1016/0167-4730(90)90012-e
Cardoso, J., de Almeida, J., Dias, J., and Coelho, P. (2008). Structural reliability analysis using Monte Carlo simulation and neural networks. Adv. Eng. Softw. 39 (6), 505–513. doi:10.1016/j.advengsoft.2007.03.015
Chen, Y., Tong, J., Li, Q., Xu, S., and Shen, L. (2024). Application of high-performance cementitious composites in steel–concrete composite bridge deck systems: a review. J. Intelligent Constr. 2 (2), 9180012. doi:10.26599/jic.2024.9180012
Ditlevsen, O., and Madsen, H. (1996). Structural reliability methods. Chichester: John Wiley & Sons.
Dong, Y., and Yuan, J. (2023). Projections of offshore wind energy and wave climate in Guangdong’s nearshore area using CMIP6 simulations. J. Intelligent Constr. 1 (1), 9180007. doi:10.26599/jic.2023.9180007
Duan, S., Fan, S., Shu, G., Jiang, L., Tong, J., and Wu, Y. (2024). Numerical study and design of S35657 stainless steel welded stub columns. J. Constr. Steel Res. 214, 108473. doi:10.1016/j.jcsr.2024.108473
Faber, M. (2002). Risk-based inspection: the framework. Struct. Eng. Int. 12 (3), 186–195. doi:10.2749/101686602777965388
Fujita, M., Schall, G., and Rackwitz, R. (1990). “Adaptive reliability-based inspection strategies for structures subject to fatigue,” in 5th international conference on structural safety and reliability, 1619–1626.
Goyet, J., Straub, D., and Faber, M. (2002). Risk-based inspection planning of offshore installations. Struct. Eng. Int. 12 (3), 200–208. doi:10.2749/101686602777965360
Hasofer, A., and Lind, N. (1974). Exact and invariant second-moment code format. J. Eng. Mech. Div. 100 (1), 111–121. doi:10.1061/jmcea3.0001848
Heyl, C., and Duggal, A. (2009). Mooring cost sensitivity study based on cost-optimum mooring design. J. Ocean Eng. Technol. 23 (1), 1–6.
Hong, S., Lee, I., Park, S., Lee, C., Chun, H., and Lim, H. (2015). An experimental study of the effect of mooring systems on the dynamics of a SPAR buoy-type floating offshore wind turbine. Int. J. Nav. Archit. Ocean Eng. 7 (3), 559–579. doi:10.1515/ijnaoe-2015-0040
Huang, X., Li, Y., Zhang, Y., and Zhang, X. (2018). A new direct second-order reliability analysis method. Appl. Math. Model. 55, 68–80. doi:10.1016/j.apm.2017.10.026
Jonkman, J. (2009). Dynamics of offshore floating wind turbines-model development and verification. Wind Energy 12 (5), 459–492. doi:10.1002/we.347
Li, L., and Zou, G. (2024). A novel computational approach for assessing system reliability and damage detection delay: application to fatigue deterioration in offshore structures. Ocean. Eng. 297, 117023. doi:10.1016/j.oceaneng.2024.117023
Madsen, H., Krenk, S., and Lind, N. (1986). Methods of structural safety. New Jersey: Prentice-Hall.
Madsen, H., Sørensen, J., and Olesen, R. (1990). “Optimal inspection planning for fatigue damage of offshore structures,” in 5th international conference on structural safety and reliability, 2099–2106.
Martinez-Puente, E., Zarketa-Astigarraga, A., Martinez-Agirre, M., Zabala, A., Esnaola, J., Muñiz-Calvente, M., et al. (2024). Benchmarking of spectral methods for fatigue assessment of mooring systems and dynamic cables in offshore renewable energy technologies. Ocean. Eng. 308, 118311. doi:10.1016/j.oceaneng.2024.118311
Mendoza, J., Haagensen, P. J., and Köhler, J. (2022). Analysis of fatigue test data of retrieved mooring chain links subject to pitting corrosion. Mar. Struct. 81, 103119. doi:10.1016/j.marstruc.2021.103119
Meng, D., Yang, S., Yang, H., De Jesus, A., Correia, J., and Zhu, S. (2024). Intelligent-inspired framework for fatigue reliability evaluation of offshore wind turbine support structures under hybrid uncertainty. Ocean. Eng. 307, 118213. doi:10.1016/j.oceaneng.2024.118213
Miner, M. (1945). Cumulative damage in fatigue. J. Appl. Mechanics-Transactions Asme. 12 (3), A159–A164. doi:10.1115/1.4009458
Moan, T., and Song, R. (2000). Implications of inspection updating on system fatigue reliability of offshore structures. J. Offshore Mech. Arct. Engineering-Transactions Asme 122 (3), 173–180. doi:10.1115/1.1286601
Moan, T., Vårdal, O., and Johannesen, J. (2000). “Probabilistic inspection planning of fixed offshore structures,” in 8th international conference on applications of statistics and probability, 191–200.
Oyegbile, A., and Muskulus, M. (2024). Enhancing fatigue reliability prediction of offshore wind turbine jacket joints through individual uncertainties for each degree of freedom of stress concentration factor. Mar. Struct. 96, 103634. doi:10.1016/j.marstruc.2024.103634
Paris, P., and Erdogan, F. (1963). A critical analysis of crack propagation laws. J. Basic Eng. Basic Eng. 85 (4), 528–533. doi:10.1115/1.3656900
Rackwitz, R. (2001). Reliability analysis - a review and some perspectives. Struct. Saf. 23 (4), 365–395. doi:10.1016/s0167-4730(02)00009-7
Rajashekhar, M., and Ellingwood, B. (1993). A new look at the response surface approach for reliability analysis. Struct. Saf. 12 (3), 205–220. doi:10.1016/0167-4730(93)90003-j
Rezende, F., Videiro, P., Sagrilo, L., and Oliveira, M. (2024). Reliability-based fatigue inspection planning for mooring chains of floating systems. Reliab. Eng. Syst. Saf. 242, 109775. doi:10.1016/j.ress.2023.109775
Ryu, S., Duggal, A., Heyl, C., and Geem, Z. (2007). “Mooring cost optimization via harmony search,” in 26th international conference on offshore mechanics and arctic engineering, 355–362.
Shayanfar, M. A., Barkhordari, M. A., Barkhori, M., and Barkhori, M. (2018). An adaptive directional importance sampling method for structural reliability analysis. Struct. Saf. 70, 14–20. doi:10.1016/j.strusafe.2017.07.006
Straub, D., and Faber, M. (2006). Computational aspects of risk-based inspection planning. Computer-Aided Civ. Infrastructure Eng. 21 (3), 179–192. doi:10.1111/j.1467-8667.2006.00426.x
Tong, J. Z., Wu, R. M., and Wang, L. Q. (2023). Experimental and numerical investigations on seismic behavior of stiffened corrugated steel plate shear walls. Earthq. Eng. Struct. Dyn. 52 (12), 3551–3574. doi:10.1002/eqe.3920
Wang, W. (2016). Unified approaches to the approximations of the gamma function. J. Number Theory. 163, 570–595. doi:10.1016/j.jnt.2015.12.016
Wu, R., Wang, L., Tong, J., Tong, G., and Gao, W. (2024). Elastic buckling formulas of multi-stiffened corrugated steel plate shear walls. Eng. Struct. 300, 117218. doi:10.1016/j.engstruct.2023.117218
Xiang, Y., Lin, P., An, R., Yuan, J., Fan, Q., and Chen, X. (2023). Full participation flat closed-loop safety management method for offshore wind power construction sites. J. Intelligent Constr. 1 (1), 9180006. doi:10.26599/jic.2023.9180006
Yu, C., Tong, G., Tong, J., Zhang, J., Li, X., and Xu, S. (2024). Experimental and numerical study on seismic performance of L-shaped multi-cellular CFST frames. J. Constr. Steel Res. 213, 108360. doi:10.1016/j.jcsr.2023.108360
Yu, L., Das, P., and Zheng, Y. (2002). Stepwise response surface method and its application in reliability analysis of ship hull structure. J. Offshore Mech. Arct. Engineering-Transactions Asme 124, 226–230. doi:10.1115/1.1493199
Zhang, H. (2012). Interval importance sampling method for finite element-based structural reliability assessment under parameter uncertainties. Struct. Saf. 38, 1–10. doi:10.1016/j.strusafe.2012.01.003
Zhang, H., Mullen, R., and Muhanna, R. (2010). Interval Monte Carlo methods for structural reliability. Struct. Saf. 32 (3), 183–190. doi:10.1016/j.strusafe.2010.01.001
Zhao, G., Zhao, Y., and Dong, S. (2023). System reliability analysis of mooring system for floating offshore wind turbine based on environmental contour approach. Ocean. Eng. 285, 115157. doi:10.1016/j.oceaneng.2023.115157
Zhao, W., Chen, Y., and Liu, J. (2020). An effective first order reliability method based on Barzilai-Borwein step. Appl. Math. Model. 77, 1545–1563. doi:10.1016/j.apm.2019.08.026
Zhao, Y., and Ono, T. (1999). A general procedure for first/second-order reliability method (FORM/SORM). Struct. Saf. 21 (2), 95–112. doi:10.1016/s0167-4730(99)00008-9
Zheng, Y., and Das, P. (2000). Improved response surface method and its application to stiffened plate reliability analysis. Eng. Struct. 22 (5), 544–551. doi:10.1016/s0141-0296(98)00136-9
Keywords: reliability analysis, Monte Carlo simulation, offshore mooring chain, first order, reliability method
Citation: Li G, Pan T, Feng R and Zhu L (2024) Reliability analysis of mooring chains for floating offshore wind turbines. Front. Built Environ. 10:1463682. doi: 10.3389/fbuil.2024.1463682
Received: 12 July 2024; Accepted: 17 July 2024;
Published: 01 August 2024.
Edited by:
Gen-Shu Tong, Zhejiang University, ChinaReviewed by:
Chao-Qun Yu, Zhejiang University, ChinaNan-ting Yu, Zhejiang University of Technology, China
Chao Hou, Southern University of Science and Technology, China
Copyright © 2024 Li, Pan, Feng and Zhu. This is an open-access article distributed under the terms of the Creative Commons Attribution License (CC BY). The use, distribution or reproduction in other forums is permitted, provided the original author(s) and the copyright owner(s) are credited and that the original publication in this journal is cited, in accordance with accepted academic practice. No use, distribution or reproduction is permitted which does not comply with these terms.
*Correspondence: Ruming Feng, ZmVuZ3JtQGhod2xhYi5jb20=