 Zhenwei Wang
 Huiqing Cao
 Wei Song
- School of Civil and Engineering, North China University of Technology, Beijing, China
Slope stability is an important factor affecting safe production in large surface coal mines. Most traditional slope fixation methods adopt grouting and anchor reinforcement. However, cementing rock and soil using conventional methods is challenging in areas with high water content. This study innovatively proposes the application of artificial ground freezing technology to reinforce the slopes of large-scale open-pit coal mines and verifies the technical feasibility of this technique. Five conditions are investigated via sandbox tests and the development characteristics of the freezing temperature field are analyzed. The results show that different water contents, lithologies, and the presence or absence of seepage affect freezing. Specifically, when the water content is 7.3%, the freezing radius is 220 mm; when the water content is increased to 27.4%, the freezing radius extends to 300 mm. Sand has the fastest freezing rate at 0.072°C/h, while lignite has the slowest freezing rate at 0.061°C/h. The temperature drop rates are 0.068°C and 0.058°C/h for the impermeable and seepage conditions, respectively. Moreover, the fitting function y = A1e-x/A2+A3 adequately describes the temperature profile decrease. The results of the study provide a basis for the precise design of freezing programs to further realize green and low-carbon, large-scale slope stabilization.
1 Introduction
Optimizing the energy mix of a region by strategically balancing and diversifying energy sources has become an important focus in addressing global climate change and achieving green and low-carbon development. While renewable energy has significant advantages in terms of energy savings and environmental protection, it is generally characterized by volatility and cyclicality, resulting in inadequate stability. Therefore, coal, as a relatively inexpensive and stable energy source, remains the main pillar of the energy mix, playing a key role in underwriting security (Zeng et al., 2023; Liu et al., 2024). Large-scale surface coal mining is a common method for mining coal resources (Yang et al., 2024) but is characterized by various challenges. As open-pit coal mining progresses, the risk of slope landslides increases owing to the accumulation of waste rock at the base of the slope (Jiang et al., 2022). Water infiltration, such as rainfall, can be considered one of the main triggering factors for slope failure (Feng et al., 2022), posing a considerable threat to worker lives.
Therefore, slope stability is an important factor affecting the safe production of large open-pit mines, and several slope-stabilization methods have been proposed. Installing rows of drilled holes to secure slopes has proven to be a reliable and effective method (He et al., 2015). Geosynthetics, geocells, and geogrids are also widely used in slope stabilization projects (Koerner, 2015; Jain et al., 2021; Alamshahi and Hataf, 2009; Bieliatynskyi et al., 2021). Micropiles and grouted structures have also been investigated (Sun et al., 2013; Aziz et al., 2017). Vegetation, as an environmentally friendly material (Cheng et al., 2024), can be used for slope stabilization, is easy to install on-site, and provides environmental protection. In soils with a high water content and loose structure, traditional reinforcement methods face significant challenges. Techniques such as drilled holes, micropiles, and grouting are often limited in their effectiveness, as high moisture can dilute reinforcement materials, resulting in insufficient structural strength, reduced stability, and potential failure (He et al., 2015; Sun et al., 2013; Aziz et al., 2017). Additionally, the high water content substantially reduces friction and adhesion between the soil and geosynthetics, geocells, and geogrids, further weakening the reinforcement effect (Koerner, 2015; Jain et al., 2021; Alamshahi and Hataf, 2009; Bieliatynskyi et al., 2021). Vegetation also has limitations due to its long growth cycle, and plant roots struggle to penetrate deeply in loose, high-moisture soils, restricting their stabilizing impact (Cheng et al., 2024; Bosco Niyomukiza et al., 2023). Therefore, more efficient and green solutions must be explored for the reinforcement of large, water-rich slopes to effectively address the challenges of slope stabilization in modern engineering practices.
In geotechnical practice, the artificial ground freezing (AGF) technique, as a ground improvement technique (Nikolaev et al., 2024), enables the freezing of geotechnical soils with a high water content. Artificially frozen rock and soil are collectively known as artificially frozen soil. In engineering construction, when facing technical difficulties, the physical and mechanical characteristics of permafrost, such as its high bearing capacity and low permeability (Zhang et al., 2023), are often utilized to establish favorable conditions, thus facilitating the construction process and ensuring personnel safety. British engineers in South Wales first used AGF to reinforce soil during building foundation construction in 1862 (Vitel et al., 2015). The first successful application of AGF was in 1883 in the shafts of a coal mine in Germany. Since then, AGF has been continuously applied and developed in many countries for underground works, such as coal mine shafts (Zhelnin et al., 2022; Semin et al., 2024), tunnels (Russo et al., 2015; Hu et al., 2018; Wang et al., 2022), subways (Liu et al., 2022), and foundation pits (Cui et al., 2023). AGF has also been utilized to study frost heave in roadbeds (Pei and Dong, 2023). However, AGF has not been widely used in slope stabilization projects in open-pit coal mines with high water content. Therefore, this study initiates an attempt in the field of artificial strata freezing technology applied to slope stabilization to solve the problem of stabilizing slopes in open-pit coal mines with high water content.
Sandbox testing, which involves creating small-scale models or prototypes to simulate real-world conditions and assess the performance of designs or systems before full-scale implementation, is traditionally used in the construction industry to identify potential issues, refine designs, and optimize processes, ultimately improving the reliability and efficiency of projects (Song et al., 2017). In this study, sandbox freezing tests are performed using an artificial ground-freezing method, with the development characteristics of the freezing temperature field of the geotechnical body analyzed. Novel ideas for slope stabilization are developed by investigating slope stabilization in large-scale open-pit coal mines. The results of this study provide a basis for the precise design of freezing programs and the safety and stability of freezing walls.
2 Experimental set-up
2.1 Experimental system
The sandbox laboratory bench is shown in Figure 1. The experimental system comprised three loops: cooling, freezing, and seepage. The cooling loop consists of an air-source heat pump and a titanium tube heat exchanger, which work together to cool the refrigeration fluid. The freezing loop consists mainly of a single U freezing tube, a high-level water tank, and a titanium tube heat exchanger. After exchanging heat with the refrigerant in the titanium tube heat exchanger, the refrigerant liquid enters the single U freezing tube and absorbs heat from the medium in the sandbox. The variable-frequency pump provides power to circulate the refrigeration fluid. During the seepage cycle, constant-temperature water is supplied from the seepage water tank to the sandbox. To ensure that the seepage water flows evenly in and out of the sandbox, two internal grooves are placed inside it. The insulation material is laid in both the sandbox and test piping section to prevent heat exchange from affecting the test results. The primary parameters of the sandbox test bench are listed in Table 1.
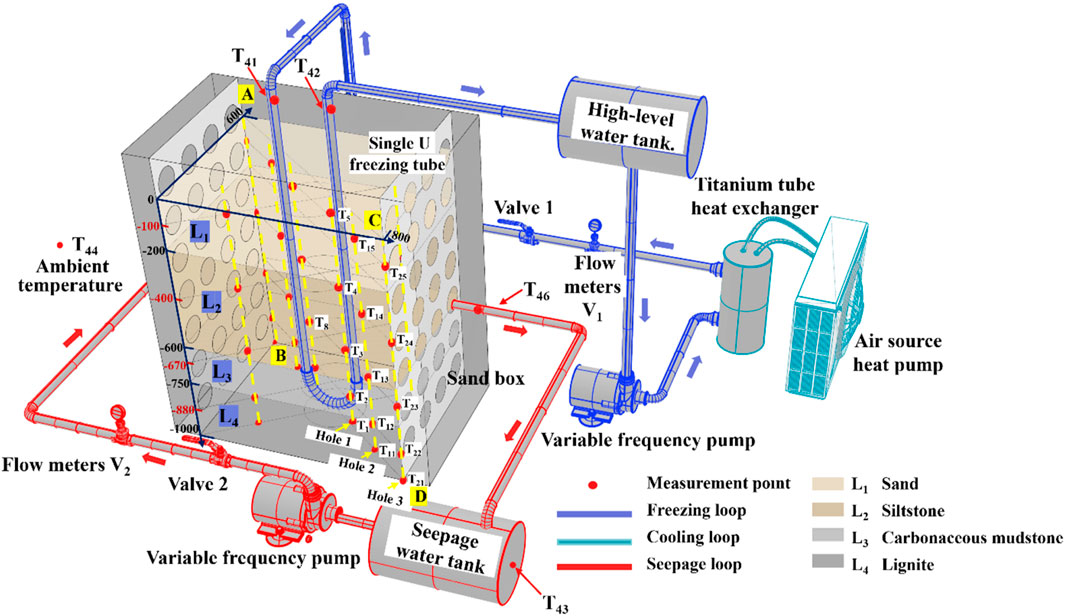
Figure 1. Sandbox test system.
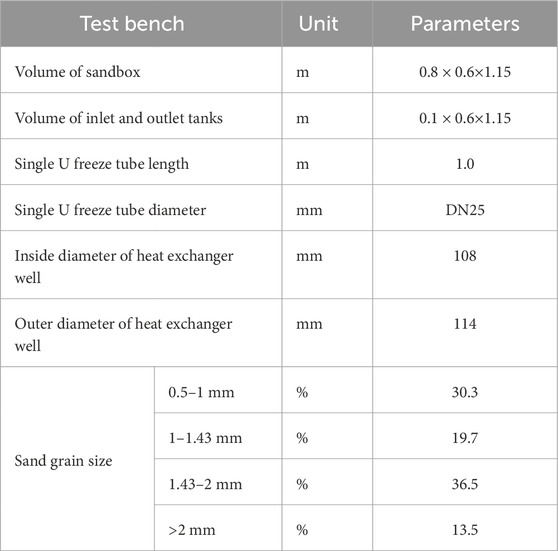
Table 1. Parameters of sandbox test bench.
Additionally, an experimental bench was set up using a data acquisition system. The system has 46 temperature and two flow measurement points. In the internal medium of the sandbox, T1-T40 temperature measurement points are arranged to monitor changes in the temperature field. Six temperature measurement points are arranged outside the sandbox. Thermocouples T41 and T42 measure the temperature of the refrigeration fluid inside and outside the freezing tube, respectively; T43 measures the temperature of the water in the seepage water tank; and T44 measures the ambient temperature. T45 and T46 are responsible for monitoring the seepage water temperature at the seepage inlet and outlet. Flowmeters V1 and V2 monitor the flow in the refrigerated circulation and seepage loops, respectively. Temperature measurement points and flow meters are used to collect data at 5 s intervals. Calibration of the thermocouples in the experimental chamber was performed before burial to ensure the accuracy of the monitoring data. The primary equipment parameters of the sandbox test bench are listed in Table 2.
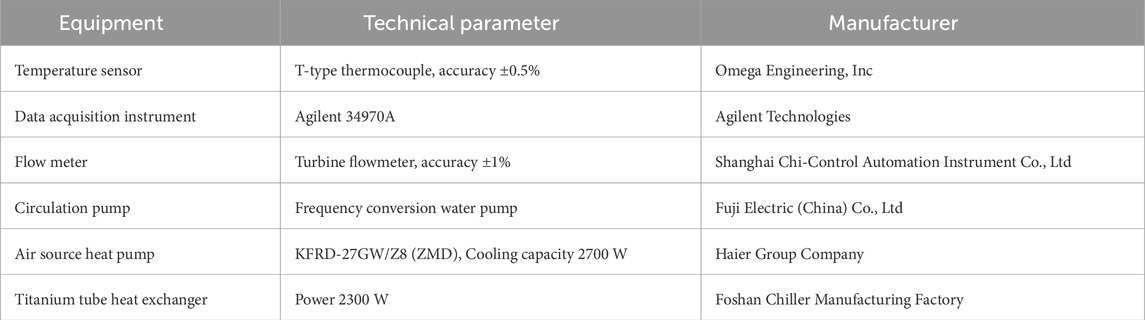
Table 2. Parameters of sandbox test equipment.
2.2 Experimental conditions and procedures
The sandbox test was divided into five test conditions, which were performed sequentially, with the water content, geotechnical filling of the sandbox, and seepage loops as variables. All experiments were conducted indoors, utilizing an air conditioning system to precisely regulate the ambient temperature. The experiment was considered to start when the temperature gradient inside the sandbox was less than 1°C to ensure that the initial temperature field was uniform for each condition.
The filling medium for Conditions I and II was sand, which was a mixture of four grain sizes. In Condition III, four types of geotechnical soil were filled in the sandbox in layers, replacing the sand. To accurately assess the feasibility of using artificial freezing technology to reinforce open-pit coal mine slopes in practical engineering applications, three types of rock samples were collected from the first section of the Tertiary Miocene Xiaolongtan Formation on the northern slope of the Pioneer Coal Mine in Kunming, Yunnan Province, China. The seepage loop was added to Condition IV, and the temperature of the water in the percolation tank was set to 15°C. The seepage flow rate was set to 2.5 m/d, and the initial hydraulic gradient was 0.0375. At the end of Condition IV, the refrigeration and cooling circulation loops were closed. Key experimental parameters, including the seepage flow rate, water temperature in the seepage loop, and moisture content of the rock and soil, were determined based on the actual groundwater flow rate, groundwater temperature, and moisture levels of the slope to ensure that the experimental conditions closely reflect real-world settings. Under Condition V, the seepage loop runs continuously, which simulates a freeze–thaw experiment in the presence of groundwater. The freezing duration was set to 360 h to ensure the stabilization of the temperature profile of the geotechnical soil. The detailed experimental conditions are listed in Table 3.
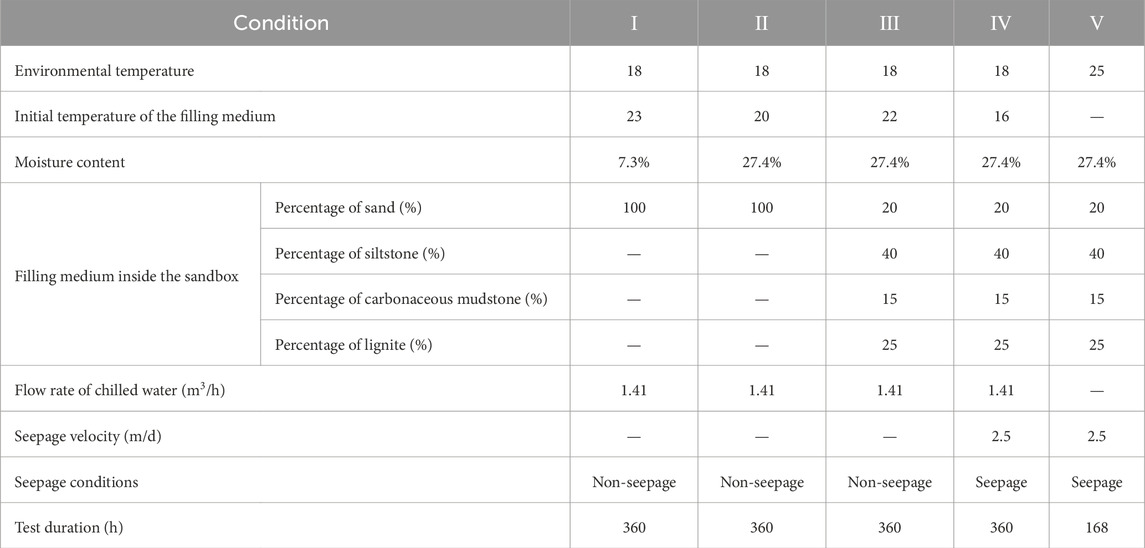
Table 3. Experimental conditions.
2.3 Uncertainty analysis
The accuracy of the experimental results is affected by factors such as instrument configuration, instrument calibration, and environmental conditions. Uncertainty is the quantitative characterization of the degree of doubt regarding a measurement result (Sharqawy et al., 2009). When uncertainty is within reasonable limits, the data are considered plausible. In this study, the measured parameters included temperature and flow rate; Class A measurement uncertainty was used. The thermocouples used in the test were calibrated in a constant-temperature water bath to ensure that the error was less than ±0.1°C. The uncertainty
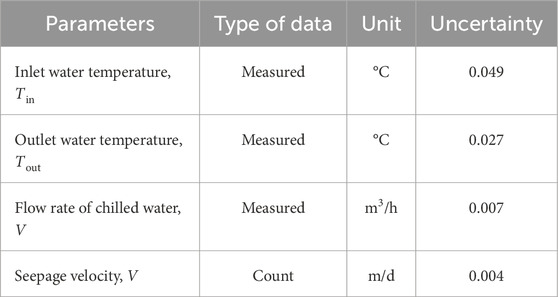
Table 4. Uncertainties in the measured parameters.
3 Experimental results and analysis
3.1 Characteristics of temperature change under freezing conditions
Considering the overall temperature trend of the rock and soil in the sandbox for each condition, the measured temperature of point 8, located in the center, was used to create the freezing process curve (Figure 2). The figure indicates that although the rate of temperature drop is different for each condition, the downward trend of the curves is approximately the same. The freezing of rock and soil can be approximately divided into four stages: rapid cooling, precipitation of the latent heat of the icing, freezing, and stable freezing. The moments of commencement and duration of the phases are different for various conditions. In the rapid cooling phase, the internal temperature of the geotechnical soil decreased significantly in response to the initial temperature gradient. Notably, unlike the other conditions, Condition III involved a change in geotechnical media, displaying a fluctuating decreasing trend during the rapid cooling phase. This can be attributed to differences in the mineral composition or structural characteristics of the soil and rock, which affect thermal properties and result in non-uniform heat transfer within the sample, leading to an imbalanced thermal distribution.
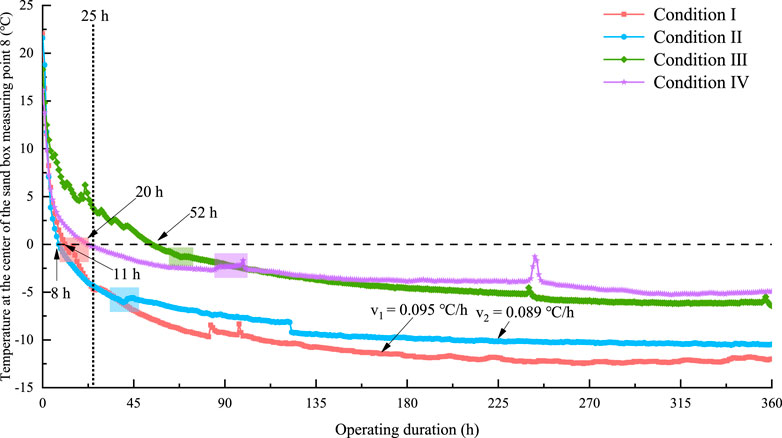
Figure 2. Freezing temperature under different conditions.
Figure 3 shows a zoomed-in image of the latent heat of the icing phases for the four conditions shown in Figure 2. Condition IV had the longest latent heat with an icing duration of 14.3 h; Condition Ⅲ had the shortest duration of 0.6 h. Under Condition III, the temperature increase during the latent heat release in the freezing phase was brief and insignificant. The latent heat of the freezing phase is characterized by a significant increase in the soil and rock temperatures. This is because as the pore water starts to freeze during this phase, it releases a large amount of latent heat from freezing. When the soil temperature rises to its maximum value, the latent heat of ice precipitation is balanced by a decrease in the external temperature. This is followed by the freezing stage, in which the temperature of the soil body decreases further. The water in the pores of the soil body freezes, and the soil particles are cemented to form permafrost. During the stable freezing stage, the temperature of the geotechnical body is virtually stabilized, and the strength of the permafrost body is further enhanced.
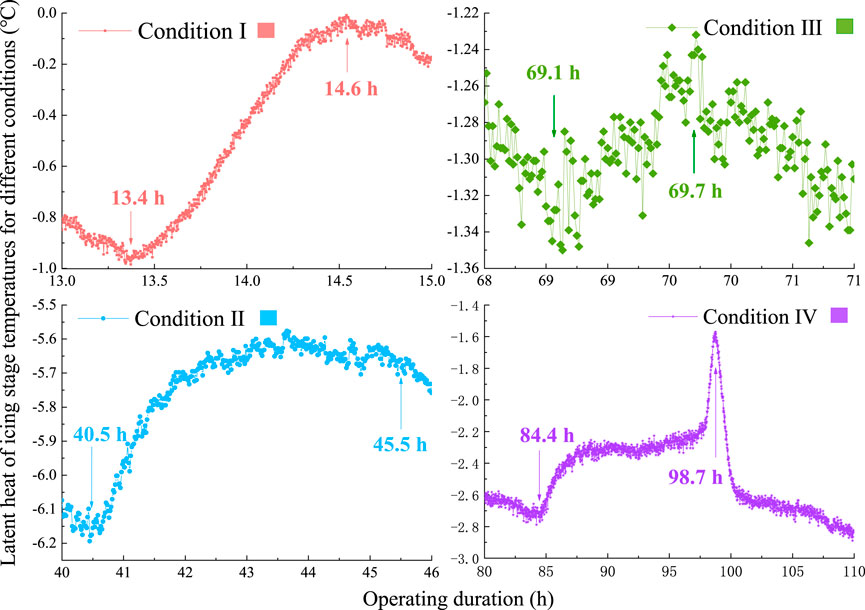
Figure 3. Temperature change curves for the four conditions under study during the latent heat of the icing stage.
3.2 Influence of geotechnical water content on freezing
The water contents of Condition I and II were 7.3% and 27.4%, respectively. Comparing the cooling curves in Figure 2, in the first 25 h, the temperature decrease rates of conditions I and II were 1.069°C/h and 1.036°C/h, respectively. This revealed that the water content during the pre-freezing period had a minimal effect on the freezing rate. The rate of temperature decrease was 0.018°C and 0.022°C/h for Conditions II and I, respectively, during 25–360 h. In the later stages of freezing, the temperature gradient decreased; the higher the water content, the slower the temperature drop rate. During the entire freezing period of 360 h, the temperature drop rate was 0.089°C/h when operating in the full water condition of Condition Ⅱ, slower than 0.095°C/h in Condition I. The cloud and site diagrams at the end of freezing are shown in Figure 4, and the cloud diagram shows the plane where the diagonals of the sandbox are located, i.e., the plane ABCD shown in Figure 1. The freezing radii of Conditions I and II were 220 and 300 mm, respectively, and the expansion rates of the frozen walls were 0.611 mm/h and 0.833 mm/h, respectively. Therefore, the higher the water content of the rock and soil, the slower the rate of temperature drop, the faster the expansion of the freezing wall, and the better the freezing effect.
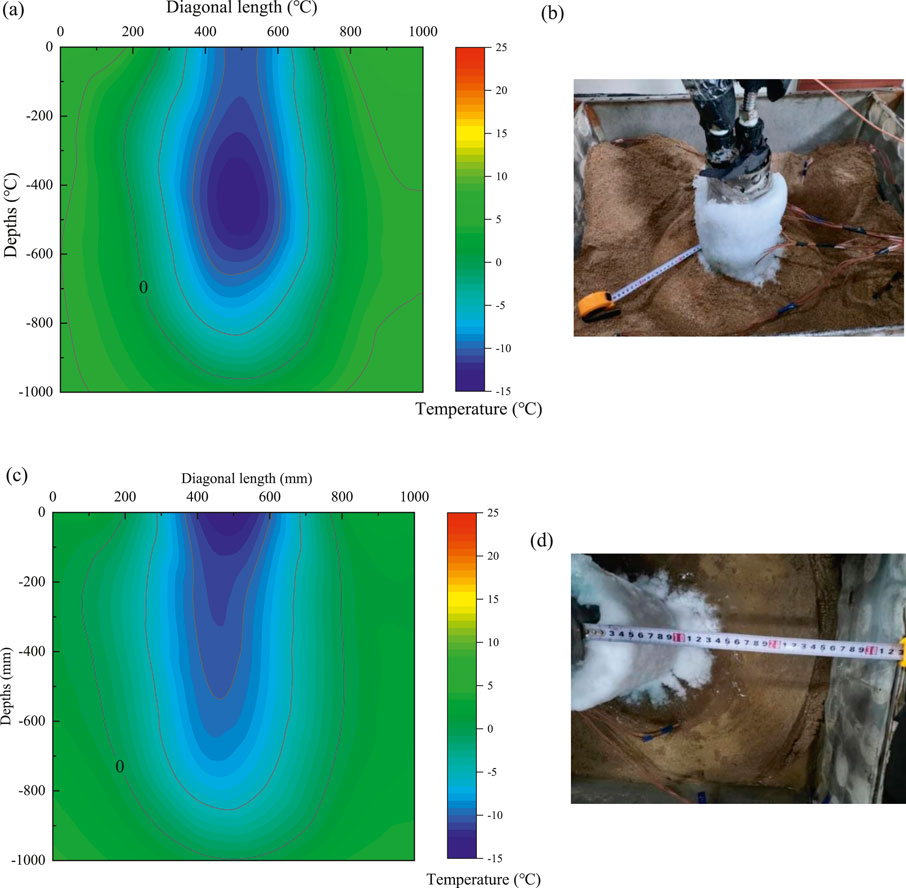
Figure 4. Conditions I and II freezing processes: 360 h cloud and physical diagrams (A) Condition I freeze: 360 h cloud map (B) Physical diagram of Condition I: frozen for 360 h (C) Condition II freeze: 360 h cloud map (D) Physical diagram of Condition II: frozen for 360 h.
As shown in the photograph of the Condition I field experiment in Figure 4B, the unfrozen rock and soil were partially loose. There was no sticky sensation when rubbed by hand, and the water content was 1.6%. The decrease in the water content in the unfrozen geotechnical zone indicated that the water film migrated with the freezing temperature gradient toward the cold end of the experiment, that is, the U-single freeze pipe. This phenomenon can test the theory of water film migration in the ice formation mechanism as a continuous process from high to low temperatures and from thick to thin film water. Notably, frost heave did not occur at the end of freezing under Condition I. The volume of the rock remained essentially unchanged. Li (Pei and Dong, 2023) demonstrated that not all water-bearing geotechnical bodies would produce frost heave. Three soil samples with water content of 10, 14, and 18% were prepared for artificial freezing. The 10% water content was lower than that required for starting frost heave in the rock and soil samples, and there was almost no frost heave. In this experiment, no frost heave was produced at 7.3% water content in the sand. Despite the internal moisture migration phenomenon, the pore space was relatively large owing to the low initial water content of the sand. The internal pore space can accommodate the ice content produced by freezing.
3.3 Influence of different geotechnical media on freezing
Owing to the temperature change in each rock and soil layer close to the wall of the frozen U-shaped pipe, to better analyze the development and change in the freezing temperature field, we analyzed measurement points 12, 13, 14, and 15 outside a certain distance from the frozen pipe. Figure 5 shows the temperature variations during the freezing period for the four-layered lithologies under Condition III. The initial temperatures were the same for each rock and soil layer, approximately 22°C. The rate of temperature change of lignite is 0.061°C/h, significantly slower than the other three lithologies. The rate of temperature decrease for the four lithologies decreased in the following descending order: sand, carbonaceous mudstone, siltstone, and lignite. Furthermore, the measured temperature data of the four geotechnical soils were fitted with the exponential function y = A1e-x/A2+A3, and the fitted correlation coefficients R2 of A1, A2, and A3 were greater than 0.927. Among them, lignite exhibited the highest linear fit accuracy, with an R2 value of 0.9969. This indicates that the exponential functions can satisfactorily fit the temperature changes in the various types of geotechnical soil layers over time. Therefore, this function can be utilized to derive the rate of change in freezing temperature, which facilitates the study of the permafrost temperature field.
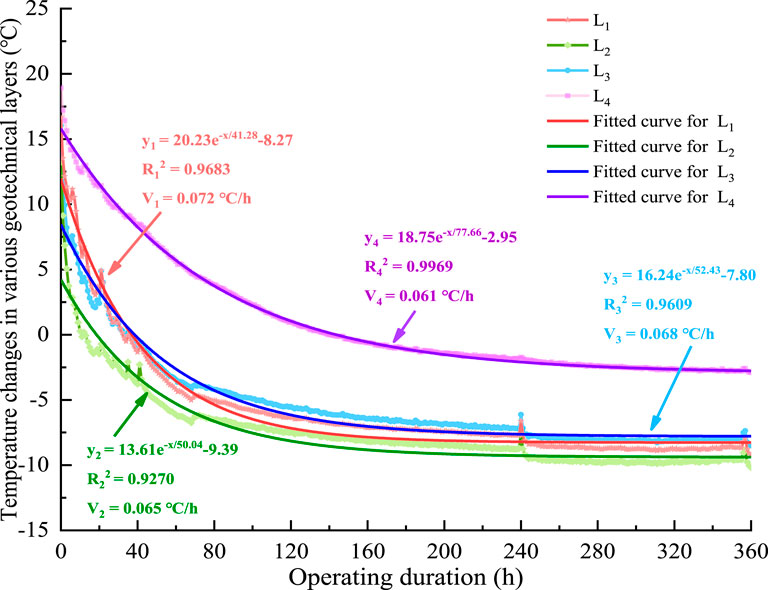
Figure 5. Changes in the freezing temperatures of rock layers under Condition III.
Figure 5 presents the fitted function curve expressions for each lithology and the corresponding values of A1, A2, and A3. The A1 value represents the initial rate of temperature decrease, with higher values indicating a faster initial cooling in rock and soil samples, indicating rapid cooling. The A2 value is associated with the time constant for temperature decreases, where larger values suggest a slower temperature decay process, indicating higher thermal stability. The A3 value represents the final stable level of temperature change. The sand layer, with a high A1 and a greater cooling rate (V1), demonstrated better thermal conductivity and the fastest cooling rate. In contrast, lignite exhibited the lowest cooling rate, reflecting its lower thermal conductivity. Therefore, the thermal properties of different lithologies significantly impact the effectiveness of freezing and the development of the temperature field.
In the context of freezing-process design, high thermal conductivity layers reach the target freezing temperature more rapidly, which implies that the freezing time can be shortened, thus reducing energy consumption for cooling during construction. Conversely, for layers with lower thermal conductivity, extended freezing times and increased cooling energy input may be necessary to ensure the formation and stability of the frozen wall. By analyzing the temperature variation characteristics of different lithologies, the cooling strategy can be precisely tailored to match the thermal properties of each layer, ultimately achieving optimal construction efficiency and cost-effectiveness under diverse geological conditions, which is especially important for projects involving heterogeneous geotechnical materials.
To further compare the freezing effect between different strata, the temperature changes in the longitudinal direction of each stratum were analyzed for holes 1, 2, and 3 at different time periods. The selected holes were in the same orientation, and their distances from the U-shaped freezing tube were 0, 208, and 406 mm (Figure 6). In the same rock layer, the temperature measurement points gradually become denser with an increase in the temperature measurement time. This indicates that the temperature gradient inside the sandbox decreased with an increase in freezing time, and the temperature drop decreased gradually. The temperature field was centered on the U-shaped freezing tube, first affecting the surrounding geotechnical soil and then slowly spreading outward. In hole 1, the sand had already started to enter the negative temperature stage after 20 h of freezing, whereas the lignite entered this stage only after 240 h of freezing, which shows that there are significant differences between the different lithologies.
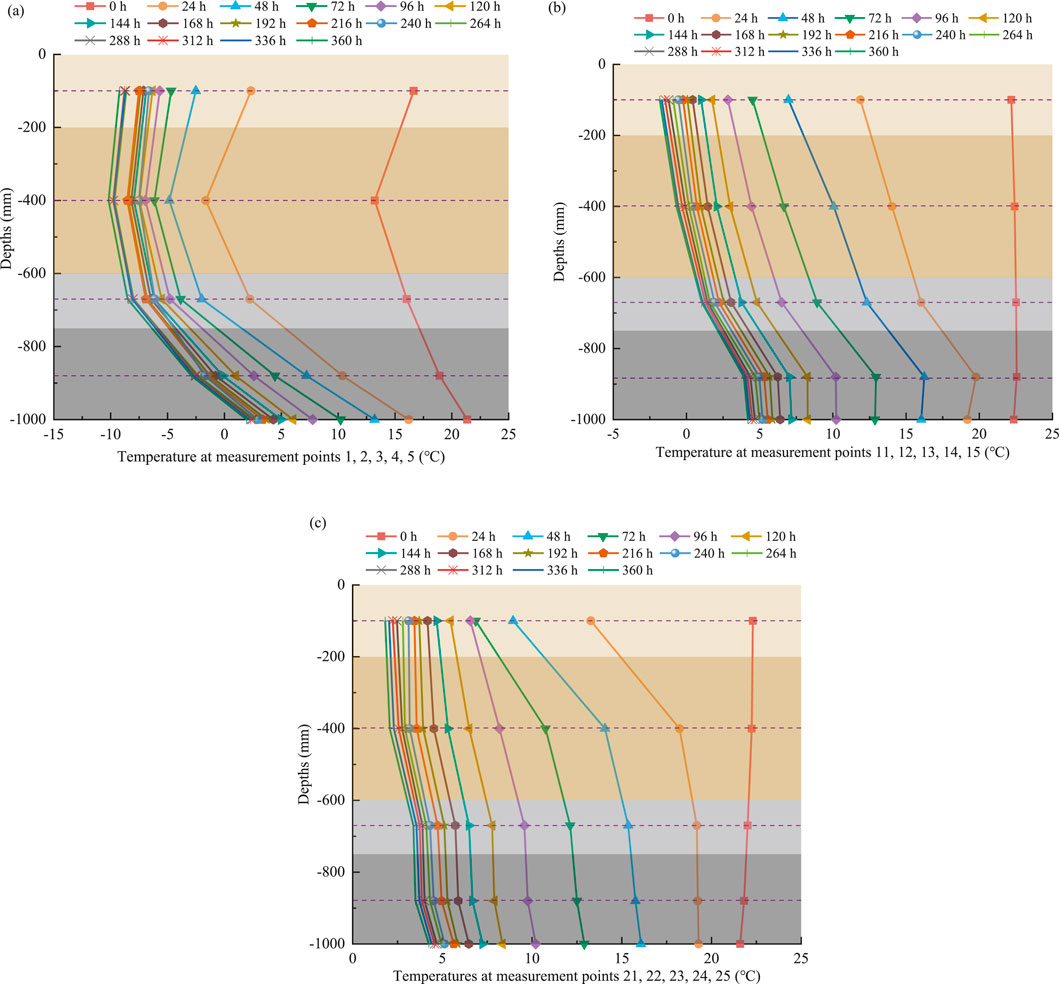
Figure 6. Temperature variations in different rock formations at different hole locations. (A) Hole 1, (B) Hole 2, (C) Hole 3.
Figure 7 shows the freezing conditions of the four types of geotechnical soil after 360 h of freezing. The cloud diagrams show the temperature distribution in the cross-section at the middle of each geotechnical layer. From the cloud diagram, the freezing radii of sand, siltstone, carbonaceous mudstone, and lignite are 400, 340, 380, and 240 mm, respectively, and the expansion rates of the freezing wall throughout the freezing period are 1.111, 0.944, 1.056, and 0.667 mm/h, respectively. The order of the rate of transfer wall expansion was consistent with the rate of temperature decrease, which was positively related.

Figure 7. Condition Ⅲ freezing: 360 h freezing wall condition of each geotechnical layer. (A) L1, (B) L2, (C) L3, (D) L4.
3.4 Influence of seepage on freezing
Figure 8 shows the temperature field for 50 and 360 h of seepage condition operation. The freezing curtain thicknesses before and after the MM’ section were 130 and 140 mm, respectively, when the system was operated for 50 h. After 360 h of operation, the thicknesses of the freezing curtain before and after the MM’ section were 220 and 260 mm, respectively. During the freezing period of 50–360 h, the expansion rate of the freezing curtain was 0.290 and 0.387 mm/h before and after the MM’ section, respectively. The rate of freezing wall expansion is greater on the front side of the MM’ section than on the back side of the section. This is because the relatively warm water flow brought by the seepage increases the thermal load in the freezing zone. The “heat influx effect” caused by seepage results in stronger heat conduction on the left side of MM’, which delays the formation of ice around the freezing pipes on this side. Meanwhile, the seepage carries the cold from the front of the MM’ crack to its back, accelerating the accumulation of cold at the back of this section, thereby facilitating the expansion of the frozen section. Over extended operating times, the frozen soil exhibits a progressively reduced frost-heave effect in the direction of the seepage, further intensifying the asymmetrical distribution.
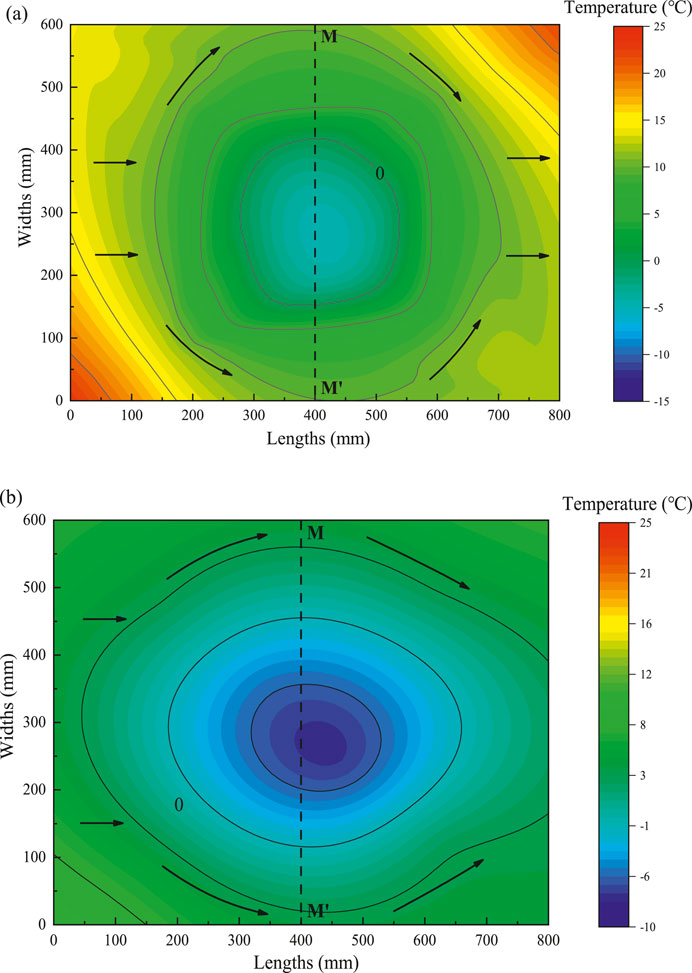
Figure 8. Temperature cloud plots for condition IV at 50 and 360 h of operation. (A) 50 h, (B) 360 h.
The long-term stability of the freezing curtain under continuous seepage depends on a dynamic balance between the freezing rate and thermal influx from seepage. Excessive seepage can lead to insufficient freezing or partial thawing, which reduces the overall strength of the freezing curtain and may result in thawing failure. In such cases, the mechanical properties of the freezing curtain may degrade, compromising the stability of surrounding soil structures. To maintain stability under continuous seepage, increasing cooling capacity in seepage-dense regions and installing hydraulic isolation measures to control groundwater flow are advisable, preserving the integrity of the freezing curtain.
Overall, under the influence of the seepage effect, the temperature distribution of the surrounding soil centered on a single U freezing tube is not uniform during the freezing process. The freezing area was asymmetrically distributed, and the asymmetry was more evident along the seepage direction. The thermodynamic effects of seepage significantly alter the temperature distribution within the freezing curtain. Prolonged seepage could destabilize portions of the frozen region. To ensure system stability and slope safety, further quantification of thermal influx due to seepage and adjustments in the cooling system layout are necessary to optimize freezing performance.
Figure 9 illustrates the variations in the freezing radius, freezing rate, and Reynolds number of carbonaceous mudstone in the presence of seepage. Using 0°C as a reference point, the soil in the sandbox is considered frozen when the geotechnical temperature reaches 0°C. Consequently, the increase in the freezing radius over time can be determined. With an increase in freezing time, the freezing radius gradually increased and was centered on the U-shaped freezing tube. During 0–60 h of freezing, the freezing radius increased sharply to 145 mm, and the freezing rate decreased synchronously during this period. Within 60–360 h of freezing, the freezing radius increased slowly to 188 mm at the end of condition I, and the freezing rate fluctuated by 0.2. As the freezing radius increases, the seepage fluid must flow around the freezing column. Consider MM’ shown in Figure 8 as the boundary. Before the MM’ section, the flow velocity increased and the pressure decreased owing to the continuous contraction of the overflow section. By contrast, after the MM’ section, the fluid layer is a pressurized deceleration zone. The incoming seepage flow velocity was determined to be 2.5 m/d, and the freezing radius was positively correlated with the Reynolds number. When the freezing radius was maximized, the Reynolds number was 1.82.
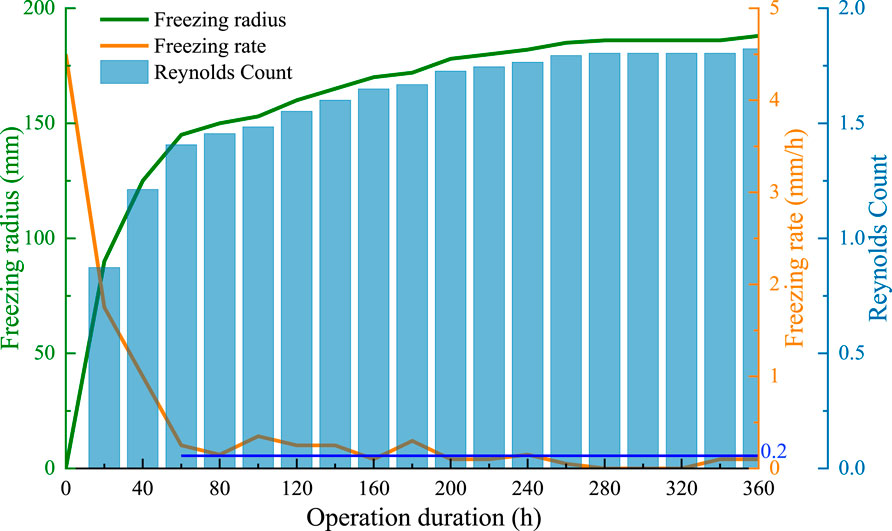
Figure 9. Relationships among freezing radius, freezing rate, and reynolds number variation for condition IV carbonaceous mudstone.
The temperature changes in the geotechnical body with and without seepage are shown in Figure 10. Comparing the temperature drop curves for the seepage-free and seepage-flow conditions, the temperature drop rates for the seepage-free and seepage-flow conditions were 0.068°C and 0.0586°C/h, respectively, over the entire freezing period. An increase in seepage water slows the freezing rate. Furthermore, we compared the temperature changes before and after the MM’ section under seepage conditions. From the temperature drop curves before and after section MM’ in condition IV in Figure 10, the temperature distribution during the freezing process of the geotechnical soil is not uniform. The rate of temperature decrease on the front side of the MM’ section was 0.0586 °C/h, and the temperature dropped to 0°C and eventually stabilized at −4°C after 16 h of freezing. The rate of temperature decrease at the back side of the MM’ section was 0.0613°C/h, and after only 8 h of freezing, the temperature dropped to 0°C and finally stabilized at −7°C. The rate of the temperature decrease on the anterior side of the MM’ break was significantly higher than that on the posterior side. This was because the percolating water carried the cold from the front side of the MM’ to the back side, resulting in an increase in coldness on the back side of the cylinder and a rapid drop in temperature. After running for 68 h, both curves show consistent temperature trends and volatility. This indicates that the effect of seepage on freezing increases with time during the pre-freezing period. After equilibrium was reached, the temperatures on both sides did not change.
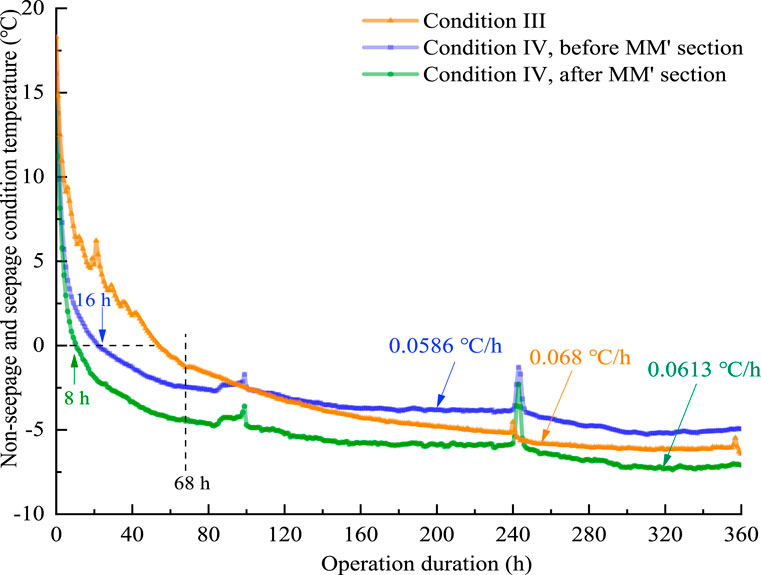
Figure 10. Temperature changes under seepage and non-seepage conditions.
3.5 Characteristics of geotechnical changes under freeze–thaw conditions
Figure 11 illustrates the recovery of the temperature field inside the sandbox under melting conditions. The temperature change curves of the four geotechnical layers show that the temperature recovery patterns of each geotechnical layer were similar. All of them underwent the following four phases: temperature stabilization, rapid temperature recovery, smooth temperature recovery, and steady temperature. As the external temperature begins to increase during the temperature stabilization phase, frozen, weakly bound water crystals absorb heat and start melting. Ice formed from free water during freezing then begins to steadily melt, causing an upward trend in the temperature curve. Once the ice resulting from free water in the pores has completely melted, the soil temperature becomes positive. During the steady recovery phase, all soil and rock layers exhibit similar recovery rates, reaching a heat-diffusion-dominated state. The temperature changes gradually stabilize, and each layer eventually reaches thermal equilibrium with the ambient temperature.
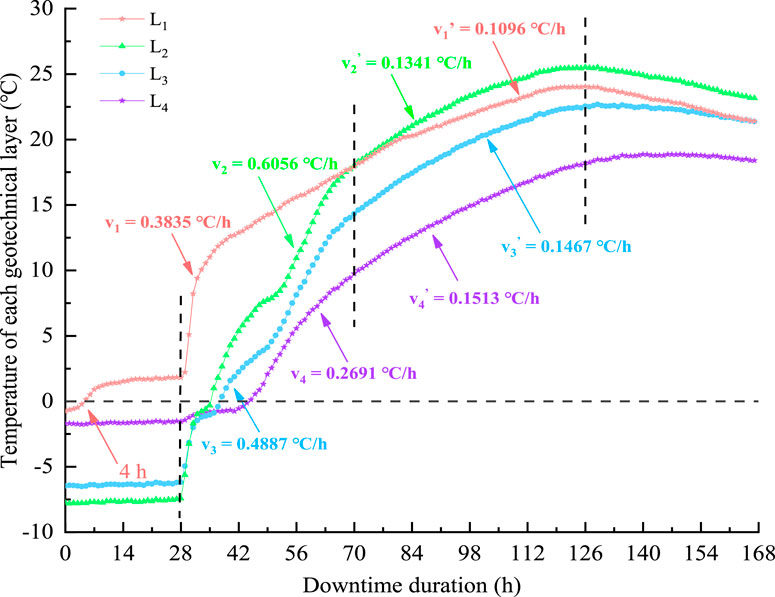
Figure 11. Temperature recovery of each lithosphere under melting conditions.
Within the first 28 h after the system stopped running, the freezing temperatures of the siltstone, charcoal mudstone, and lignite layers remained unchanged owing to the residual cooling of the refrigeration system. As per the curves of freezing radius change of the four geotechnical layers throughout the freeze–thaw process in Figure 12, sand has the fastest melting rate among the four geotechnical layers. At the beginning of the melting condition, the freezing radius of the sand is 130 mm, and the melting rate of the sand is 6.5 mm/h. After 20 h, the freezing radius becomes 0. Once the system stopped running after 6 h, the sand temperature returned to 3°C; between 6 and 28 h, the sand temperature was stable. The system stopped running for 28–70 h owing to a rapid temperature recovery phase. Siltstone had the fastest melting rate of 0.606°C/h, followed by carbonaceous mudstone, sand, and lignite—which had the slowest melting rate of 0.269°C/h.
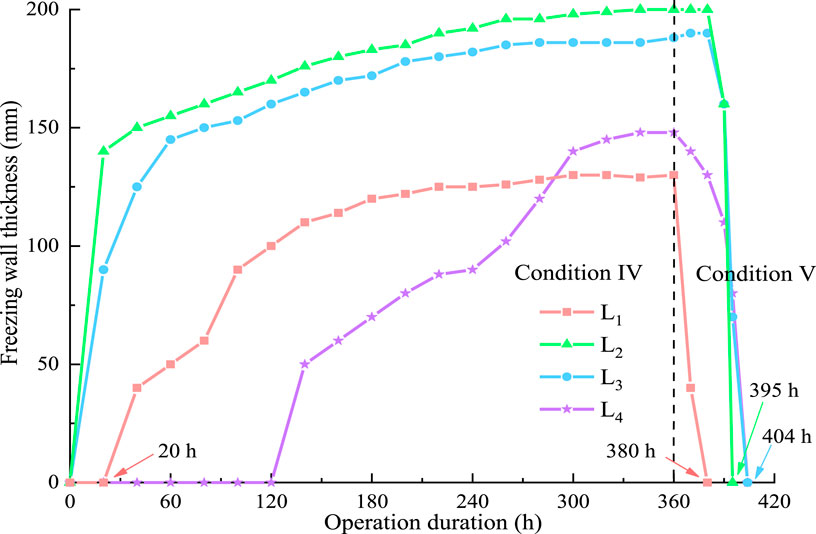
Figure 12. Freezing radius with time for each geotechnical layer.
The freezing radii of siltstone, carbonaceous mudstone, and lignite were 0 at 35, 44, and 45 h, respectively, indicating a state of complete melting. In descending order, the freezing radius melting rates for the four lithologies were 6.50 mm/h for sand, 5.71 mm/h for siltstone, 4.32 mm/h for carbonaceous mudstone siltstone, and 3.36 mm/h for lignite. The temperature-smooth recovery phase occurs during the 70–126-h period when the system stops running, and the average recovery rates of the siltstone, carbonaceous mudstone, and lignite were not significantly different. The temperature recovery rate of the sand was 0.109°C/h, significantly lower than that of the other three lithologies. After the system stopped running for 126 h, the geotechnical soil was mainly affected by the ambient temperature and the temperature difference between the geotechnical layers.
During the temperature stabilization phase, all four types of geotechnical soils had different temperature trends. This is because an equilibrium state is reached between the various geotechnical layers inside the sandbox as well as with the environment. The temperatures of the geotechnical layers are expected to eventually reach the same level. Once the refrigeration system ceases to operate, the process of temperature recovery in the various geotechnical layers is extremely rapid. It can be observed that applying artificial stratum technology to reinforce large geotechnical slopes enables the rapid restoration of the natural groundwater flow field shortly after project construction concludes.
4 Conclusion
In this study, a novel system was investigated involving the application of artificial ground-freezing techniques to stabilize slopes in large-scale surface coal mines. The technical feasibility of this system was validated through indoor tests. Based on artificial-stratum-freezing technology, sandbox tests were conducted under five conditions: changing the water content, changing the filling mediums, and increasing the seepage loops. The development characteristics of the geotechnical freezing temperature field under different conditions were analyzed. The following conclusions were obtained:
(1) The freezing process of each type of geotechnical soil can be divided into four phases: rapid cooling, latent heat of ice precipitation, freezing, and stable freezing. Experimental data show that the decreased temperature rates of the four geotechnical layers, in descending order, are: sand 0.072°C/h, carbonaceous mudstone 0.068°C/h, siltstone 0.065°C/h, and lignite 0.061°C/h. The temperature decrease rates of the experimental geotechnical layers were fitted, and the exponential fitting function y = A1e-x/A2+A3 can well reflect the trend of temperature decrease with time.
(2) The higher the water content, the faster the expansion of the freezing curtain and the better the freezing effect. When the water content was 7.3%, the final freezing radius was 220 mm; when the water content was 27.4%, the final freezing radius was 300 mm. Not all water-containing geotechnical soils are subject to freezing and expansion. The sandy soil used in this experiment had an initial freezing water content greater than 7.3%, which avoids the deformation hazards of frozen slopes.
(3) The addition of seepage loops resulted in a decrease in the freezing rate and an asymmetric distribution of the frozen areas. The temperature drop rates under the no-seepage and seepage conditions were 0.068°C and 0.0586 °C/h, respectively. Under the seepage condition, the freezing radius is positively correlated with the Reynolds number—1.82 for a maximum freezing radius of 188 mm. The freezing curtain expands at 0.029 mm/h before the MM’ section and at 0.387 mm/h after the section.
(4) In the freeze–thaw condition, the temperature recovery of sand, siltstone, carbonaceous mudstone, and lignite all underwent the following four stages: stabilization, rapid recovery, smooth recovery, and equilibrium. The melt rates for the four lithologies at the freezing radius were, in descending order, 6.50 mm/h for sand, 5.71 mm/h for siltstone, 4.32 mm/h for carbonaceous mudstone, and 3.36 mm/h for lignite.
This research provides a new green system for efficient slope stabilization in large-scale open-pit coal mines. The results of the study can provide a basis for the precise design of freezing schemes and the safe stabilization of the freezing wall. Although the experimental setup effectively validates the proposed method in a laboratory environment, it is limited in its ability to replicate field-scale conditions and account for natural environmental variability. Future research should focus on overcoming these limitations by examining the impact of the freezing process under real-world conditions, including its influence on engineering safety, reinforcement efficacy, and construction costs. Such investigations will be crucial for optimizing the application of AGF technology in the stabilization of open-pit slopes.
Data availability statement
The original contributions presented in the study are included in the article/supplementary material, further inquiries can be directed to the corresponding author.
Author contributions
ZW: Writing–original draft. HC: Writing–original draft. SW: Writing–review and editing. MZ: Writing–review and editing. WS: Writing–review and editing.
Funding
The author(s) declare that financial support was received for the research, authorship, and/or publication of this article. This work was supported by the Key Laboratory of Shallow Geothermal Energy, Ministry of Natural Resources of the People’s Republic of China (KLSGE202401-08).
Conflict of interest
The authors declare that the research was conducted in the absence of any commercial or financial relationships that could be construed as a potential conflict of interest.
Generative AI statement
The author(s) declare that no Generative AI was used in the creation of this manuscript.
Publisher’s note
All claims expressed in this article are solely those of the authors and do not necessarily represent those of their affiliated organizations, or those of the publisher, the editors and the reviewers. Any product that may be evaluated in this article, or claim that may be made by its manufacturer, is not guaranteed or endorsed by the publisher.
References
Alamshahi, S., and Hataf, N. (2009). Bearing capacity of strip footings on sand slopes reinforced with geogrid and grid-anchor. Geotext. Geomembranes 27 (3), 217–226. doi:10.1016/j.geotexmem.2008.11.011
Aziz, N., Majoor, D., and Ali, M. (2017). Strength properties of grout for strata reinforcement. Procedia Eng. 191, 1178–1184. doi:10.1016/j.proeng.2017.05.293
Bieliatynskyi, A., Krayushkina, K., Vera, B., and Lunyakov, M. (2021). Basalt fiber geomats-modern material for reinforcing the motor road embankment slopes. Transp. Res. Procedia 54, 744–757. doi:10.1016/j.trpro.2021.02.128
Bosco Niyomukiza, J., Amin, E., and Tangtermsirikul, S. (2023). Recent advances in slope stabilization using porous vegetation concrete in landslide-prone regions: a review. J. Build. Eng. 76, 107129. doi:10.1016/j.jobe.2023.107129
Cheng, P., Wu, L., Zhang, H., and Zhou, J. (2024). Inclusion of root water absorption and reinforcement in upper bound limit stability analysis of vegetated slopes. Comput. Geotechnics 169, 106227. doi:10.1016/j.compgeo.2024.106227
Cui, Z., Zhang, L., and Xu, C. (2023). Numerical simulation of freezing temperature field and frost heave deformation for deep foundation pit by AGF. Cold Regions Sci. Technol. 213, 103908. doi:10.1016/j.coldregions.2023.103908
Feng, R., Fourtakas, G., Rogers, B. D., and Lombardi, D. (2022). Two-phase fully-coupled smoothed particle hydrodynamics (SPH) model for unsaturated soils and its application to rainfall-induced slope collapse. Comput. Geotechnics 151, 104964. doi:10.1016/j.compgeo.2022.104964
He, Y., Hazarika, H., Yasufuku, N., and Han, Z. (2015). Evaluating the effect of slope angle on the distribution of the soil-pile pressure acting on stabilizing piles in sandy slopes. Comput. Geotechnics 69, 153–165. doi:10.1016/j.compgeo.2015.05.006
Hu, X., Fang, T., Chen, J., Ren, H., and Guo, W. (2018). A large-scale physical model test on frozen status in freeze-sealing pipe roof method for tunnel construction. Tunn. Undergr. Space Technol. 72, 55–63. doi:10.1016/j.tust.2017.10.004
Jain, S. K., Saleh Nusari, M., Purushotam, D., Prasad, A. I., and Shrestha, R. (2021). Effectiveness of geocell wall, geogrid and micropile anchors for mitigation of unstable slopes. Geoenvironmental Disasters 8 (11), 2–15. doi:10.1186/s40677-021-00185-z
Jiang, S., Li, J., Zhang, S., Gu, Q., Lu, C. W., and Liu, H. (2022). Landslide risk prediction by using GBRT algorithm: application of artificial intelligence in disaster prevention of energy mining. Process Saf. Environ. Prot. 166, 384–392. doi:10.1016/j.psep.2022.08.043
Koerner, R. M. (2015). In-Situ stabilization of soil slopes using nailed or anchored geosynthetics. Int. J. Geosynth. Ground Eng. 1 (2), 2–9. doi:10.1007/s40891-014-0002-2
Liu, X., Shen, Y., Zhang, Z., Liu, Z., Wang, B., Tang, T., et al. (2022). Field measurement and numerical investigation of artificial ground freezing for the construction of a subway cross passage under groundwater flow. Transp. Geotech. 37, 100869. doi:10.1016/j.trgeo.2022.100869
Liu, X., Zeng, Y., Wu, Q., Meng, S., Liang, J., and Hou, Z. (2024). Ecological-based mining: a coal–water–thermal collaborative paradigm in ecologically fragile areas in western China. Engineering 38, 209–222. doi:10.1016/j.eng.2024.01.019
Nikolaev, P., Jivkov, A. P., Margetts, L., and Sedighi, M. (2024). Modelling artificial ground freezing subjected to high velocity seepage. Int. J. Heat Mass Transf. 221, 125084. doi:10.1016/j.ijheatmasstransfer.2023.125084
Pei, Li, and Dong, Y. (2023). Characterization and impact analysis of freezing and expansion disease of roadbed in seasonal freezing zone: a case of heavy railroads. Geohazard Mech. 1 (3), 218–230. doi:10.1016/j.ghm.2023.09.003
Russo, G., Corbo, A., Cavuoto, F., and Autuori, S. (2015). Artificial Ground Freezing to excavate a tunnel in sandy soil. Measurements and back analysis. Tunn. Undergr. Space Technol. 50, 226–238. doi:10.1016/j.tust.2015.07.008
Semin, M., Golovatyi, I., Levin, L., and Pugin, A. (2024). Enhancing efficiency in the control of artificial ground freezing for shaft construction: a case study of the Darasinsky potash mine. Clean. Eng. Technol. 18, 100710. doi:10.1016/j.clet.2023.100710
Sharqawy, M. H., Mokheimer, E. M., Habib, M. A., Badr, H. M., Said, S. A., and Al-Shayea, N. A. (2009). Energy, exergy and uncertainty analyses of the thermal response test for a ground heat exchanger. Int. J. Energy Res. 33, 582–592. doi:10.1002/er.1496
Song, W., Liu, Y., Zhu, Ke, and Zheng, T. (2017). Numerical simulation of forced external circulation standing column well based on CFD. Procedia Eng. 205, 3178–3185. doi:10.1016/j.proeng.2017.10.245
Sun, S., Zhu, B., and Wang, J. (2013). Design method for stabilization of earth slopes with micropiles. Soils Found. 53 (4), 487–497. doi:10.1016/j.sandf.2013.06.002
Taylor, B. N., and Kuyatt, C. E. (1994). National institute of standards and technology (NIST), guidelines for evaluating and expressing the uncertainty of NIST measurement results. NIST Spec. Publ. 1297. doi:10.6028/NIST.tn.1297
Vitel, M., Rouabhi, A., Tijani, M., and Guérin, F. (2015). Modeling heat transfer between a freeze pipe and the surrounding ground during artificial ground freezing activities. Comput. Geotechnics 63, 99–111. doi:10.1016/j.compgeo.2014.08.004
Wang, X., Li, M., Chen, J., and Zhu, Y. (2022). Performance of a deep excavation with the composite retaining wall using artificial ground freezing method. Cold Regions Sci. Technol. 204, 103676. doi:10.1016/j.coldregions.2022.103676
Yang, Y., Zhou, W., Wang, Z., Jiskani, I. M., and Yang, Y. (2024). Accurate long-term dust concentration prediction in open-pit mines: a novel machine learning approach integrating meteorological conditions and mine production intensity. J. Clean. Prod. 436, 140411. doi:10.1016/j.jclepro.2023.140411
Zeng, Y., Meng, S., Wu, Q., Mei, A., and Bu, W. (2023). Ecological water security impact of large coal base development and its protection. J. Hydrology 619, 129319. doi:10.1016/j.jhydrol.2023.129319
Zhang, S., Yue, Z., Lu, X., Zhang, Q., Sun, T., and Qi, Y. (2023). Model test and numerical simulation of foundation pit constructions using the combined artificial ground freezing method. Cold Regions Sci. Technol. 205, 103700. doi:10.1016/j.coldregions.2022.103700
Zhelnin, M., Kostina, A., Prokhorov, A., Plekhov, O., Semin, M., and Levin, L. (2022). Coupled thermo-hydro-mechanical modeling of frost heave and water migration during artificial freezing of soils for mineshaft sinking. J. Rock Mech. Geotechnical Eng. 14 (2), 537–559. doi:10.1016/j.jrmge.2021.07.015
Keywords: artificial ground freezing method, open-pit coal mines, slope freezing, sandbox test, freezing temperature field characterization
Citation: Wang Z, Cao H, Wang S, Zhao M and Song W (2025) Experimental study on slope consolidation sand tanks based on the artificial ground freezing method. Front. Built Environ. 10:1508064. doi: 10.3389/fbuil.2024.1508064
Received: 09 October 2024; Accepted: 16 December 2024;
Published: 07 January 2025.
Edited by:
Wei Guo, Tianjin University, ChinaCopyright © 2025 Wang, Cao, Wang, Zhao and Song. This is an open-access article distributed under the terms of the Creative Commons Attribution License (CC BY). The use, distribution or reproduction in other forums is permitted, provided the original author(s) and the copyright owner(s) are credited and that the original publication in this journal is cited, in accordance with accepted academic practice. No use, distribution or reproduction is permitted which does not comply with these terms.
*Correspondence: Wei Song, c3RpbGx3YXRlcjIwMTNAMTYzLmNvbQ==