 Ünsal Özdilek
- Département de Stratégie, Responsabilité Sociale et Environnementale, École des Sciences de la Gestion, Université du Québec à Montréal, Montréal, QC, Canada
Introduction: Forecasting population dynamics is crucial for effective urban and regional planning. Traditional demographic methods, such as Cohort Component Analysis, often do not capture nonlinear interactions and spatial dependencies among regions. To address these limitations, this study integrates Lotka—Volterra prey—predator equations with a probabilistic adaptation of the Gravity model, providing a more robust theoretical and methodological framework for regional population forecasting.
Methods: We adapt the Lotka—Volterra model—originally rooted in ecological theory—by introducing carrying capacities and region-specific parameters, then embed a probabilistic Gravity model to capture interregional mobility. This unified approach leverages population data and migration flows from three major clusters in Quebec, Canada, calibrating model parameters to reflect observed demographic trends. The resulting system of equations was iteratively solved and tested using population data from 2021 through 2023.
Results: The combined model effectively captured competitive and cooperative population interactions, revealing how spatial connectivity and resource constraints shape long-term growth patterns across the three regions. Calibrated forecasts aligned well with observed trends, demonstrating the framework’s capacity to reflect real-world interdependencies in regional population flows. Key findings highlight the importance of prey—predator—like dynamics in producing stable or shifting equilibria, offering deeper insights into regional competition, cooperation, and demographic sustainability.
Discussion: By merging ecological modeling principles with spatial interaction theories, this work underscores the added value of grounding demographic forecasting in well-established theoretical constructs. Compared to more traditional approaches, the integrated Lotka–Volterra and Gravity model provides a clearer picture of how regional populations evolve under nonlinear and spatially linked influences. This approach is readily adaptable to diverse contexts, potentially enhancing forecast precision and guiding policy interventions in urban development, resource allocation, and strategic planning on a broader scale.
1 Introduction
Accurately forecasting population dynamics, driven by natural growth and mobility, is essential for effective urban planning and territorial development. Traditional methods, such as Cohort Component Analysis (CCA), primarily rely on historical data and often overlook the nonlinear interdependencies among multiple demographic parameters and interacting regions. Consequently, these rigid frameworks can lead to outdated predictions and overlooked implications (Rees and Wilson, 1977). To overcome these limitations, this study benefits from the dynamic modeling capabilities of an enhanced Lotka-Volterra model for human population prediction, while simultaneously integrating a refined probabilistic gravity approach. This integrated framework offers a more precise and comprehensive tool for understanding and predicting population dynamics, thereby improving the accuracy of regional planning and policymaking (Lutz and Gailey, 2020).
Population estimates generally rely on the evolution of various demographic components and prevailing trends (Reinhold and Thomsen, 2015). CCA, pioneered by Whelpton (1928) in Canada, remains widely employed for population enumeration and projections. It is widely adopted in developed nations for its effectiveness in capturing historical trends and the evolution of natural parameters such as birth and death rates, classified by age and gender (Chi, 2009; Wilson, 2016). CCA employs straightforward methodologies, assuming linearly independent impacts of typical demographic attributes while often underrepresenting population mobility and other abstract parameters influencing regional dynamics (Smith et al., 2013). The complexity of demographic forecasting essentially lies in interpreting these interconnected mobility patterns (Lucas, 2015; Lutz and Gailey, 2019; Stawarz et al., 2021; Murayama and Nagayasu, 2021).
Interregional mobility is significantly influenced by individuals’ pursuit of improved housing, job opportunities, vibrant communities, and higher social and environmental standards (Greenwood, 1997; Teixeira, 2009; Seo et al., 2020). Anticipating its socioeconomic consequences and demographic shifts is essential for effective planning, management, and territorial development (Champion and Fielding, 1992; Zoraghein and O’Neil, 2020). Critical decisions on social welfare, economic resource allocation, land use planning, property valuation, taxation, and public services, especially transportation, depend on robust demographic insights (Biswas et al., 2009; Terroso-Sáenz and Muñoz, 2022). However, a static and reactive approach in isolated regions fails to harness demographic trends effectively, exacerbating issues that require strategic intervention for balanced regional development (Lichter and Johnson, 2006). Such approaches often overlook dynamic socioeconomic factors, leading to fragmented and suboptimal development outcomes (Miao and Pojani, 2022). Integrated and adaptive planning methods are essential for responding to changing environmental and economic conditions, as rigid, isolated strategies can hinder effective regional development (Özdilek, 2016; Wang and Li, 2021).
Demography and migration inherently encompass socioeconomic and geographic dimensions, making them amenable to modeling cultural dynamics (Voss, 2007; Burton et al., 2010; Matthews and Parker, 2013; Wilson et al., 2021). To refine population growth estimations, demographers have traditionally utilized age-sex spatio-temporal life tables or actuarial probability matrices, sometimes integrating origin-destination mobility data (Rau et al., 2022; Malmberg et al., 2023). While many studies focus on internal migration rates, interactions between neighboring regions—driven by geographical disparities and socioeconomic ties—catalyze complex inter-regional dynamics (Song et al., 2013; Huang et al., 2018). The integration of spatial interaction models, particularly those utilizing entropy-maximizing principles as established by Wilson (1970), Wilson (2010), provides a robust framework for incorporating spatial dependencies of socioeconomic and migration patterns.
In recent years, advanced computational algorithms have significantly enhanced demographic mobility estimates by integrating interregional dependencies. Techniques such as feedforward neural networks (Openshaw, 1993), agent-based modeling (Billari and Prskawetz, 2003; Gopal, 2006), the radiation model (Simini et al., 2021), and Graph Convolutional Network (GCN) architectures (Wang et al., 2023a) have expanded the analytical toolkit. These methodologies, ranging from time-series analysis to Bayesian modeling and machine learning approaches, improve the predictive capabilities of demographic studies (Abel et al., 2013; Robinson and Dilkina, 2018; Sohst and Tjaden, 2020). By accounting for spatial and temporal interdependencies and the complex interplay of socioeconomic factors, these advancements offer a more nuanced understanding of population dynamics.
Various tools and specific programs enhance predictive capabilities by integrating spatial and temporal data, making them indispensable for modern demographic research and planning (Wang et al., 2023b). These tools leverage programming and simulation approaches to anticipate territorial development, creating virtual spaces that facilitate hypothesis testing and scenario development (Deng et al., 2023). For instance, Origin-Destination REIMHS analysis supports traffic flow and population movement predictions, providing insights into regional interactions (Wang et al., 2019). MEPLAN, a land-use and transport interaction model, integrates the economic impacts of transportation systems, offering a holistic view of regional development (Pignataro et al., 1998; Hunt et al., 2005; Cooke and Leydesdorff, 2006). The PECAS model further refines understanding by simulating economic and spatial interactions in urban areas, improving population predictions (Ellam et al., 2018). Additionally, TELUM and UrbanSim models simulate household and workforce location behaviors under various land use scenarios, aiding in the analysis of demographic trends and their impact on regional planning (Waddell, 2002; Grant, 2002; Deng et al., 2023).
The global evolution of biological systems and other complex phenomena necessitates nonlinear dynamical models to capture space-time variations (Hofbauer and Sigmund, 1998; Burch, 2018). The Lotka-Volterra model, employing differential equations within a prey-predator dynamic framework, has found applications in epidemiology and economics (Cockshott and Cottrell, 2009; Hol et al., 2016). However, its direct use in human population prediction remains less explored (Bischi et al., 2000). Despite its theoretical robustness, demographic forecasting often relies on accounting methods lacking a solid theoretical basis (Hudson, 1970; Tranos et al., 2015a; Tranos et al., 2015b). The Lotka-Volterra model’s mathematical foundation offers a promising avenue for advancing demographic forecasting, providing a coherent framework for understanding population dynamics and guiding effective resource allocation (de Valk et al., 2022). Although not originally a demographic model, the gravity model, based on Newton’s law of gravitation, has been applied to study migration between competing regions (Reilly, 1931; Zipf, 1949; Anderson, 2011), but requires adjustments for social science contexts (Davis et al., 2013).
Integrating the Lotka-Volterra dynamic equations enables models to more effectively capture interactions between competing populations. Additionally, advanced gravity models, particularly those based on entropy-maximizing principles (Wilson, 2008), can enhance population prediction capabilities. However, even integrated Lotka-Volterra and gravity models do not fully account for all the complexities of population mobility and predictability. Simplifications of parameters and phenomena make accurate predictions of social behaviors, migration patterns, and population growth challenging (Partridge et al., 2007). Moreover, factors such as subjective decision-making, cultural influences, and policy changes further limit the comprehensive predictive power of these approaches (Billari and Prskawetz, 2003).
This study presents an innovative methodological framework to address the intricacies of population dynamics across three regional clusters in Quebec, Canada. While it focuses on regions within the Quebec province, the presented model—its concepts, data, and methodology—is sufficiently generalizable to other geographic contexts, provided suitable data and identified clusters. The integrated model’s ability to capture dynamic interactions makes it highly adaptable. Future studies could apply this approach elsewhere, considering local data and specific regional dynamics.
By incorporating concepts such as carrying capacity, multiple interacting regions, and resource constraints, and by fine-tuning parameters using historical data, our adapted model closely simulates competitive and cooperative dynamics reflective of real-world interactions. This comprehensive approach enhances the accuracy and relevance of interregional migration fluidity and provides a robust tool for demographic forecasting. Demonstrated through illustrative examples and optimized using advanced computational techniques, our model offers reliable, policy-informing insights into regional population influences over time, significantly advancing demographic forecasting and supporting strategic planning and effective policy formulation.
2 Literature review
Effective demographic predictions hinge on concepts, data, and mathematical approaches grounded in fundamental theories (Bryant and Zhang, 2019). Current data-centric methodologies in demography have not significantly advanced the field (Luhmann, 1995; Burch, 2018), largely due to the absence of a comprehensive foundational framework. This often leads to the ecological fallacy, where aggregate data is misapplied to individual behavior, failing to reflect real-world complexities (Courgeau, 2007; Courgeau, 2012). Consequently, the field has been slow to develop robust theories that integrate social, economic, and geographic variables, frequently drawing on insights from other disciplines without forging a cohesive theoretical framework (Doran, 2000; Silverman et al., 2011; Silverman et al., 2013; Courgeau et al., 2017a). This lack of a unified approach hampers the ability to fully capture the nuances of population dynamics (Burch, 2002).
The literature underscores the significance of concepts and demographic parameters as the foundation for various methods used to study population (Paul and Yeoh, 2020). Parameters such as aging and birth/death rates, governed by biological rules, are relatively predictable (Guillot, 2011). However, parameters related to human judgment and behavior—such as fertility, lifestyle, family composition, migration, and regional socioeconomic disparities—are less predictable yet crucial (Kuate Defo, 2014). For instance, individuals often relocate from high-unemployment areas to regions offering lower unemployment rates (Myrdal, 1957; Polese, 1981). Lee’s migration theory (1966, 1969) elucidates push and pull factors by considering both attractive and repulsive regional attributes. These components span biology, sociology, economics, geography, politics, and physics (Rogers and Castro, 1981; Rogers and Willekens, 1986; de Valk et al., 2022).
The economic impacts of utility parameters, explained by Lancaster (1966) and quantified by Rosen (1974), provide a framework for understanding decision-making through concepts, data, and methods. Just as rational economic agents drive markets toward equilibrium, individuals make demographic decisions that influence population variations via migration dynamics (Bloom et al., 2009; Aksoy et al., 2019). For instance, unemployment significantly affects migration patterns (Wiginton, 2013). Tiebout’s (1956) theory suggests that “people vote with their feet,” indicating preferences for locations with better job availability and conditions (McDonald, 2004; Walsh et al., 2011). Cultural and social disparities highlight mobility dynamics, particularly from poorer to wealthier areas (Kritz et al., 2013), as originally noted by the Chicago School (Harris and Ullman, 1945). City size plays a crucial role, with larger cities typically attracting more immigrants due to broader opportunities and amenities, while smaller cities may attract fewer migrants due to limited resources (Malecki, 2004; Hyndman et al., 2006; Price and Benton-Short, 2008). Once settled, immigrants often move from their initial cities to larger urban centers (Newbold, 2007; Newbold, 2011). Governments engage in optimally mitigating immigration policies to balance total population evolution and ensure service provision and economic growth (Green and Green, 2004).
Geographers and urban planners apply geographical theories to assess location utility and rent (Alonso, 1960; Oates, 1969). Tobler’s (1970) First Law of Geography states that “everything is related to everything else, but near things are more related than distant things.” Spatial proximity and interregional relations affect flow intensity (Ullman, 1954), typically measured by geographical distance (Fotheringham, 1981). Migration flows represent geographically embedded networks whose intensity correlates with population movement (Lee, 1966; 1969; Batten and Boyce, 1987; Abel and Sander, 2014). Demographers use a spatio-temporal probability matrix to integrate mobility resulting from observed trends. The stationary regional populations of such a life table serve as inputs to numerical demographic calculations. Based on various age-structured data like birth location and actual residence, these matrices improve population growth estimates (Leslie, 1945; Rogers and Castro, 1981). In this perspective, geographers and demographers draw on Newton’s law of gravitation to explain interaction and migration over space (Reilly, 1931; Zipf, 1949). The most commonly applied form of the gravity model predicts migration interaction between two locations of differing importance, factoring in distances between them (Poot et al., 2016).
The gravity model aligns well with migration theories and offers straightforward predictive capabilities for population growth (Stewart, 1950; Anderson, 2011). Based on Newton (1687) Law of Universal Gravitation, the model suggests that regional attractiveness increases flow intensity, with distance acting as a cost factor (Haynes and Fotheringham, 1984). Enhancements to the gravity model incorporate additional regional attributes (Lewer and Van den Berg, 2008) and advanced iterations that account for multiple push/pull factors and spatial spillovers (Fik and Mulligan, 1998). These refinements consider internal, interstate, and international migrations, providing a comprehensive analytical tool for demographic studies (Karemera et al., 2000; Peeters, 2012; Beine et al., 2016).
Recent advancements in demographic research underscore the importance of integrating dynamic models and computational techniques to better understand and predict population behaviors. Burch (2018) emphasizes moving beyond traditional data-centric approaches, advocating for models that capture the complexity of human decision-making and interactions. Agent-based models and system dynamics serve as essential tools for integrating micro- and macro-demographic phenomena, offering a comprehensive framework for analysis (Billari and Prskawetz, 2003). Courgeau et al. (2017b) suggest that adopting these methods can lead to broader, model-based research programs with enhanced explanatory power. The use of mathematical modeling and simulation tools, such as the Lotka-Volterra model, is crucial for reflecting non-linear interactions and dynamic mobility within populations (Franck, 2002).
Dynamic models describe the temporal evolution of physical, ecological, economic, financial, and social systems (Puu, 2000; Bischi et al., 2000). Discrete time dynamic models, such as the logistic map, exhibit complex, chaotic behavior characterized by trajectories converging to attractor points or basins of attraction (Gumowski and Mira, 1980; Bischi and Tramontana, 2010; Özdilek, 2022). The coexistence of multiple attractors necessitates spatial delineation and equilibrium analysis, illustrating path-dependent processes where long-term outcomes depend on initial conditions (Liu and Xiao, 2006; Liu and Xiao, 2007; Blackmore et al., 2001). Such complexities necessitate comprehensive global dynamical modeling analyses, exemplified by the Lotka-Volterra equations, akin to those used by Lorenz (1963) in weather prediction.
Smale (1976) demonstrated how ordinary differential equations describe the dynamics of competing species, supported by Rescigno and Richardson (1967) and May (1973). Gilpin and Feldman (2017) showed how prey evolution in response to predation affects population dynamics, influenced by temporal fitness landscapes. Although natural selection progresses more slowly than population dynamics, demographic shifts triggered by predator invasions or environmental changes can occur swiftly (Hansen et al., 2013; Cortez and Weitz, 2014). Thus, classical prey-predator models must incorporate eco-evolutionary processes (Mougi and Iwasa, 2010). Even simple deterministic two-species models can exhibit unstable cycling and chaotic interactions, as seen in microbial communities following perturbations like pesticide treatment or pathogen colonization (Hol et al., 2016; Remien et al., 2021).
The Lotka-Volterra framework posits that growth rates depend on the quantities of other components. In a fox-rabbit system, for example, the prey consumption rate by predators correlates with prey abundance, influencing fox populations and vice versa. This model assumes a fixed territory and exclusive prey, theoretically allowing indefinite predator growth as prey decline, highlighting an inherent power imbalance (Burch, 2018). Beyond ecology, prey-predator models have explained competitive, cooperative, and predatory strategies in various contexts, including industry growth patterns and resource competition (Bischi and Tramontana, 2010; Dendrinos and Mullally, 1985; Nijkamp and Reggiani, 1992; 1998; Pijush et al., 2021).
The original Lotka-Volterra equations, describing predator-prey dynamics through nonlinear first-order ordinary differential equations and parameters like birth and death rates, can be adapted to complex real-world relationships. By modeling populations competing for common resources such as education, jobs, and housing, these equations can extend to human demographic projections (Lotka, 1925; Volterra, 1926). Although initially rooted in animal population dynamics, careful justification and adaptation enable examining human interactions and resource competition, offering insights into population trends and dynamics.
While few studies have applied Lotka-Volterra models to human populations and socioeconomic contexts, most have not integrated spatial mobility or focused on detailed population forecasting. For instance, Bischi and Lamantia (2002) modeled competition and cooperation among agents in natural resource exploitation without emphasizing spatial aspects. Izquierdo and Hannachi (2018) used Lotka-Volterra equations for urban dynamics, emphasizing complex systems theory but not integrating gravity models or predictive demographic modeling.
The gravity model, extensively employed in migration studies, represents spatial interactions based on population sizes and distances between regions (Wilson, 1970). Although Batty (2005) and Stillwell et al. (2014) highlighted its role in understanding urban growth and internal migration, these applications generally operate independently of dynamic population models. Attempts to combine Lotka-Volterra and spatial interaction models have provided theoretical insights but not a unified framework for practical human population prediction (Wilson, 2006; Wilson, 2008; LeSage and Pace, 2009; Wilson and Dearden, 2011). As a result, existing models, while insightful, do not fully address complexities like population mobility and predictability. Simplified parameters, subjective decision-making, cultural influences, and policy changes remain challenging to incorporate, limiting comprehensive predictive power (Billari and Prskawetz, 2003).
Recent contributions emphasize that fully probabilistic and Bayesian frameworks can rigorously capture uncertainty, moving beyond deterministic trajectories toward probability distributions of future demographic indicators (Keilman, 2018). Such forecasts, as illustrated by Raftery and Ševčíková (2023) and adopted by international agencies, provide predictive intervals clarifying likely outcomes. Similarly, Wiśniowski et al. (2015) enhance the Lee-Carter model with a Bayesian hierarchical approach, generating posterior distributions rather than single estimates. At smaller spatial scales, Wilson et al. (2021) highlight the need for probabilistic techniques to handle volatility and complexity, while Azose et al. (2016) incorporate migration uncertainty so that all major demographic components—fertility, mortality, and migration—are probabilistically modeled.
These Bayesian and probabilistic frameworks excel at uncertainty quantification, relying on statistical and data-driven foundations. By contrast, this study employs a theory-driven, dynamic model integrating Lotka-Volterra equations with a probabilistic gravity concept to capture nonlinear interdependencies and spatial interactions. While the current approach produces interpretable trajectories and equilibrium points, it has yet to provide full probability distributions. Future work could incorporate Bayesian inference for parameter estimation and credible intervals, thereby melding the strong theoretical underpinnings with robust uncertainty quantification, creating a more comprehensive and adaptive forecasting tool.
3 Prey-predator demographic model
The population projection widely uses the Cohort Component Model (CCM). Statistics Canada commonly predicts populations 1 year at a time by extending past trends based on CCM, with slight differences between provinces. The CCM adopts a top-down population estimation at the national level first, followed by subnational projections, producing projections by age and sex (Cameron et al., 2007; Cameron and Poot, 2010; Cameron and Poot, 2011). The CCM’s Equation 1 rests on objective counting of individuals in a population to sequentially build two basic components in recursive form:
where
Traditional demographic methods, such as the CCM, often fail to capture the nonlinear interactions and dynamic spatial dependencies inherent in population movements (Rees and Wilson, 1977; Wilson, 2010). To overcome these limitations, this study employs the Lotka-Volterra prey-predator model, which effectively models competitive and cooperative interactions among populations. The original equations of the Lotka-Volterra model are:
where
The differential Equation 3 describes the dynamics of the predator population. Here,
In the absence of a predator (
Integrating this differential equation, we get the solution:
This Equation 4 describes the exponential growth rate of prey in the absence of predators, leading to an indefinite increase in the prey population (birth process).
For the rate of decline of predators, Equation 3 in the absence of prey (
This Equation 5 describes the exponential decline of predators in the absence of prey (mortality process).
To adapt the Lotka-Volterra model for human demographic applications, we incorporate a carrying capacity condition, as originally proposed by Verhulst (1838), to account for environmental constraints on population growth. As shown in Equation 6, the logistic growth model describes how populations expand in environments with limited resources by incorporating the carrying capacity K, which represents the maximum population size an environment can sustain indefinitely.
Here,
For two prey populations,
where
This model can be generalized for any number of competing species. Representing populations and growth rates as vectors and
When the carrying capacity is fully embedded within the interaction matrix, the resulting system (see Equation 9) modifies the standard expression accordingly:
where
In adapting the Lotka-Volterra model to human demographic contexts, we consider regions as interacting entities whose populations influence one another through migration and other socio-economic factors (Wilson, 2008; Wilson and Dearden, 2011). We present a series of three equations representing two prey regions and one predator region, based on the foundations of the Lotka-Volterra model, with appropriate adjustments to account for the particular dynamics of human population evolution.
Each of the following nonlinear equations represents a specific geographical region.
These equations involve three categories of parameters derived and fine-tuned to reflect intrinsic growth or decline rates, as well as the interaction effects between regions X, Y, and Z.
The first category of computed parameters A, C, and E capture the intrinsic growth and decline rates of populations in regions X, Y, and Z, respectively. These parameters provide a baseline for intrinsic population dynamics within each region, representing how populations would behave under ideal conditions without external influences. They are computed using fixed parameters D, B, and G3, which are based on historical data and experiments. This ensures that the intrinsic growth and decline rates accurately reflect observed trends in each region.
Parameters A and C represent the intrinsic growth rates of prey regions X and Y, respectively, while parameter E reflects the intrinsic decline rate of predator region Z. They are derived using the formulas:
The second category of
The second category includes the fixed parameters D, B, and G3, which represent density-dependent effects within each region’s population. These parameters are fine-tuned experimentally to ensure the model accurately predicts known populations. This process involves iteratively adjusting the values of D, B, and G3 until the model’s predictions closely align with actual population data. Such fine-tuning is essential for the robustness of the model in predicting future populations. Specifically, parameter D represents the density-dependent factor for the population in region X, where higher values indicate stronger regulation, slowing growth as it nears carrying capacity. Parameter BBB affects region Y in a similar manner, while parameter G3 pertains to region Z, where increased values accelerate population decline as it approaches carrying capacity.
The third category of interaction parameters G, G1, G4, G2, F, and G5 captures the dynamic interdependencies between the populations of regions X, Y, and Z. These parameters quantify how population changes in one region influence the others and are derived using the annual growth rate (AC) values of the respective regions, scaled by an adjusted gravity constant. By incorporating these AC values, the model accurately reflects the probabilistic and dynamic nature of population interactions. For instance, G and G1 capture the effects of region X on regions Z and Y, respectively, while G2 and G4 reflect the reciprocal influences between regions Y and X, and Y and Z. Similarly, F and G5 measure the impact of region Z on regions X and Y. Integrating these parameters into the adapted Lotka-Volterra equations ensures the model accurately simulates and predicts future population changes, providing a robust framework for understanding complex population dynamics and inter-regional influences.
The interaction parameters in the above triadic Equation 10 are calculated based on Newton’s formula. The gravity model in population dynamics is adapted from Newton’s law of gravity, where the force between two masses is proportional to their sizes and inversely proportional to the distance between them. In classical physics, Newton’s law of gravity states:
The interaction parameters in the above triadic Equation 10 are calculated based on Newton’s formula. The gravity model in population dynamics is adapted from Newton’s law of gravity, where the force between two masses is proportional to their sizes and inversely proportional to the square of the distance between them. In classical physics, Newton’s law of gravity is given by Equation 11, which states:
where
Recognizing the limitations of the traditional gravity model, Wilson (1970), Wilson (2010) introduced an entropy-maximizing approach to spatial interaction, providing a theoretical foundation that extends the gravity model by incorporating principles from statistical mechanics. Wilson’s gravity model for interregional flows can be written as Equation 12:
where:
•
•
•
•
• The denominator
Wilson’s model emphasizes that the interaction between regions depends not only on their masses (analogous to population sizes) and distances but also on the distribution of opportunities and the constraints of the system, ensuring that the flows are consistent with an entropy-maximizing principle.
In our approach, we adapt the gravity model to more accurately represent regional population interactions by ensuring that derived parameters closely reflect observed population dynamics. Unlike Wilson’s entropy-maximizing model, which determines the most probable distribution of flows under specific constraints, our model introduces three significant modifications to the classical gravity model. Additionally, we integrate the enhanced gravity model within the Lotka-Volterra framework, thereby improving its realism and applicability for population forecasting.
First, we replace the gravitational constant K with a probabilistic gravity weight Grv, reflecting the relative population sizes of the interacting regions. This change makes the model more dynamic and reflective of real-world population interactions, where the influence between regions is not static but varies with their population proportions.
Here,
Second, to simplify computations, we set
Third, instead of using the product of the masses
• Annual growth rates account for temporal changes, reflecting current demographic trends rather than static population sizes. This aligns with the dynamic interactions in the Lotka-Volterra equations.
• Using growth rates incorporates the probabilistic nature of population changes, essential for refined and accurate population forecasting.
• It allows differentiation between regions based on growth potential, acknowledging that smaller but faster-growing regions can have significant influence.
The annual growth rates are calculated as:
where
As illustrated by Equation 15, the interaction of two regions is the product of their AC and
Here, G refers to the probabilistic rate of attraction (or repulsion) between two regions
To accurately estimate the parameters of the model and predict population dynamics, we employed an optimization process using Python programming. Specifically, we utilized the fsolve function from the scipy. optimize library to solve the dynamical system of equations. This function iteratively adjusts the values of X, Y, and Z to find the roots of the equations, effectively identifying the equilibrium points where the growth rates of the populations balance out. The optimization involves adjusting the parameters iteratively to minimize the error between the model’s predictions and observed data.
While acknowledging the substantial contributions of Wilson (1970), Wilson (2010) and others to spatial interaction models, this study diverges from traditional gravity-based frameworks by embedding them within a dynamic, probabilistic context. Earlier approaches often relied on static parameters and did not fully account for the nonlinear feedback mechanisms and evolving spatial interactions that characterize human population dynamics. By contrast, our method integrates a modified gravity model with Lotka-Volterra equations, incorporating probabilistic weights, dynamic growth rates, and carrying capacities. This unified framework captures the complexities of population mobility and interdependencies among regions, thereby offering a robust and forward-looking tool for demographic forecasting.
This innovative integration bridges the gap between ecological modeling and spatial interaction theories. Unlike previous theoretical studies that treated Lotka-Volterra or gravity models in isolation, we combine their strengths to produce more accurate and realistic predictions of population trends. The resulting model can simulate competitive and cooperative interactions among three regions and predict their movement toward an equilibrium state. Although extending the model to more regions is possible, it would introduce significant analytical complexity. For now, focusing on three regions provides a balanced, interpretable demonstration of the model’s capabilities.
By enabling not only population predictions but also the evaluation of equilibrium states, our approach increases both the robustness and comprehensiveness of demographic analysis. This improved representation of complex population behaviors supports more effective strategic urban and regional planning (Echenique, 1994). Going beyond static or deterministic perspectives, future developments could incorporate Bayesian inference to estimate parameters and yield probability distributions, further enhancing uncertainty quantification. In doing so, the model stands to advance the field of demographic forecasting and contribute valuable insights for policymakers and planners engaged in shaping sustainable demographic futures.
While this study’s primary innovation lies in adapting the Lotka-Volterra framework with a probabilistic gravity-based approach to better capture human population dynamics, future refinements could benefit from incorporating Bayesian inference as suggested by Wilson et al. (2021) and Raftery and Ševčíková (2023). Rather than altering the model’s foundational theoretical perspective, Bayesian methods would complement and refine its parameters, providing probability distributions and predictive intervals that more accurately reflect uncertainty and variability in demographic processes. By combining this strong theoretical core with advanced probabilistic inference, the model could achieve greater robustness and adaptability, offering a more nuanced and uncertainty-aware perspective on regional population forecasting.
4 Data and results
In this section, we present a demonstration of population prediction based on the Lotka-Volterra differential equations. For this demonstration, we use data from the Insured Persons Registration File (IPRF) of the Health Insurance Authority of Quebec, collected and publicly shared by the Statistical Institute of Quebec. Our model utilizes population data incremented annually between 2021 and 2023 for regions X, Y, and Z, serving as the baseline for future population estimates. Additionally, we incorporate data on interregional migration, organized by age groups, to capture nuanced mobility patterns.
Our model is grounded in established theories from ecological modeling and spatial interaction, previously tested in various contexts (Wilson, 2008; Wilson and Dearden, 2011). We validated our model by comparing the predicted populations for 2021 to 2023 with actual historical data (Statistics Canada, 2023). The close alignment between predictions and observed values confirms the model’s accuracy and reliability. Detailed comparisons are provided in Table 2 and discussed below.
The analysis of Table 1 highlights specific regional gains and losses in 2021. For instance, Montreal experienced a population loss of 63,615, about 31% of all provincial outgoing movements. Of these, 41,633 people moved to its immediate periphery, represented by western regions including Laval, Lanaudière, and Montérégie. The central regions received 14,126 people, with Laurentides standing out, followed by Estrie and Mauricie. Another 4,836 moved eastward, concentrated around the Quebec City metropolitan area, with Outaouais receiving 1,340 people.
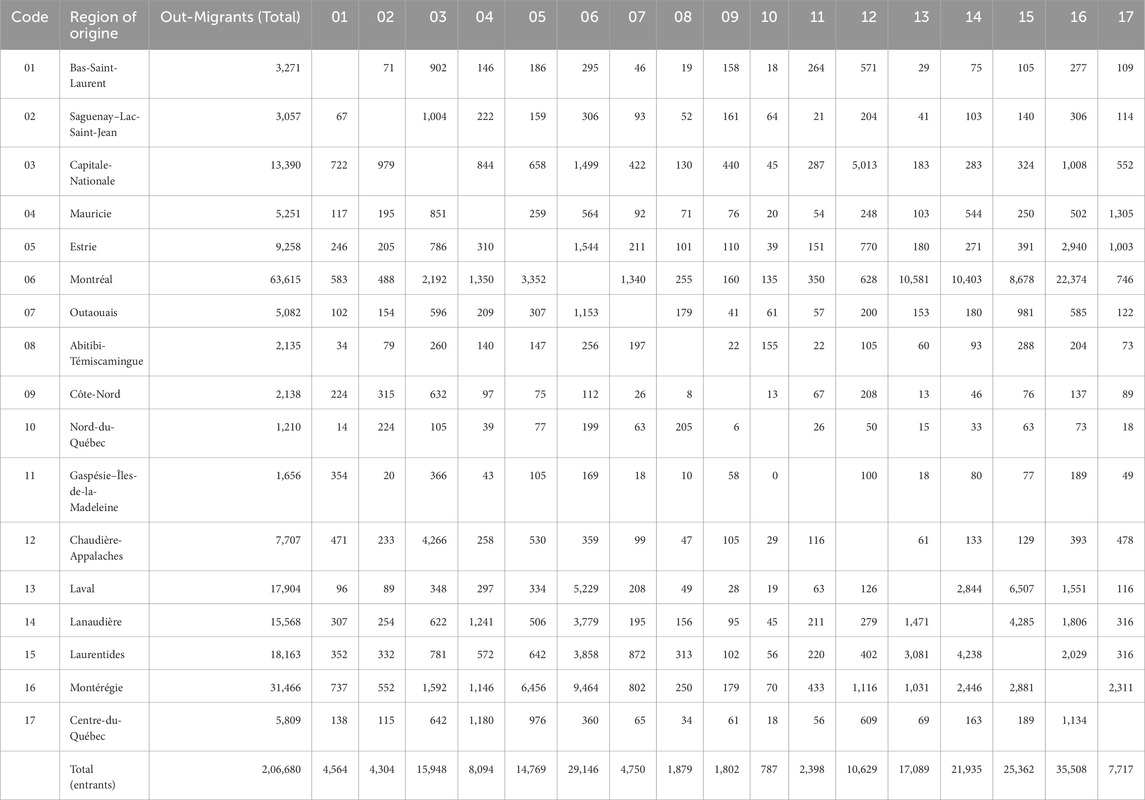
Table 1. Net interregional immigration in administrative regions of Quebec in 2021.
Conversely, Montreal gained 29,146 interregional immigrants in the same year, resulting in a net loss of 34,469 people. Specifically, 18,551 of these immigrants came from adjacent western cities. This figure, less than half of what Montreal lost, indicates the central area of Montreal is notably extending towards its peripheral crown. Immigration to the central region where Montreal is situated included 6,247 individuals from the central region and 2,939 from the eastern region.
Interprovincial migration trends since the 1960s indicate that Quebec has traditionally lost population to other provinces (Statistics Canada, 2010; Statistics Canada, 2013). However, over the past decade, this outflow has significantly slowed, nearly neutralizing the net balance. Data from the Ministry of Immigration and Cultural Communities show a consistent increase in net international migration to Quebec (Statistics Canada, 2023). Both interprovincial and international migration levels have remained relatively stable, often cancelling each other out. In contrast, interregional movements within Quebec strongly influence its population dynamics. Our forecasting model thus focuses on interregional mobility among the province’s 17 administrative regions.
As shown in Figure 1, to manage the complexity of multiple equations and enhance analytical clarity, we grouped the data into three main geographical divisions: the Montreal Metropolitan Region (RMR Montreal), the Quebec Metropolitan Region (RMR Quebec), and the Rest of the Province. These divisions are based on historical development, geographical proximity, and socio-economic similarities, providing a streamlined and insightful analysis. Among these three regions, RMR Montreal is considered the predator (Region West or Z), while the other two are considered prey (Region Center or X and Region East or Y). As indicated previously, unique conditions are integrated into each differential equation for these groupings.
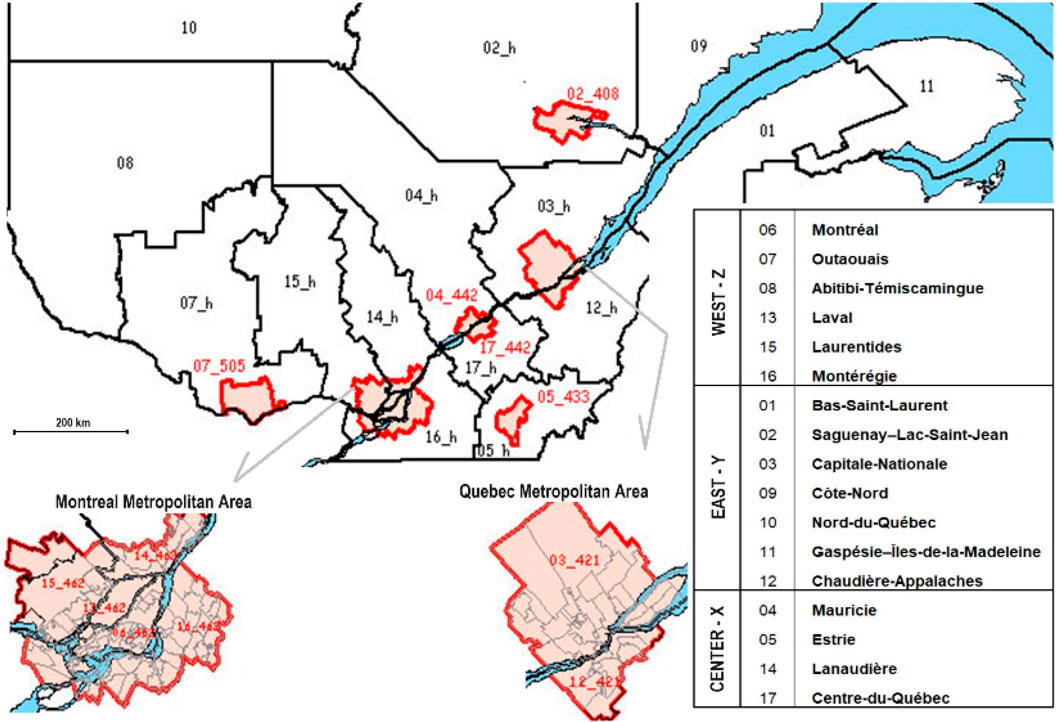
Figure 1. Administrative region clustering in Quebec province.
We used Python software to codify parameters and conduct simulations to estimate the populations for regions X, Y, and Z for the years 2021–2023, as well as for projections from 2024 to 2053. Table 2 provides a summary of these results, including their evolutive parameter estimates, existing populations, and projected populations. The model predicts the population dynamics of regions X, Y, and Z over 30 years using the Lotka-Volterra equations and the estimated parameters based on the gravity model. The predicted populations are compared with known historical data to validate the model. The close alignment of predictions with known data indicates the model’s accuracy and robustness. This validation process ensures that the model reliably captures the population dynamics and interactions.
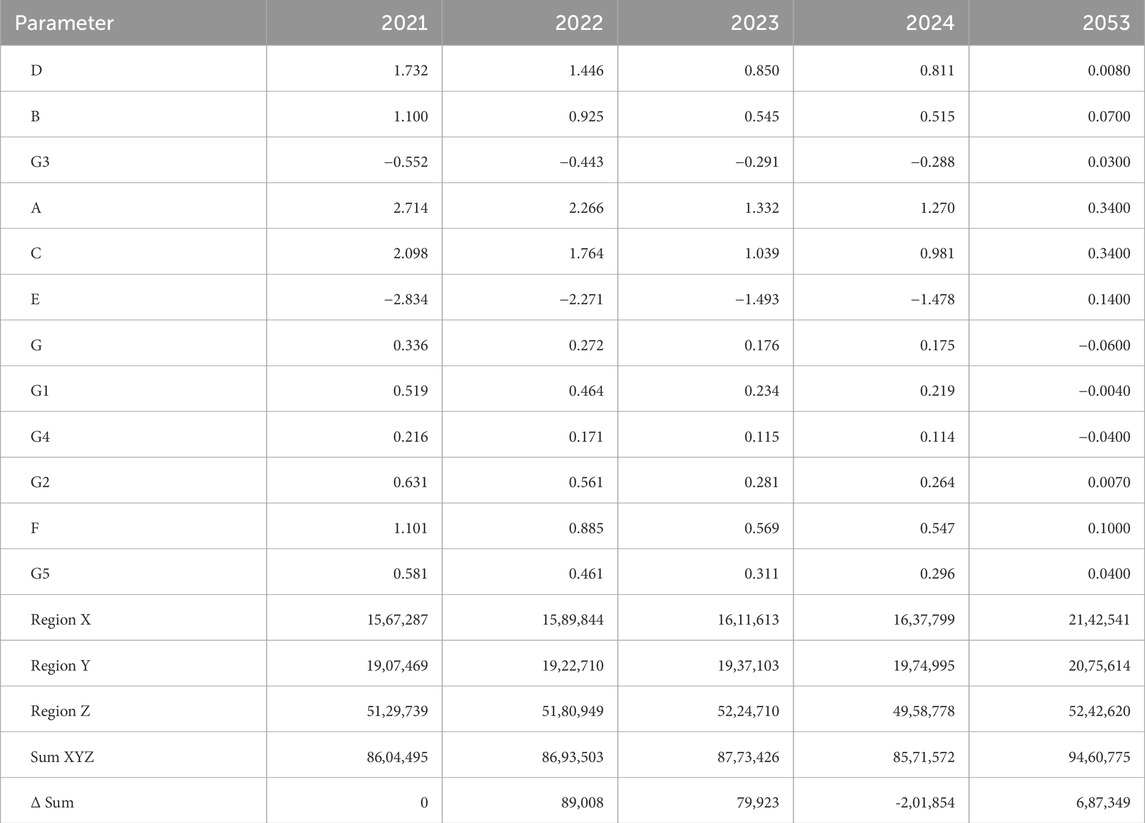
Table 2. Parameter and population estimates.
Also, with the increased population values in 2022 (reported on the populations of 2021 as initial values for 2022), parameters D, B, G3 and A, C, and E are recomputed. This allows us to predict known populations for 2021, 2022, and 2023 and derive all parameters and their trends over time. This iterative process of population and parameter forecasts continues yearly from 2024 to 2053.
The analysis of parameter trends provides a detailed understanding of population growth patterns across Quebec’s regions, indicating stabilization in growth rates and reduced intra-species competition. Table 2 presents the parameter values utilized in the model, along with their derivation and calibration, ensuring transparency and replicability. The results, supported by the data and graphics, highlight distinct population trends for regions X, Y, and Z from 2021 to 2053. For example, Region X is projected to grow from 1,611,613 in 2023 to 2,142,541 by 2053, with an average annual increase of approximately 17,698 individuals. This projection is consistent with historical growth trends for the region, which benefits from its strategic location between Montreal and Quebec City, attracting population influx due to its geographic and socio-economic advantages.
Region Y, encompassing the eastern part of the province, demonstrates a more modest increase in population. From 2023 to 2053, the population is projected to grow from 1,937,103 to 2,075,614 in Region Y, translating to an average annual increase of 4,617 individuals. Despite significant increases in previous years, the projection indicates stabilization in population growth, reflecting historical out-migration patterns where younger populations relocate to central and western regions.
Region Z, including the metropolitan area of Montreal, Laval, and Longueuil, shows an almost negligible increase in population from 5,224,710 in 2023 to 5,242,620 in 2053, with an average annual increase of 597 individuals. The decreasing growth trend for Region Z suggests that the population of the Montreal metropolitan area is gradually dispersing to peripheral regions, particularly to Region X, which offers better socio-environmental quality, less density and congestion, and more affordable living conditions (for instance, lower rents, housing prices, and taxes).
The analysis of population and parameter estimates provides a comprehensive understanding of their dynamic growth patterns in Quebec’s regions. Region X shows the most substantial growth, reflecting its strategic geographical location and socio-economic opportunities. Region Y demonstrates a stabilizing trend, indicating minimal growth due to out-migration. Region Z sees its population almost unchanged, potentially due to its population being drawn to peripheral regions. Graphic 1A corroborates these findings, showing convergence towards equilibrium points. This comprehensive analysis underscores the robustness of the Lotka-Volterra model in capturing complex population dynamics and providing reliable predictions for future population trends.

Graphic 1. (A) Population Predictions for Regions X, Y, Z, and Total (2021-2053). (B) Population Growth Scenarios for Quebec (2016-2066).
In comparison to our approach, the Cohort Component Model (CCM) results in Graphic 1B predict three different population growth scenarios for Quebec until 2056 (ISQ, 2019). The reference scenario projects the population to reach 9.9 million by 2056, with other scenarios estimating a range between 7.8 million (weak scenario) and 12 million (strong scenario). In comparison, our model, which incorporates Lotka-Volterra equations integrated with a probabilistic gravity model, predicts a total population of approximately 9.5 million by 2053. Both models show a growing trend, indicating that Quebec’s population is expected to increase in the coming decades. The similarity in trends between the two models demonstrates the robustness of our approach, which considers interactions and competition between regions, providing a more dynamic and nuanced prediction compared to the classic CCM approach. The additional insights from the ISQ (2013); ISQ (2019) study using the CCM approach highlight factors such as fertility, migration, and natural increase, which are also implicitly captured in our model through the interaction parameters and regional dynamics.
We have thoroughly defined and explained the parameters in the model specification section, including parameters such as A, C, E, D, B, and G3, along with interaction parameters like G, G1, and G2. These parameters form the foundation for the analysis of population growth trends in Quebec’s regions, and their detailed values are presented in Table 2. The analysis of these parameter trends suggests a shift from competitive to cooperative interactions over time, leading to stabilized growth rates and reduced intra-species competition. The results, as specified in Table 2 and further illustrated in the graphics, provide a comprehensive view of these population dynamics across several years, as projected by the Lotka-Volterra model.
The parameters D, B, and G3 show a general decline from 2021 to 2053. Specifically, D decreases from 1.732 in 2021 to 0.0080 in 2053, indicating a diminishing rate of intra-species competition or density-dependent effects within the populations. The parameter B, which relates to the intrinsic growth rate, also declines from 1.100 to 0.0700, suggesting a reduction in the natural growth rate over time. The parameter G3, representing inter-species interactions, transitions from a negative value (−0.552) to a slightly positive one (0.0300), implying a shift from competitive to more neutral or even cooperative interactions among the regions.
Parameters A, C, and E exhibit significant variability, with A and C decreasing and stabilizing around 0.3400 by 2053, while E shows a sharp reduction from −2.834 to 0.1400. This reflects changes in external factors such as immigration and economic influences affecting the growth dynamics of the regions.
The parameters G, G1, G4, G2, F, and G5 also show a decreasing trend, stabilizing towards the end of the period. This indicates that the inter-regional interaction coefficients are becoming less influential over time, possibly due to a more balanced distribution of population and resources among the regions.
The evolution of these parameters underscores the dynamic nature of population interactions and the gradual stabilization of regions. Over time, the parameters begin to stabilize, showing lesser variability, which implies that the model has reached a more robust and steady-state configuration. Parameters transitioning from positive to negative or approaching zero suggest a shift from strong interactions to more neutral or independent behaviors among regions. The fact that the parameters tend to linearize and stabilize suggests that the model’s predictive power is becoming more reliable as it adjusts to the underlying population dynamics. This comprehensive analysis provides valuable insights into the long-term behavior and stability of the population dynamics model, demonstrating how inter-regional interactions evolve over time and impact overall population predictions.
The three graphics collectively provide a comprehensive picture of the parameter estimates and population predictions over time for the XYZ regions. Graphic 2A illustrates the stabilization of parameter values over time, indicating reduced dynamic interactions and suggesting the system governed by the Lotka-Volterra model is reaching a quasi-equilibrium state. The lines representing the parameters converge and stabilize, reflecting the long-term balance achieved through inter-regional interactions and internal growth constraints.
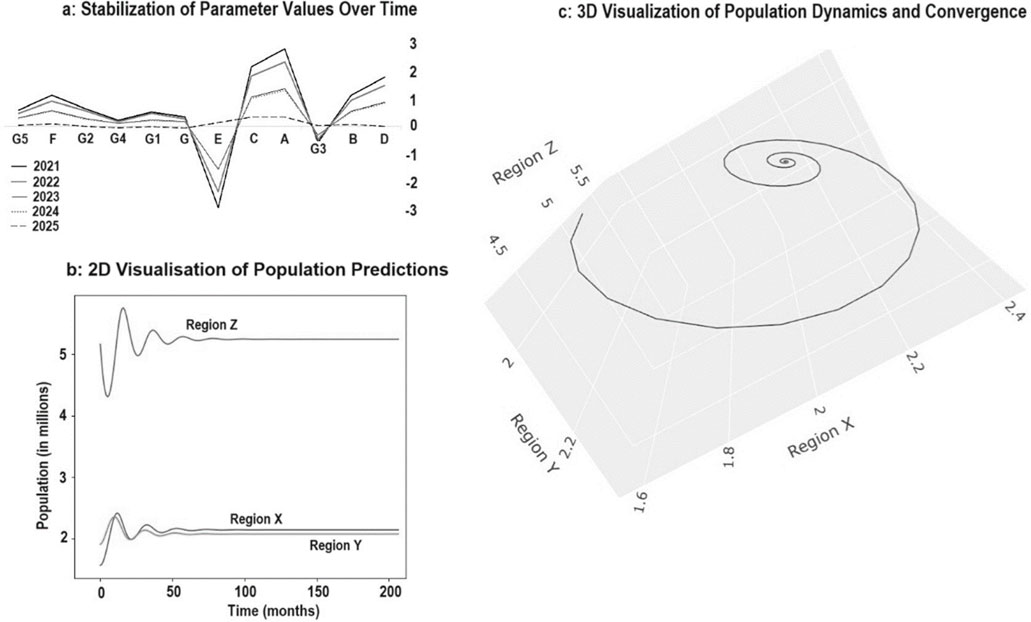
Graphic 2. (A) Stabilization of Parameter Values Over Time. (B) 2D Visualisation of Population Predictions. (C) 3D Visualization of Population Dynamics and Convergence.
Graphic 2B shows the population predictions for regions X, Y, and Z, with each region trending towards stabilization. Region Z, which initially shows significant fluctuations, eventually stabilizes. Regions X and Y also show trends towards stabilization, albeit at different rates. The total population curve exhibits a consistent growth trend, reflecting the stable and converging estimates over the long term. This stability can be attributed to the stabilization of parameter estimates, providing more consistent and reliable inputs into the Lotka-Volterra equations.
Graphic 2C presents a 3D view of the population predictions, showing how populations in regions X, Y, and Z evolve and converge over time. The spiraling behavior towards a central point indicates that the populations are interacting and adjusting to reach a stable equilibrium point by 2053. The result obtained in 3D clearly shows the convergence of X, Y, and Z from the wider periphery towards the center, reaching an equilibrium point, as evidenced by the spiral behavior observed. This convergence point is known as the equilibrium or prediction point, with values of 2.14 million for X, 2.07 million for Y, and 5.24 million for Z in 2053.
The convergence point estimate in 2053 underscores the robustness and validity of our model, effectively capturing the interdependencies and interactions between regions. It demonstrates that the populations of the three regions are not just stabilizing independently but are also interacting in a manner that leads to a collective equilibrium at the provincial scale. The model’s robust predictions highlight its ability to reflect complex population dynamics and accurately forecast long-term population trends. This interaction and convergence are driven by the probabilistic nature of the gravity model, which accounts for the relative attractiveness and repulsiveness of each region, resulting in a balanced and dynamic interaction.
By integrating advanced spatial interaction modeling techniques with the adapted Lotka-Volterra framework, our approach provides a robust and theoretically sound basis for predicting human population dynamics. It effectively addresses the complexities of migration patterns and spatial interactions through an improved probabilistic gravity model. The predictions from this unified approach closely align with observed data, confirming both its reliability and applicability to demographic forecasting. For instance, the predicted population for Region X in 2023 was within 1% of the actual recorded population, with similarly high accuracy observed for Regions Y and Z. This calibration not only validates the model’s theoretical assumptions but also ensures its practical utility for long-term population projections by accurately reflecting observed trends.
The convergence point itself is a conclusive and highly satisfactory result, as it could have diverged towards non-equilibrium points, yielding abstract and unrealistic outcomes. The equilibrium shows a “demographic attractive point” towards which the system evolves, similar to other complex systems like the Lorenz (1963) attractor arising in a system of dynamic equations under other types of forces (temperature difference, gravity, buoyancy, kinematic viscosity, etc.). That point can be located in space as an epicenter in Quebec province in 2053, allowing planners and policymakers to take strategic decisions on resource planning and sharing.
5 Conclusion
Accurate demographic forecasting is essential for strategic urban planning and effective resource allocation, particularly in regions characterized by complex, nonlinear population dynamics shaped by socioeconomic factors and spatial interactions. Traditional methods, such as the Cohort Component Model (CCM), tend to rely on linear projections, which often fail to capture the intricate interdependencies driving population fluctuations.
To address these limitations, this study presents an innovative approach that integrates the Lotka-Volterra prey-predator model—originally designed for ecological interactions—and adapts it for human demographic forecasting, thus providing the theoretical and conceptual foundations often lacking in traditional analyses. This adaptation is further strengthened by incorporating a rigorously specified probabilistic gravity model, uniquely embedded within the Lotka-Volterra framework. By merging these approaches, we account for both competitive and cooperative dynamics shaping population growth, as well as the spatial mobility between regions.
The application of the Lotka-Volterra model to human demographic contexts enables a detailed representation of nonlinear population dynamics and predictions. By incorporating a modified gravity model—rooted in spatial interaction theories—this study considers migration flows governed by geographic proximity and socioeconomic attractiveness, offering a more refined approach to understanding population mobility. This integrated framework extends the existing literature in spatial interaction and urban systems modeling, providing a more comprehensive method for predicting regional population changes.
The model’s robustness and predictive accuracy are supported by empirical findings. The close alignment between predicted and observed population trends from 2021 to 2023, including a prediction error of less than 1% for Region X in 2023, attests to its reliability. Similarly high accuracy levels were observed for Regions Y and Z. These results confirm that the model effectively captures the complex dynamics driving population changes in Quebec. The observed shift from competitive to cooperative interactions in the parameter trends suggests stabilizing growth rates and regional equilibrium—a hallmark of the Lotka-Volterra framework—highlighting its applicability to demographic forecasting.
Although this study focuses on three regional clusters in Quebec, its theoretical and practical foundations are transferable to other geographic contexts. By extending the Lotka-Volterra model beyond its ecological roots and integrating it with the gravity model, this flexible framework offers a valuable tool for analyzing regional population dynamics in diverse settings. The methodology provides actionable insights for strategic planning, addressing the shortcomings of traditional models and delivering more accurate, long-term projections of population changes. By combining the Lotka-Volterra and gravity models, this approach yields more realistic predictions of population trends and spatial interactions.
The findings also highlight the model’s ability to identify distinct population growth trends across regions: Region X is projected to experience significant growth, driven by its strategic location and socioeconomic opportunities; Region Y shows more modest growth, influenced by historical out-migration; and Region Z, encompassing the Montreal metropolitan area, exhibits minimal growth, reflecting population dispersal to peripheral areas. These trends underscore the model’s ability to capture interregional interactions and offer critical insights for policymakers and urban planners, who can use these predictions to inform infrastructure development, resource allocation, and regional development strategies.
As with any complex model, there are opportunities for further refinement. Incorporating additional variables, such as economic indicators, policy changes, and more nuanced measures of distance, could further enhance predictive accuracy. Moreover, integrating micro-level dynamics, such as individual decision-making and migration motivations, may improve the granularity of future forecasts. Exploring advanced computational techniques, like agent-based modeling or machine learning, could also increase the model’s adaptability and precision, responding effectively to shifting demographic and socioeconomic conditions. These advancements contribute to more sustainable urban and regional development strategies, underscoring the importance of innovative approaches in meeting the challenges of modern demographic forecasting.
Looking ahead, while the current integration of Lotka-Volterra dynamics with a probabilistic gravity model provides a theoretically grounded, equilibrium-oriented forecasting framework, it also suggests new avenues for refinement. At present, the model’s predictive capacity relies on systematically adjusted parameters and conditions guiding it toward realistic equilibria. Future research could incorporate explicit probabilistic methods—such as Bayesian inference—to better represent uncertainties in parameters and evolving socioeconomic landscapes. Additionally, exploring complementary methodologies, including entropy-based measures, could enrich analytical depth. Rather than replacing the model’s core theoretical insights, these enhancements would refine its ability to accommodate variability and change over time, ultimately offering a richer understanding of complex demographic processes and enabling more adaptable, regional planning–relevant forecasting.
Data availability statement
The original contributions presented in the study are included in the article/supplementary material, further inquiries can be directed to the corresponding author.
Author contributions
ÜÖ: Conceptualization, Data curation, Formal Analysis, Funding acquisition, Investigation, Methodology, Project administration, Resources, Software, Supervision, Validation, Visualization, Writing–original draft, Writing–review and editing.
Funding
The author(s) declare that no financial support was received for the research, authorship, and/or publication of this article.
Conflict of interest
The author declares that the research was conducted in the absence of any commercial or financial relationships that could be construed as a potential conflict of interest.
Publisher’s note
All claims expressed in this article are solely those of the authors and do not necessarily represent those of their affiliated organizations, or those of the publisher, the editors and the reviewers. Any product that may be evaluated in this article, or claim that may be made by its manufacturer, is not guaranteed or endorsed by the publisher.
References
Abel, G., Bijak, J., Forster, J., Raymer, J., Smith, P., and Wong, J. (2013). Integrating uncertainty in time series population forecasts: an illustration using a simple projection model. Demogr. Res. 29 (43), 1187–1226. doi:10.4054/demres.2013.29.43
Abel, G. J., and Sander, N. (2014). Quantifying global international migration flows. Science 343 (6178), 1520–1522. doi:10.1126/science.1248676
Aksoy, Y., Basso, H. S., Smith, R. P., and Grasl, T. (2019). Demographic structure and macroeconomic trends. Am. Econ. J. Macroecon. 11 (1), 193–222. doi:10.1257/mac.20170114
Alonso, W. (1960). A theory of the urban land market. Pap. Proc. Regional Sci. Assoc. 6, 149–157. doi:10.1111/j.1435-5597.1960.tb01710.x
Anderson, J. E. (2011). The gravity model. Annu. Rev. Econ. 3, 133–160. doi:10.1146/annurev-economics-111809-125114
Archambault, R. (1999). Nouvelle méthode de projection des parts professionnelle du SPPC. Développement Des. Ressources Hum. Can.
Azose, J. J., Ševčíková, H., and Raftery, A. E. (2016). Probabilistic population projections with migration uncertainty. Proc. Natl. Acad. Sci. 113 (23), 6460–6465. doi:10.1073/pnas.1606119113
Batten, D. F., and Boyce, D. E. (1987). Spatial interaction, transportation, and interregional commodity flow models. Handb. Regional Urban Econ. 1, 357–406.
Batty, M. (2005). Cities and complexity: understanding cities with cellular automata, agent-based models, and fractals. MIT Press.
Beine, M., Bertoli, S., and Fernández-Huertas Moraga, J. (2016). A practitioners’ guide to gravity models of international migration. World Econ. 39 (4), 496–512. doi:10.1111/twec.12265
Bernard, A., Bell, M., and Charles-Edwards, E. (2016). Improved measures for the cross-national comparison of age profiles of internal migration. Popul. Stud. 70 (2), 191–209. doi:10.1080/00324728.2016.1142759
Biagi, B., Faggian, A., and McCann, P. (2011). Long and short distance migration in Italy: the role of economic, social and environmental characteristics. Spat. Econ. Anal. 6 (1), 111–131. doi:10.1080/17421772.2010.540035
Billari, F., and Prskawetz, A. (2003). Agent-based computational demography: using simulation to improve our understanding of demographic behaviour. Heidelberg: Physica-Verlag.
Bischi, G. I., Gardini, L., and Kopel, M. (2000). Analysis of global bifurcations in a market share attraction model. J. Econ. Dyn. Control 24, 855–879. doi:10.1016/s0165-1889(99)00028-7
Bischi, G. I., and Lamantia, F. (2002). Competition and cooperation in natural resource exploitation: an evolutionary game approach. Int. Game Theory Rev. 4 (2), 143–159. doi:10.1142/S0219198902000591
Bischi, G. I., and Tramontana, F. (2010). Three-dimensional discrete-time Lotka–Volterra models with an application to industrial clusters. Commun. Nonlinear Sci. Numer. Simul. 15, 3000–3014. doi:10.1016/j.cnsns.2009.10.021
Biswas, T., McHardy, J., and Nolan, M. A. (2009). Inter-regional migration: the UK experience. Sheffield, United Kingdom: Department of Economics, University of Sheffield. Working Paper.
Blackmore, D., Chen, J., Perez, J., and Savescu, M. (2001). Dynamical properties of discrete Lotka–Volterra equations. Chaos, Solit. and Fractals 12, 2553–2568. doi:10.1016/s0960-0779(00)00214-9
Bloom, D., Canning, D., Fink, G., and Finlay, J. (2009). Fertility, female labor force participation, and the demographic dividend. J. Econ. Growth 14 (2), 79–101. doi:10.1007/s10887-009-9039-9
Bomze, I. M. (1995). Lotka-Volterra equation and replicator dynamics: new issues in classification. Biol. Cybern. 72 (5), 447–453. doi:10.1007/s004220050147
Bryant, J., and Zhang, J. L. (2019). Bayesian demographic estimation and forecasting. Boca Raton, FL: CRC Press/Taylor and Francis.
Burch, T. K. (2002). Demography in a new key: a theory of population theory. Demogr. Res. 6, 75–92. doi:10.4054/DemRes.2002.6.5
Burch, T. K. (2018). “The cohort-component population projection: a strange attractor for demographers,” in Model-based demography (Springer), 155–168. doi:10.1007/978-3-319-65433-1_10
Burton, J., Nandi, A., and Platt, L. (2010). Measuring ethnicity: challenges and opportunities for survey research. Ethn. Racial Stud. 33 (8), 1332–1349. doi:10.1080/01419870903527801
Cameron, M. P., Cochrane, W., and Poot, J. (2007). “End-user informed demographic projections for Hamilton up to 2041,” in Population studies centre discussion paper No. 66. Hamilton, New Zealand: University of Waikato.
Cameron, M. P., and Poot, J. (2010). “A stochastic sub-national population projection methodology with an application to the waikato region of New Zealand,” in Population studies centre discussion paper No. 70. Hamilton, New Zealand: University of Waikato.
Cameron, M. P., and Poot, J. (2011). Lessons from stochastic small-area population projections: the case of Waikato subregions in New Zealand. J. Popul. Res. 28 (2-3), 245–265. doi:10.1007/s12546-011-9056-3
Champion, T., and Fielding, A. (1992). Migration processes and patterns: research progress and prospects. London, United Kingdom: Belhaven Press.
Chi, G. (2009). Can knowledge improve population forecasts at subcounty levels? Demography 46, 405–427. doi:10.1353/dem.0.0059
Cockshott, W. P., and Cottrell, A. F. (2009). Classical econophysics. Abingdon, United Kingdom: Routledge.
Cooke, P., and Leydesdorff, L. (2006). Regional development in the knowledge-based economy: the construction of advantage. J. Technol. Transf. 31, 5–15. doi:10.1007/s10961-005-5009-3
Cortez, M. H., and Weitz, J. S. (2014). Coevolution can reverse predator-prey cycles. Proceeding Natl. Acad. Sci. U. S. A. 111 (20), 7486–7491. doi:10.1073/pnas.1317693111
Courgeau, D. (2012). Probability and social science: methodological relationships between the two approaches. Springer.
Courgeau, D., Bijak, J., Franck, R., and Silverman, E. (2017a). “Model-based demography: towards a research agenda,” in Agent-based modelling and population studies. Editors A. Grow, and J. Van Bavel (Springer), 29–51.
Courgeau, D., Burch, T. K., and Franck, R. (2017b). The Methodos Project: contributions to the methodology of the social sciences. Methodos Ser. 8.
Curry, L. (1972). A spatial analysis of gravity flows. Reg. Stud. 6 (2), 131–147. doi:10.1080/09595237200185141
Davis, K. F., D’Odorico, P., Laio, F., and Ridolfi, L. (2013). Global spatio-temporal patterns in human migration: a complex network perspective. PLoS ONE 8 (1), e53723. doi:10.1371/journal.pone.0053723
Dendrinos, D. S., and Mullally, H. (1985). Urban evolution: studies in the mathematical ecology of cities. Oxford University Press.
Deng, X., Guo, M., and Liu, Y. (2023). Digital economy development and the urban-rural income gap: evidence from Chinese cities. PLoS ONE 18 (2), e0280225. doi:10.1371/journal.pone.0280225
de Valk, H. A. G., Grow, A., van Bavel, J., Sobotka, T., Bijak, J., Courgeau, D., et al. (2022). “How to predict future migration: different methods explained and compared,” in Introduction to migration studies. Editor P. Scholten (Cham: Springer), 583–599. doi:10.1007/978-3-030-92377-8_28
Doran, J. E. (2000). “Trajectories to complexity in artificial societies,” in Dynamics in human and primate societies. Editors A. Kohler, and G. Gumerman (Oxford University Press).
Dunn, K. (2006). Estimation et prévision des flux de retraites globaux sur le marché du travail canadien. Ressources Humaines Développement Soc. Can.
Echenique, M. H. (1994). Urban and regional studies at the Martin Centre: its origins, its present, its future. Environ. Plan. B Plan. Des. 21, 517–533. doi:10.1068/b210517
Ellam, L., Girolami, M., Pavliotis, G., and Wilson, A. (2018). Stochastic modelling of urban structure. Proc. R. Soc. A 474, 20170700. doi:10.1098/rspa.2017.0700
Fik, T. J., and Mulligan, G. F. (1998). Functional form and spatial interaction models. Environ. Plan. A 30 (8), 1497–1507. doi:10.1068/a301497
Fotheringham, A. S. (1981). Spatial structure and distance-decay parameters. Ann. Assoc. Am. Geogr. 71 (3), 425–436. doi:10.1111/j.1467-8306.1981.tb01367.x
Franck, R. (2002). The explanatory power of models: bridging the gap between empirical and theoretical research in the social sciences. Springer.
Gilpin, W., and Feldman, M. W. (2017). A phase transition induces chaos in a predator-prey ecosystem with a dynamic fitness landscape. PLoS Comput. Biol. 13 (7), e1005644. doi:10.1371/journal.pcbi.1005644
Gopal, S. (2006). “Artificial neural networks: a new approach to modelling interregional telecommunication flows,” in Spatial analysis and GeoComputation: selected essays. Editor M. M. Fischer (Springer), 103–128.
Grant, J. (2002). Mixed use in theory and practice:Canadian Experience with Implementing a planning principle. J. Am. Plan. Assoc. 68 (1), 71–84. doi:10.1080/01944360208977192
Green, A. G., and Green, D. (2004). The goals of Canada's immigration policy: a historical perspective. Can. J. Urban Res. 13 (1), 102–139.
Greenwood, M. J. (1997). “Chapter 12 Internal migration in developed countries,”. Handbook of population and family economics. Editors M. R. Rosenzweig, and O. Stark (Elsevier), 1, 647–720. doi:10.1016/s1574-003x(97)80004-9
Guillot, M. (2011). “Period versus cohort life expectancy,” in International handbook of adult mortality. Editors R. G. Rogers, and E. M. Crimmins (Springer), 241–256.
Hansen, A. L., Staver, A. C., and Levin, S. A. (2013). Partial plant migration at the forest–grassland ecotone: the role of demographic stochasticity and fire in a dynamic landscape. Am. Nat. 181 (3), 000. doi:10.1086/669151
Harris, C. D., and Ullman, E. L. (1945). The nature of cities. Ann. Am. Acad. Political Soc. Sci. 242 (1), 7–17. doi:10.1177/000271624524200103
Hofbauer, J., and Sigmund, K. (1998). Evolutionary games and population dynamics. Cambridge University Press.
Hol, F. J., Rotem, O., Jurkevitch, E., Dekker, C., and Koster, D. A. (2016). Bacterial predator–prey dynamics in microscale patchy landscapes. Proc. R. Soc. B Biol. Sci. 282 (1824), 20152154. doi:10.1098/rspb.2015.2154
Huang, J., Levinson, D., Wang, J., Zhou, J., and Wang, Z. (2018). Tracking job and housing dynamics with smartcard data. Proc. Natl. Acad. Sci. 115 (50), 12710–12715. doi:10.1073/pnas.1815928115
Hudson, J. C. (1970). Elementary models for population growth and distribution analysis. Demography 3, 361–368. doi:10.2307/2060155
Hunt, J. D., Abraham, J. E., Derler, C., and Haas, W. (2005). Video documentation of urban areas. Comput. Environ. Urban Syst. 29 (6), 653–668. doi:10.1016/j.compenvurbsys.2005.03.003
Hyndman, J., Schuurman, N., and Fiedler, R. (2006). Size matters: attracting new immigrants to Canadian cities. J. Int. Migr. Integration 7 (1), 1–25. doi:10.1007/s12134-006-1000-6
ISQ (2013). Population des régions métropolitaines de recensement selon le groupe d’âge et le sexe. Institut de la statistique du Québec. Québec City, QC, Canada: Gouvernement du Québec.
ISQ (2019). “Perspectives démographiques du Québec et des régions, 2016-2066,” in Institut de la Statistique du Québec. Québec City, QC, Canada: Gouvernement du Québec.
Izquierdo, D., and Hannachi, A. (2018). Urban dynamics and transitions: insights from complex systems approaches. Comput. Environ. Urban Syst. 68, 153–162. doi:10.1016/j.compenvurbsys.2017.11.007
Karemera, D., Oguledo, V. I., and Davis, B. (2000). A gravity model analysis of international migration to North America. Appl. Econ. 32 (13), 1745–1755. doi:10.1080/000368400421093
Keilman, N. (2018). Probabilistic Demogr. forecasts. Vienna Yearb. Popul. Res. 16, 25–36. doi:10.1553/populationyearbook2018s025
Kritz, M. M., Gurak, D. T., and Lee, M. A. (2013). Foreign-born out-migration from new destinations: onward or back to the enclave? Soc. Sci. Res. 42 (2), 527–546. doi:10.1016/j.ssresearch.2012.09.013
Kuate Defo, B. (2014). Beyond the “transition” frameworks: the cross-continuum of health, disease, and mortality framework. Glob. Health Action 7, 24804. doi:10.3402/gha.v7.24804
Lancaster, K. (1966). A new approach to consumer theory. J. Political Econ. 74 (2), 132–157. doi:10.1086/259131
Lapointe, M., Dunn, K., Tremblay-Côté, N., Bergeron, L.-P., and Ignaczac, L. (2006). Perspectives du marché du travail canadien pour la prochaine décennie. Ressources Humaines Développement Soc. Can.
Lee, E. S. (1966). “A theory of migration,” in The study of population. Editors P. H. Hauser, and O. D. Duncan (University of Chicago Press), 282–297.
Lee, E. S. (1969). “A theory of migration,” in Migration. Editor J. A. Jackson (Cambridge University Press), 282–297.
Leslie, P. H. (1945). The use of matrices in certain population mathematics. Biometrika 33 (3), 183–212. doi:10.1093/biomet/33.3.183
Lewer, J. J., and Van den Berg, H. (2008). A gravity model of immigration. Econ. Lett. 99 (1), 164–167. doi:10.1016/j.econlet.2007.06.019
Lichter, D. T., and Johnson, K. M. (2006). Emerging rural settlement patterns and the geographic redistribution of America’s new immigrants. Rural. Sociol. 71 (1), 109–131. doi:10.1526/003601106777789828
Liu, X., and Xiao, D. (2006). Bifurcations in a discrete time Lotka–Volterra predator–prey system. Discrete Continuous Dyn. Syst. - Ser. B 6, 559–572. doi:10.3934/dcdsb.2006.6.559
Liu, X., and Xiao, D. (2007). Complex dynamic behaviors of a discrete-time predator–prey system. Chaos, Solit. and Fractals 32, 80–94. doi:10.1016/j.chaos.2005.10.081
Lorenz, E. N. (1963). Deterministic nonperiodic flow. J. Atmos. Sci. 20 (2), 130–141. doi:10.1175/1520-0469(1963)020<0130:dnf>2.0.co;2
Lucas, R. E. B. (2015). Internal migration in developing economies: an overview. KNOMAD Work. Pap. No. 6.
Lutz, W., and Gailey, N. (2020). Depopulation as a policy challenge in the context of global demographic trends. Belgrade, Serbia: UNDP Serbia.
Lutz, W., Gailey, N., Amran, G., Bélanger, A., Conte, A., d’Addio, A. C., et al. (2019). Demographic scenarios for the EU: migration, population and education. Luxembourg: Publications Office of the European Union.
Malecki, E. J. (2004). Jockeying for position: what it means and why it matters to regional development policy when places compete. Reg. Stud. 38 (9), 1101–1120. doi:10.1080/0034340042000292665
Malmberg, G., Rybski, D., and Schleussner, C. (2023). Integrating mobility data in demographic projections for improved accuracy. J. Popul. Res. 40 (1), 57–72. doi:10.1007/s12546-022-09283-y
Matthews, S. A., and Parker, D. M. (2013). Progress in spatial demography. Demogr. Res. 28, 271–312. doi:10.4054/demres.2013.28.10
McDonald, J. T. (2004). Toronto and vancouver bound: the location choice of new Canadian immigrants. Can. J. Urban Res. 13 (1), 85–101.
Miao, H., and Pojani, D. (2022). Urban planning responses to rapid motorization: a comparative study of China, Iran, and South Korea. J. Plan. Literature 37 (1), 5–19. doi:10.1177/08854122211072254
Mougi, A., and Iwasa, Y. (2010). Evolution towards oscillation or stability in a predator–prey system. Proc. R. Soc. B Biol. Sci. 277 (1695), 3163–3171. doi:10.1098/rspb.2010.0691
Murayama, K., and Nagayasu, J. (2021). Toward coexistence of immigrants and local people in Japan: implications from spatial assimilation theory. Sustainability 13, 3849. doi:10.3390/su13073849
Newbold, B. (2007). Secondary migration of immigrants to Canada: an analysis of LSIC wave 1 data. Can. Geogr. 51 (1), 58–71. doi:10.1111/j.1541-0064.2007.00165.x
Newbold, K. B. (2011). Migration up and down Canada's urban hierarchy. Can. J. Urban Res. 20 (1), 131–149.
Newton, I. (1687). Philosophiæ naturalis principia mathematica. London, United Kingdom: Royal Society Press.
Oates, W. E. (1969). The effects of property taxes and local public spending on property values: an empirical study of tax capitalization and the tiebout hypothesis. J. Political Econ. 77, 957–971. doi:10.1086/259584
Openshaw, S. (1993). “Modelling spatial interaction using a neural net,” in Geographic information systems, spatial modelling and policy evaluation. Editors M. M. Fischer, and P. Nijkamp (Springer), 147–164.
Özdilek, Ü. (2016). Common essentials in a demand-supply allocation model for regional development forecasting. J. Urban Plan. Dev. 142 (4). doi:10.1061/(ASCE)UP.1943-5444.0000332
Özdilek, Ü. (2022). Value order in disorder. Int. J. Dyn. Control 10, 1395–1414. doi:10.1007/s40435-021-00903-3
Partridge, M., Olfert, M. R., and Alasia, A. (2007). Canadian cities as regional engines of growth: agglomeration and amenities. Can. J. Econ. 40 (1), 39–68. doi:10.1111/j.1365-2966.2007.00399.x
Paul, A. M., and Yeoh, B. S. A. (2020). Methodological innovations in studying multinational migrations. Geogr. Res. 58, 355–364. doi:10.1111/1745-5871.12409
Peeters, L. (2012). Gravity and spatial structure: the case of interstate migration in Mexico. J. Regional Sci. 52 (5), 819–856. doi:10.1111/j.1467-9787.2012.00770.x
Pignataro, L. J., Wen, J., Burchell, R., Lahr, M. L., and Strauss-Wieder, A. (1998). Transportation economic and land use system. Transp. Res. Rec. 1617, 84–89. doi:10.3141/1617-12
Pijush, P., Nichil, P., Sudip, S., Pitr, T., and Joydev, C. (2021). Dynamics of a stage-structured predator-prey model: cost and benefit of fear-induced group defense. J. Theor. Biol. 528, 110846. doi:10.1016/j.jtbi.2021.110846
Polese, M. (1981). Regional disparity, migration and economic adjustment: a reappraisal. Can. Public Policy 7 (4), 519–525. doi:10.2307/3549482
Poot, J., Alimi, O., Cameron, M. P., and Maré, D. C. (2016). The gravity model of migration: the successful comeback of an ageing superstar in regional science. IZA Discuss. Pap. No., 10329.
Price, M., and Benton-Short, L. (2008). Migrants to the metropolis: the rise of immigrant gateway cities. Syracuse, NY: Syracuse University Press.
Raftery, A. E., and Ševčíková, H. (2023). Probabilistic population forecasting: short to very long-term. Int. J. Forecast. 39 (1), 73–97. doi:10.1016/j.ijforecast.2021.09.001
Rau, R., Bohk-Ewald, C., and Muszyńska, M. M. (2022). Spatio-temporal life tables and mobility patterns in demographic forecasting. Demogr. Res. 47 (12), 341–362. doi:10.4054/DemRes.2022.47.12
Reinhold, M., and Thomsen, S. L. (2015). Subnational population projections by age: an evaluation of combined forecast techniques. Popul. Res. Policy Rev. 34, 593–613. doi:10.1007/s11113-015-9362-0
Remien, C. H., Bollback, J. P., Greenland, S., Goodman, S. N., Li, L., and Greenland, S. (2021). The challenge of quantifying scientific uncertainty: a multidisciplinary approach. Epidemiology 32 (3), 363–370. doi:10.1097/EDE.0000000000001346
Rescigno, A., and Richardson, I. W. (1967). The struggle for life: I, two species. Bull. Math. Biol. 29, 377–388. doi:10.1007/bf02476909
Robinson, C., and Dilkina, B. (2018). “A machine learning approach to modeling human migration,” in Proceedings of the 1st ACM SIGCAS conference on computing and sustainable societies, 30.
Rogers, A., and Castro, L. J. (1981). “Model migration schedules,” in RR-81-30. Laxenburg, Austria: International Institute for Applied Systems Analysis.
Rogers, A., and Willekens, F. (1986). Migration and settlement: a multiregional comparative study. Reidel.
Rosen, S. (1974). Hedonic prices and implicit markets: product differentiation in pure competition. J. Political Econ. 82, 34–55. doi:10.1086/260169
Seo, J., Cho, S.-H., Kim, D.-K., and Park, P. Y.-J. (2020). Analysis of overlapping origin–destination pairs between bus stations to enhance the efficiency of bus operations. IET Intell. Transp. Syst. 14 (6), 545–553. doi:10.1049/iet-its.2019.0158
Silverman, E., Bijak, J., Hilton, J., Noble, J., and Franck, R. (2011). When demography met social simulation: a tale of two modelling approaches. J. Artif. Soc. Soc. Simul. 14 (4), 9. doi:10.18564/jasss.1874
Silverman, E., Hilton, J., Bijak, J., and Noble, J. (2013). Simulating the impact of economic change and social stratification on UK demographic developments. Demogr. Res. 28, 621–652. doi:10.4054/DemRes.2013.28.22
Simini, F., Barlacchi, G., Luca, M., and Pappalardo, L. (2021). A deep gravity model for mobility flows generation. Nat. Commun. 12 (1), 6576. doi:10.1038/s41467-021-26752-4
Smale, S. (1976). On the differential equations of species in competition. J. Math. Biol. 3 (1), 5–7. doi:10.1007/bf00307854
Smith, S. K., Tayman, J., and Swanson, D. A. (2013). “Implementing the cohort-component method,” in A practitioner’s guide to state and local population projections (Springer), 155–183.
Sohst, R., and Tjaden, J. (2020). Forecasting migration: a policy guide to common approaches and models. Migr. Policy Pract. 10 (1), 36–44.
Song, G., Knudsen, J. K., Grant, M., and Li, L. (2013). “Towards platial joins and buffers in place-based GIS,” in Proceedings of the first ACM SIGSPATIAL international workshop on computational models of place, 42–49.
Statistics Canada. (2010). Population projections for Canada, provinces and territories 2009 to 2036. Catalogue no. 91-520-X.
Statistics Canada (2013). Migrations internationales et interprovinciales par région métropolitaine de recensement. Québec, 1996–2012.
Statistics Canada. (2023). Annual demographic estimates: Canada, provinces and territories. Catalogue no. 91-215-X.
Stawarz, N., Sander, N., and Sulak, H. (2021). Internal migration and housing costs—a panel analysis for Germany. Popul. Space Place 27, e2412. doi:10.1002/psp.2412
Stewart, Q. J. (1950). The development of social physics. Am. J. Phys. 18, 239–253. doi:10.1119/1.1932559
Stillwell, J., Daras, K., Bell, M., and Lomax, N. (2014). The IMAGE Studio: a tool for internal migration analysis and modelling. Appl. Spatial Analysis Policy 7 (1), 5–23. doi:10.1007/s12061-014-9104-4
Teixeira, C. (2009). New immigrant settlement in a mid-sized city: a case study of housing barriers and coping strategies in Kelowna, British Columbia. Can. Geogr. 53 (3), 323–339. doi:10.1111/j.1541-0064.2009.00266.x
Terroso-Sáenz, F., and Muñoz, A. (2022). Nation-wide human mobility prediction based on graph neural networks. Appl. Intell. 52 (4), 4144–4160. doi:10.1007/s10489-021-02645-3
Tiebout, C. M. (1956). A pure theory of local expenditures. J. Political Econ. 64 (5), 416–424. doi:10.1086/257839
Tobler, W. R. (1970). A computer movie simulating urban growth in the Detroit region. Econ. Geogr. 46, 234–240. doi:10.2307/143141
Tranos, E., Gheasi, M., and Nijkamp, P. (2015a). International migration: a global complex network. Environ. Plan. B Plan. Des. 42, 4–22. doi:10.1068/b39042
Tranos, E., Reggiani, A., and Nijkamp, P. (2015b). Accessibility of cities in the knowledge economy. City, Cult. Soc. 6 (1), 35–45. doi:10.1016/j.ccs.2014.12.001
Ullman, E. L. (1954). “Geography as spatial interaction: interregional linkages,” in Proceedings of the western committee on regional economic analysis. Editors D. Rezvan, and E. S. Engelbert (New York, NY: Social Science Research Council), 63–71.
Verhulst, P. F. (1838). Notice sur la loi que la population suit dans son accroissement. Corresp. Mathématique Physique 10, 113–121.
Volterra, V. (1926). Fluctuations in the abundance of a species considered mathematically. Nature 118, 558–560. doi:10.1038/118558a0
Voss, P. R. (2007). Demography as a spatial social science. Popul. Res. Policy Rev. 26, 457–476. doi:10.1007/s11113-007-9047-4
Waddell, P. (2002). UrbanSim: modeling urban development for land use, transportation, and environmental planning. J. Am. Plan. Assoc. 68 (3), 297–314. doi:10.1080/01944360208976274
Walsh, C. A., Este, D., Krieg, B., and Giurgiu, B. (2011). Needs of refugee children in Canada: what can Roma refugee families tell us? J. Comp. Fam. Stud. 42 (4), 599–613. doi:10.3138/jcfs.42.4.599
Wang, J., Li, X., Zhang, M., and Zhang, W. (2023a). Integrating spatial and temporal data for enhanced demographic studies using advanced computational tools. J. Spatial Demogr. 12 (2), 45–59.
Wang, Y., and Li, Z. (2021). The impact of urban planning on regional development: a case study of the Pearl River Delta, China. J. Urban Plan. Dev. 147 (1), 05020035. doi:10.1061/(ASCE)UP.1943-5444.0000628
Wang, Y., Yao, X., Liu, Y., and Li, X. (2023b). Generating population migration flow data from inter-regional relations using graph convolutional network. Int. J. Appl. Earth Observation Geoinformation 113, 103237. doi:10.1016/j.jag.2022.103237
Wang, Y., Yin, H., Chen, H., Wo, T., Xu, J., and Zheng, K. (2019). “Origin-destination matrix prediction via graph convolution: a new perspective of passenger demand modeling,” in Proceedings of the 25th ACM SIGKDD international conference on knowledge discovery and data mining, 1227–1235.
Whelpton, P. K. (1928). Population of the United States, 1925 to 1975. Am. J. Sociol. 34 (2), 253–270. doi:10.1086/214667
Wiginton, L. K. (2013). Canada's decentralised immigration policy through a local lens: how small communities are attracting and welcoming immigrants. Montreal, QC, Canada: McGill University.
Wilson, A. G. (2006). Ecological and urban systems models: some explorations of similarities in the context of complexity theory. Environ. Plan. A 38 (4), 633–646. doi:10.1068/a37102
Wilson, A. G. (2008). Boltzmann, Lotka and Volterra and spatial structural evolution: an integrated methodology for some dynamical systems. J. R. Soc. Interface 5 (25), 865–871. doi:10.1098/rsif.2007.1288
Wilson, A. G. (2010). Entropy in urban and regional modelling: retrospect and prospect. Geogr. Anal. 42, 364–394. doi:10.1111/j.1538-4632.2010.00799.x
Wilson, A. G., and Dearden, J. A. (2011). Phase transitions and path dependence in urban evolution. J. Geogr. Syst. 13 (1), 1–16. doi:10.1007/s10109-010-0134-4
Wilson, T. (2016). Evaluation of alternative cohort-component models for local area population forecasts. Popul. Res. Policy Rev. 35, 241–261. doi:10.1007/s11113-015-9380-y
Wilson, T., Grossman, I., Alexander, M., Rees, P., and Temple, J. (2021). Methods for small area population forecasts: state-of-the-art and research needs. Popul. Res. Policy Rev. 40 (4), 539–565. doi:10.1007/s11113-020-09579-w
Wiśniowski, A., Smith, P. W., Bijak, J., Raymer, J., and Forster, J. J. (2015). Bayesian population forecasting: extending the Lee-Carter method. Demography 52 (3), 1035–1059. doi:10.1007/s13524-015-0389-y
Keywords: prey-predator theory, Lotka-Volterra model, probabilistic gravity model, spatial interaction models, demometry, demographic value
Citation: Özdilek Ü (2025) Integrating Lotka-Volterra dynamics and gravity modeling for regional population forecasting. Front. Built Environ. 11:1469890. doi: 10.3389/fbuil.2025.1469890
Received: 24 July 2024; Accepted: 06 January 2025;
Published: 20 February 2025.
Edited by:
Nabil Mohareb, American University in Cairo, EgyptReviewed by:
Alan Wilson, University College London, United KingdomSara Curran, University of Washington, United States
Copyright © 2025 Özdilek. This is an open-access article distributed under the terms of the Creative Commons Attribution License (CC BY). The use, distribution or reproduction in other forums is permitted, provided the original author(s) and the copyright owner(s) are credited and that the original publication in this journal is cited, in accordance with accepted academic practice. No use, distribution or reproduction is permitted which does not comply with these terms.
*Correspondence: Ünsal Özdilek, b3pkaWxlay51bnNhbEB1cWFtLmNh