 Asher Virin
 Lalitphat Khongsomchit
 Sakdirat Kaewunruen
- 1Department of Mechanical Engineering, School of Engineering, University of Birmingham, Birmingham, United Kingdom
- 2Department of Civil Engineering, School of Engineering, University of Birmingham, Birmingham, United Kingdom
This study integrates e-scooter vibrational data with smartphone sensors, employing machine learning to evaluate road surfaces. The goal is to classify the road surface roughness level(s) equivalent to the high cycle fatigue threshold(s) experienced by the e-scooter. This information is fundamentally critical in determining the remaining service life prior to repairing or reconditioning the e-scooter. Three machine learning models—Random Forest Classifier, Extreme Gradient Boosting (XGBoost), and Support Vector Machine (SVM) with k-means clustering—were tested using various hyperparameter tuning, post-processing, and data splitting strategies. The models achieved high accuracies above 95%, with the SVM and k-means clustering model consistently reaching up to 100% accuracy and processing times under 700 ms, indicating potential for real-time applications. Despite challenges in data collection and preprocessing, the top SVM configuration using 5-fold cross-validation demonstrated substantial promise. An 80/20 data split initially resulted in lower accuracies due to inappropriate sequencing, which was rectified by adjusting data handling methods. The most successful model has promising applications in monitoring rider comfort and support preventative maintenance for e-scooters. For instance, a sudden change in classification outputs (e.g. derived from large ampitude vibrations) of an e-scooter could indicate maintenance needs, enabling timely interventions. This approach aligns with data collection efforts by companies such as Beryl and could be integrated into existing infrastructures. Future research could expand on these findings by examining a wider variety of surfaces and speeds and incorporating regression analysis to advance the models from classification to predictive analytics.
1 Introduction
1.1 Background on E-scooters and urban mobility
E-scooters have rapidly become an integral component of urban mobility, promoting a shift toward more sustainable and efficient transportation solutions. As cities struggle with escalating traffic congestion and pollution, e-scooters offer a valuable solution with their low emissions and minimal spatial footprint. This accelerated shift towards eco-friendly methods of travel has prompted cities worldwide to reconsider their urban transit infrastructures to better integrate e-scooters and ensure a seamless blend into the transportation matrix (Gössling, 2020).
1.2 Smartphone sensors in environmental and infrastructure monitoring
Smartphones have revolutionized the approach to environmental monitoring and data collection within urban environments, thanks to their ubiquity and the sophisticated sensors they house. This study aims to show the potential for smartphones in real time data collection and analysis, and the potential for crowd-sourced data to vastly improve ease of data collection; smartphones which are often used for navigation, could easily be utilized simultaneously for their sensor technology. Advancements in signal processing techniques and improvements in data interpretation capabilities are critical to unlocking the full potential of smartphone-based monitoring systems.
1.3 Vibrational analysis techniques and applications
This study capitalizes on the latest advancements in machine learning to enhance the field of vibrational analysis, specifically applied to e-scooters used as probe vehicles in urban settings (Cafiso et al., 2022). Traditionally focused on cars, road surface assessment from the perspective of e-scooters offers a novel view of passenger comfort and road conditions. Products, such as ARAN, have been used with inertial profilers to measure vertical displacement and provide data for the calculation of International Roughness Index (IRI), providing a quantitative measure of road surface roughness. On the other hand, this study uses the smartphone’s built-in accelerometer to collect data in a much more accessible, efficient and less resource intensive way.
In addition, employing advanced feature extraction methods such as Root mean square (RMS), skewness, kurtosis, Interquartile Range (IQR), and standard deviation to provide a comprehensive and precise characterization of road surfaces.
This approach is designed to advance the application of micro-mobility vehicles in urban settings by improving the understanding of their interaction with various road types. The project’s aims include developing an effective sensory data system, enhancing our understanding of road impacts on rider comfort, and using machine learning insights to support urban infrastructure management.
1.4 Machine learning in surface assessment and data analysis
This study leverages machine learning to analyse e-scooter vibrational data, aiming to enhance the assessment of urban road surfaces using cost-effective sensor technology. Machine learning is a branch of artificial intelligence (AI) that enables computers to learn and make predictions or decisions based on data; in this context it is used to classify test data from road surfaces based on the distinguishable textural characteristics of the different surfaces it has learned during training. Machine learning techniques have already shown great promise in previous road surface assessment studies, with accuracies easily exceeding 90% (Martinez-Ríos et al., 2022) however this study brings a new perspective measuring vibrational data from an e-scooter and bringing light to rider comfort, which is directly affected by the e-scooter’s usage condition.
The research employs a combination of supervised and unsupervised learning techniques, focusing on models such as Random Forest Classifier, XGBoost, and SVM combined with k-means clustering. 0Each model was chosen for its specific strengths in addressing the challenges of analysing diverse road surfaces. Random Forest was selected for its robustness in handling noisy and imbalanced data while providing insights through feature importance. XGBoost was chosen for its computational efficiency and ability to model non-linear relationships, making it highly suitable for complex datasets. SVM, when combined with k-means clustering, excels in high-dimensional data environments and creates optimal decision boundaries for classification tasks.
By focusing on the evaluation of machine learning models and exploring their theoretical implications, this research contributes to urban planning strategies, potentially informing future infrastructure management applications for e-scooters through enhanced data analysis techniques.
1.5 Aims and objectives
This section outlines the primary aims and specific objectives of the study, providing a clear framework for the research and guiding the subsequent methodology and analysis. The goal is to classify the road surface roughness level(s) that is equivalent to the high cycle fatigue threshold(s) experienced by the e-scooter. In fact, this information is indispensable to determining the remaining life of the asset prior to either repairing or reconditioning the e-scooter. The study thus aims to develop and evaluate an e-scooter-based sensory data system capable of classifying road surfaces using advanced machine learning techniques. Specifically, Random Forest Classifier, XGBoost, and SVM with K-means clustering will be utilized to optimize model configurations for this purpose. By advancing the application of micro-mobility vehicles, such as e-scooters, in assessing urban road surfaces, the project seeks to enhance the understanding of how these surfaces impact rider comfort and overall experience. The insights gained from applying these machine learning models to urban road analysis will lay the groundwork for future infrastructure management applications.
To achieve these aims, the project will first involve the collection and processing of e-scooter acceleration data across a variety of road surfaces, thereby creating a robust dataset for subsequent machine learning analysis. Each machine learning model’s performance will be rigorously evaluated using various data partitioning strategies, including an 80/20 split, five-fold, and ten-fold cross-validation, accompanied by comprehensive hyperparameter tuning to optimize the models. The findings will then be disseminated, highlighting how the integration of machine learning with micro-mobility data can enhance e-scooter maintenance strategies through detailed urban surface analysis. Additionally, the project will explore the theoretical implications for urban infrastructure management, focusing on how refined models can inform future research and potential applications in this field.
2 Methodology
2.1 Dataset
2.1.1 Flowchart describing methodology
Figure 1 covers the different stages in this study, from initial data capture to cleaning, feature engineering, analysis, anomaly correction and final performance evaluation. After one configuration is tested with a certain machine learning model, dataset split, hyperparameters and post-processing, another configuration is then tested to see compare the accuracies of different configurations.
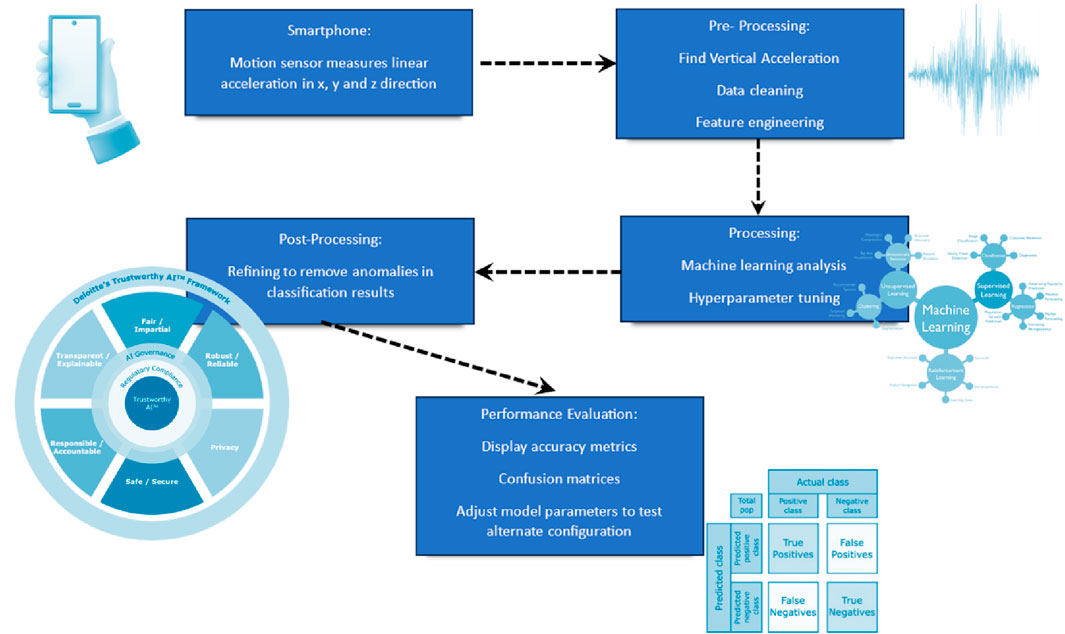
Figure 1. Flowchart of data processing stages for machine learning analysis of road surface conditions.
2.1.2 Challenges faced in acquiring the dataset
Acquiring a comprehensive dataset presented significant challenges. Data collection at 10 mph was considered unsafe for some of the surfaces chosen for analysis, leading to a reduction to six mph for consistent and safe measurements. High pedestrian traffic on concrete and personal risks using an e-scooter on asphalt roads necessitated the selection of less trafficked areas for data collection. The dataset was often affected by surface irregularities such as twigs and potholes, which introduced noise into the dataset that clouded the road surfaces true texture qualities within the vibrational data. Thus, the need for precise feature extraction and data analysis was underscored in this study, to analyse road surface condition while ignoring excessive random noise (Wang et al., 2023).
Travelling on less trafficked surfaces avoided the need for turning manoeuvres, enhancing the accuracy of data representing each road surface type as turning would have altered the angle of inclination needed to convert raw data into vertical acceleration data.
2.1.3 Data collection
Data collection process was meticulously planned to accurately represent the characteristics of the road surfaces under investigation, including concrete, asphalt, grass, and cobblestone. This ensured that a wide range of travel conditions were evaluated. Specific measures were implemented to reduce issues related to environmental conditions during data collecting. Pedestrian traffic was avoided during the evening collections to ensure smoother scooter movement and minimise interruptions. This method also introduced weather-related data variability, which was intentionally incorporated to enable the machine learning models to differentiate between travel surfaces when minor nuances were present in the dataset. By managing these environmental variables, the dataset preserved consistency while accurately representing realistic conditions.
This study evaluated four surface types (shown in Figure 2): concrete [A], asphalt [B], grass [C], and cobblestone [D], using a smartphone mounted on an e-scooter. The smartphone was mounted at a fixed angle, measured at approximately 36.4° (shown in Figure 3) from the axis perpendicular to ground, which had to be accounted for in pre-processing. This fixed angle was chosen to ensure consistent data alignment with the scooter’s motion. This approach minimized potential discrepancies caused by varying device orientations, thereby improving the reliability of the collected data. Learning the distinct textural characteristics of each surface type was critical for enabling the machine learning algorithms to effectively discriminate between them.
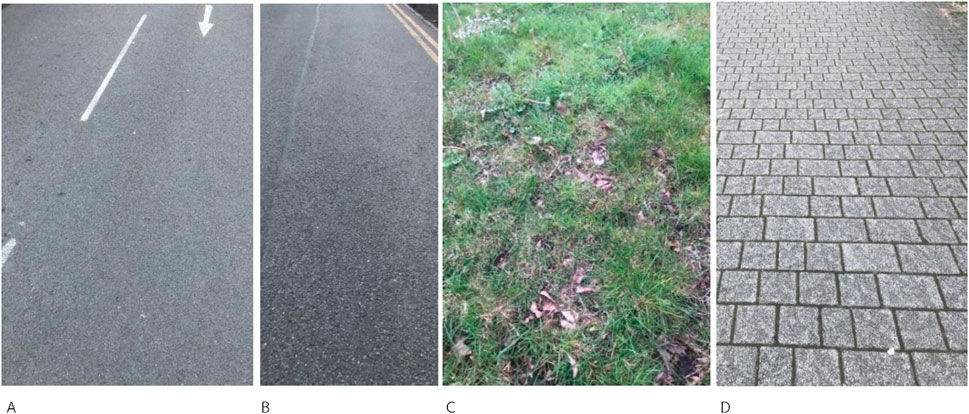
Figure 2. Comparison of different road surface types [concrete (A), asphalt (B), grass (C), cobblestone (D)].
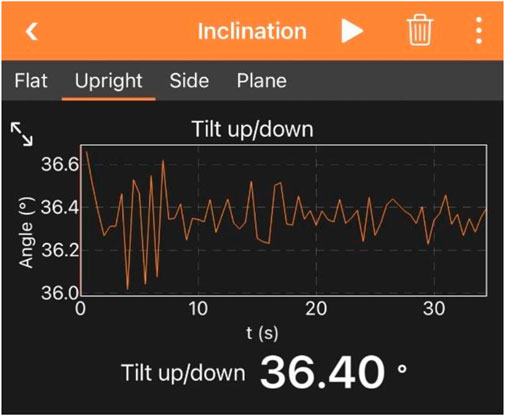
Figure 3. Diagram illustrating the fixed smartphone angle of 36.4 degrees from the perpendicular axis to the ground.
Using a smartphone with a sampling rate of a hundred samples/second, a robust dataset comprising over 1,000 data points for each 10-s traversal segment was generated, facilitating a comprehensive feature extraction process to minimize classification errors and enhance prediction accuracy (James et al., 2013). In total 480 data samples were taken (120 from each travel surface) so the data would be large enough to filter out anomalies and establish clear vibrational patterns for each surface for machine learning analysis. Data integrity was ensured by adhering to adhering to consistent driving practices and steering clear of major disruptions like large debris (as opposed to minor irregularities expected in travel surfaces).
The data collection speed was standardized at approximately six mph across all surfaces, a safe and effective rate confirmed by a risk assessment, minimizing personal and public safety risks and ensuring uniform data acquisition. Each surface type was mapped out to maximize data collection area, with necessary adaptations for spatial constraints, such as the more frequent turns required on the limited 35-m cobblestone routes. These manoeuvres helped maintain data consistency across various surfaces.
The mobile app “Phyphox” from RWTH Aachen University (Kohavi, 2001) was used, installed on an iPhone mounted at a fixed angle on an e-scooter from Beryl. The measured parameter “linear acceleration without g” captured accelerations in the x, y and z-axes (illustrated in Figure 4), excluding gravitational effects to prevent skewing the data with a constant acceleration reading of −9.81 m/s2 even when the scooter is stationary. This comprehensive approach ensured robust, reliable datasets for subsequent machine learning analysis of road surface characteristics.
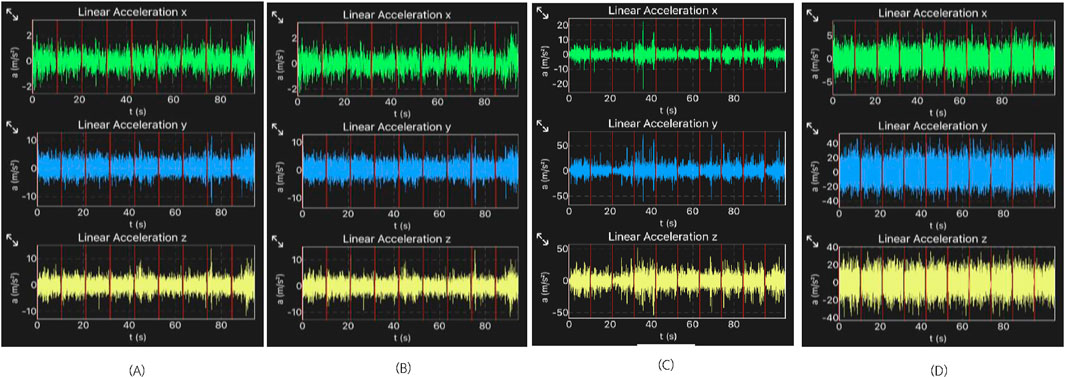
Figure 4. Linear acceleration data across different road surfaces recorded by E-scooter [concrete (A), asphalt (B), grass (C), cobblestone (D)].
Figure 4 shows the clear a sample of ten data samples collected from concrete, asphalt, grass and cobblestone respectively (from left to right). The distinction in the magnitude of acceleration experienced by the e-scooter while travelling over the different road surfaces can clearly be seen, especially in the linear acceleration in the y and z-axes. Data was also collected through an alternative app called Physics Toolbox Sensor Suite to validate that the linear acceleration measured by the smartphone was accurate and it exhibited similar ranges of magnitudes of linear acceleration over the four different evaluated surfaces.
2.1.4 Preprocessing
To facilitate data analysis, an Excel template book was prepared, configured to automatically compute all linear acceleration values in the axes perpendicular to ground (referred to as vertical acceleration in the data analysis). These vertical acceleration values were of primary interest for the project, focusing on assessing e-scooter comfort and monitoring the vibrations experienced by the scooter and user during operation.
Equation 1 was used to calculate the vertical acceleration for each data point, considering the sum of vertical components in the measured linear acceleration in the y and z-axes.
Using Equation 2, RMS values were also extracted individually for each data sample:
Other values such as 20th percentile, 50th percentile, skewness, kurtosis, etc., Were coded within the format of an excel template book, so that the features would automatically be extracted from the raw data. These features were then collected into an aggregate dataset prepared for machine learning analysis, containing features from each of the 480 data samples that make up the dataset.
Figure 5 displays empty cells designated for pasting time and linear acceleration data in the x, y, and z vectors as well as absolute acceleration. Once data is entered into columns A to E, these cells will automatically be used to compute values for vertical acceleration, vertical acceleration squared (for RMS calculation), and other specified features. Currently, these cells display ‘0’ because they are formula-driven and no data has been input yet, as shown by the displayed formula in cell F2.
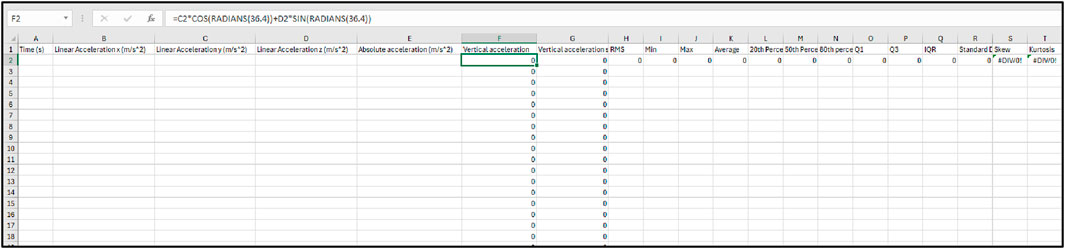
Figure 5. Template for data entry and automated calculation in vibrational data analysis.
In the preprocessing stage of this study, crucial steps were implemented within the code to prepare the dataset for effective machine learning model application. Initially, any missing values within the dataset were addressed using a SimpleImputer; a strategy to fill gaps with the mean of the available data, ensuring completeness and consistency across observations. Additionally, categorical variables were numerically encoded using LabelEncoder, facilitating the algorithms’ requirement for numerical input.
For the models that utilized SVM and k-means clustering, it was crucial to conduct feature scaling, which standardized the range of continuous initial variables, as SVM models are sensitive to the scale of input data. Feature scaling was implemented using standardization, where continuous variables were scaled to have a mean of zero and a standard deviation of one. This preprocessing step ensured that all features contributed equally to the classification process, particularly for SVM models, which rely on distance-based calculations to define decision boundaries. By standardizing the data during preprocessing. The risk of features with larger numerical ranges dominating the model was mitigated, thereby improving accuracy and stability. This approach was applied prior to implementing SVM and K-means clustering.
Finally, the dataset was methodically divided using both a traditional fixed training-testing split and cross-validation approaches. This partitioning was vital to not only leverage the wealth of data for model training but also to ensure an unbiased evaluation of the model’s predictive performance on new, unseen data.
In summary, this rigorous preprocessing protocol sets a robust foundation for the subsequent modelling phase.
2.1.5 Dataset split
This study evaluates the effectiveness of three dataset splitting strategies for validating machine learning models in road surface classification:
The 80/20 split provides a straightforward and quick assessment method by allocating most of the data to training and the rest to testing (Boashash, 1992) five-fold cross-validation improves robustness by cycling four-fifths of the data for training and one-fifth for testing across five iterations.
Ten-fold cross-validation, the most rigorous, rotates the dataset into ten subsets, each tested once, ensuring all data is used for both training and testing. This minimizes performance estimate variance and is particularly effective for complex models or limited datasets (Ramspek et al., 2020). This comparative analysis seeks to identify the most effective method to accurately predict road surface.
2.1.6 Feature extraction
Dimensionality reduction through feature extraction is crucial in machine learning (Mladenić et al., 2005), utilizing specific characteristics derived from vertical linear acceleration data to delineate surface conditions.
RMS is used as an aggregate measure to show the average vibration levels experienced by the scooter on different surfaces, highlighting terrain roughness (Durst et al., 2011). Table 1 illustrates the clearly distinguishable difference between RMS values for the different surfaces after feature extraction, validating the smartphone accelerometer’s ability to effectively capture distinct levels of vibration from varied terrains.
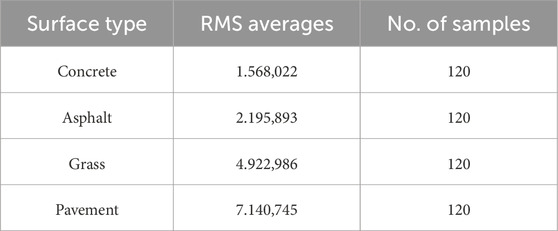
Table 1. RMS value averages for different surfaces.
Extremum values define the vibrational spectrum range, indicating the impact levels on ride comfort. Percentiles reflect variance in rider experiences with outer percentiles like the 20th and 80th providing essential insights on surface irregularity. Skewness and kurtosis describe data distribution asymmetry and extremity, revealing tendencies towards surface irregularities (Joanes and Gill, 1998). These statistical descriptors enhance prediction robustness by capturing essential aspects of the riding experience.
2.2 Utilizing different machine learning models
2.2.1 Random Forest Classifier
The Random Forest Classifier improves accuracy and mitigates over-fitting by utilising ensemble techniques. The algorithm generates multiple decision trees, with each tree being trained on a random subset of features taken from aggregate dataset for the respective data sample. The Random Forest algorithm constructs each tree separately which enables computational efficiency by taking advantage of parallel processing (Breiman, 2001). The algorithm then combines the predictions of these trees to make a decision based on the majority vote, thus making it so that erroneous predictions can be outweighed by other correct trees and outliers can be effectively handled (as illustrated in Figure 6); thus, the model is robust in handling the classification of road surfaces.
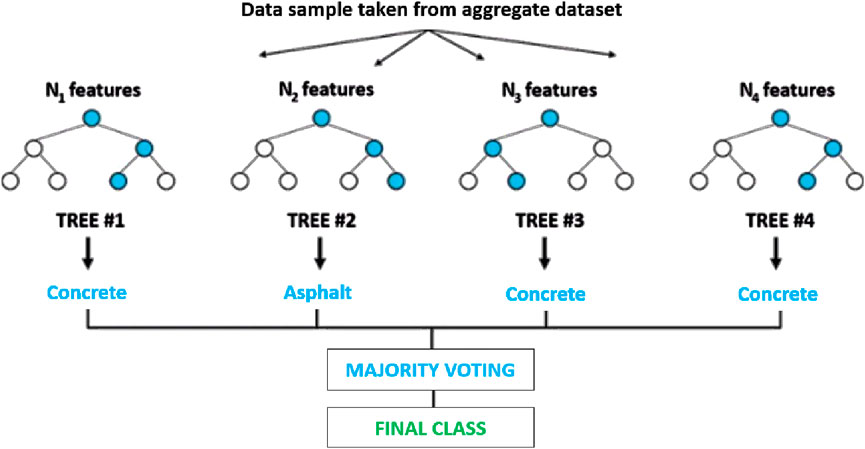
Figure 6. Random Forest Classifier model visualisation, modfied from (Breiman, 2001).
2.2.2 Extreme Gradient Boosting (XGBoost)
XGBoost is considered effective for managing large, nonlinear datasets due to its sequential tree building and model validation, optimising performance incrementally. This machine learning model is particularly suitable for the task of classifying road surfaces from vibrational data analysis due to its sophisticated boosting technique, where each new tree is built to correct errors made by the previous one (Chen and Guestrin, 2016), thus refining the model’s accuracy over time. In XGBoost, contrary to the Random Forest Classifier where each tree’s vote is treated with equal importance in the final classification, each tree’s output is weighted; in each stage of boosting, features that make the most significant improvement to the model’s performance are split on more often (illustrated in Figure 7), effectively giving these features more weight in the final classification.
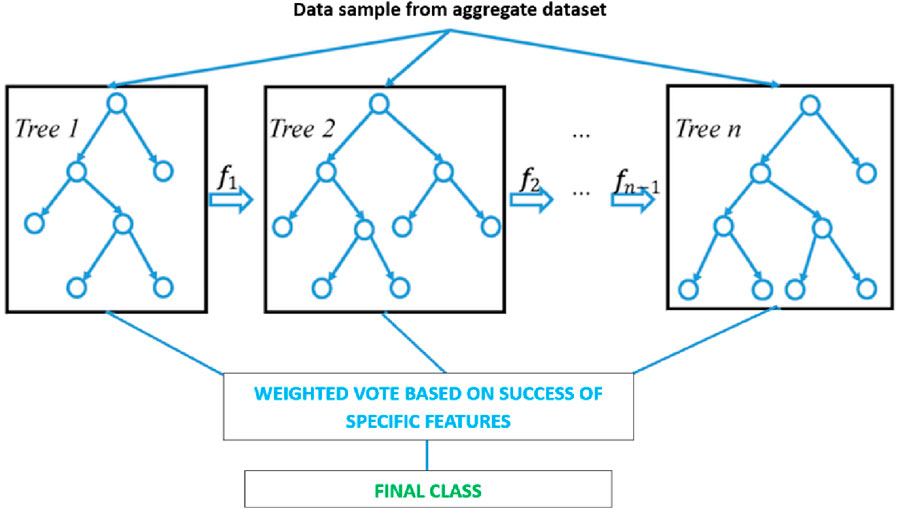
Figure 7. XGBoost model visualisation, modified from (Chen and Guestrin, 2016).
2.2.3 SVM and K-means clustering
This machine learning model explores the power of combining unsupervised learning (K-means) and supervised learning (SVM) combining the strength of both methods.
SVM with K-means clustering first simplifies the dataset before using the SVM for classification. Each extracted feature (RMS, skew, kurtosis, etc.) represents a different dimension within a multidimensional feature space. K-means clustering calculates the Euclidean distance between points within this space to identify which points are similar, thereby discovering inherent clusters in the data (as shown in Figure 8). The objective of this clustering is to minimize the variance within each cluster (Jain et al., 1999), effectively reducing the complexity of the dataset and isolating any anomalies.
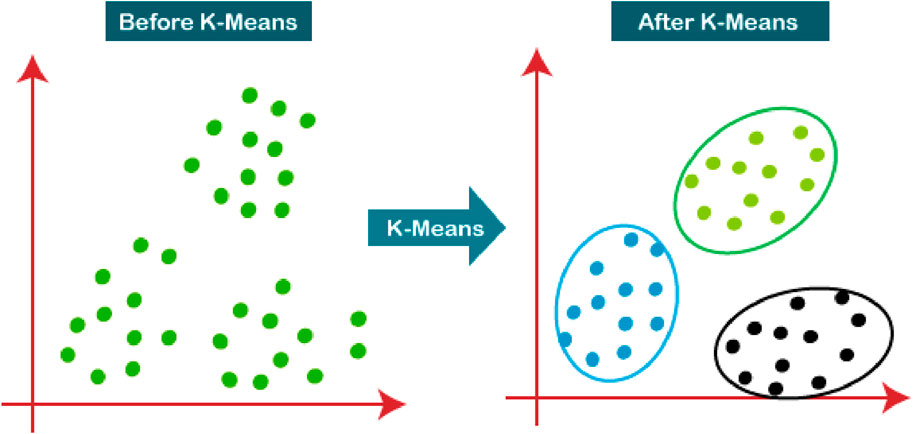
Figure 8. K means clustering visualisation, modified from (Cortes and Vapnik, 1995).
Accuracy of the SVM classifier is thusly enhanced as it allows the SVM to focus on well-defined data groups, thereby maximizing the separation margin during analysis (Cortes and Vapnik, 1995). After data has been clustered and projected into a higher dimensional space, the best hyperplane that separates different classes (maximising the margin between the nearest data points of each class) can easily be found, thus SVM can provide precise and robust classification based on this structured input.
2.2.3.1 Silhouette and elbow plot
Determining the optimal number of clusters for the K-means algorithm is crucial for the effective segmentation of data (Dhanachandra et al., 2015). Plotting the elbow method, as shown in Figure 9, showed an “elbow” at k = 2 where the decrease in WCSS slows down significantly, indicating that adding more clusters does not yield a significant improvement in compactness of clusters.
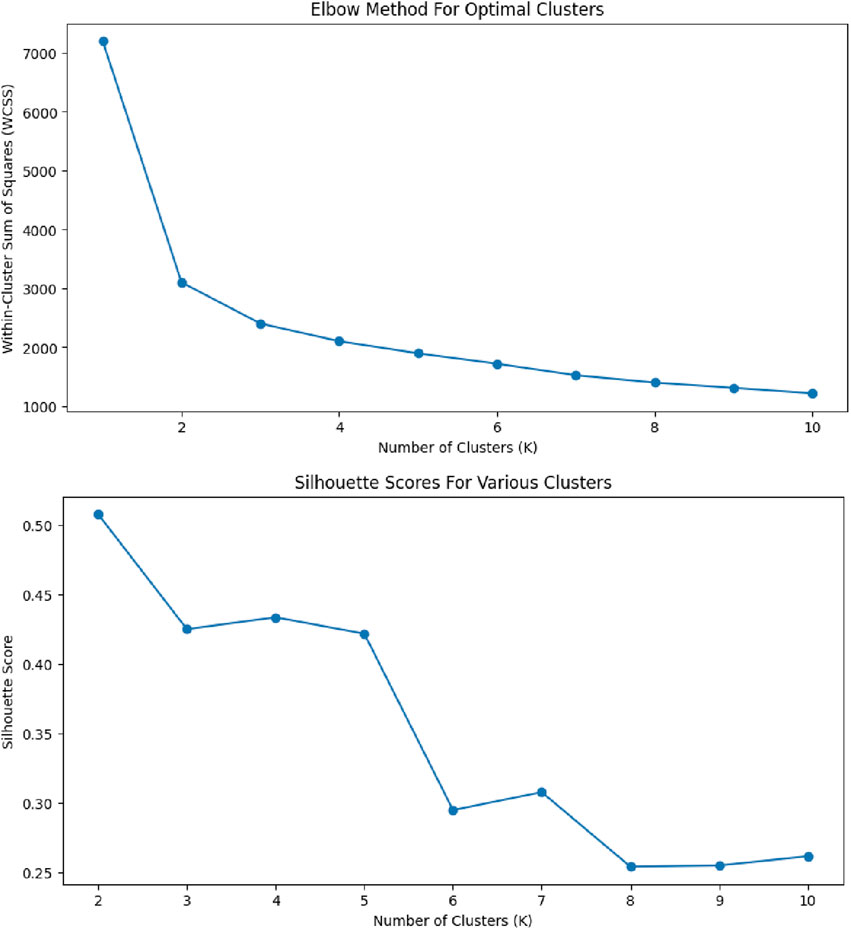
Figure 9. Elbow method and silhouette score analysis for determining optimal cluster count.
Complementary to the elbow method, silhouette analysis further substantiates the selection of two clusters. The silhouette plot shows the highest silhouette score at k = 2 which indicates that with two clusters, each data point is, on average, closer to its own cluster centre than to the centres of other clusters. Thus, k = 2 gives good separation and cohesion during clustering.
Both the graph for the elbow method and the silhouette score were plotted for each configuration of the SVM with K-means clustering models to ensure that the optimal number of clusters was always used, in order to get maximum separation margin possible and optimize each model.
2.2.4 Hyperparameter tuning
The selection and tuning of hyperparameters played a significant part within this study in helping to optimize machine learning models, allowing them to adjust to the nuances of the dataset (Probst et al., 2019). A grid search method was used for its systematic exploration of the parameter space, building and evaluating a model for each parameter combination. This approach aids in finding the most effective model parameters across the high-dimensional vibrational data to optimise model accuracy. For example, for the hyperparameter of “n_estimators”, it was found that the optimum number of trees for a Random Forest Classifier model was fifty as it represented the best balance of performance and computational efficiency.
This rigorous tuning process ensures that the models meet the specific demands of urban road surface assessment with high precision and accuracy.
2.2.5 Post processing
In this study, post-processing techniques refined the outputs of classification models. A one-dimensional median filter, using a commonly applied kernel size of five, was utilized to smooth predictions after the initial classification (Huang et al., 1979); this filter works by replacing each prediction with the median of its neighbouring values, effectively reducing the impact of outliers or noise.
Smoothing is crucial for applications like road surface assessment, where sensor data may include significant noise. The enhanced consistency of the median filter results in more reliable and interpretable outputs, thus making the results of the machine learning models more useful for practical use infrastructure maintenance.
2.2.6 Shared python libraries
Across all the models’ configurations, there was a suite of shared libraries that provided the scaffolding for most data science tasks, from preprocessing to visualization. “Pandas” was a staple throughout for its powerful data structures, excellent for data manipulation and analysis. “Numpy” excels at numerical and mathematical operations, particularly when working with arrays. Evaluation metrics were crucial for assessing the performance of each configuration, and “sklearn. Metrics” offered functions like “accuracy_score” and “confusion_matrix” for this purpose. The “scipy.signal” library, with its “medfilt” function during the post-processing stage. Finally, visualization libraries “matplotlib.pyplot” and “seaborn” proved indispensable for their graphing capabilities, making the results more accessible through the use of confusion matrices.
2.2.7 Performance evaluation using confusion matrices
Confusion matrices provided a visual representation of model performance, illustrating the classification accuracy for different road surfaces—labelled as concrete (1), asphalt (2), cobblestone (3), and grass (4). These matrices clearly highlighted successful predictions and misclassifications, offering a more detailed insight than a singular accuracy figure.
A confusion matrix has been shown to display the performance of a classification algorithm. The accurate and precise classification will be demonstrated by the intensity along the diagonal cells. For example, in the confusion matrix above on the left of Figure 10, it can be seen that three instances of asphalt are misclassified as grass, four instances of grass were misclassified as cobblestone. Even with some misclassifications, the machine learning models retained extremely high accuracies.
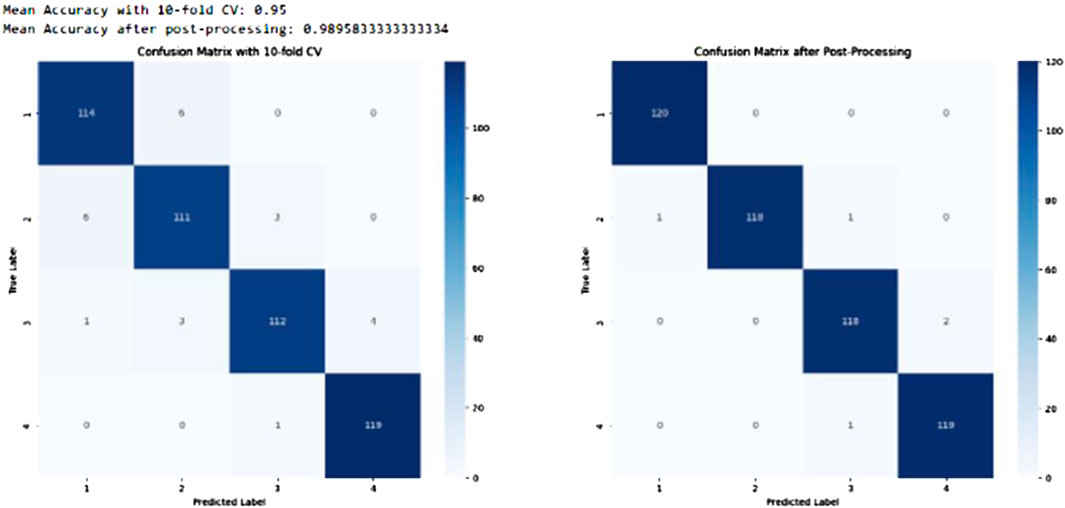
Figure 10. XGBoost confusion matrices (10-fold CV, hyperparameter tuning and post processing implemented).
The accuracy can be calculated from the confusion matrix using Equation 3:
Accuracy is based on the number of true positives (TP), true negatives (TN), false positives (FP) and false negatives (FN).
2.2.8 Challenges with software
The machine learning models underwent training using a dataset comprising diverse road surfaces. Google Colab, with its provision of Tesla T4 GPUs, was instrumental in enhancing computational speed. The platform’s generous cloud RAM (12 GB) and disk space (78 GB) (Bisong, 2019) further contributed to efficiency facilitating shorter training durations compared to CPU-based processing.
The consolidation of each data sample into the aggregated dataset containing all 480 samples facilitated efficient data reading in one pass, necessitating only an initial batch size of one and a single epoch of training.
This innovative approach to data management resulted in a significant reduction of training time underscoring the efficacy of this study’s approach to handling the dataset and optimizing the machine learning models.
3 Results
The results of this investigation into machine learning models for road surface classification reveal significant achievements in model accuracy and highlight the importance of methodical refinement. The analysis encompassed Random Forest Classifier, XGBoost, and a combined SVM with K-means clustering model, each subjected to an array of training-testing configurations, cross-validation methods, and enhancement techniques including hyperparameter tuning and post-processing, as shown in Table 2–4 below. Our literature review reveals that these deep learning approaches are more suitable to the vibration tensor datasets. They perform faster while yielding acceptable accuracy. On this ground, they have been chosen for customisation in this study. Apparently, the results in Tables 2–4 confirm that the data cross validation has improved the capability of the machine learning to improve data pattern recognition. Considering the 80:20 split (or two folds), the cross validation for this split is relatively limited, resulting in a poorer performance compared to higher folds of data. Our study has modified the traditional deep learning via the optimisation of hyperparameter tuning and K-means clustering. The details of the modification codes are available in Supplementary Appendix.
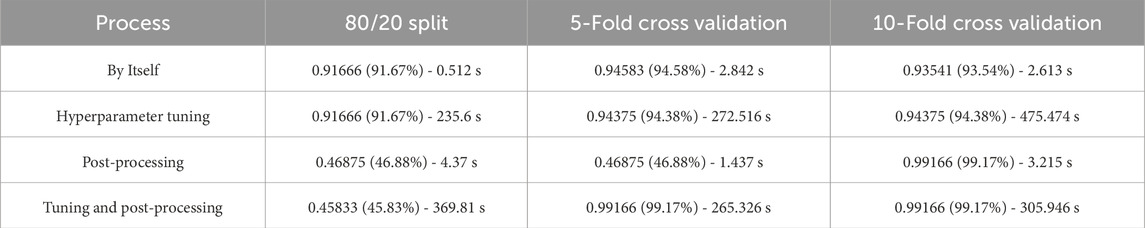
Table 2. Results for random forest classifier.
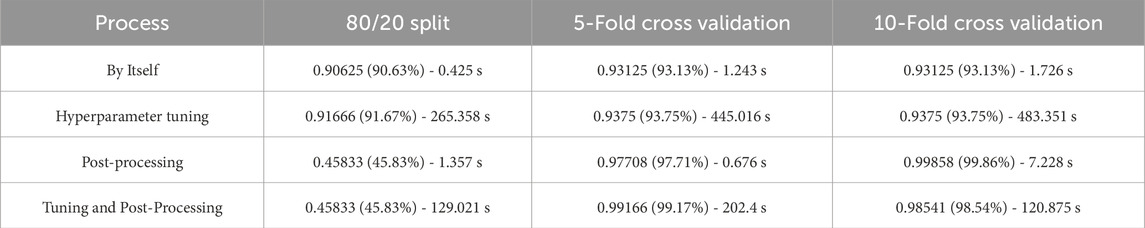
Table 3. Results for extreme gradient boosting (XGBoost).
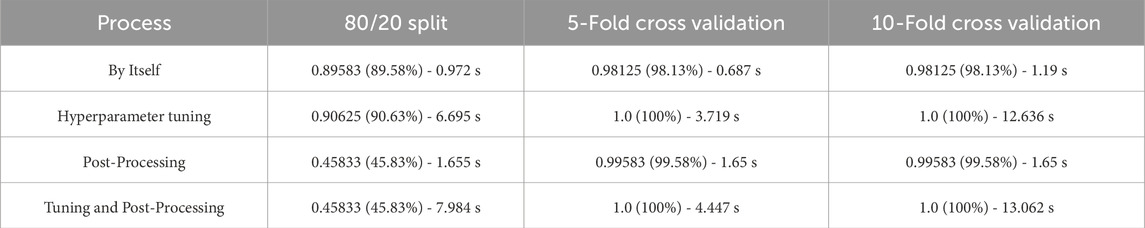
Table 4. Results for SVM and K-means clustering.
For the Random Forest models, the application of five-fold cross-validation in tandem with post-processing culminated in an exemplary peak accuracy of 99.17% with a processing time of only 1.437 s; this was found to be the most useful configuration for Random Forest Classifier. When hyperparameter tuning was involved, there was no noticeable increase in accuracy, but as expected, searching for the best hyperparameters significantly increased computational time.
In contrast, XGBoost realised its optimal performance, also at 99.17%, when five-fold cross-validation was synergised with hyperparameter tuning and post-processing. However, this came at the expense of computational time, taking 202.4 s to output classification results. An alternative arrangement which incorporated ten-fold cross-validation with post-processing, presented a good compromise between accuracy (at 98.96%) and time (taking only approximately 7.3 s).
Outstandingly, the SVM and K-means clustering models consistently delivered 100% accuracy across multiple configurations, predicting all 120 data samples from each travel surface correctly. The most efficient of these configurations being a five-fold cross-validation including hyperparameter tuning, demanded only 3.719 s to execute, with the 10-fold counterpart achieving the same accuracy in a still brisk 13.062 s. Although marginally less accurate, the sole use of five-fold cross validation in the machine learning model gave an output accuracy of 98.13% in only 687 m.
The post-processing steps taken in this study proved to be highly effective when paired with machine learning programs that were configured with cross-validation, leading to clear improvements in accuracy and a visible reduction in misclassification in the confusion matrices. On the other hand, applying the median filter to models that used an 80/20 training/testing split produced a stark decline in accuracy, declining to approximately 45% for all three machine learning models. This outcome signals a notable discrepancy from the models’ otherwise good performances.
In summary, the empirical data in Table 2 underscores the superiority of complex cross-validation and post-processing over simpler splits like the 80/20 ratio. Utilizing these techniques for optimization, the SVM with K-means clustering model demonstrated commendable efficiency and precision, proving to be far more accurate and computationally efficient than the other machine learning models.
4 Discussion
In this study, the SVM with K-means clustering model was established as a benchmark in urban infrastructure assessment through the use of e-scooter vibrational data, achieving 100% accuracy in multiple configurations, far surpassing the industry standards of 80%–95% for road condition analysis (Martinelli et al., 2022). In addition, the output accuracy of 98.13% in only 687 m (when using 5-fold cross validation) shows promise in the potential for this machine learning model to be implemented into real-time road surface assessment and maintenance strategies.
Compared to other models like the multi-layer perceptron, a neural network which was used to achieve an approximate accuracy of 92% in other studies (Basavaraju et al., 2020), SVM with K-means clustering excelled. Optimal cluster determination through silhouette and elbow plots proved highly effective (Ghojogh and Crowley, 2023). Although the XGBoost model also showed impressive results, SVM with K-means clustering generally provided more reliable and useful outcomes across the various configurations tested.
Hyperparameter tuning, improved the accuracy only marginally in Random Forest Classifier and XGBoost models (increase of less than 1%) however in the SVM with K-means clustering models, its implementation led to an increase of 1.87%. This is because SVM is particularly sensitive to hyperparameter changes as it adjusted its margins between data points in different clusters.
The implementation of five-fold as well as ten-fold cross validation was critical, enhancing performance evaluations and mitigating overfitting risks (European Commission. Ethics Guidelines for Trustworthy AI, 2021); an improvement over traditional road condition data analysis. By systematically rotating the dataset through both training and testing phases, the study maximized the use of all data, thereby validating the reliability, accuracy, and efficiency of the models’ performance.
Feature extraction from vibrational data, including RMS, skewness, and kurtosis, was vital for precise classifications, helping to distinguish subtle differences in road textures. Post-processing using a median filter was highly successful in significantly improving accuracy and facilitating swift, efficient machine learning models for road surface classification, however it proved to be ineffective when using an 80/20 split for training and testing, stressing the importance of ordered data processing to avoid adverse outcomes.
This study also addressed potential dataset biases from e-scooter user behaviour and data collection methods, enhancing model robustness with noise-resilient algorithms and preprocessing techniques like data cleaning and outlier detection.
The developed machine learning models in this study, including the selected best model for road surface classification (which utilises SVM with K-means clustering and 5-fold cross-validation as the data splitting method), proved to be robust according to the Ethics Guidelines for Trustworthy AI (Jahanian, 1992) set out by the EU: The model does not have its own autonomy and can be overridden or modified by humans, which prevents it from making harmful or unethical decisions, so there is human oversight; the model maintains consistent outputs with high accuracies which is essential when dealing with applications affecting human lives and a high quality, relevant and well documented dataset is used ensuring model responsibility.
Overall, the findings affirm the effectiveness and robustness of the advanced machine learning techniques used in this study, specifically SVM with k-means clustering, and the importance of methodological precision in road surface classification. These techniques demonstrated higher accuracy and efficiency than traditional data analysis methods, suggesting substantial potential for future real-time monitoring applications. The readiness of these models for operational use could greatly benefit urban infrastructure with timely and accurate road assessments.
4.1 Future applications: Electric scooter maintenance strategies
The high accuracy of the SVM with K-means clustering model (98.13%) in real time processing speeds (687 m) underscores the potential of these this model to inform real-time urban infrastructure analysis (Beryl. Impact Report, 2023). Integrating these algorithms into city maintenance operations, as proposed in collaboration with Beryl’s extensive data collection efforts described in the Beryl Impact Report 2023 (Sarstedt and Mooi, 2019), could facilitate proactive road quality monitoring. The machine learning model proposed in this study could also play a crucial role in e-scooter maintenance strategies. By utilizing the data collection and feature extraction methods detailed in this study, insights into rider comfort can be gained through the analysis of RMS values. Companies like Beryl can leverage this data to evaluate user experiences related to vibrations on roads. This analysis could inform decisions to adjust the suspension and damping systems of e-scooters, particularly if vibration levels are found to be excessively harsh.
Furthermore, the machine learning model can be effectively used to monitor the condition of individual scooters. If the model shows high accuracy in classifying road surfaces across multiple scooters, but significantly lower accuracy for a particular scooter, it could indicate excessive wear and tear on that scooter’s tires, or potential issues with its suspension and damping systems leading to uncharacteristically high levels of vibration. This predictive capability would allow for timely maintenance interventions, preventing potential e-scooter failures and ensuring that the scooters continue to provide a comfortable user experience. Given that Beryl continuously collects data through various sensors, including GPS and accelerometers in their scooters, integrating such a system into their existing infrastructure is not only feasible but also beneficial.
Moreover, the integration of regression analysis into the future applications of the SVM and K-means clustering algorithms for classifying road surfaces could substantially enhance their utility. By transitioning from simple classification to predictive modelling, regression analysis can offer nuanced insights into road and e-scooter conditions (Silva et al., 2017), enabling the development of sophisticated decision support systems that anticipate maintenance needs and optimize operational efficiency.
4.2 Limitations and areas of improvement
Data collection at a uniform speed of 6mph does not fully represent the variability in e-scooter operation speeds. Future research should incorporate variable speeds to enhance regression models’ accuracy in predicting road surface impacts, thus improving anomaly detection (Elhadidy et al., 2021). The project currently evaluates only four road surfaces. Expanding this to include a wider range of surfaces would boost the model’s applicability and robustness, especially for monitoring e-scooter condition across urban areas. Incorporating regression analysis would further refine this by quantifying each surface type’s impact on ride quality, offering deeper insights into surface characteristics (Page et al., 2025).
The data processing method, which involves manual steps such as data consolidation into an Excel workbook followed by separate coding, could be streamlined. Developing an algorithm for direct raw data classification and analysis would reduce errors and increase processing efficiency (Sadeghi and Goli, 2024) Additionally, employing regression techniques could automate the prediction of continuous variables like road roughness or durability from sensor data.
The study’s limited scope regarding varying weather conditions such as snow or ice also affects the accuracy of road property assessments. Including these factors in future studies would enable regression models to evaluate environmental impacts on road surfaces more comprehensively. Another aspect to improve in future research is the impact of small obstacles such as twigs and potholes, which can introduce noise and variability into the collected data. To mitigate these issues, preprocessing techniques such as obstacle filtering and terrain classification will be explored. These methods aim to refine the dataset by isolating noise caused by such irregularities, ensuring that the machine learning models focus on meaningful patterns. Enhancing these aspects and integrating regression analysis would transform the project from basic classification to a comprehensive predictive framework, which would not only improve precision, but also expand the utility in predictive maintenance and urban transportation management, making it a potent tool for smart city applications.
Challenges in the scaling of this technology include weather conditions, the necessity of additional calibration, and maintaining accuracy in roughness classification. Weather variables, like variations in temperature or humidity, can affect sensor data and may result in inaccuracies in detection. The integration of data from several sensors can be complex and often require further calibration to guarantee consistency and reliability. Therefore, achieving accurate roughness classification is challenging when technology needs to handle a diverse fleet of e-scooters with differing models, ages, and software configurations. These challenges should be addressed before scaling this technology.
5 Conclusion
This dissertation has successfully developed and evaluated a novel sensory data system utilizing e-scooters for the classification of road surfaces through the application of machine learning algorithms, specifically Random Forest Classifier, XGBoost, and SVM with K-means clustering. This research marks a significant advancement in leveraging micro-mobility vehicles for urban road surface assessment and data collection.
The findings of this study highlight the exceptional performance of the SVM with K-means clustering model, which achieved an impressive 100% accuracy across multiple configurations, surpassing the prevailing industry standards. Notably, the model demonstrated robust real-time processing capabilities, with an accuracy of 98.13% achieved in 687 milliseconds using 5-fold cross-validation. This performance underscores the model’s substantial potential for real-time road surface assessment, thereby fulfilling the project’s objectives and setting a foundation for future advancements in urban transportation strategies.
New Findings.
• SVM with K-means Clustering: The SVM with K-means clustering model achieved 100% accuracy, showcasing superior performance and real-time processing capabilities. This indicates considerable potential for the model’s application in real-time urban infrastructure analysis.
• Advancements in Urban Infrastructure: The research has enhanced the understanding of how road surface conditions impact rider comfort, providing valuable insights for developing improved maintenance and operational strategies utilizing e-scooter vibrational data.
• Ethical Compliance and Future Research: The model adheres to the Ethics Guidelines for Trustworthy AI, ensuring necessary human oversight. Future research should focus on incorporating variable speeds, a broader range of road surfaces, and environmental factors to further enhance the model’s predictive accuracy and applicability.
This study not only achieves its intended objectives but also paves the way for integrating advanced machine learning techniques with micro-mobility data, potentially transforming urban transportation management. The machine learning innovation can help asset managers to determine the fatigue threshold (from the road roughness). This paves the significant progress in predicting the remaining life of the asset prior to either repairing or reconditioning the e-scooters.
Data availability statement
The raw data supporting the conclusions of this article will be made available by the authors, without undue reservation.
Author contributions
AV: Conceptualization, Data curation, Formal Analysis, Investigation, Methodology, Software, Validation, Visualization, Writing – original draft, Writing – review and editing. LK: Conceptualization, Investigation, Validation, Visualization, Writing – original draft, Writing – review and editing. SK: Conceptualization, Funding acquisition, Investigation, Methodology, Project administration, Resources, Supervision, Writing – review and editing.
Funding
The author(s) declare that financial support was received for the research and/or publication of this article. The authors are grateful for the financial support by the European Commission, Grant No 691135, and United Kingdom Engineering and Physical Science Research Council, Grant No EP/Y015401/1. This article is in part based upon work from COST Action (FABER - Fatigue Benchmark Repository, CA23109), supported by COST (European Cooperation in Science and Technology). The APC is kindly sponsored by the University of Birmingham Library’s Open Access Fund.
Conflict of interest
The authors declare that the research was conducted in the absence of any commercial or financial relationships that could be construed as a potential conflict of interest.
The author(s) declared that they were an editorial board member of Frontiers, at the time of submission. This had no impact on the peer review process and the final decision.
Publisher’s note
All claims expressed in this article are solely those of the authors and do not necessarily represent those of their affiliated organizations, or those of the publisher, the editors and the reviewers. Any product that may be evaluated in this article, or claim that may be made by its manufacturer, is not guaranteed or endorsed by the publisher.
Supplementary material
The Supplementary Material for this article can be found online at: https://www.frontiersin.org/articles/10.3389/fbuil.2025.1497331/full#supplementary-material
References
Basavaraju, A., Du, J., Zhou, F., and Ji, J. (2020). A machine learning approach to road surface anomaly assessment using smartphone sensors. IEEE Sensors J. 20 (5), 2635–2647. doi:10.1109/jsen.2019.2952857
Bisong, E. (2019). “Google colaboratory,” in Building machine learning and deep learning models on google cloud platform (Berkeley, CA: Apress), 59–64. doi:10.1007/978-1-4842-4470-8_7
Boashash, B. (1992). Estimating and interpreting the instantaneous frequency of a signal. I. Fundamentals. Proc. IEEE 80 (4), 520–538. doi:10.1109/5.135376
Cafiso, S., Di Graziano, A., Marchetta, V., and Pappalardo, G. (2022). Urban road pavements monitoring and assessment using bike and e-scooter as probe vehicles. Case Stud. Constr. Mater. 16, e00889. doi:10.1016/j.cscm.2022.e00889
Chen, T., and Guestrin, C. (2016). “XGBoost: a scalable tree boosting system,” in Proceedings of the 22nd ACM SIGKDD international conference on knowledge discovery and data mining (San Francisco, CA, USA: ACM), 785–794. doi:10.1145/2939672.2939785
Cortes, C., and Vapnik, V. (1995). Support-vector networks. Mach. Learn 20, 273–297. doi:10.1007/BF00994018
Dhanachandra, N., Manglem, K., and Chanu, Y. J. (2015). Image segmentation using K-means clustering algorithm and subtractive clustering algorithm. Procedia Comput. Sci. 54, 764–771. doi:10.1016/j.procs.2015.06.090
Durst, P. J., Mason, G. L., McKinley, B., and Baylot, A. (2011). Predicting RMS surface roughness using fractal dimension and PSD parameters. J. Terramech 48 (2), 105–111. doi:10.1016/j.jterra.2010.05.004
Elhadidy, A. A., El-Badawy, S. M., and Elbeltagi, E. E. (2021). A simplified pavement condition index regression model for pavement evaluation. Int. J. Pavement Eng. 22 (5), 643–652. Available from. doi:10.1080/10298436.2019.1633579
European Commission. Ethics Guidelines for Trustworthy AI (2021). European Commission. Ethics Guidelines for Trustworthy AI Futur. Arch. since. Available online at: https://ec.europa.eu/futurium/en/ai-alliance-consultation/guidelines/1.html#:∼:text=Technical%20robustness%20requires%20that%20AI,harm%2C%20and%20preventing%20unacceptable%20harm.
Ghojogh, B., and Crowley, M. (2023). The theory behind overfitting, cross validation, regularization, bagging, and boosting: tutorial. arXiv.Org. Available online at: https://arxiv.org/abs/1905.12787.
Gössling, S. (2020). Integrating e-scooters in urban transportation: problems, policies, and the prospect of system change. Transp. Res. Part D Transp. Environ. 79, 102230. doi:10.1016/j.trd.2020.102230
Huang, T., Yang, G., and Tang, G. (1979). A fast two-dimensional median filtering algorithm. IEEE Trans. Acoust. Speech Signal Process 27 (1), 13–18. doi:10.1109/TASSP.1979.1163188
Jahanian, F. (1992). Run-time monitoring of real-time systems. Conf. Pap. IEEE Xplore. doi:10.1109/REAL.1991.160380
Jain, A. K., Murty, M. N., and Flynn, P. J. (1999). Data clustering: a review. ACM Comput. Surv. 31, 264–323. doi:10.1145/331499.331504
James, G., Witten, D., Hastie, T., and Tibshirani, R. (2013). An introduction to statistical learning: with applications in R. New York: Springer. doi:10.1007/978-1-4614-7138-7
Joanes, D. N., and Gill, C. A. (1998). Comparing measures of sample skewness and kurtosis. J. R. Stat. Soc. D. Stat. 47 (1), 183–189. doi:10.1111/1467-9884.00122
Kohavi, R. (2001). A study of cross-validation and bootstrap for accuracy estimation and model selection; 14.
Martinelli, A., Meocci, M., Dolfi, M., Branzi, V., Morosi, S., Argenti, F., et al. (2022). Road surface anomaly assessment using low-cost accelerometers: a machine learning approach. Sensors 22 (10), 3788. doi:10.3390/s22103788
Martinez-Ríos, E. A., Bustamante-Bello, M. R., and Arce-Sáenz, L. A. (2022). A review of road surface anomaly detection and classification systems based on vibration-based techniques. Appl. Sci. 12 (19), 9413. doi:10.3390/app12199413
Mladenić, D. (2005). “Feature selection for dimensionality reduction,” in Subspace, latent structure and feature selection. Editors C. Saunders, M. Grobelnik, S. Gunn, and J. Shawe-Taylor (Berlin, Heidelberg: Springer), 3940, 84–102. Lecture Notes in Computer Science. doi:10.1007/11752790_5
Page, A., Turner, J. T., Mohsenin, T., and Oates, T. (2025). “Comparing raw data and feature extraction for seizure detection with deep learning methods,” in Proceedings of the twenty-seventh international Florida artificial intelligence research society conference (Baltimore County: CSEE Department: University of Maryland).
Probst, P., Wright, M. N., and Boulesteix, A. L. (2019). Hyperparameters and tuning strategies for random forest. WIREs Data Min. Knowl. Discov. 9 (3), e1301. doi:10.1002/widm.1301
Ramspek, C. L., Jager, K. J., Dekker, F. W., Zoccali, C., and van Diepen, M. (2020). External validation of prognostic models: what, why, how, when and where? Clin. Kidney J. 14 (1), 49–58. PMID: 33564405; PMCID: PMC7857818. doi:10.1093/ckj/sfaa188
Sadeghi, P., and Goli, A. (2024). Investigating the impact of pavement condition and weather characteristics on road accidents (Review paper). Int. J. Crashworthiness 29, 973–989. doi:10.1080/13588265.2024.2348269
Sarstedt, M., and Mooi, E. (2019). “Regression analysis,” in A concise guide to market research. Springer texts in business and economics (Berlin, Heidelberg: Springer). doi:10.1007/978-3-662-56707-4_7
Silva, N., Soares, J., Shah, V., Santos, M. Y., and Rodrigues, H. (2017). Anomaly detection in roads with a data mining approach. Procedia Comput. Sci. 121, 415–422. doi:10.1016/j.procs.2017.11.056
Wang, X. F., Yu, C. Q., You, Z. H., Li, L. P., Huang, W. Z., Ren, Z. H., et al. (2023). A feature extraction method based on noise reduction for circRNA-miRNA interaction prediction combining multi-structure features in the association networks. Brief. Bioinform 24 (3), bbad111. doi:10.1093/bib/bbad111
Keywords: machine learning, random forest, extreme gradient boosting, support vector machine, e-scooter, road surface roughness level, remaining asset life
Citation: Virin A, Khongsomchit L and Kaewunruen S (2025) Deep learning application to roughness classification of road surface conditions through an e-scooter’s ride quality. Front. Built Environ. 11:1497331. doi: 10.3389/fbuil.2025.1497331
Received: 16 September 2024; Accepted: 19 May 2025;
Published: 10 June 2025.
Edited by:
Ampol Karoonsoontawong, King Mongkut’s University of Technology Thonburi, ThailandCopyright © 2025 Virin, Khongsomchit and Kaewunruen. This is an open-access article distributed under the terms of the Creative Commons Attribution License (CC BY). The use, distribution or reproduction in other forums is permitted, provided the original author(s) and the copyright owner(s) are credited and that the original publication in this journal is cited, in accordance with accepted academic practice. No use, distribution or reproduction is permitted which does not comply with these terms.
*Correspondence: Sakdirat Kaewunruen, cy5rYWV3dW5ydWVuQGJoYW0uYWMudWs=