 V. S. Ozgur Kirca
 Mert Angin
 B. Mutlu Sumer
- 1BM SUMER Consultancy & Research, Istanbul, Türkiye
- 2Department of Civil Engineering, Istanbul Technical University, Istanbul, Türkiye
Residual liquefaction, a significant issue in marine engineering, results from accumulated pore-water pressure in the seabed due to cyclic shear stresses, which compromises soil stability. This study aims to investigate residual liquefaction around gravity-based marine structures by means of a 2D numerical model. The model employs a two-step procedure: First, the stresses in the soil domain are determined via solving Biot equations, and subsequently the generation and diffusion of accumulated pore pressure in the soil is simulated by means of a pressure diffusion equation with a source term. The model was first validated against analytical solution for pore pressure buildup in the seabed under progressive waves, and against experimental data for residual liquefaction around a buried submarine pipeline. The results showed that the model can satisfactorily capture pore pressure buildup and residual liquefaction in the seabed around structures. Once validated, the model was utilized to model the pore-water pressure buildup and residual liquefaction potential around a caisson breakwater under the action of standing waves and the wave-induced rocking motion of the caisson, separately and in combination. Spatial distribution of liquefaction potential was determined in the seabed soil around the caisson with and without a bedding layer on the seabed. The model results revealed the critical role of the bedding layer in reducing liquefaction susceptibility under standing waves and rocking motion, and highlighted that the rocking motion alone poses a significant risk of inducing residual liquefaction in the seabed around the caisson.
1 Introduction
Gravity-based structures are a major type of structures in coastal and offshore engineering. These structures, such as caissons and block-type structures, are not only used for berthing purposes, but can also be utilized as breakwaters, especially when rock is not feasibly available for using as rubble-mound, or when the construction depth is too large for a sloped structure (Tsinker, 2012). In such conditions, caissons are viable alternatives to sloped breakwaters. However, seabed-structure interaction issues induced by waves and current, such as liquefaction and scour, can lead to failure of caisson structures (Sumer and Fredsøe, 2002). There are two types of mechanisms associated with wave-induced liquefaction: (1) momentary liquefaction, and (2) residual liquefaction. Momentary liquefaction is caused by the temporary upward-directed pressure gradient in the seabed soil under wave trough, and it can only affect a limited depth of the soil close to the midline (Sumer, 2014, Chp. 4). Residual liquefaction, on the other hand, occurs as a result of pore-water pressure buildup caused by re-arrangement of soil grains at the expense of pore volume, due to the cyclic shear deformations under wave loading (Sumer, 2014, Chp. 3). This paper focuses on residual liquefaction, where the soil loses its bearing capacity and behaves like a fluid mixture of soil and water. Momentary liquefaction is left out of the scope of the present study.
Residual liquefaction can result in catastrophic consequences. Buried marine structures such as sea mines, pipelines or cables may either sink into the seabed or float to the midline, causing total failure of these structures (Sumer et al., 1999; Damgaard et al., 2006b; Sumer et al., 2006a; Kirca, 2013; Sumer and Kirca, 2022). Likewise, gravity-based structures like caissons can tilt and/or sink into the seabed when the surrounding seabed soil is liquefied (De Groot et al., 2006b). As a remarkable example, Puzrin et al. (2010) reported that caissons of size
When caissons are subjected to non-breaking waves, the reflected waves from the caisson forms a standing wave profile in front of the caisson. The node location of the standing wave profile (located
Seabed response around caisson breakwaters due to standing waves (Ulker et al., 2010; Duan et al., 2023) and breaking waves (Ulker et al., 2012) were studied in the recent past by means numerical models based on poroelastic behavior of seabed soil. However, the latter studies focused on the momentary liquefaction mechanism, and did not account for the pore-water pressure buildup or rocking of the caisson. For modeling pore-water pressure buildup due to cyclic loading and residual liquefaction, a mathematical model, based on the work of Sumer and Cheng (1999), was described in Sumer (2014), Section 3.2 in detail, which was also validated against experimental data by Sumer et al. (2012). It is to be noted that this model has recently been extended to 3D (Shanmugasundaram et al., 2022) as a part of the NuLIMAS project (a EU-funded research project conducted under the MarTERA programme), and modified so as to simulate the post-liquefaction behavior of seabed soil (Windt et al., 2024). It should also be further noted that here are several other studies in the literature, where the residual liquefaction was numerically modeled by means of a source term similar to that described in (Sumer, 2014, Chp. 3), implemented for 2D (Wang and Gao, 2014; Jeng and Zhao, 2015; Zhao et al., 2016a; Zhao et al., 2016b) and 3D (Li et al., 2011; Zhao et al., 2017; Cui and Jeng, 2021) soil domains.
In this study, the pore-water pressure buildup and residual liquefaction around a caisson breakwater due to standing waves as well as rocking of the caisson was numerically modeled for the first time in the literature. A 2D numerical model was implemented to model the seabed soil. The model has two components: First component solves the Biot equations to calculate the stresses in the soil domain, and the second component calculates the pore-water pressure buildup based on a pressure diffusion equation with a source term for pore-water pressure generation (Sumer, 2014; Section 3.2). First, the model results were validated against the experimental data of Sumer et al. (2006b). Then, the model was used to simulate residual liquefaction around a caisson breakwater due to standing waves, caisson rocking, and co-existence of both mechanisms. Additionally, the influence of a crushed-rock bedding layer placed under the caisson on the seabed in preventing pore-water pressure buildup was also investigated.
2 Materials and methods
2.1 Statement of the problem
The definition sketch is presented in Figure 1.
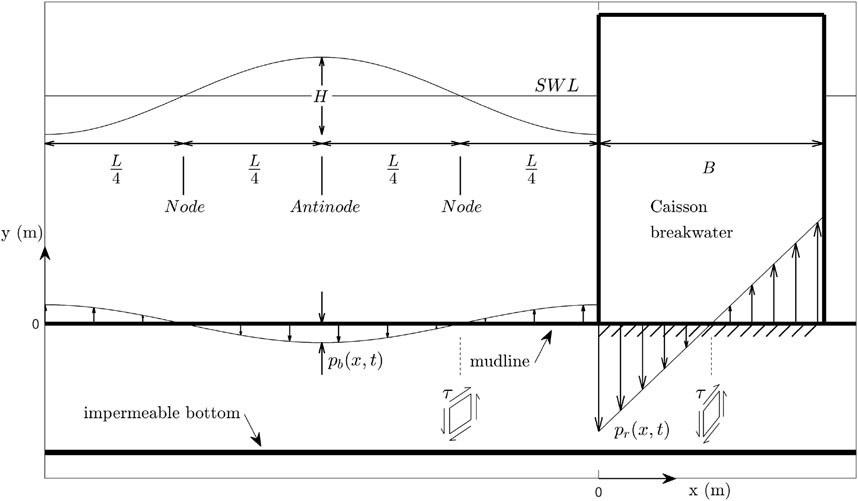
Figure 1. Definition sketch.
A caisson structure placed on the seabed is exposed to a standing wave. The pressure in excess of hydrostatic pressure acting on the seabed due to standing waves,
The caisson is, at the same time, subjected to rocking due to alternating landward and seaward wave forces, in-phase with the wave crest and troughs on the caisson, respectively, inducing a cyclic pressure on the seabed,
These two “hotspots” are potential zones of liquefaction (Sumer, 2014, Chp. 8). In this paper, both of these mechanisms will be studied to reveal their potential contributions on the liquefaction potential of the seabed.
2.2 Methodology
The present numerical model comprises a two-step procedure to simulate the pore-water pressure buildup and initiation of residual liquefaction using the finite element method (FEM). In the first step, the stresses in the soil are computed by solving the quasi-static Biot equations, in which the soil is assumed to be a saturated poro-elastic medium (Biot, 1941) with pore-water behavior represented by Darcy’s law, and the inertia terms are neglected. In the second step, the buildup of pore-water pressure is simulated through a pressure diffusion equation with a source term for pore-water pressure generation to obtain the accumulated pore pressures
The onset of liquefaction is defined as the critical point at which the buildup of pore-water pressure
The solution procedure adopted in the model is detailed below.
2.2.1 Step 1
First off, the modeling starts with the initial settlement phase, which involves the placement of soil under static conditions, and waiting for the effective stresses in the soil (due to self-weight of the soil) to be established. Once the system attains to a state of equilibrium in terms of effective stresses after the initial settlement, the overburden due to the caisson is gradually applied and the soil domain is let to stabilize again in terms of additional effective stresses and settlements under to the weight of the caisson. After an equilibrium is reached, the distribution of initial mean normal effective stress across the soil domain,
Here,
However, to account for the variation in soil stresses generated by structures such as caisson breakwaters,
in which
Simulation of cyclic loading on the soil begins after the final equilibrium of stresses in the soil under static conditions are reached. As such, standing wave forces governed by
2.2.2 Step 2
Next, the pore-water pressure buildup is computed. To this end, Equation 5 is solved across the soil domain using the stresses
In Equation 6,
The role of the pressure-limiter function,
Here,
Equations 9, 10 are obtained based on the experimental data of De Alba et al. (1976), as described in Sumer et al. (2012). In Equation 11,
The pressure variation on the seabed due to wave action is imposed with respect to the linear wave theory (Dean and Dalrymple, 1991). The time-dependent pressure on the seabed for “progressive waves” and “standing waves” are defined as Equation 12 and Equation 13, respectively (Hsu and Jeng, 1994).
In the above equations,
in which
The pressure imposed on the seabed by the rocking motion of the caisson is calculated via Equation 15. In this equation,
A flowchart describing the implementation of the numerical model is presented in Figure 2. The model described above is implemented in COMSOLE Multiphysics V5.5 A triangular mesh was adopted for the numerical simulations. The finest mesh was described around the structure borders and mesh size was gradually increased with a growth rate of 1.13, which gave the optimum mesh resolution and quality. The finest mesh element size was less than 4 cm. Different mesh sizes were tested, and no meaningful change in model results were seen for finer mesh sizes. Further details regarding numerical modeling are provided in Angin (2023).
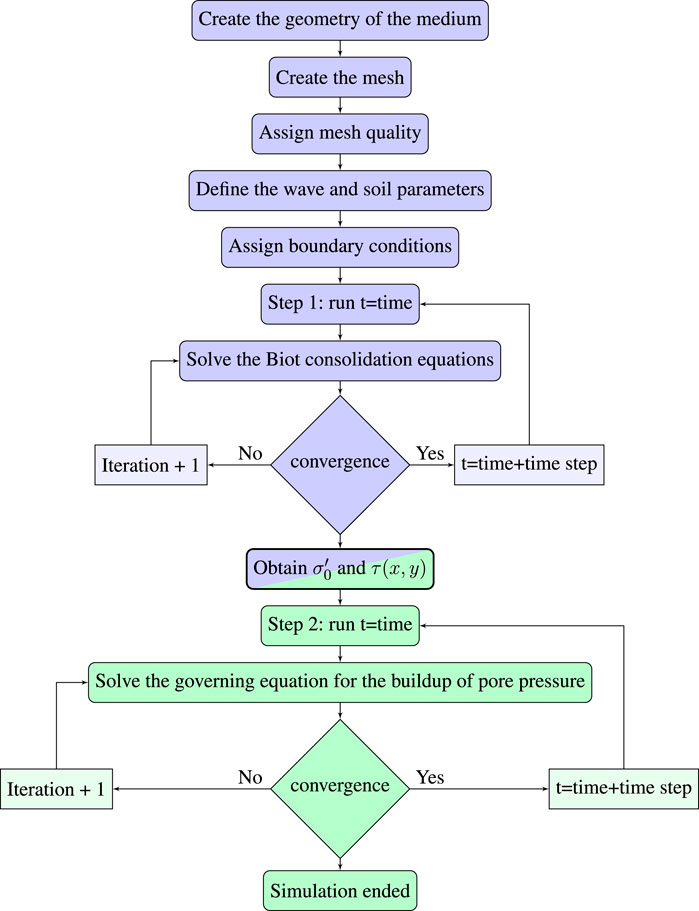
Figure 2. The flowchart of the numerical simulations.
2.3 Boundary conditions
The boundary conditions adopted for the numerical model comprise the conditions defined for soil (Biot equations) and the period-averaged pore-water pressure (pressure buildup equation). These conditions applied to the impermeable bottom, lateral boundaries, and the midline of the soil domain, as well as soil-structure boundaries (caisson bottom and pipe walls) are summarized below.
Soil: Fixed boundary, restricts all soil movement;
Period-averaged pressure: No flux normal to the boundary;
Soil: Roller boundary, restricts soil movement normal to the boundary;
Period-averaged pressure: No flux normal to the boundary;
Soil: Boundary load governed by wave pressure;
Period-averaged pressure: Dirichlet boundary condition with zero pressure;
Soil: Boundary load governed by the caisson’s weight and rocking motion;
Period-averaged pressure: No flux normal to the boundary;
Soil: Boundary load zero;
Period-averaged pressure: Dirichlet boundary condition with zero pressure;
Soil: Roller boundary, restricts soil movement normal to the boundary;
Period-averaged pressure: No flux normal to the boundary;
With the numerical model set as described above, two types of simulations were carried out with the implemented model: (1) With progressive waves for model validation, which involves an undisturbed seabed case and a buried pipe case presented in Sections 2, 3 with standing waves and rocking motion of the caisson applied separately and in a combined manner, as presented in Section 4.
3 Results: Progressive waves
For validation of the model, two different cases with progressive waves were tested before the model was used to simulate the liquefaction process around a gravity-based structure induced by standing waves and rocking of the structure. First, the model was run for a residual liquefaction case of undisturbed seabed under progressive waves, and compared with the analytical solution of Sumer (2014). For comparison, the values of wave and soil parameters are taken the same with those defined in the numerical example given in the referenced book of Sumer (2014), (pp. 87–90). The results show a very good agreement between the numerical and analytical model results as far as the buildup of pore water pressure, and the onset of liquefaction processes. The results will not be included here for reasons of space.
As a second validation case under progressive waves, the experimental study of Sumer et al. (2006b) was simulated with the numerical model. The experiments were conducted in a wave flume with dimensions 0.6 m in width, 0.8 m in depth, and 26.5 m in length. A piston-type wave generator produced regular waves, and a soil pit with dimensions of 17 cm in depth and 90 cm in length was positioned 12 m from the wave generator. A pipe of 8 cm diameter was placed in the soil rigidly, 45 cm from the offshore end of and 2.5 cm from the bottom of the soil pit. The soil and wave properties from the study of Sumer et al. (2006b) are summarized in Table 1.

Table 1. The soil and wave properties of the experimental study of Sumer et al. (2006b).
For the numerical model that simulated the experiments of Sumer et al. (2006b), the submerged weight of the pipe along with the self-weight of the soil is considered in the analysis, similar to the caisson scenario. Accumulated pore-water pressure values were measured at three specific locations on the pipeline surface: the bottom (Point 1), the left side facing the incoming wave (Point 2), and the top (Point 3), as shown in Figure 3. As seen in the figure, the numerical model can satisfactorily capture the pore-water pressure buildup, although it appears that the predicted pressures at Point 2 are somewhat larger than the measurements. The predicted maximum pressure attained at Point 2 is, nevertheless, in remarkably good agreement with the experiment.
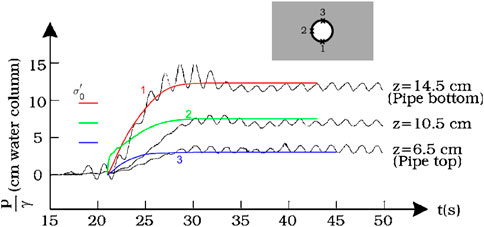
Figure 3. Accumulated pore-water pressure near the pipe. Point 1 is the bottom of the pipe
To sum up, the numerical model was shown to satisfactorily capture pore-water pressure buildup and residual liquefaction potential both in the case of undisturbed seabed and around a structure.
4 Results: Standing waves and rocking motion of the caisson
The model runs involving standing wave and rocking motion of the caisson models are performed for the soil and wave parameters defined in Table 2 and for the following dimensions of the caisson: the height of the caisson
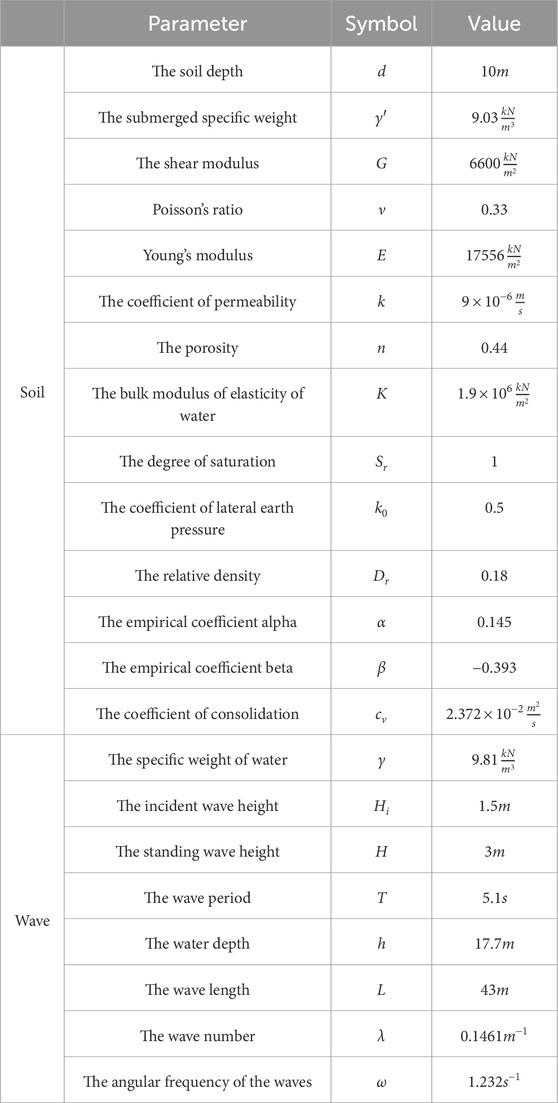
Table 2. The soil and wave properties of the seabed in the standing waves and rocking motion cases.
The amplitude of the cyclic overturning moment caused by the 3 m-height standing waves is found as 1,281 kN m/m. The amplitude of the bed pressure underneath the two edges of the caisson is determined as
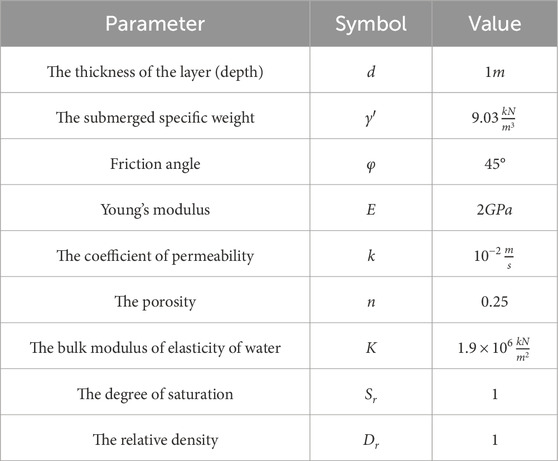
Table 3. The soil properties of the bedding layer.
As mentioned above, three different conditions are simulated: the standing-wave-only condition, the rocking-motion-only condition, and the combined condition where both waves and rocking motion affect the seabed.
4.1 Standing-wave-only case
In this case, the rocking motion is not considered. The offshore side of the seabed is exposed to the standing wave, while beneath the caisson, only the self-weight of the caisson (
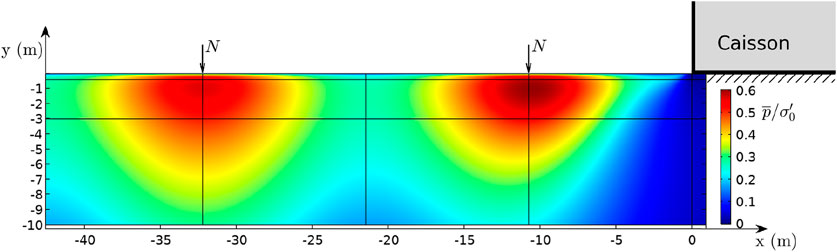
Figure 4. Liquefaction criterion:
4.2 Rocking-motion-only case
Under the effect of the rocking motion, enormous shear stresses occur. On the other hand, because of the weight of the caisson, the initial normal effective stress values underneath the caisson are also large. For this case, two conditions are simulated: with a bedding layer and without a bedding layer, to understand the effect of the bedding layer, c. f. Figures 5, 6.
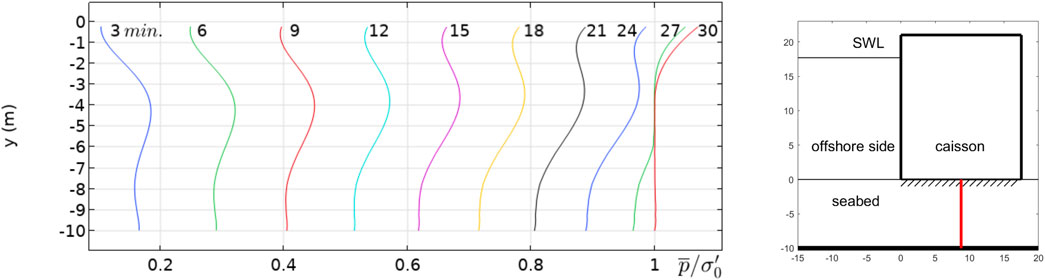
Figure 5. Liquefaction criterion:
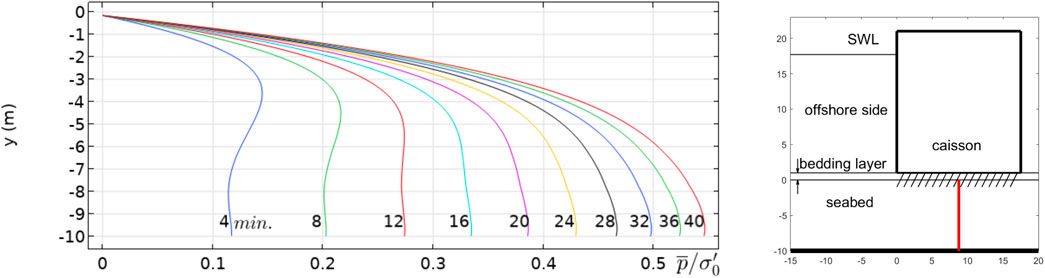
Figure 6. Liquefaction criterion:
Now, Figure 5 shows the time development of the accumulated pore pressure just underneath the caisson (at the center line) in the case where there is no bedding layer. The figure indicates that the central area under the caisson liquefies in less than 30 min.
Figure 6 shows the time development of the accumulated pore pressure, again, just underneath the caisson (at the center line) in the case where there is a bedding layer. With a bedding layer, the central area under the caisson will not liquefy. The ratio between
Placing the caisson directly on the surface of the seabed makes the area highly susceptible to liquefaction, as the excess pore water pressure cannot “escape” because of the sheer presence of the rigid bottom of the caisson. In the case of the bedding layer, however, the bedding layer allows the accumulated pore water to move out, and therefore it hinders the buildup of pore pressure. Also, the presence of the bedding layer reduces the cyclic shear stresses (Sumer et al., 2010).
In Figure 7, the amplitude of the cyclic shear stresses for both conditions, with (Figure 7B) and without (Figure 7A) a bedding layer, are shown on the same scale. As seen in Figure 7A, the amplitude of cyclic shear stress,
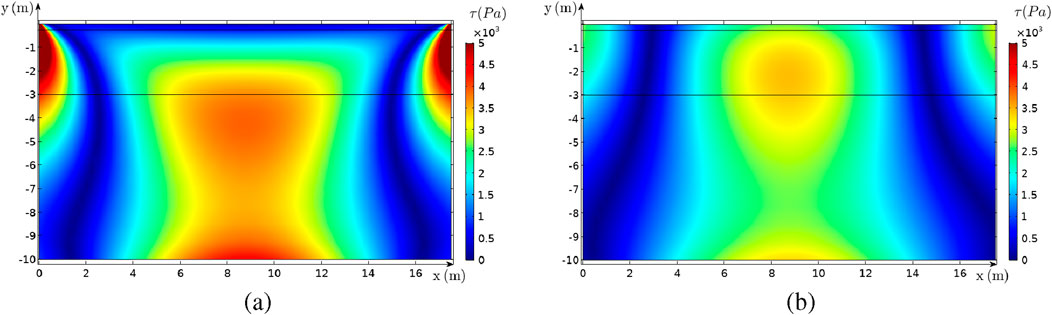
Figure 7. The amplitude of the cyclic shear stress
For both of the conditions, it is observed that the center line under the caisson is prone to liquefy, as experimentally proven by Sumer et al. (2008). The accumulated pore pressure under the effect of the rocking motion, as seen in Figure 8, reaches its maximum value at the center line under the caisson. However, the high values of the initial mean normal effective stress (Figure 9) prevent the liquefaction at this area. To quantify the liquefaction susceptibility of the seabed due to the rocking of the caisson, Figure 10 shows the variation of liquefaction criterion
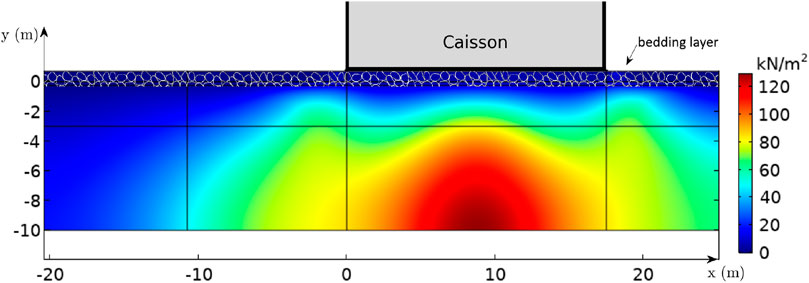
Figure 8. The initial mean normal effective stress

Figure 9. The accumulated pore pressure
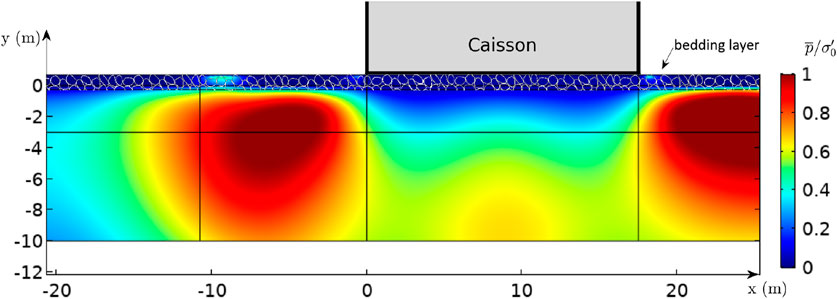
Figure 10. Liquefaction criterion:
4.3 Both standing waves and rocking motion
In this case, the standing wave is applied in front of the caisson with the caisson undergoing a rocking motion in-phase with the wave (Figure 1). Figure 11 presents the model results showing the liquefaction susceptibility in terms of distribution of
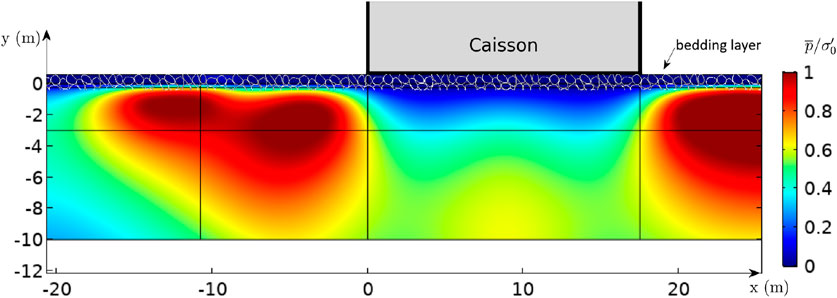
Figure 11. Liquefaction criterion:
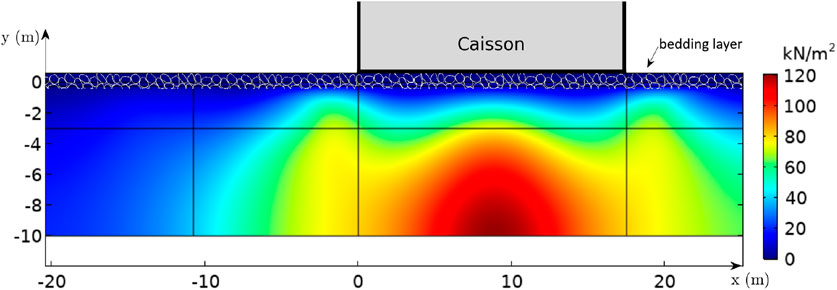
Figure 12. The accumulated pore pressure
As stated by Kudella et al. (2006), the caisson rocking motion is the primary source of pore pressure beneath the caisson, and the pore pressure generated by waves is negligible in this area. Comparison of Figures 8, 12 shows that the accumulated pore pressure is almost the same beneath the caisson, and liquefaction is not observed in this zone for any of the tested cases. As mentioned above, this is mainly because of the large
When Figure 11 is examined from the stability of caisson point of view, it is evident that the liquefaction zone in front of the caisson extending as far as the nodal point of the standing wave will trigger failure of the caisson foundation, leading to sinking of the caisson into this zone, towards offshore direction. This result clearly explains the sinking and offshore displacement mechanism of the failed caissons in the two case studies referred to in Section 1.
4.4 Discussion of results
With the numerical model results presented above, in this section the findings of the study are discussed in the light of theoretical considerations, and also the limitations of the presented numerical model are discussed along with the modifications envisaged for the future work.
Sumer (2014), (Chp. 7) gave a thorough theoretical background regarding pore-water pressure buildup and residual liquefaction under standing waves, in the light of experimental data. As discussed in the Introduction section, the key feature pointed out by Sumer (2014) was that the cyclic shear stress (and thereby shear deformations leading to the re-arrangement of soil grains) induced by standing waves are concentrated under the node section of the standing wave profile, nearest of which is located at
Wave parameters (
Once the rocking of the caisson was introduced in the numerical model, the rocking-induced cyclic shear stress became dominant underneath the caisson leading the intense pore-water pressure buildup at this hotspot (Figure 9) even larger than that induced by standing waves under node section. This result is also in conformity with the theoretical considerations (Sumer, 2014, Section 8.1.2) as well as experimental findings (Sumer et al., 2008).
In the case of combined action of caisson rocking and standing waves, the most applicable scenario to the real life, the results showed that the pore-water pressure buildup around the node caused by the standing waves was enhanced by the caisson rocking so much so that residual liquefaction took place even in the node section (Figure 11). This finding not only agrees with the theoretical considerations (Sumer, 2014; Section 8.1.2), but also can clearly explain the encountered liquefaction-induced caisson failure cases discussed in the Introduction section.
While the presented model was shown to be capable of simulating pore-water pressure buildup induced by waves and structure motion, the model has some limitations. First of all, it should be stated that the poro-elasticity assumption employed in the model, based on Biot’s equations for soil constitutive behavior, may not adequately capture soil responses under extreme displacements of the caisson which would lead to significant shear failures, such as punching shear. Therefore, caution is advised when applying the model to such scenarios involving severe structure displacements. Furthermore, given that the model is designed to simulate pore-water pressure buildup in the seabed soil until it reaches up to the initial mean normal effective stress (c.f. Equation 1), post-liquefaction behavior cannot be simulated by the present model. This means that the model results would be reliable only until the soil is liquefied. Another limitation of the present model is that it is implemented for a 2D problem, whereas 3D effects may be important in a real-life case, especially around the head section of a caisson breakwater. At this juncture, it is to be noted that in a parallel study as part of the NuLIMAS project, a similar model is implemented in OpenFOAM toolbox, which is capable of dealing with 3D geometries and also simulating the post-liquefaction behavior of seabed soil (Windt et al., 2024; Shanmugasundaram et al., 2025) as mentioned in the Introduction section. Future work will focus on modeling the 3D case of seabed liquefaction around a caisson breakwater, including the post-liquefaction behavior.
The results presented above shows that the model can be extended to simulate pore pressure buildup and initiation of seabed liquefaction around various marine structures (e.g., pipelines, cables, anchors, foundations, and rubble-mound breakwaters) in coastal or offshore environments, provided that wave-induced and structure-induced loadings are accurately described.
5 Conclusion
A mathematical model has been developed to study the buildup of pore-water pressure at a gravity-based structure, and to check for liquefaction potential of the seabed under the combined action of (1) standing waves (that form in front of the structure), and (2) the rocking motion of the structure itself induced by the waves.
First, the model was validated for the case of residual liquefaction under progressive waves against analytical results (for an undisturbed seabed case, Sumer (2014), pp. 87–90) and against experimental results (for the case of liquefaction around pipelines, Sumer et al. (2006b)). The results of the validation exercise show that the numerical model can satisfactorily capture pore-water pressure buildup and onset of residual liquefaction.
Once the model was validated, liquefaction susceptibility under standing-waves-only case, rocking-motion-only case, and combined action of standing waves and rocking caisson was investigated, respectively, for a given set of tested values of soil and wave parameters. In the standing-wave-only case, it was seen that the pore-water pressure buildup under the node section reached up to
It is concluded that, for the conditions that can be encountered in practice, the rocking motion of the caisson is the primary source of buildup of pore pressure beneath the caisson, and furthermore, the pore pressure generated by waves is of minor importance. This emphasizes the importance of precise modeling of the dynamic behavior of the caisson when estimating the risk of liquefaction around gravity-based structures.
In terms of reducing the liquefaction susceptibility, the significance of including a bedding layer in the design is demonstrated through a comparison between the scenario where the caisson is placed directly on the seabed and the scenario using a bedding layer to position the caisson. Also, the bedding layer reduces the liquefaction risk by minimizing the punching effect in the model caused by rocking motion and by increasing the initial mean normal effective stresses via the application of overburden pressure.
Data availability statement
The raw data supporting the conclusions of this article will be made available by the authors, without undue reservation.
Author contributions
VSOK: Conceptualization, Investigation, Methodology, Project administration, Supervision, Validation, Visualization, Writing–review and editing. MA: Data curation, Formal Analysis, Investigation, Methodology, Software, Validation, Writing–original draft. BMS: Conceptualization, Formal Analysis, Investigation, Methodology, Supervision, Writing–review and editing.
Funding
The author(s) declare that financial support was received for the research, authorship, and/or publication of this article. This study was funded by (1) the three-year (2020–2023) research program NuLIMAS: Numerical Modelling of Wave-Induced Liquefaction Around Marine Structures, funded through the ERA-NET co-fund MarTERA Program (Grant No. 728053) under EU Horizon 2020 Framework, from the German Federal Ministry for Economic Affairs and Energy (Grant No. 03SX524A), the Scientific and Technological Research Council of Turkey (TUBITAK, Grant No. TEYDEB- 1509/9190068), and the Polish National Center for Research and Development; and (2) the European Union through the Horizon Europe project INF4INiTY under Grant Agreement No. 101136087.
Acknowledgments
Authors acknowledge ITU ARI Teknokent for their ongoing support under the ITU ARI Teknokent Research and Development activities. The authors acknowledge the support of Mr. Selcuk Demirbas on adaptation of the software. The third author, BMS, specially would like to thank Prof. Yakun Guo of University of Bradford, U.K., for the invitation to contribute to what was originally planned a Special Issue on offshore wind energy structures in The Frontiers in Marine Science back in August 2023.
Conflict of interest
Authors VSOK and BMS were founders of BM SUMER Consultancy & Research.
The remaining author declares that the research was conducted in the absence of any commercial or financial relationships that could be construed as a potential conflict of interest.
Generative AI statement
The authors declare that no Generative AI was used in the creation of this manuscript.
Publisher’s note
All claims expressed in this article are solely those of the authors and do not necessarily represent those of their affiliated organizations, or those of the publisher, the editors and the reviewers. Any product that may be evaluated in this article, or claim that may be made by its manufacturer, is not guaranteed or endorsed by the publisher.
References
Angin, M. (2023). Numerical modeling of wave-induced liquefaction around a gravity-based structure. Istanbul, Turkiye: Istanbul Technical University, Coastal Sciences and Engineering Program. Master’s thesis.
Biot, M. A. (1941). General theory of three-dimensional consolidation. J. Appl. Phys. 12, 155–164. doi:10.1063/1.1712886
Cui, L., and Jeng, D.-S. (2021). Seabed liquefaction around breakwater heads at a river mouth: an integrated 3d model. Ocean. Eng. 242, 110036. doi:10.1016/j.oceaneng.2021.110036
Damgaard, J. S., Sumer, B. M., Teh, T., Palmer, A., Foray, P., and Osorio, D. (2006a). Guidelines for pipeline on-bottom stability on liquefied noncohesive seabeds. J. Waterw. port, Coast. ocean Eng. 132, 300–309. doi:10.1061/(asce)0733-950x(2006)132:4(300)
Damgaard, J. S., Sumer, B. M., Teh, T. C., Palmer, A. C., Foray, P., and Osorio, D. (2006b). Guidelines for pipeline on-bottom stability on liquefied noncohesive seabeds. J. Waterw. Port, Coast. Ocean Eng. 132, 300–309. doi:10.1061/(asce)0733-950x(2006)132:4(300)
De Alba, P. A., Chan, C. K., and Seed, H. B. (1976). Sand liquefaction in large-scale simple shear tests. J. Geotechnical Eng. Div. 102, 909–927. doi:10.1061/ajgeb6.0000322
Dean, R. G., and Dalrymple, R. A. (1991). Water wave mechanics for engineers and scientists, vol. 2. Singapore: world scientific publishing company.
De Groot, M., Bolton, M., Foray, P., Meijers, P., Palmer, A., Sandven, R., et al. (2006a). Physics of liquefaction phenomena around marine structures. J. Waterw. Port, Coast. Ocean Eng. 132, 227–243. doi:10.1061/(asce)0733-950x(2006)132:4(227)
De Groot, M., Kudella, M., Meijers, P., and Oumeraci, H. (2006b). Liquefaction phenomena underneath marine gravity structures subjected to wave loads. J. Waterw. port, Coast. ocean Eng. 132, 325–335. doi:10.1061/(asce)0733-950x(2006)132:4(325)
Duan, L., Qin, C., Zhou, J., Tang, G., Wang, D., and Fan, M. (2023). Numerical study of regular wave-induced oscillatory soil response during the caisson installation. Ocean. Eng. 281, 114876. doi:10.1016/j.oceaneng.2023.114876
Esfeh, P. K., and Kaynia, A. M. (2019). Numerical modeling of liquefaction and its impact on anchor piles for floating offshore structures. Soil Dyn. Earthq. Eng. 127, 105839. doi:10.1016/j.soildyn.2019.105839
Hsu, J. R. C., and Jeng, D. S. (1994). Wave-induced soil response in an unsaturated anisotropic seabed of finite thickness. Int. J. Numer. Anal. Methods Geomechanics 18, 785–807. doi:10.1002/nag.1610181104
Jeng, D.-S., and Zhao, H. (2015). Two-dimensional model for accumulation of pore pressure in marine sediments. J. Waterw. Port, Coast. Ocean Eng. 141, 04014042. doi:10.1061/(asce)ww.1943-5460.0000282
Ju, S.-H., and Mao, Y.-C. (2024). Research on offshore wind turbine support structures under seismic soil liquefaction. Ocean. Eng. 304, 117750. doi:10.1016/j.oceaneng.2024.117750
Kirca, V. S. O. (2013). Sinking of irregular shape blocks into marine seabed under wave-induced liquefaction. Coast. Eng. 75, 40–51. doi:10.1016/j.coastaleng.2013.01.006
Kirca, V. S. O., Sumer, B. M., and Fredsøe, J. (2013). Residual liquefaction of seabed under standing waves. J. Waterw. Port, Coast. Ocean Eng. 139, 489–501. doi:10.1061/(asce)ww.1943-5460.0000208
Kudella, M., Oumeraci, H., de Groot, M. B., and Meijers, P. (2006). Large-scale experiments on pore pressure generation underneath a caisson breakwater. J. Waterw. Port, Coast. Ocean Eng. 132, 310–324. doi:10.1061/(asce)0733-950x(2006)132:4(310)
Li, X.-J., Gao, F.-P., Yang, B., and Zang, J. (2011). Wave-induced pore pressure responses and soil liquefaction around pile foundation. Int. J. Offshore Polar Eng. 21.
Peacock, W. H., and Seed, H. B. (1968). Sand liquefaction under cyclic loading simple shear conditions. J. Soil Mech. Found. Div. 94, 689–708. doi:10.1061/jsfeaq.0001135
Puzrin, A. M., Alonso, E. E., and Pinyol, N. M. (2010). “Caisson failure induced by liquefaction: Barcelona harbour, Spain,” in Geomechanics of failures (Springer Netherlands), 85–148. doi:10.1007/978-90-481-3531-8_5
Sassa, S., and Sekiguchi, H. (2001). Analysis of wave-induced liquefaction of sand beds. Géotechnique 51, 115–126. doi:10.1680/geot.2001.51.2.115
Shanmugasundaram, R. k., Rusche, H., Windt, C., Kirca, O., Sumer, M., and Goseberg, N. (2022). Towards the numerical modelling of residual seabed liquefaction using openfoam. OpenFOAM® J. 2, 94–115. doi:10.51560/ofj.v2.56
Shanmugasundaram, R. K., Rusche, H., Windt, C., Kirca, V. S. O., Sumer, B. M., and Goseberg, N. (2025). Numerical modelling of wave-induced seabed liquefaction: a drift-flux model for liquefied soil. J. Waterw. Port, Coast. Ocean Eng. under Rev.
Sumer, B. M. (2006). Special issue on liquefaction around marine structures: miscellaneous. J. Waterw. Port, Coast. Ocean Eng. 133, 1–2. doi:10.1061/(ASCE)0733-950X(2007)133:1(1)
Sumer, B. M. (2014). Liquefaction around marine structures. Singapore: World Scientific. doi:10.1142/7986
Sumer, B. M., and Cheng, N.-S. (1999). “A random-walk model for pore pressure accumulation in marine soils,” in The ninth international Offshore and polar engineering conference (OnePetro).
Sumer, B. M., Dixen, F. H., and Fredsøe, J. (2010). Cover stones on liquefiable soil bed under waves. Coast. Eng. 57, 864–873. doi:10.1016/j.coastaleng.2010.05.004
Sumer, B. M., and Fredsøe, J. (2002). The mechanics of scour in the marine environment. Singapore: World Scientific.
Sumer, B. M., Fredsøe, J., Christensen, S., and Lind, M. (1999). Sinking/floatation of pipelines and other objects in liquefied soil under waves. Coast. Eng. 38, 53–90. doi:10.1016/s0378-3839(99)00024-1
Sumer, B. M., Hatipoglu, F., Fredsøe, J., and Hansen, N.-E. O. (2006a). Critical flotation density of pipelines in soils liquefied by waves and density of liquefied soils. J. Waterw. Port, Coast. Ocean Eng. 132, 252–265. doi:10.1061/(asce)0733-950x(2006)132:4(252)
Sumer, B. M., and Kirca, V. S. O. (2022). Scour and liquefaction issues for anchors and other subsea structures in floating offshore wind farms: a review. Water Sci. Eng. 15, 3–14. doi:10.1016/j.wse.2021.11.002
Sumer, B. M., Ozgur Kirca, V., and Fredsøe, J. (2012). Experimental validation of a mathematical model for seabed liquefaction under waves. Int. J. Offshore Polar Eng. 22.
Sumer, B. M., Truelsen, C., and Fredsøe, J. (2006b). Liquefaction around pipelines under waves. J. Waterw. Port, Coast. Ocean Eng. 132, 266–275. doi:10.1061/(asce)0733-950x(2006)132:4(266)
Sumer, S., Sumer, B., Dixen, F., and Fredsøe, J. (2008). “Pore pressure buildup in the subsoil under a caisson breakwater,” in Proceedings of the 18. International Offshore (Ocean) and Polar Engineering Conference, Vancouver, British Columbia, Canada, July 6-11, 2008, 664–671.
Tsinker, G. (2012). Marine structures engineering: specialized applications: specialized applications. Springer Science and Business Media.
Ulker, M., Rahman, M., and Guddati, M. (2010). Wave-induced dynamic response and instability of seabed around caisson breakwater. Ocean. Eng. 37, 1522–1545. doi:10.1016/j.oceaneng.2010.09.004
Ulker, M., Rahman, M., and Guddati, M. (2012). Breaking wave-induced response and instability of seabed around caisson breakwater. Int. J. Numer. Anal. Methods Geomechanics 36, 362–390. doi:10.1002/nag.1073
Wang, Y.-F., and Gao, F.-P. (2014). “A numerical model for pore pressure buildup in a porous seabed under the action of combined waves and current,” in ISOPE pacific/asia offshore mechanics symposium (ISOPE) (California, United States: ISOPE).
Windt, C., Goseberg, N., Schimmels, S., Kudella, M., Shanmugasundaram, R. K., Rusche, H., et al. (2024). Liquefaction around marine structures: development of a numerical modelling Framework in OpenFOAM®. Int. J. Offshore Polar Eng. 34, 182–190. doi:10.17736/ijope.2023.cl24
Zhao, H., Jeng, D.-S., Liao, C., and Zhu, J. (2017). Three-dimensional modeling of wave-induced residual seabed response around a mono-pile foundation. Coast. Eng. 128, 1–21. doi:10.1016/j.coastaleng.2017.07.002
Zhao, H., Jeng, D.-S., Zhang, H., Zhang, J., and Zhang, H. (2016a). 2-d integrated numerical modeling for the potential of solitary wave-induced residual liquefaction over a sloping porous seabed. J. Ocean Eng. Mar. Energy 2, 1–18. doi:10.1007/s40722-015-0033-3
Zhao, H.-Y., Jeng, D.-S., and Liao, C. (2016b). Parametric study of the wave-induced residual liquefaction around an embedded pipeline. Appl. Ocean Res. 55, 163–180. doi:10.1016/j.apor.2015.12.005
Nomenclature
Keywords: wave-induced liquefaction, rocking motion, gravity-based structure, standing wave, pore-water pressure, residual liquefaction
Citation: Kirca VSO, Angin M and Sumer BM (2025) Numerical modeling of wave-induced liquefaction around a gravity-based structure. Front. Built Environ. 11:1525046. doi: 10.3389/fbuil.2025.1525046
Received: 11 November 2024; Accepted: 13 January 2025;
Published: 11 February 2025.
Edited by:
Mianheng Lai, Guangzhou University, ChinaReviewed by:
Zhuangcai Tian, China University of Mining and Technology, ChinaChengshun Xu, Beijing University of Technology, China
Copyright © 2025 Kirca, Angin and Sumer. This is an open-access article distributed under the terms of the Creative Commons Attribution License (CC BY). The use, distribution or reproduction in other forums is permitted, provided the original author(s) and the copyright owner(s) are credited and that the original publication in this journal is cited, in accordance with accepted academic practice. No use, distribution or reproduction is permitted which does not comply with these terms.
*Correspondence: V. S. Ozgur Kirca, b3prQGJtc3VtZXIuY29t