 Michael Peng1
 Max Z. Li2,3,4*
- 1Department of Computer Science and Engineering, University of California San Diego, La Jolla, CA, United States
- 2Department of Aerospace Engineering, University of Michigan, Ann Arbor, MI, United States
- 3Department of Civil and Environmental Engineering, University of Michigan, Ann Arbor, MI, United States
- 4Department of Industrial and Operations Engineering, University of Michigan, Ann Arbor, MI, United States
The Southwest Airlines scheduling crisis of December 2022 and its consequences have highlighted the importance of robust airline disruption management and recovery. A wide variety of approaches have been applied to airline schedule recovery and robustness, but they are often evaluated with respect to static snapshots of disruption scenarios, which lend little consideration toward how recovery decisions interact with emerging disruptions over time. To help future research estimate and improve the utility of airline recovery strategies, we present RecovAir, a high-performance agent-based model that simulates the flow of aircraft, crew, and passengers in an airline’s flight network under disruptive departure and arrival rate limits and repeated applications of ad-hoc recovery strategies. By measuring Key Performance Indicators like On-Time Performance, cancellation count, and total delay, RecovAir supports comparisons and controlled experiments with recovery parameters. We demonstrate RecovAir’s utility by synthesizing plausible scenarios for both the first day of the 2022 scheduling crisis and a day with zero cancellations in 2024 for Southwest Airlines. We simulate these scenarios while varying recovery strategies and prioritization between delays and cancellations. Our results show that a simple greedy algorithm can perform nearly as well as Southwest Airlines’ actions on the first day of the scheduling crisis without initiating any ferry flights (i.e., non-revenue flights to reposition airline crew)—critically, we do not use any proprietary crew schedules. We then test a range of values for the maximum delay before cancellation parameter and discover an inversely proportional relationship between total delay and number of cancellations beyond a constant baseline. We envision RecovAir as a novel, lightweight simulation platform where airline stakeholders and researchers can rapidly evaluate schedule recovery algorithms without the burden of large-scale data collection efforts.
1 Introduction
From December 22 to 28 December 2022, Southwest Airlines experienced a full scheduling crisis. Winter Storm Elliott brought mass delays and cancellations across the continental United States, including Denver International Airport (DEN) and Chicago Midway (MDW), which represent two of Southwest’s major focus cities. It brought extremely cold temperatures to Denver, which presented a hazard to unprepared ground crew and led to further delays due to aircraft servicing difficulties. Although Southwest prepared for Winter Storm Elliott prior to its arrival by issuing cancellation packages (i.e., sets of flights to be canceled proactively), they turned out to be over-optimistic. Southwest’s crew communication and scheduling infrastructure struggled to handle the volume of close-in delays and cancellations. Its crew assignment solver could not generate feasible solutions in time before its inputs changed. Its Network Operations Center (NOC) gradually lost track of crew members, prompting schedulers to send messages to individual crew members for situational awareness (Murray, 2023).
After December 23, other airlines resumed normal operations with low rates of cancellation, but Southwest struggled to recover. Its distinctive point-to-point flight network had propagated the disruption across the continental US, while its two schedule solvers—“The Baker” and SkySolver—produced contradictory plans as they considered aircraft assignment and crew availability separately. As the NOC struggled to execute a recovery plan, it was overwhelmed by the volume of calls from crew members (Murray, 2023). Having lost track of its pilots and flight attendants, the NOC issued reassignments that were impossible to execute, causing further delays and cancellations and continuing their vicious cycle. On December 26, schedulers decided to “thin out” the network by canceling more than 50% of all flights over the next 3 days to return crew members to their expected locations via ferry flights—non-revenue flights that only carry crew members. Figure 1 displays the scale of Southwest’s cancellations during this period (SWAPA Schedule Research Committee, 2023).
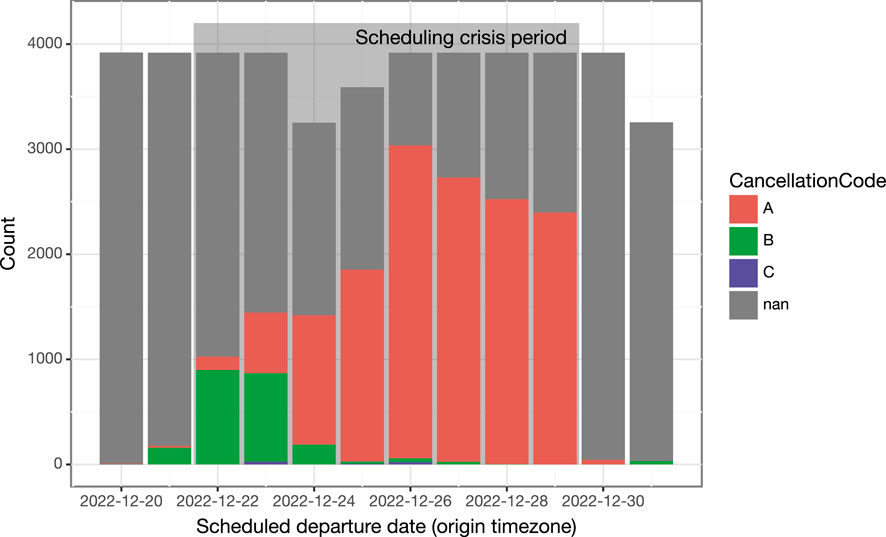
Figure 1. Southwest Airlines cancellations during the scheduling crisis period as captured by U.S. Bureau of Transportation Statistics (2024). Cancellation Code A means canceled due to airline/carrier, Code B means canceled due to weather, and Code C means canceled due to National Airspace System (NAS) initiatives. nan indicates flown.
During this scheduling crisis, Southwest Airlines canceled about 16,700 flights, left about 2 million passengers stranded, lost approximately $820 million from the event, and was fined an additional $140 million by the U.S. Department of Transportation in December 2023 for violating consumer protection laws (Murray, 2023; U.S. Department of Transportation, 2023). Robust disruption recovery is critical for airlines, and it is a pressing problem for operations researchers.
Key to the objective of ensuring disruption resilience is developing, comparing, and improving scheduling tools and workflows for irregular operations (IROPS) decision-making. Within this framework, realistic network simulations can help predict the impact of hypothetical changes to tools, workflows, network topology, disruption severity, and operational characteristics like turnaround times and schedule slack. By carrying out the mechanics of disruption propagation across an airline network, they can also shed light on the downstream effects of each recovery decision in an upcoming disruption (e.g., whether to cancel a flight, re-assign an aircraft or crew member to different flights, or initiate ferry flights). Thus, on a broader scale, network simulations can guide airlines to strengthen their disruption resilience through network and process changes, while on a narrower scale, they can help airlines tactically validate, select, and optimize their recovery plans for upcoming disruptions.
In this paper, we introduce RecovAir, a high-performance airline network simulation tool built using an Agent-Based Model (ABM) that seeks to support these use cases. RecovAir simulates all components of the Integrated Recovery problem in airline operations research, including flights, aircraft, crew, and passengers (Petersen et al., 2012), under arbitrary disruptions and recovery strategies in hypothetical scenarios. To strengthen airlines’ understanding of the impact of changing scenario inputs on service and revenue, it records Key Performance Indicators (KPIs) from each simulation’s results, including On-Time Performance (OTP), total minutes of delay, and total number of cancellations. While RecovAir’s ideation and development was motivated by the Southwest Airlines scheduling crisis of December 2022, it was built to simulate airline disruptions in general. To our knowledge, this is the first work, inspired by a real-world large-scale airline disruption, that attempts to utilize agent-based modeling to bypass the need for proprietary crew schedules, while simulating an accurate portrayal of disrupted flights.
To validate our implementation of RecovAir and demonstrate its utility, we synthesize and simulate plausible RecovAir scenarios for Southwest Airlines’s flight network on the first day of their December 2022 scheduling crisis and on a “good” day in 2024 with zero cancellations. We apply two simple recovery strategies and compare their simulated performance to actual outcomes. We discover that both strategies produced KPI values that approach the results achieved by Southwest on 2022-12-22 without initiating any ferry flights (flights that carry crew members but not commercial passengers). We additionally demonstrate RecovAir’s utility in exploring trade-offs by varying the Maximum Delay Before Cancellation parameter and measuring resultant delays and cancellations, finding that the model estimates an inverse relationship between cancellations and total minutes of delay beyond a day-specific baseline. We propose RecovAir (Figure 2) as an open-ended platform with which airlines can better prepare for upcoming disruptions, compare recovery strategies, analyze causal chains, evaluate schedule robustness, and develop better tools for tactical disruption management. Additionally, we believe that this modeling effort is a necessary step for researchers to develop a common disruption benchmark.
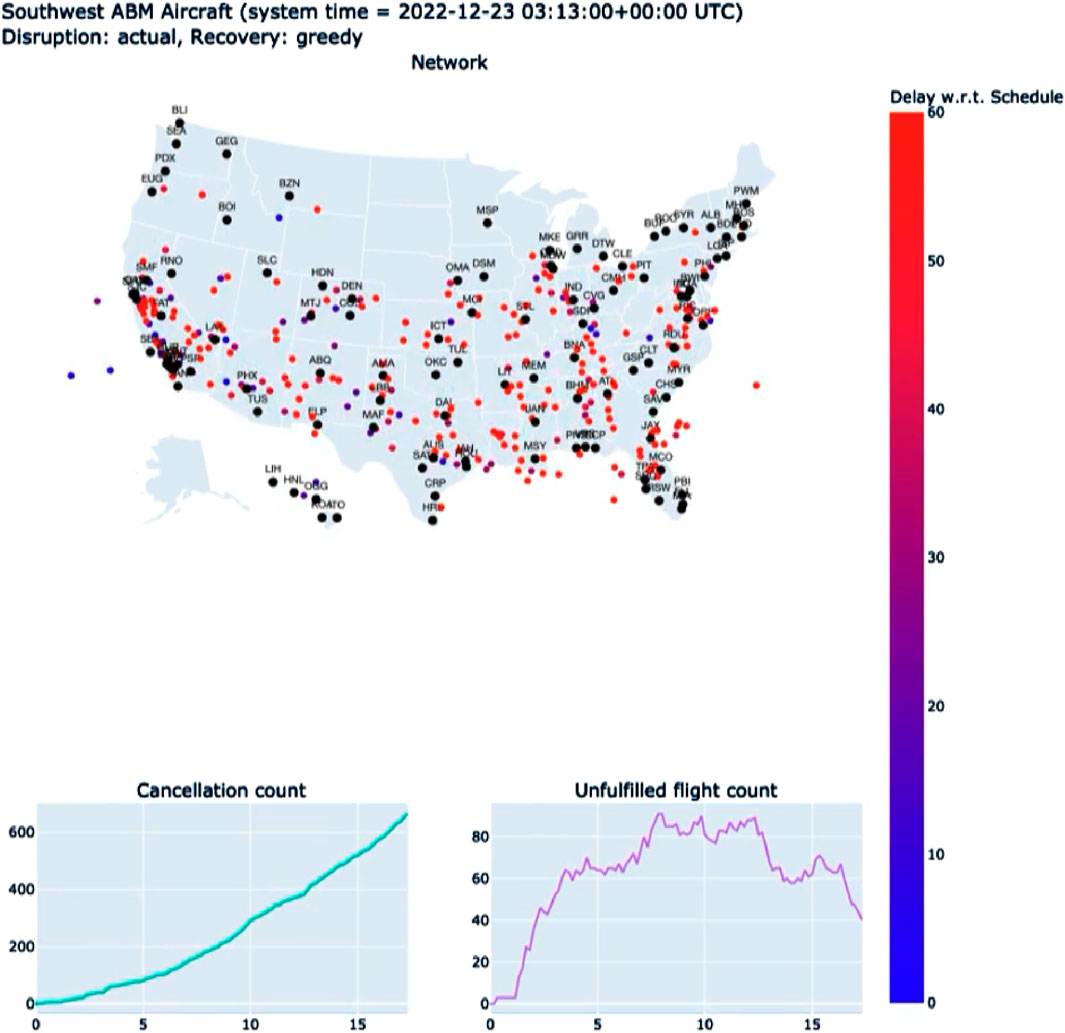
Figure 2. Screenshot of visualization of agent-based simulation from a previous version of the model presented herein, with a less sophisticated recovery algorithm.
1.1 Related work
In this section, we summarize the research landscape for flight delay prediction, disruption recovery, schedule robustness, and flight network simulation in order to identify RecovAir’s potential contributions to those fields.
The prediction of flight delay is an active research topic, with approximately 40 journal publications identified by Wandelt et al. (2025) between 2021 and 2024. Most of these publications use data science and machine learning methods, such as random forests, feedforward neural networks, and recurrent neural networks to capture key factors contributing to delays. Aside from flight identification and each flight’s operating times (both predicted and actual), weather characteristics and flight distance were most commonly selected as model inputs during feature engineering in these publications (Wandelt et al., 2025), which underscores the impact of weather on flight punctuality. Kaewunruen et al. (2021), for instance, applied various machine learning models to the task of predicting flight punctuality at Birmingham Airport. Their exploratory data analysis and experiments show that the frequency of scheduled flights, month, day of the week, and weather characteristics were statistically significant predictors of flight punctuality. Among their models, Random Forest achieved the greatest
Airline recovery research has become increasingly popular in recent years, with over 100 papers published from 2020 to 2022 (Wu et al., 2024). These papers solve the Aircraft Recovery Problem (ARP), Crew Recovery Problem (CRP), Passenger Recovery Problem (PRP), and combinations of these problems, which are known as Integrated Recovery (IR). Following a foundational approach by Teodorović and Guberinić (1984) that employed branch-and-bound on directed flight graphs to re-generate aircraft routes, past work has employed forms of numerical optimization to find optimal solutions to airline recovery problems (Hassan et al., 2021). However, airline recovery is NP-hard (Hassan et al., 2021), so applying exact algorithms such as branch-and-bound and integer programming to large-scale problems faced by airlines quickly becomes computationally intractable. Therefore, a majority of recent work on airline recovery finds approximately optimal solutions using heuristic methods like genetic algorithms, simulated annealing, and neighborhood search, as well as reinforcement learning (Hassan et al., 2021). Of these methods, reinforcement learning is particularly relevant to RecovAir because both model the recovery process as sequential decision-making and evaluate recovery policies under a simulated environment. Lee et al. (2022) pioneered the use of Double Q-Learning (DQL) to optimize a policy for reassigning aircraft to flights in a domestic network of 94 flights under disruptive scenarios where key airports are closed for an arbitrary duration. Unlike conventional practice in airline recovery, which seeks to minimize an overall airline cost objective, Lee et al. (2022) prioritize the maximization of On-Time Performance, which aligns with RecovAir’s emphasis on Key Performance Indicators (KPIs). In their experiments, the DQL model was able to generate solutions within 10% of the optimal objective value in less than half the time taken to solve the corresponding linear optimization problem. Ding et al. (2023) used Proximal Policy Optimization (PPO) to train a stochastic policy for Variable Neighborhood Search (VNS) in a resource flow network where aircraft and crew flow from source nodes through flight nodes toward sink nodes. To guide the VNS, the policy selects a pair of flight strings and a neighborhood operator (such as swap, cut, insert, and delete) to apply to the pair. To evaluate this solution, they synthesized realistic flight schedules, crew routing, and passenger itineraries according to airport traffic data and compared PPO-VNS to the optimal solution generated by CPLEX, where PPO-VNS found nearly optimal solutions with greatly reduced runtime and improved scalability. Similar to Ding et al. (2023), we also synthesize crew schedules and passenger itineraries that fit empirical statistics. Building upon their work, Wang et al. (2025) distinguished between revenue-generating and ferry flights in the resource graph, diversified recovery operators to include aircraft ferrying and crew deadheading, and employed a novel encoder-decoder framework for computing the policy. Reusing the data generation method by Ding et al. (2023), they synthesized disruption scenarios in which their strategy achieved an optimality gap of
While airline recovery is widely used to refer to reactive responses to disruptions, schedule robustness refers to making flight schedules less sensitive to potential upcoming disruptions (Clausen et al., 2010). Manual interventions for schedule robustness include adding buffers in schedules, allocating reserve crew and aircraft, and partitioning resources within a network to localize disruption propagation (Clausen et al., 2010). However, many characteristics of robust schedules come with a cost—longer buffer times imply less resource utilization and make operation more costly. Moreover, robustness can be more difficult to evaluate using integer programming formulations than schedule planning and recovery due to the inherent uncertainty of upcoming disruptions and variety of recovery strategies (Clausen et al., 2010). Most prior work on robust scheduling focus on one robustness objective at a time (Xu, 2024), but this ignores potential interaction effects between objectives. To explore these effects, Burke et al. (2010) developed a multi-objective genetic algorithm for optimizing schedule robustness where the objectives include schedule reliability (the ability for connecting flights to absorb minor stochastic delays) and flexibility (the number of possible aircraft swaps between two flight sequences).
Simulation is a necessary avenue for evaluating schedule robustness holistically (Clausen et al., 2010) as well as evaluating recovery strategies when applied iteratively as disruptions emerge. Simulations in air traffic management (ATM) have generally taken one of three forms: discrete event simulation, agent-based modeling, and dynamical systems.
Discrete event simulations (DES) employ a global queue of timestamped events ordered by timestamp and execute these events by changing the state of simulated entities (Kim et al., 2015). One of the earliest applications of DES to airline networks is NASPAC (National Airspace System Performance Analysis Capability), developed by the U.S. Federal Aviation Administration (FAA) and The MITRE Corporation (Kim et al., 2015). Clausen et al. (2010) mentions that the most well-known and complete simulation tool for airline scheduling is SIMAIR (Rosenberger et al., 2000), a foundational DES model that established a framework of interactions between disruptions from an event generator and recovery performed by a controller. SIMAIR has been widely employed to evaluate recovery models and schedule robustness optimizers.
While agent-based models (ABMs) operate at similar levels of granularity compared to DES (Kim et al., 2015), they model entities interacting within networks as autonomous agents with self-contained behavioral rules, specific objectives, and local knowledge. One of the earliest examples of applying ABMs to ATM is NASA ACES (Meyn et al., 2004), which models various air traffic control entities across the U.S. National Airspace System (NAS) as they interact with flights. Bouarfa et al. (2013) considers ABMs to be a powerful approach to simulate complex sociotechnical systems exhibiting emergent behavior and applied them to airport surface operations. Previous work has also applied ABMs to air traffic network simulation without focusing on human collaboration: Wang et al. (2021) developed an ABM consisting of flight and airport agents and used random forests to capture empirical distributions of time-varying parameters for delay prediction at the level of individual flights.
The specific application of ABMs to airline disruption recovery and schedule resilience has been scarce, but the Single European Sky ATM Research (SESAR) program’s line of work is a notable example. Initially, an exploratory SESAR project (Cook et al., 2012) designed an ABM that captures passenger-centric metrics using passenger itineraries and delay distributions. Over several years, this design was implemented and refined through SESAR’s Mercury project, as described in Delgado et al. (2021). More recently, Gurtner et al. (2021) incorporated a realistic cost model in Mercury and used it to assess the emergent effects of 4D Trajectory Adjustments (4DTA), including delaying departures for connecting passengers and modifying flight routes and speeds to recover delay. Similar to RecovAir, Mercury aims to capture knock-on effects between flights and airports at a broad geographical scale, compute various KPIs for stakeholders, and model airline decision-making in disruption recovery. Parallel to Mercury, SESAR built another flight network ABM named Domino, which aims to highlight the dependencies of subsystems by developing new metrics for network centrality and causality (Delgado et al., 2021). This aligns with RecovAir’s potential utility in studying disruption propagation dynamics. However, SESAR’s ABM projects strive to simulate the entire commercial flight network across all airlines in Europe and do not necessarily involve unusual, large-scale disruptions (Delgado et al., 2021), whereas RecovAir focuses on a single airline’s network as it encounters such disruptions, taking the perspective of that airline’s Operations Control Center (OCC). As such, RecovAir can also be used to study how the topological properties of an airline’s network (such as the spectrum between hub-and-spoke and point-to-point) affect its robustness and compatibility with various recovery strategies.
Any airline recovery approach developed in a research environment must meet an airline’s operational needs before the airline can deploy it. In practice, recovery solutions are generated every time the airline discovers new information about an ongoing disruption, and previous decisions can be reverted if needed (Hassan et al., 2021). This usage philosophy requires recovery solvers to generate feasible solutions quickly because otherwise, the airline could fall behind on rescheduling efforts and incur unnecessary downstream disruptions. For example, the rapid influx of information was likely to have overwhelmed Southwest Airlines’ schedule solvers during their 2022 scheduling crisis (Murray, 2023). Specifically, most airline schedulers expect operational disruption models to provide good solutions at the fleet level in 1–2 min (Vink et al., 2020). Therefore, the execution speed of airline recovery algorithms is critical for their practical usability and reliability. However, a majority of prior work on recovery algorithms fails to meet this expectation, even on small-scale synthesized scenarios with fewer than 100 aircraft (Hassan et al., 2021). Furthermore, conventional practice in schedule recovery tends to evaluate developed algorithms on a single set of inputs and neglect the practice of repeated algorithm execution as a disruption unfolds and as the algorithm’s previous decisions take effect. We envision RecovAir as a novel platform that enables researchers to predict the real-world performance of recovery strategies as they are repeatedly applied to an emerging large-scale disruption over time.
2 Materials and methods
Overall, RecovAir is an agent-based model where Crew agents operate Aircraft resources carrying passengers according to Flight plans while following throughput limits imposed by Disruptions and Airport infrastructure. As each simulation suffers from delayed and canceled flights, an Aircraft Selection Strategy and a Crew Selection Strategy are employed to attempt to recover upcoming flights with missing resources. As the simulation takes place, it outputs events to the Metrics Processor, which computes Key Performance Indicators (KPI) from those events. To minimize computational overhead for potential downstream interactive applications for airline schedulers as well as accurate measurement of recovery algorithm runtime, RecovAir is built in the Rust programming language and designed to execute as efficiently as possible on modern hardware. We present an overview of RecovAir’s components in Figure 3 and describe each component in detail below.
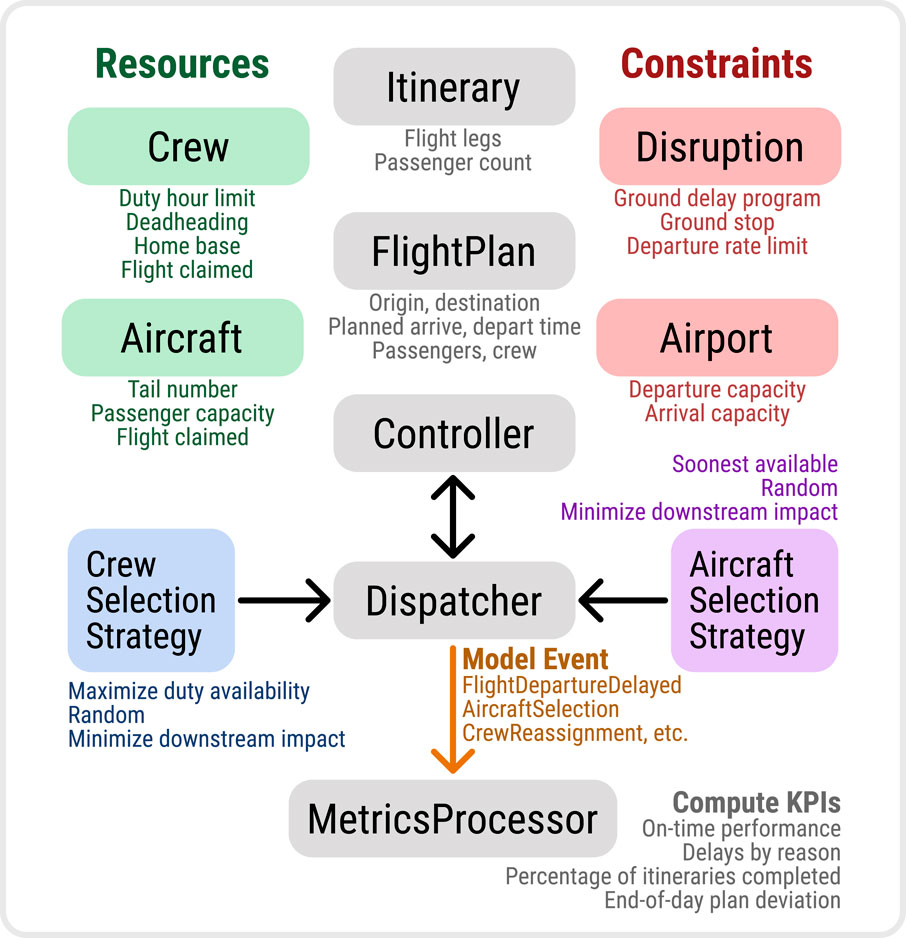
Figure 3. A visual overview of the components comprising the RecovAir agent-based model.
2.1 Scenarios
RecovAir simulates interactions between resources, flights, itineraries, constraints, and recovery strategies within a provided scenario. In this model, a scenario contains a start and end time in UTC, initial aircraft locations, initial crew locations, scheduled flights with optional aircraft and crew assignments, passenger demand by flight segment, disruptions in the form of throughput limits, model parameters (see Table 1), and recovery strategy selections. Together, these properties define an initial world state to simulate from and recovery strategy for the model to follow. Since we do not have access to actual crew locations, crew assignments, and passenger itineraries, we synthesize them based on public flight data from U.S. Bureau of Transportation Statistics (2024) in Section 2.8.
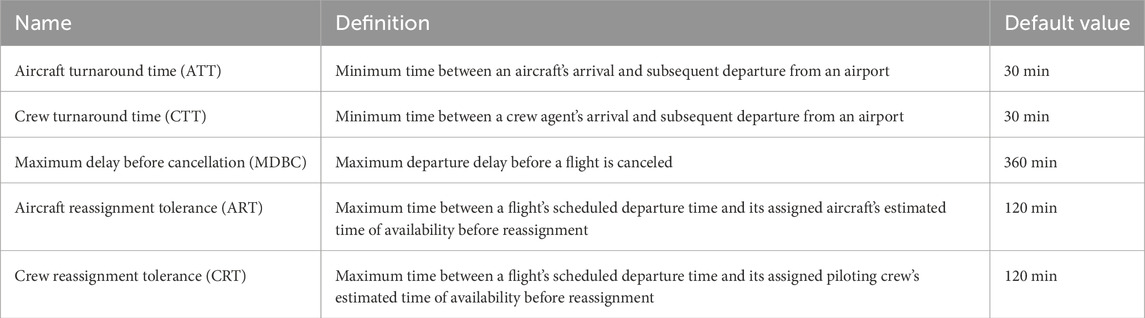
Table 1. Summary of all RecovAir model parameters along with their default values during our validation experiments.
2.1.1 Resources
Every flight requires resources to be executed. In RecovAir, resources refer to aircraft and crew. Each aircraft has a uniquely identifying tail number (like N947WN), location (either airborne operating a flight or at an airport), aircraft type, and passenger capacity. Each crew agent has a unique ID, location, and a flight duty history that is used to ensure compliance with crew rest regulations. Note that to simplify the model, each crew agent represents an entire team of crew members (pilot, co-pilot, cabin crew) necessary to operate one flight.
2.1.2 Flights
Flights within a scenario correspond with the airline’s flight plans. Each flight must include an origin, destination, flight number, scheduled departure time, and scheduled arrival time. Upon execution, each flight may include an assigned aircraft and a collection of assigned crew (with an indication of who is piloting), but these assignments are subject to change in the simulation. Each executed flight’s actual departure and arrival times are also recorded.
2.1.3 Itineraries
Itineraries help model the impact of disruptions on passenger trips. Each itinerary consists of a complete path of flight segments (such as SAN-LAS-DTW) and the number of booked passengers under that path. This formulation helps capture the potential impact of a disruption to multi-leg itineraries, such as missed connections.
2.1.4 Constraints
Disruptions and practical throughput limits at airports constrain network performance. Disruptions model the impact of events like inclement weather, National Airspace System (NAS) congestion, and airport construction on an airline network. In RecovAir, all disruptions are expressed in terms of national Air Traffic Management initiatives: Ground Delay Programs (GDP) and Departure Delay Programs (DDP). A GDP at an airport delays the departure of flights toward that airport, while a DDP at an airport delays the departure of flights from that airport (U.S. Federal Aviation Administration, 2023). Each modeled GDP includes the airport affected, time range where it takes effect, and the maximum number of cumulative arrivals to the airport by the end of each hour during the time range. Each DDP has the same structure but constrains cumulative departures at the affected airport instead. A Ground Stop is represented as a GDP with a maximum cumulative arrival count of 0. Beyond irregular disruptions, each airport has an hourly capacity limit for the simulated airline’s departures and arrivals, which is designed to model limitations from the airport’s airspace and runways. Both disruptions and airport throughput limits can delay the departure and the arrival of a flight.
RecovAir is designed to fit into an airline’s existing scheduling workflows. We assume that airlines have a database of flight plans, aircraft assignments, crew assignments, and passenger itineraries that can be extracted and translated into a RecovAir scenario. As such, RecovAir stores and retrieves scenarios from a SQLite database with 8 tables.1
2.2 Model parameters
The precise execution of RecovAir depends on the value of various user-tunable parameters. We enumerate the parameters and default values used in our validation runs in Table 1. The Aircraft turnaround time (ATT) and Crew turnaround time (CTT) parameters follow a conventional definition of turnaround time among flight network simulation models: it specifies the minimum time between an aircraft or crew agent’s arrival and subsequent departure from an airport. The Maximum delay before cancellation (MDBC) parameter specifies the maximum threshold for departure delays—any flight whose departure delay exceeds the MDBC value is automatically canceled. Finally, the Aircraft reassignment tolerance (ART) and Crew reassignment tolerance (CRT) parameters control the eagerness of the dispatcher to invoke the scenario’s aircraft and crew recovery strategies in response to a flight delay due to a delayed incoming resource. If a flight
2.3 Slot manager
Each GDP, DDP, and airport capacity constraint issues clearances according to a slot manager, which reserves and maintains slots for flights to arrive or depart. This mimics how the U.S. Federal Aviation Administration (2023) executes GDPs, where traffic managers may assign arrival slots to affected flights in order to provide Estimated Departure Clearance Times (EDCT). It is also analogous to the ATFM regulation queue implemented in SESAR’s models (Gurtner et al., 2021). We had previously implemented the slot manager such that it restricts the number of departures and arrivals each hour at each airport to their observations in reality, but results demonstrated that this method was too rigid (Peng et al., 2024). Instead, we implemented a cumulative slot manager that limits the total number of slots assigned by the end of each hour, which we describe in detail as follows:
Denote the approximate number of slots to allocate in each hour
2.4 Controller
The controller is responsible for applying constraints and executing departures and arrivals. When preparing for a flight’s departure, it finds the earliest departure time such that the flight can be accommodated by all relevant constraints through available departure and arrival slots. To execute departures and arrivals, it updates the state of all relevant resources and the flight itself, including the actual departure time, the aircraft’s location, the crew’s location, and the collection of resources at the origin and destination airports. When executing departures, it captures passengers at the origin airport whose next leg aligns with the flight. When executing arrivals, it releases passengers with remaining legs at the destination airport.
2.5 Dispatcher
The dispatcher is RecovAir’s program entry point and manages its flow of control according a Discrete Event Simulation pattern. It is responsible for operating each flight by assigning resources and checking against constraints. It also coordinates recovery efforts through resource reassignments. Similar to SimAir’s Event Queue (Rosenberger et al., 2000), it consumes expected departure and arrival events from a central priority queue where earlier events have higher priority. When the model begins, a departure event is generated for each flight at its scheduled departure time. Its procedure for preparing for the departure of a flight
Algorithm 1.Departure Dispatch Procedure.
1: procedure CheckDepart(
2:
3:
4:
5: if
6: if
7:
8: end if
9: if
10: DelayDeparture(
11: else
12: set assigned aircraft of
13:
14:
15: Push(eventQueue, (CheckDepart,
16: end if
17: end if
18:
19: if
20:
21: if
22: DelayDeparture(
23: else
24: set assigned piloting team of
25:
26: Push(eventQueue, (CheckDepart,
27: end if
28: end if
29:
30: if
31:
32: if
33: CancelFlight(
34: return
35: else
36: Push(eventQueue, (CheckDepart,
37: return
38: end if
39: end if
40: InitiateFlight(controller,
41: Push(eventQueue, (CheckArrive,
42: end procedure
No collection of resources is necessary for flight arrivals, but the controller may delay an arrival due to arrival capacity constraints at the destination airport. If the controller issues a delay, the dispatcher schedules an arrival preparation event after the issued delay into its priority queue. Otherwise, it directs the controller to execute the arrival.
Since the dispatcher consumes timestamped events in an increasing order, and since there are no time-bound tasks outside the dispatcher, it also controls the model’s timestamp. Before executing each task from the event queue, it sets the model’s timestamp to the task’s scheduled time.
2.6 Recovery strategies
Implementing complex state-of-the-art Integrated Recovery approaches is beyond the scope of the RecovAir project, so we have chosen to implement two relatively simple greedy approaches. Given a flight
Alternatively, the Depth-First Search (DFS) recovery strategy seeks to maximize the assignment of surplus aircraft to unfulfilled flights. When a flight
Figure 4 illustrates a small-scale solution generated by the DFS recovery strategy. In Figure 4, recovered aircraft are located at DEN (red), MCI (green), MDW (blue), and SLC (orange), and each aircraft’s newly assigned flight string corresponds with its color.

Figure 4. A sample solution graph for the Depth-First Search (DFS) recovery strategy. The solution assigns flight strings to four surplus aircraft at DEN, MDW, MCI, and SLC, respectively, where each aircraft’s current location and assigned flight string legs have the same color. Grey connections represent flights that were not recovered from the unfulfilled flight set
2.7 Metrics processor
The dispatcher and controller emit model events through a shared asynchronous channel in the Rust programming language. Examples of model events include flight departures, arrivals, delays for a specified duration due to a specified reason, cancellations, resource reassignments, and simulation completion. During initialization, the model launches a separate metrics processing thread that receives these model events and updates its internal records for computing KPIs. When the simulation finishes, it passes these records back to the model. KPIs calculated by the metrics processor are listed as follows:
2.8 Scenario synthesizer
RecovAir scenarios call for initial aircraft locations, crew locations, and passenger itineraries. To validate and demonstrate the model experimentally without access to proprietary airline data, we synthesize plausible scenarios using publicly available flight, passenger market, and aircraft data from the Bureau of Transportation Statistics (BTS) (U.S. Bureau of Transportation Statistics, 2024) and the U.S. FAA. In general, RecovAir scenarios represent reproducible, standardized problems on which recovery strategies can be evaluated and compared.
2.8.1 Flight plans
Flight plans are derived from the Airline On-Time Performance Data tables from U.S. Bureau of Transportation Statistics (2024), which describe revenue-generating domestic flight outcomes in the U.S. Once filtered by date and airline, items from the domestic non-stop flights table are directly translated into flights in a synthesized scenario, where the initially assigned aircraft is the actual aircraft that executed each flight.
2.8.2 Aircraft
Aircraft locations can be derived from the same BTS flights table as the flight plans. Once filtered by date and airline, each unique tail number under the TAIL_NUM column in the BTS flights table corresponds to an aircraft in a synthesized scenario. Each aircraft’s starting location is the origin of its first scheduled flight over the simulation time frame. Each aircraft’s capacity is determined by looking up its tail number in the FAA aircraft registry2 and mapping the resultant aircraft type to the number of seats used by the airline.3.
2.8.3 Initial crew locations
A lower bound for the number of crew agents at each airport can be derived from the BTS flights table. For each airport, we scan through all departures and arrivals in their order of scheduled occurrence while tracking a resource counter
2.8.4 Airport throughput limits
Each airport’s throughput limits in a synthesized scenario are set according to the airline’s maximum number of departures and arrivals achieved in an hour during the month containing the simulation timeframe. For example, for a scenario on 28 January 2024, if the airline once executed 20 departures within an hour and never exceeded that number in January 2024, then our model would only let up to 20 flights depart from SFO every hour. This likely underestimates the true airport capacity, as departure and arrival frequency heavily depends on the month in which they are counted due to seasonal changes in travel demand (Kaewunruen et al., 2021). These estimations can certainly be improved by incorporating previous work focused on airport capacity predictions, e.g., Ramanujam and Balakrishnan (2015), Ramanujam and Balakrishnan (2009).
2.8.5 Passenger demand
Model scenarios require passenger demand to be expressed in terms of possibly multi-leg itineraries, which are generally not publicly available. However, BTS publishes a relevant database named Air Carrier Statistics (Form 41 Traffic) that contains monthly domestic flight market and segment data by airline. The domestic market data lists the number of passengers enplaned by Origin-Destination (OD) pairs on their bookings, while the domestic segment data lists the number of passengers enplaned by OD pairs on each non-stop flight segment. The complete path (like SFO-DEN-MCI) of each booked OD pair (like SFO-??-MCI) is estimated by finding the shortest path from the origin to the destination on a graph where each edge corresponds to an OD pair in the domestic segment data and is weighted using the flight segment’s straight-line distance. The assumptions underlying this estimation approach can be improved. Future work could seek to optimize synthesized itineraries using integer programming (Wang and Jacquillat, 2020).
2.8.6 Disruptions
We approximate potentially disruptive constraints on the simulated airline using the number of departures and arrivals in each hour at each airport in its network. For each airport, we generate a Departure Delay Program corresponding to the actual number of departures and generate a Ground Delay Program corresponding to the actual number of arrivals at that airport over the simulation timeframe. For instance, if 13 departures from DEN were recorded in the BTS dataset from 20:00 to 21:00 UTC on 28 January 2024, then the rough number of slots to allocate to this hour in DEN’s Departure Delay Program (denoted
2.8.7 Synthesizer script
All of the data processing described in the paragraphs above are implemented using Python and Pandas in a script. The script is used to synthesize experimental scenarios for 22 December 2022 (the beginning of Southwest’s scheduling crisis) and 28 January 2024 (a calm day for Southwest with zero cancellations).
2.9 Simulation validation
Using the synthesized experimental scenarios from the Synthesizer script, we validate RecovAir by comparing traffic throughput at selected airports and Key Performance Indicators (KPIs) between simulated and actual flight outcomes. To evaluate our synthesized disruptions’ impact, we then remove all disruptions and repeat this comparison. To demonstrate RecovAir’s ability to help airlines explore trade-offs between delays and cancellations, we repeat these comparisons while adjusting the dispatcher’s MDBC parameter value between 10 min and 6 h. On the lower end, we chose 10 min to represent a scenario where nearly no meaningful delay is tolerated; in fact, since the OTP metric considers a flight to be on time if it is delayed for less than 15 min, the OTP metric from this scenario coincides with the percent of scheduled flights operated. On the upper end, we chose 6 h based on true delay distributions at Southwest Airlines according to the BTS flights table: from December 20 to 31 December 2022, only about 0.21% of all flights operated by Southwest were delayed by over 6 h. We perform the steps above using both ENAT and DFS as recovery strategies and compare their performance for 22 December 2022 and 28 January 2024.
3 Results
3.1 Traffic throughput comparison
Figure 5 compares the number of departures and arrivals per hour at Denver (DEN) and Chicago Midway (MDW) on 22 December 2022 between simulated and actual outcomes both with and without synthesized disruptions under the ENAT recovery strategy. Figure 5 shows that our synthesized disruptions successfully ensured that simulated departures and arrivals during each hour roughly matched their actual observed numbers at each airport, which validates our implementation of the slot manager in Section 2.3 and illustrates RecovAir’s disruption mechanism of throughput limitation in action.
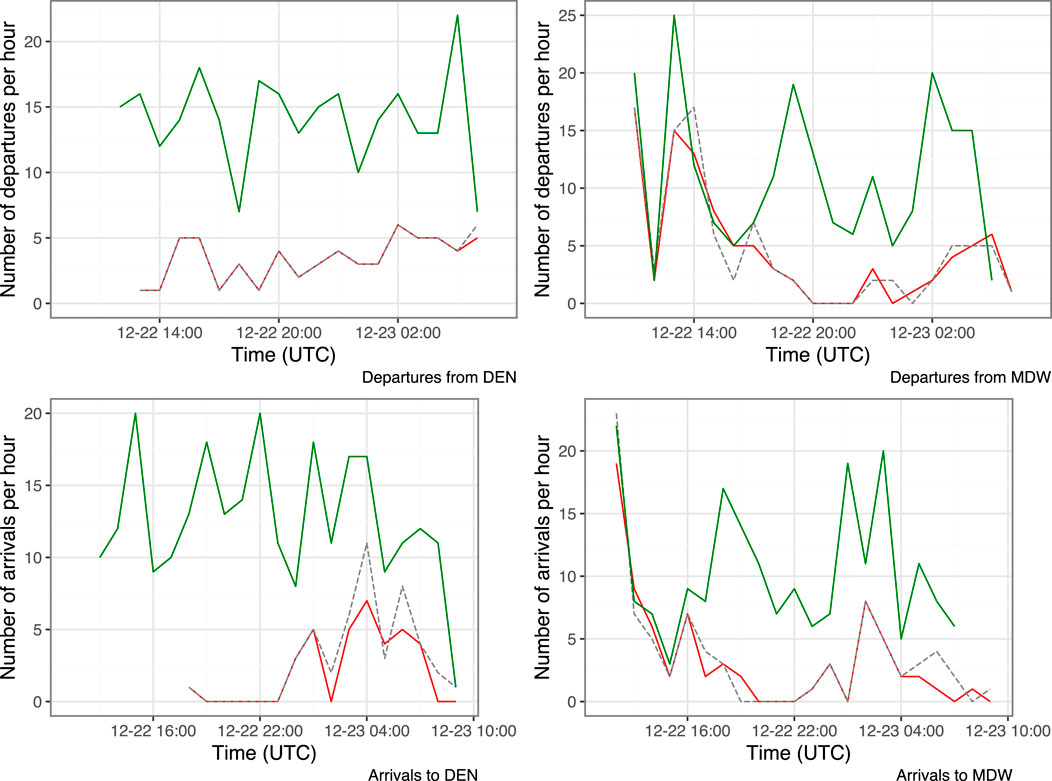
Figure 5. Actual and simulated traffic throughput at DEN and MDW on 2022-12-22 (during scheduling crisis). Simulated results without synthesized disruptions are shown in green. Simulated results with synthesized disruptions are shown in red. Outcomes recorded in the BTS dataset are shown in grey.
3.2 KPI comparison
Tables 2, 3 compare final KPI measurements between simulated and actual outcomes for both 22 December 2022 and 28 January 2024 under the ENAT recovery strategy. Favorable results from the Simulated (No Disruptions) column confirm the integrity of Southwest’s flight schedule under ideal conditions, which helps verify the model’s implementation. For the 2022 scenario, the ENAT recovery strategy is able to approach the results achieved by Southwest, with roughly 12.8% more minutes of delay, 15.9% more cancellations, and an OTP reduction of about 2%. Notably, ENAT achieved this without initiating any ferry flights, whereas Southwest Airlines executed about 1,500 ferry flights on 22 December 2022 (SWAPA Schedule Research Committee, 2023). For the 2024 scenario, however, the ENAT recovery strategy performed significantly worse than reality, with more than double the amount of total departure delay and six cancellations despite greater resource utilization. Based on our analysis of the model’s logs, the cancellations arose from international and ferry flights, which are untracked by the BTS dataset. The absence of these flights led to cascading delays across the network and is responsible for the increase in total delay. Thus, the discrepancy between simulated and actual outcomes results from inadequate data, not a deficiency in the model’s logical implementation.
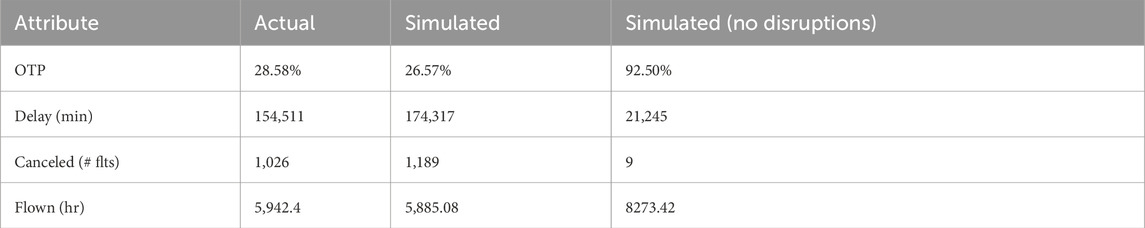
Table 2. Simulated and actual KPI comparison for 2022-12-22 (during the scheduling crisis) using the ENAT recovery strategy.
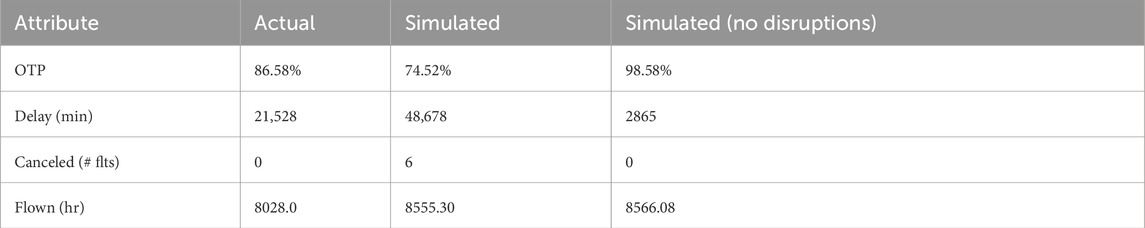
Table 3. Simulated and actual KPI comparison for 2024-01-28 (on a “good” day) using the ENAT recovery strategy.
Flight plans given to RecovAir should originate from a schedule solver and satisfy all of its constraints on resource connectivity, crew rest requirements, and airport capacity limits. Therefore, we expect that without any disruptions, RecovAir should produce nearly perfect results (i.e., nearly 0 cancellations and rare delays). However, our results under the Simulated (No disruptions) column in Table 2 contradicts this expectation due to a limitation with BTS data. Delays and cancellations in the absence of disruptions often arise from resource discontinuities (where, for instance, the destination of an aircraft’s flight does not match the origin of its next flight), but Southwest’s first flight schedule for 22 December 2022 probably did not have any discontinuities, so our subpar results without disruptions show that the BTS flights table does not precisely reflect Southwest’s initial flight plans. This is because the BTS flights table is a post hoc snapshot of the flights after real-world disruptions take effect—it shows the last aircraft assignment for each flight rather than the first one. The BTS flights table also omits ferry flights and international flights. Thus, the aircraft discontinuities in the BTS flights table for 22 December 2022 result from the absence of Southwest’s international flights to Central America and their
In Table 3, the simulated outcomes had more cancellations than reality but also had significantly more airborne hours, which indicates greater utilization of resources. This contradiction exists because while many Southwest flights had a shorter airborne time than scheduled, flights in RecovAir cannot arrive before the scheduled duration elapses from their departure time. On 10 December 2022, a typical day for Southwest, about 19% of all flights were airborne for at least 10 min less than their scheduled duration, and the sum of scheduled flight durations was about 6.1% greater than the sum of actual flight durations. Likewise, Table 3 shows that the sum of flight durations from RecovAir with disruptions is about 6.6% greater than the sum of actual flight durations. This suggests an opportunity to enhance RecovAir’s realism by sampling each flight’s minimum duration from its duration distribution over time to counter non-trivial impacts from scheduled block time (SBT) setting, and practices of schedule padding Wang et al. (2019); Yimga and Gorjidooz (2019).
3.3 Recovery strategy comparison
Tables 4, 5 display the same KPIs as Tables 2, 3 under the DFS recovery strategy and show the strengths and weaknesses of DFS relative to ENAT. Applying DFS led to worse outcomes in the 2024 scenario and better outcomes under OTP and delay in the 2022 scenario. By construction, our DFS implementation relies on an abundance of cancellations because they add more edges to its unfulfilled flights graph. Since the 2024 scenario did not contain many cancellations (it was the “good” day), DFS’s unfulfilled flights graph was less dense, so fewer paths through the graph were available to idle aircraft. Conversely, in the 2022 scenario (during the scheduling crisis), DFS outperformed ENAT in OTP and total delay at the expense of canceling more flights. This also reflects the choices we made in its implementation: DFS prunes its search space by applying an upper bound of 2 h on incurred delay per flight assignment, which tends to reduce overall delay. Like the ENAT strategy, the DFS strategy’s performance also approached actual outcomes achieved by Southwest: it improved OTP by 1.5% and reduced total delay by about 5.8% but produced about 28.8% more cancellations.
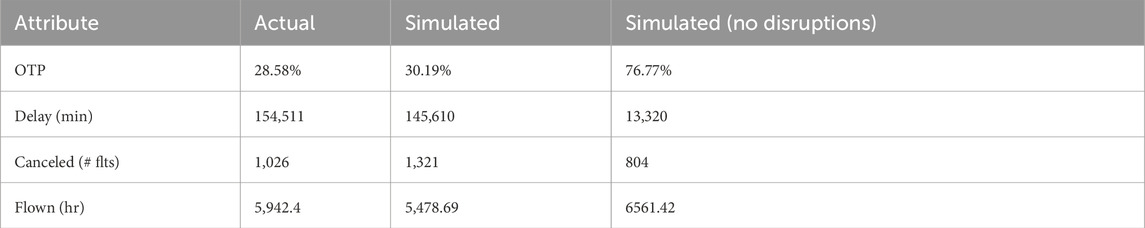
Table 4. Simulated and actual KPI comparison for 2022-12-22 (during the scheduling crisis) using the DFS recovery strategy.
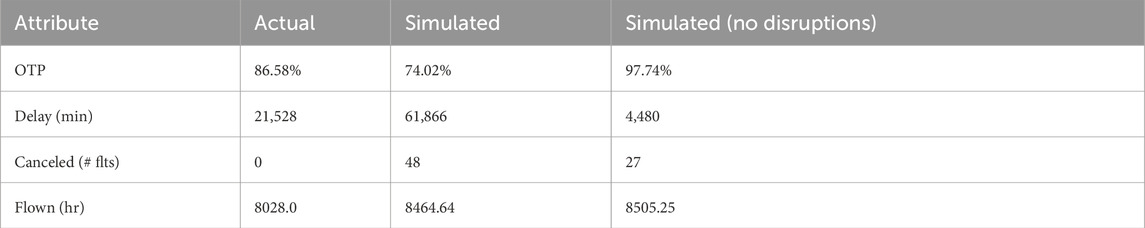
Table 5. Simulated and actual KPI comparison for 2024-01-28 (on a “good” day) using the DFS recovery strategy.
3.4 Delay-cancellation trade-off
Figure 6 explores the trade-off between delays and cancellations under both ENAT and DFS by plotting total minutes of delay against total cancellations while varying the maximum delay before cancellation parameter, which is not specific to any recovery strategy. They show a moderate inverse relationship between total minutes of delay and additional cancellations beyond a baseline number (approximately 1,100 for the 2022 scenario and approximately 0 for the 2024 scenario). The first graph shows that DFS begins outperforming ENAT at 6 h of maximum delay per aircraft, suggesting that setting the maximum delay parameter to 7 h might further reduce cancellations and bring its results closer to actual outcomes. The second graph shows that DFS consistently underperforms ENAT for the 2024 scenario throughout our range of max delay parameter values, which aligns with our findings in Tables 3, 5. As simple and greedy recovery algorithms built to demonstrate RecovAir’s utility, both DFS and ENAT fall short of Southwest’s actual outcomes regardless of the value of the maximum delay before cancellation parameter. However, this experiment suggests that with all proprietary data and recovery algorithms, an airline can employ RecovAir to evaluate the delay-cancellation tradeoff for specific upcoming scenarios.
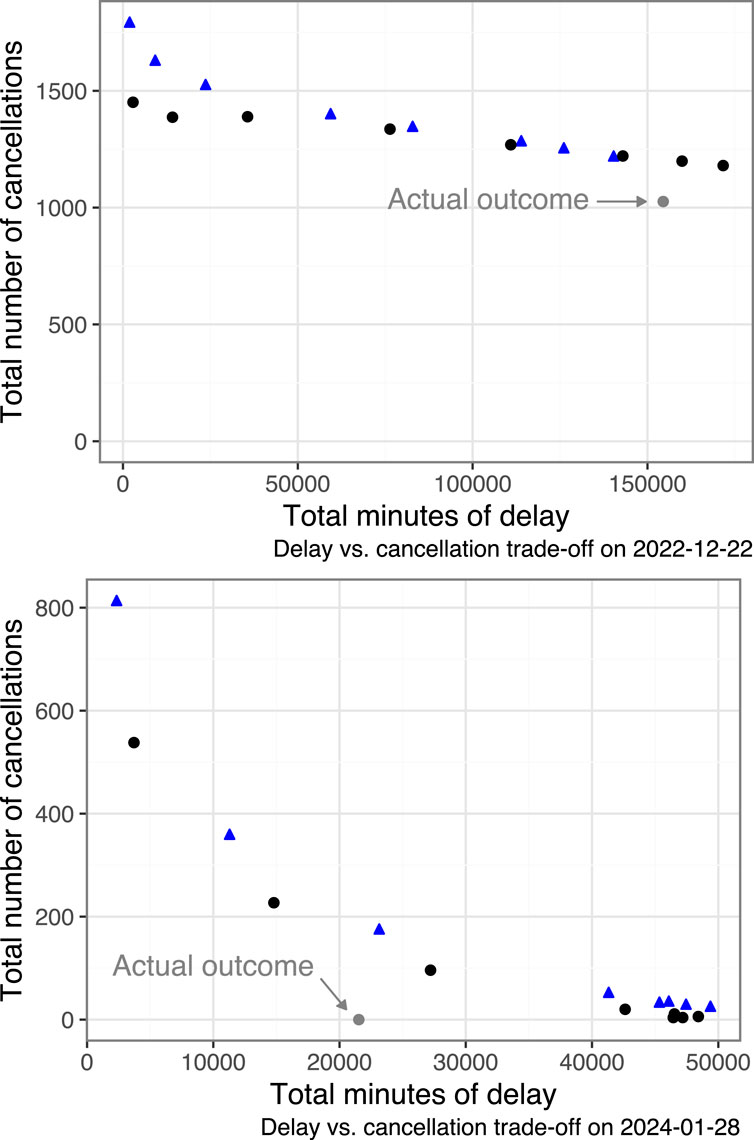
Figure 6. Resultant delays vs cancellations while adjusting the maximum delay before cancellation parameter. Black circles display ENAT outcomes, while blue triangles display DFS outcomes.
3.5 Model runtime
We ran the RecovAir model several times to generate the aforementioned results. In every run, the model processed between 3,900 and 4,000 flights over timestamps spanning about 28 h (accounting for arrivals in more western timezones) in under 1 s on a M2 MacBook Air with 16 GB of RAM. This shows that our efforts to design RecovAir for efficient execution have been successful. It shows that RecovAir can feasibly be used as an evaluator function in place of single objectives in applications of heuristic algorithms to schedule recovery and robustness (Xu, 2024). It also shows our model’s potential in supporting interactive, iterative schedule refinement for airline schedulers.
4 Discussion
The serious consequences of Southwest Airlines’ December 2022 scheduling crisis reminds us that robust disruption recovery is imperative to large-scale modern airline operations. Developing improvements to disruption recovery strategies and protocols is thus a highly relevant objective for operations researchers and airlines. To help them estimate the performance of recovery strategies when deployed in response to an emerging disruption, as well as evaluate flight network robustness, we have developed RecovAir, an agent-based model that simulates the flow of aircraft, crew, and passengers in an airline’s flight network under capacity constraints and recovery strategies.
We have shown that RecovAir can simulate historical scenarios constrained by departure and arrival throughput under a recovery strategy while measuring resultant total cancellations, minutes of delay, and On-Time Performance. It can serve as a forecasting tool that helps airline schedulers evaluate and compare strategies for specific upcoming disruptions by simulating the airline’s flight schedule, cancellation packages, and expected traffic constraints. By evaluating two simple recovery strategies using RecovAir, we have shown that researchers can use it to benchmark and compare the performance of different recovery strategies as they are applied in practice. By conducting a controlled experiment that varies a recovery parameter, we have shown that schedulers can explore decision-making trade-offs and calibrate recovery strategies to achieve their desired trade-off.
Our experiments also demonstrate RecovAir’s utility for evaluating schedule robustness. According to the definition of schedule robustness by Clausen et al. (2010), robust schedules show low sensitivity to disruptions. RecovAir can be used to estimate the sensitivity of schedules to specific disruptions by holding a scenario’s disruptions constant, varying its schedule inputs, and observing the change in measured KPIs. As aforementioned, the quick runtime of RecovAir enables it to be embedded in schedule robustness studies employing heuristic algorithms, where one or multiple KPIs can be selected as the objective of a neighborhood search, simulated annealing procedure, genetic algorithm, or policy optimization in reinforcement learning. Its quick runtime also makes it a compelling candidate for supporting interactive tools for airline schedulers, as explored in Section 5.
As surveyed by Wu et al. (2024), airline recovery research tends to focus on the precise problem of quickly generating close-to-optimal solutions that minimize operational cost in a static disruption scenario. In reality, though, airlines can underestimate the scale and impact of an upcoming disruption (Hassan et al., 2021). As the disruption evolves, they may need to continuously readjust their recovery plan to accommodate new limitations and unexpected delays. How should airlines prepare to adapt their recovery plans, and how should they decide what to do when disruptions end up worse than expected? RecovAir does not offer a competitive policy for making this decision, but it creates a unified platform where candidate policies can be fairly evaluated and compared as they contend with each airline’s network structure under unexpectedly severe disruptions. RecovAir thus contributes to the development of tactical, adaptive, and lightweight recovery policies applied during a disruption as it evolves.
4.1 Limitations
As a first proof-of-concept, RecovAir can benefit from many improvements to its construction. A fundamental limitation of our work in validating RecovAir is the lack of high-quality data. Without access to proprietary crew scheduling and passenger itinerary data at Southwest Airlines, we are left to synthesize the initial crew distribution and passenger itinerary set based on publicly observable statistics. Our synthesis method relies on strong assumptions that are unlikely to hold in practice. For instance, many multi-leg itineraries do not minimize travel distance in the airline’s flight network but instead favor “focus cities” that cover the destination of interest. We have most likely underestimated the initial crew availability for focus cities and overestimated it for remote destinations. Furthermore, our flight data captures the state of Southwest’s schedule after the disruption, which may be very different from its initial plans. Therefore, our results should not be interpreted as support for applying ENAT and DFS in practice—they were merely devised to demonstrate RecovAir’s ability to evaluate recovery strategies. We also emphasize that, similar to machine learning approaches, agent-based models can also be viewed as black box models due to their reliance on stochastic simulations (Topping et al., 2010). Future work to provide more rigorous guarantees (e.g., Vandin et al., 2022), although out of scope for this paper, could be considered.
5 Concluding remarks and future work
Motivated by the Southwest Airlines scheduling crisis of December 2022, and the difficulties of running large-scale simulation models that reflect complexities of an airline’s network, we propose a lightweight, agent-based simulation model to help airlines rapidly evaluate and assess responses to disruptions. Our model, RecovAir, does not require any proprietary crew scheduling data. Furthermore, as a part of demonstrating the utility of RecovAir, we have built a prototype of a user interface (UI) for airline schedulers to create scenarios, replay simulation runs, and inspect resultant KPIs using RecovAir. A screenshot of this UI is shown in Figure 7. Improvements to this UI could enable airline schedulers to manually intervene in recovery decisions, inspect causal chains behind specific delays and cancellations, as well as conduct controlled trade-off experiments.
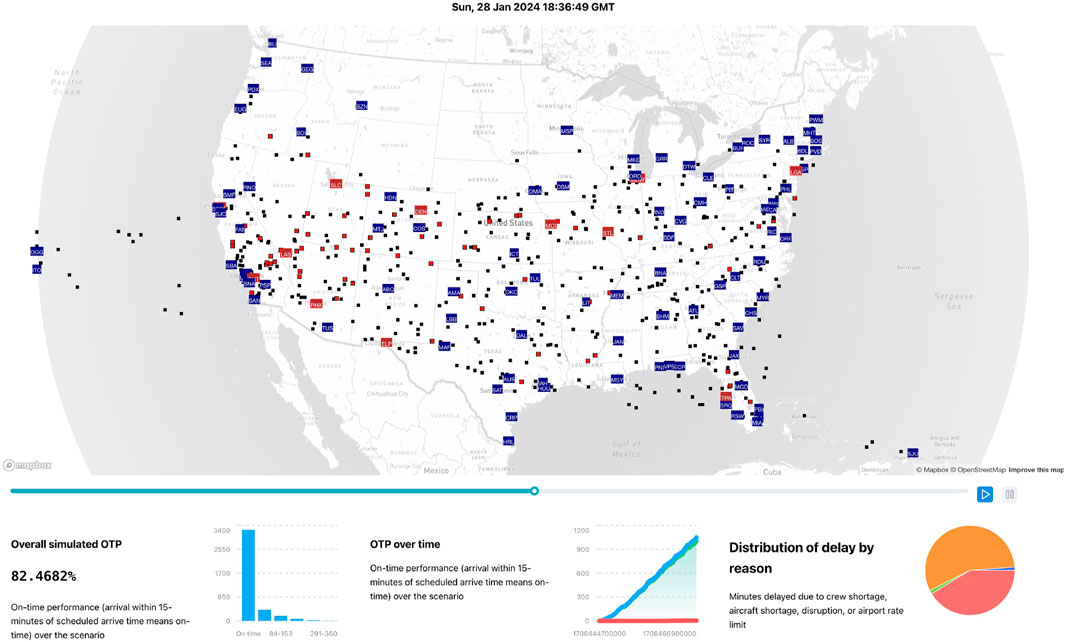
Figure 7. A screenshot of a user interface we built for schedulers to make use of RecovAir.
Following similar work by Gurtner et al. (2021), future work can incorporate passenger-centric KPIs like delay distributions and apply cost modeling to simplify optimization. Fuel, maintenance, curfew, and airspace costs can be incorporated to achieve a higher-fidelity representation of an airline’s scheduling priorities. To model uncertainty toward how a disruptive event might develop, improvements to realism could include probabilistic mechanics backed by realistic distributions, such as in Wang et al. (2021). Given the complications of booking hotels for crew members (SWAPA Schedule Research Committee, 2023), airlines often prefer to have crew members return to their home base at the end of each crew pairing (Medard and Sawhney, 2007). This preference (or soft constraint) could be modeled in an extension of RecovAir where each crew agent seeks to select flight strings that return them to their home base before they reach their duty limit. With higher-quality data, future work can conduct sensitivity analyses and parameter sweeps to calibrate model performance against a particular airline.
Another promising avenue for exploration is leveraging the granular nature of RecovAir’s simulation results for causal reasoning. With minor additions to the model that track the causal chain behind each delay or cancellation, future work could use the model to trace the observed disruption of a specific flight back to its roots, similar in spirit to backpropagation in feedforward neural networks. Such causal analysis can support future work on disruption propagation and measuring schedule robustness. We encourage airlines and researchers to apply and build upon RecovAir4 for their own use cases.
Data availability statement
The datasets presented in this study can be found in online repositories. The names of the repository/repositories and accession number(s) can be found below: https://github.com/broad-well/recovair-abm.
Author contributions
MP: Conceptualization, Data curation, Formal Analysis, Investigation, Methodology, Software, Validation, Visualization, Writing – original draft, Writing – review and editing. ML: Conceptualization, Project administration, Supervision, Writing – original draft, Writing – review and editing.
Funding
The author(s) declare that no financial support was received for the research and/or publication of this article.
Acknowledgments
The authors would like to thank an airline dispatcher for their guidance on model design. The authors would also like to thank Armaan Kamat, Van Tran, and Charles Dawson for their inputs.
Conflict of interest
The authors declare that the research was conducted in the absence of any commercial or financial relationships that could be construed as a potential conflict of interest.
Generative AI statement
The author(s) declare that no Generative AI was used in the creation of this manuscript.
Publisher’s note
All claims expressed in this article are solely those of the authors and do not necessarily represent those of their affiliated organizations, or those of the publisher, the editors and the reviewers. Any product that may be evaluated in this article, or claim that may be made by its manufacturer, is not guaranteed or endorsed by the publisher.
Footnotes
1The full schema for these tables is available on GitHub.
2FAA aircraft registry.
3Southwest’s aircraft types and seat configurations.
4GitHub repository: https://github.com/broad-well/recovair-abm
References
Bouarfa, S., Blom, H. A., Curran, R., and Everdij, M. H. (2013). Agent-based modeling and simulation of emergent behavior in air transportation. Complex Adapt. Syst. Model. 1, 15–26. doi:10.1186/2194-3206-1-15
Burke, E. K., De Causmaecker, P., De Maere, G., Mulder, J., Paelinck, M., and Vanden Berghe, G. (2010). A multi-objective approach for robust airline scheduling. Comput. and Operations Res. 37, 822–832. doi:10.1016/j.cor.2009.03.026
Clausen, J., Larsen, A., Larsen, J., and Rezanova, N. J. (2010). Disruption management in the airline industry—concepts, models and methods. Comput. and Operations Res. 37, 809–821. doi:10.1016/j.cor.2009.03.027
Cook, A., Tanner, G., Cristóbal, S., and Zanin, M. (2012). Passenger-oriented enhanced metrics. Second SESAR Innov. Days. Available online at: https://www.sesarju.eu/sites/default/files/documents/sid/2012/SID%25202012-07.pdf.
Delgado, L., Gurtner, G., Mazzarisi, P., Zaoli, S., Valput, D., Cook, A., et al. (2021). Network-wide assessment of atm mechanisms using an agent-based model. J. Air Transp. Manag. 95, 102108. doi:10.1016/j.jairtraman.2021.102108
Ding, Y., Wandelt, S., Wu, G., Xu, Y., and Sun, X. (2023). Towards efficient airline disruption recovery with reinforcement learning. Transp. Res. Part E Logist. Transp. Rev. 179, 103295. doi:10.1016/j.tre.2023.103295
Gurtner, G., Delgado, L., and Valput, D. (2021). An agent-based model for air transportation to capture network effects in assessing delay management mechanisms. Transp. Res. Part C Emerg. Technol. 133, 103358. doi:10.1016/j.trc.2021.103358
Hassan, L., Santos, B. F., and Vink, J. (2021). Airline disruption management: a literature review and practical challenges. Comput. and Operations Res. 127, 105137. doi:10.1016/j.cor.2020.105137
Kaewunruen, S., Sresakoolchai, J., and Xiang, Y. (2021). Identification of weather influences on flight punctuality using machine learning approach. Climate 9, 127. doi:10.3390/cli9080127
Kim, Y. J., Pinon-Fischer, O. J., and Mavris, D. N. (2015). “Parallel simulation of agent-based model for air traffic network,” in AIAA modeling and simulation technologies conference, 2799.
Lee, J., Lee, K., and Moon, I. (2022). A reinforcement learning approach for multi-fleet aircraft recovery under airline disruption. Appl. Soft Comput. 129, 109556. doi:10.1016/j.asoc.2022.109556
Li, Q., Jing, R., and Dong, Z. S. (2023). Flight delay prediction with priority information of weather and non-weather features. IEEE Trans. Intelligent Transp. Syst. 24, 7149–7165. doi:10.1109/TITS.2023.3270743
Medard, C. P., and Sawhney, N. (2007). Airline crew scheduling from planning to operations. Eur. J. Operational Res. 183, 1013–1027. doi:10.1016/j.ejor.2005.12.046
Meyn, L., Romer, T., Roth, K., Bjarke, L., and Hinton, S. (2004). “Preliminary assessment of future operational concepts using the airspace concept evaluation system,” in AIAA 4th aviation technology, integration and operations (ATIO) forum, 6508.
Murray, C. (2023). Strengthening airline operations and consumer protections. Written testimony presented before the United States Senate
Peng, M., Kamat, A., Tran, V., Dawson, C., Fan, C., and Li, M. Z. (2024). “Probing and modeling large-scale airline network disruptions: 2022 Southwest Airlines scheduling crisis,” in 34th congress of the international council of the aeronautical sciences.
Petersen, J. D., Sölveling, G., Clarke, J.-P., Johnson, E. L., and Shebalov, S. (2012). An optimization approach to airline integrated recovery. Transp. Sci. 46, 482–500. doi:10.1287/trsc.1120.0414
Ramanujam, V., and Balakrishnan, H. (2009). “Estimation of arrival-departure capacity tradeoffs in multi-airport systems,” in Proceedings of the 48h IEEE Conference on Decision and control (CDC) held jointly with 2009 28th Chinese control conference (IEEE), 2534–2540.
Ramanujam, V., and Balakrishnan, H. (2015). Data-driven modeling of the airport configuration selection process. IEEE Trans. Human-Machine Syst. 45, 490–499. doi:10.1109/thms.2015.2411743
Rosenberger, J., Schaefer, A., Goldsman, D., Johnson, E., Kleywegt, A., and Nemhauser, G. (2000). SimAir: a stochastic model of airline operations. 2000 Winter Simul. Conf. Proc. Cat. No.00CH37165 2, 1118–1122. doi:10.1109/WSC.2000.899074
Teodorović, D., and Guberinić, S. (1984). Optimal dispatching strategy on an airline network after a schedule perturbation. Eur. J. Operational Res. 15, 178–182. doi:10.1016/0377-2217(84)90207-8
Topping, C. J., Høye, T. T., and Olesen, C. R. (2010). Opening the black box—development, testing and documentation of a mechanistically rich agent-based model. Ecol. Model. 221, 245–255. doi:10.1016/j.ecolmodel.2009.09.014
U.S. Bureau of Transportation Statistics (2024). Reporting carrier on-time performance (1987-present). Available online at: www.transtats.bts.gov/Fields.asp?gnoyr_VQ=FGJ (Accessed on April 10, 2024).
U.S. Department of Transportation (2023). DOT penalizes Southwest Airlines $140 million for 2022 holiday meltdown
Vandin, A., Giachini, D., Lamperti, F., and Chiaromonte, F. (2022). Automated and distributed statistical analysis of economic agent-based models. J. Econ. Dyn. Control 143, 104458. doi:10.1016/j.jedc.2022.104458
Vink, J., Santos, B., Verhagen, W., Medeiros, I., and Filho, R. (2020). Dynamic aircraft recovery problem - an operational decision support framework. Comput. and Operations Res. 117, 104892. doi:10.1016/j.cor.2020.104892
Wandelt, S., Chen, X., and Sun, X. (2025). Flight delay prediction: a dissecting review of recent studies using machine learning. IEEE Trans. Intelligent Transp. Syst. 26, 4283–4297. doi:10.1109/TITS.2025.3528536
Wang, C., Hu, M., Yang, L., and Zhao, Z. (2021). Prediction of air traffic delays: an agent-based model introducing refined parameter estimation methods. PLoS One 16, e0249754. doi:10.1371/journal.pone.0249754
Wang, K., and Jacquillat, A. (2020). A stochastic integer programming approach to air traffic scheduling and operations. Operations Res. 68, 1375–1402. doi:10.1287/opre.2020.1985
Wang, Q., Mao, J., Wen, X., Wallace, S. W., and Deveci, M. (2025). Flight, aircraft, and crew integrated recovery policies for airlines - a deep reinforcement learning approach. Transp. Policy 160, 245–258. doi:10.1016/j.tranpol.2024.11.011
Wang, Y., Zhou, Y., Hansen, M., and Chin, C. (2019). Scheduled block time setting and on-time performance of u.s. and Chinese airlines—a comparative analysis. Transp. Res. Part A Policy Pract. 130, 825–843. doi:10.1016/j.tra.2019.09.043
Xu, Y. (2024). Perspectives on modelling airline integrated scheduling problem: a review on state-of-the-art methodologies. J. Air Transp. Res. Soc. 3, 100023. doi:10.1016/j.jatrs.2024.100023
Keywords: agent-based model, airline networks, transportation resilience, multi-agent simulation, aviation, schedule recovery
Citation: Peng M and Li MZ (2025) RecovAir: Model-driven airline scheduling tool for disruption recovery. Front. Built Environ. 11:1545491. doi: 10.3389/fbuil.2025.1545491
Received: 15 December 2024; Accepted: 25 April 2025;
Published: 12 May 2025.
Edited by:
Xuan Jiang, University of California, Berkeley, United StatesReviewed by:
Sakdirat Kaewunruen, University of Birmingham, United KingdomJessada Sresakoolchai, Prince of Songkla University, Thailand
Copyright © 2025 Peng and Li. This is an open-access article distributed under the terms of the Creative Commons Attribution License (CC BY). The use, distribution or reproduction in other forums is permitted, provided the original author(s) and the copyright owner(s) are credited and that the original publication in this journal is cited, in accordance with accepted academic practice. No use, distribution or reproduction is permitted which does not comply with these terms.
*Correspondence: Max Z. Li, bWF4emxpQHVtaWNoLmVkdQ==