 Kirsty J. Pringle1*
 Ana Margarida Sardo2,3
 Kathryn Lamb-Riddell4
 Laura De Vito3
 Alexandra R. McGoran5
 Sophie Laggan2
 Mark Hansen6Timothy Cox4
 Ben Williams3,7
- 1EPCC, University of Edinburgh, Bayes Centre, University of Edinburgh, Edinburgh, United Kingdom
- 2Science Communication Unit, University of the West of England, Bristol, United Kingdom
- 3Air Quality Management Resource Centre, University of the West of England, Bristol, United Kingdom
- 4Institute of Bio-Sensing Technology, University of the West of England, Bristol, United Kingdom
- 5Centre for Environment, Fisheries and Aquaculture Science (Cefas), Lowestoft, United Kingdom
- 6Centre for Machine Vision, Bristol Robotics Laboratory, University of the West of England, Bristol, United Kingdom
- 7Biospheric Microplastics Research Cluster, UWE Bristol, Bristol, United Kingdom
Non-natural airborne microfibres are an emerging concern in indoor air pollution, yet relatively little is known about their sources or concentrations. This is particularly relevant in home environments, where individuals spend significant amounts of time, but which are challenging for researchers to access at scale. Consequently, the concentration of indoor airborne microfibres remains poorly constrained. This paper presents results from the pilot phase of a participatory community (or citizen) science project, where participants collected airborne microfibres in their homes using simple, low-cost passive samplers consisting of Petri dishes lined with forensic tape. Microfibre deposition rates were then quantified through a combination of participant-contributed microscopy images and laboratory-based manual counting. The study found an average indoor microfibre deposition rate of 1,960 fibres m-2 day-1, with significant variability between homes (mean rates ranging from 570 to 4,534 fibres m-2 day-1). Among rooms sampled, bedrooms had the highest deposition rates (2,893 fibres m-2 day-1), followed by bathrooms (2,482 fibres m-2 day-1), with kitchens (1,225 fibres m-2 day-1) and living rooms (942 fibres m-2 day-1) showing lower rates. This study demonstrates a scalable, community-driven method for measuring indoor microfibres in the built environment.
1 Introduction
Non-natural microfibers, tiny fibres measuring less than 5 mm in length, are a significant source of environmental pollution (Acharya et al, 2021; Liu et al, 2022). They can have a wide range of compositions and are typically shed from textiles which have been manufactured for human use (Finnegan et al, 2022). The release of microfibers from textiles, particularly during washing, is well-documented; clothing can release 640,000 to 1,500,000 fibres per kilogram of clothing washed (De Falco et al, 2019; Napper and Thompson, 2016)
It is less well known that textiles, including clothing, can also release microfibers directly into the air (Cai et al, 2021; Chen et al, 2020). Wearing clothes can produce a similar number of fibres as washing them (De Falco et al, 2020), but this airborne release is harder to monitor and less is known about the concentration, fate, composition or health effects of these airborne microfibres (Athey and Erdle, 2022; Dris et al, 2017; Liu et al, 2022; Periyasamy, 2023). Given that homes contain a high density of textiles and are where individuals spend the majority of their time, they represent a critical but underexplored environment for studying microfibre pollution. Athey and Erdle (2022) highlight that “the indoor environment is relatively understudied in the microfiber literature compared to the outdoor environment”, identifying only four papers on the topic. They further note the novelty of this research area, with the first study on airborne microfibres published as recently as 2016. The lack of data leaves significant gaps in understanding the environmental and health implications of this emerging issue (Williams et al, 2023). This gap is due to the challenges of measuring pollution in domestic spaces, where factors such as ventilation, room size, and occupant behaviours (e.g., window-opening frequency or cooking practices) influence air pollutant concentrations (Carslaw et al, 2024). Additionally, studying homes can require intrusive equipment, which may alter participants' normal behaviour, and which hinders research on both traditional air pollutants (e.g., PM2.5, NO2) and emerging issues like indoor airborne microfibers.
Community science, also known as citizen science, involves the participation of non-professional scientists or members of the public in scientific research [e.g., Kullenberg and Kasperowski, (2016)] offers a promising approach to overcoming these challenges (Williams et al, 2023). By involving participants in research through activities such as experimental design, data collection, and analysis, community science could enable data collection across diverse home environments. If sampling methods are unobtrusive, behaviour changes among participants is minimized, ensuring the data reflects typical conditions. Community science has become increasingly popular in the study of microplastics and marine litter (Barrows et al, 2018; Forrest et al, 2019; Jones et al, 2024; Kawabe et al, 2022; McGoran et al, 2023) and has potential to improve our understanding of pollution in the home environment (Isley et al, 2022). It can also offer an efficient way of informing evidence based policy on emerging environmental challenges (Nelms et al, 2022).
1.1 Types of microfibers
Airborne microfibers can be formed from synthetic (e.g., polyester, nylon, and acrylic) or natural (e.g., cotton or wool) materials. Some studies have focused on the subset of microfibers made of plastic (microplastics). Microplastic fibres have been observed in both outdoor environments (Gasperi et al, 2018; Allen et al, 2019; Materić et al, 2021) and within homes (Dris et al, 2017; Perera et al, 2023; Soltani et al, 2021; Valdiviezo-Gonzales et al., 2024; Xumiao et al, 2021). Fibres produced from textiles made from natural materials are often still classed as “non-natural” and can also pose risks to health and the environment (Periyasamy, 2023) as they are normally treated with chemical additives like dyes, pigments, and flame retardants (Athey and Erdle, 2022; Dris et al, 2017; Liu et al, 2022). At present, non-plastic microfibres greatly outnumber plastic microfibres in the atmosphere, but this is predicted to reverse in the future (Finnegan et al, 2022). The presence of microfibres in homes is significant as microfibres can be ingested (e.g., if they deposit onto food which is then eaten (Catarino et al, 2018; Nizamali et al, 2023) or inhaled (Blackburn and Green, 2022). Prata (2018) estimated that people could be inhaling between 26 and 130 fibres a day. Some more recent estimates are, however, considerably lower (Domenech and Marcos, 2021).
1.2 Airborne microfibers and human health
The indoor environment is particularly important for health as on average we spend approximately 90% of our time indoors (Klepeis et al, 2001). Airborne microfibres, including both synthetic (including plastic) and natural fibres, pose potential health risks as they can be inhaled and then persist in the respiratory system, but health effects of microfibers is an ongoing and active area of research (e.g., Xu et al (2022)). They have been linked to the development of some tumours, for example, some studies have demonstrated the presence of cellulosic and non-mineral fibres in 83% of nonneoplastic lung specimens and in 97% of malignant lung specimens (Pauly et al, 1998) and more generally tumours at a higher rate than ‘normal’ tissue (Chen et al, 2022). Dependent on size fractions, inhaled microfibres can reach deep into the lungs, where they may cause irritation, inflammation, and oxidative stress (Periyasamy, 2023). Unlike larger airborne particles, smaller microfibres can evade the body’s clearance mechanisms, leading to potential damage to the lung tissue (Saha and Saha, 2024). The health effects of microplastics, a sub category of microfibres, is now the focus of many research studies (see, e.g., Prata (2018). Smaller particles, <2.5um, may also migrate away from the lung into other parts of the body via the bloodstream, providing a different pathway to previously considered ingestion routes. For example, microplastics in particular have been found in human kidney, liver and brain (Nihart et al, 2025), saphenous vein tissue (Rotchell et al, 2023), testes (Zhao et al, 2023) and breast milk (Saraluck et al, 2024).
1.3 Regulation of airborne microfibers
Despite the increasing recognition of airborne microfibers as an emerging environmental and health issue, airborne microfibers have yet to receive sufficient regulatory attention. Some textile companies have joined with NGOs and academics to conduct research and testing through the Microfiber Consortium (The Microfibre Consortium, 2025) to understand how to minimize microfiber shedding, but this scheme is voluntary and as yet there is no legislation or guidance as to acceptable levels of textile shedding. Informed by health impact studies, there are national and international guidelines regarding concentrations of most indoor pollutants (e.g., PM2.5, O3) but similar standards have not yet been developed for microfibers (or microplastics). This gap presents an opportunity for both scientific inquiry and policy development, as future research could inform regulatory approaches that reduce shedding from textiles to reduce the presence of these fibres in homes and other indoor environments.
1.4 Motivation
While previous studies have examined airborne microfibres in controlled settings or selected indoor environments, there remains a lack of scalable, real-world data on their presence in homes. This study addresses this gap by leveraging a community science approach to measure microfibre deposition across diverse residential settings. This paper presents findings from the pilot phase of Homes Under the Microscope (HOMES) project. We present results from the pilot phase of the project, in which participants in 29 homes collected airborne microfibers using a simple, low-cost passive collection technique. The project followed a two-phase approach, in which feedback and results from the pilot phase informed the design of the main phase. Here, we focus solely on the pilot phase, which took place in Bristol (UK) and involved more comprehensive sampling than the main phase. The main phase of the HOMES project used a similar, but simpler design in which participants were provided with just one sample dish, with the aim of increasing participation among potentially less engaged participants (Sardo et al, 2025).
Indoor air quality is a critical aspect of the built environment, yet airborne microfibres remain an overlooked pollutant despite their widespread presence in residential spaces. The interaction between building design, ventilation, and occupant behaviour influences the accumulation and dispersion of airborne microfibres, making this an important consideration for indoor environmental quality research. But despite the importance of the issue relatively few studies of microfibres in home exist, for example, while some other studies have reported measurements of microfibres in homes, we know of no other studies that have investigated the variability of microfibre deposition with room type.
2 Methods
A simple passive sampling approach was used to collect airborne microfibres. Participants were provided with sample collection dishes (consisting of Petri dishes containing a square of sticky forensic tape) (see Figure 1a) and asked to place them around their homes. Any microfibres that settled from the air onto the tape get stuck and can then be counted. Figure 1b shows an example deployment of the sample dish and Figure 1c shows an example microscope image taken by a participant. The overall design of the pilot experiment is shown in Figure 2.
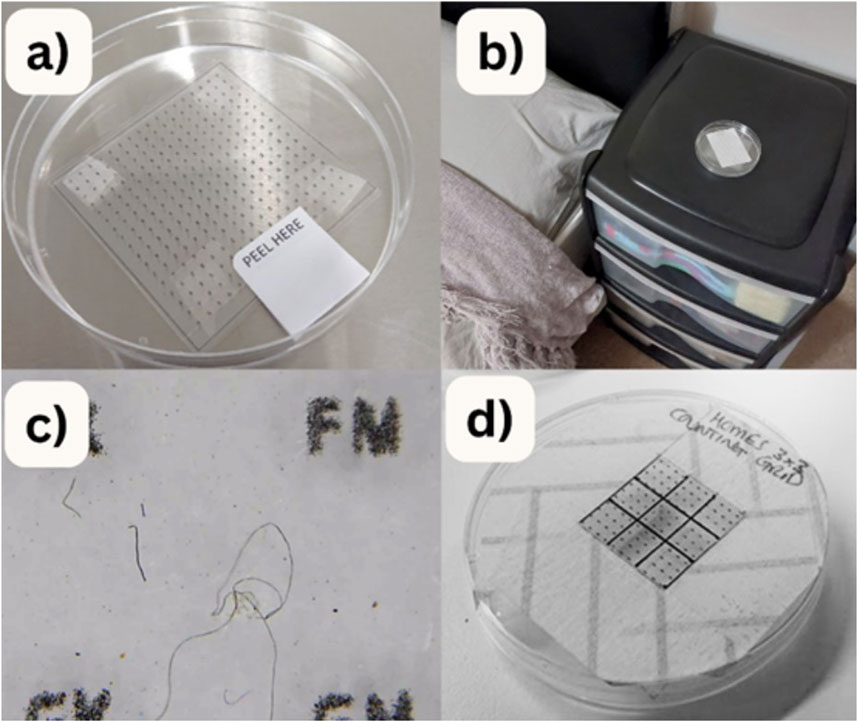
Figure 1. (a) Sample dish with forensic tape, (b) dish in a bedroom, (c) example microscope image and (d) counting grid placed over sample for systematic counting of the number of microfibres deposited.
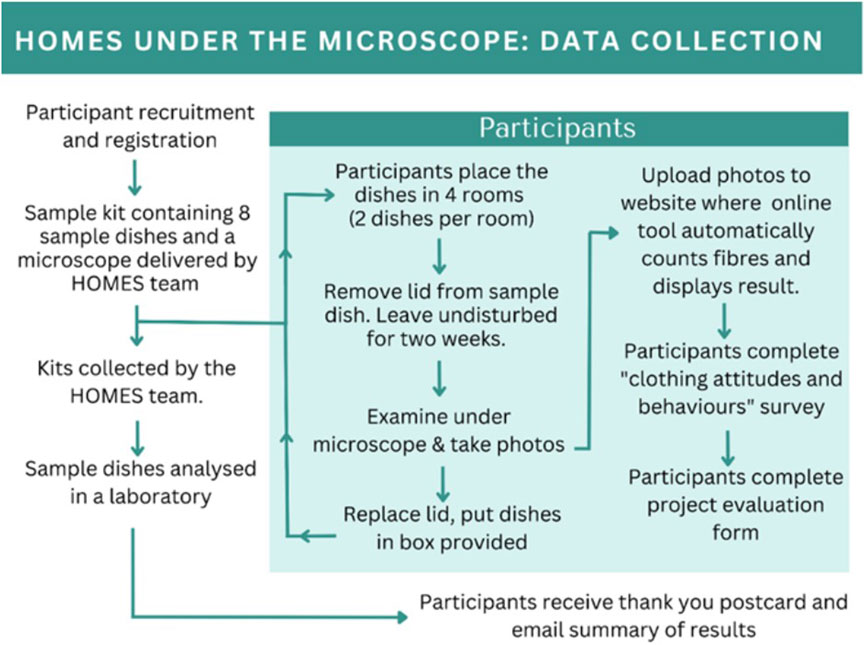
Figure 2. Schematic showing the data collection and analysis methodology for the pilot phase of Homes Under the Microscope.
2.1 Data collection and analysis
Each participant was given a box containing eight sample collection dishes and was asked to place two dishes per room in four separate rooms for 2 weeks. To give participants the chance to explore the samples and to see microfibres for themselves, they were provided with microscopes and were asked to use these to examine their samples. In this pilot phase, participants were given four different microscopes to test; two “clip on” microscopes that attach to a mobile phone and two with a stand. Figure 1 shows a sample collection dish and an example deployment as well as a microscope image of a sample. The forensic tape had a regular grid with letters printed on it to help locate particular fibres (like a grid reference).
Participants were asked to take photographs of the samples using the microscopes and upload to the HOMES website where an image processing tool automatically detected fibres from the image and provided users with a summary of the number and size of the fibres counted. This step was included for two reasons (i) image processing has the potential to dramatically increase the number of samples that can be processed in the future and (ii) it was anticipated that the participants would find the experience interesting as it is a simple, novel application of image processing and machine learning. After completion, kits were collected by HOMES staff and further analysed in the laboratory.
2.2 Manual fibre counting
Systematic visual counting was done manually in the laboratory by HOMES staff; first a 3 × 3 cm grid was placed over the sample dish (see Figure 1d) and all fibres visible within the grid were counted using a stereo microscope. Samples contained a mix of fibres and particulates but only fibres were counted (particulates were too small and too numerous to count). For this “fibres” were defined as any particle with length to width ratio of greater than 3:1. In some samples the stereo microscope visualised fibre like structures within the forensic tape or the petri dish, but fibres were only counted if they were above the plane of the location grid. This was determined by focussing on the grid location markers and raising the focus. For each sample the locations of representative fibres were noted (using the letters printed on the forensic tape).
2.3 Automatic fibre counting
During the pilot we trialled the use of a bespoke image processing tool to count the number of microfibres per sample. This step was included for two reasons: 1) accurately hand counting the fibres deposited is laborious and requires a skilled technician (it took approximately 10 min per sample), automation would allow for a huge increase in the number of samples that can be processed, and 2) while we did not want to ask the participants to count the fibres, we wanted to provide them with an estimate of the number deposited.
Once uploaded, the image processing tool took a few seconds to segment the image (separate out fibres from the background) and then count the fibres. Once complete, it displayed an information page which showed the processed image, clearly highlighting what the tool identified as a fibre and a count of the number of fibres. The spacing between the letters on the grid was used to back calculate the magnification, and thus measure the fibre length. This is important because, unlike the number of fibres, the fibre length can not be measured by eye by a technician.
2.4 Communication
To reduce barriers to participation the project adopted an informal communication style that used visuals and infographics where possible. During recruitment, a short animation was used to explain the issue of airborne microfibres and describe the project (https://youtu.be/WlYBIs4zSoA), results were communicated back to participants in the form of infographics (https://zenodo.org/records/14515137). This approach was designed to simplify complex information and ensure that participants could easily understand the topic and build a sense of community among the participants.
3 Results
Thirty-seven people registered to take part in the pilot and twenty-nine returned samples (79%), each participant returned eight sample dishes (so in total 232 sample dishes were returned). One sample dish recorded zero microfibres, likely due to user error, this result was excluded.
3.1 Dishes placed in the same room
Participants were asked to place two sample dishes in each room (A and B) in an open and uncovered location that was unlikely to be disturbed (e.g., on top of a table or chest of drawers, see Figure 1b. Two sample dishes per room were provided to allow evaluation of the robustness of the measurement technique; if both dishes record similar values it implies that the dishes are capturing a concentration that is broadly representative of the concentration in the room. Figure 3 shows a comparison of the measured deposition rates between the sample dishes in group A and group B. Overall deposition rates were very similar; the average deposition rate (fibres m-2 day-1) of fibres in group A is 1,909 (SD = 2,165) and in group B is 2,013 (SD = 2,360).
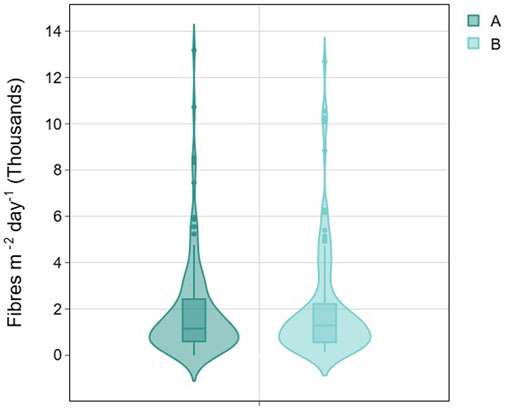
Figure 3. Comparison of deposition rates between the sample dishes in group A and group B where A and Bare in the same room.
3.2 Average concentrations within households
The range of measured deposition rates across all sample dishes, in all rooms is shown as a histogram in Figure 4. The average concentration of fibres collected was 1,960 fibres m-2 day-1, the range of reported depositions was 69 to 13,175 fibres m-2 day-1. The deposition rates measured are within the range of other studies, for example, Dris et al. (2017) measured an average indoor microfiber deposition rate of between 1,586 and 11,130 fibres m-2 day-1 over 4 separate months in two apartments and one office block in Paris (France), Zhang et al. (2020) measured in three locations in a single building and found a range of 1,400 to 77,000 fibres m-2 day-1. Soltani et al. (2021) used a citizen science approach to measure for a month in 32 homes in Sydney, Australia, they found a range of rates from 308 to 17,642 fibres m-2 day-1. Nizamali et al. (2023) reported indoor deposition in laboratories and homes ranging between 0 and 573 items m-2 h-1 (0 - 13,752 items m-2 day-1).
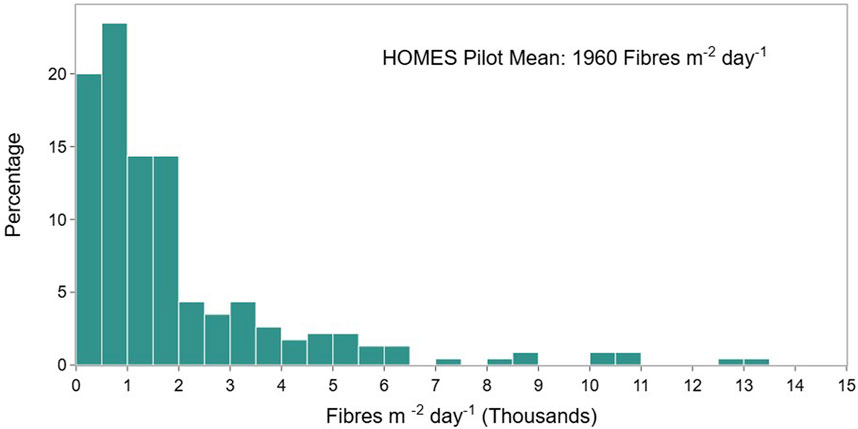
Figure 4. Frequency distribution of the concentration of fibres collected across all samples (all rooms, all participants).
3.3 Variability between homes
One aim of the HOMES pilot was to investigate the range of microfibre concentrations across different homes - do some homes have higher microfibre loading than others? Figure 5 shows the range of measured rates for each home as a box and whisker plot (data from each home is made up from the eight sample dishes). The average deposition per home ranged from 570 to 4,534 fibres m-2 day-1. However, in many homes, the average concentration is higher than the median (red dot in Figure 5 compared to the black bar). This suggests that a few samples with very high deposition rates are increasing the mean, leading to a right-skewed distribution. This implies that for most homes the higher average is caused by a few samples which show a much higher deposition rate indicating that there may be significant variability in deposition rates within a home.
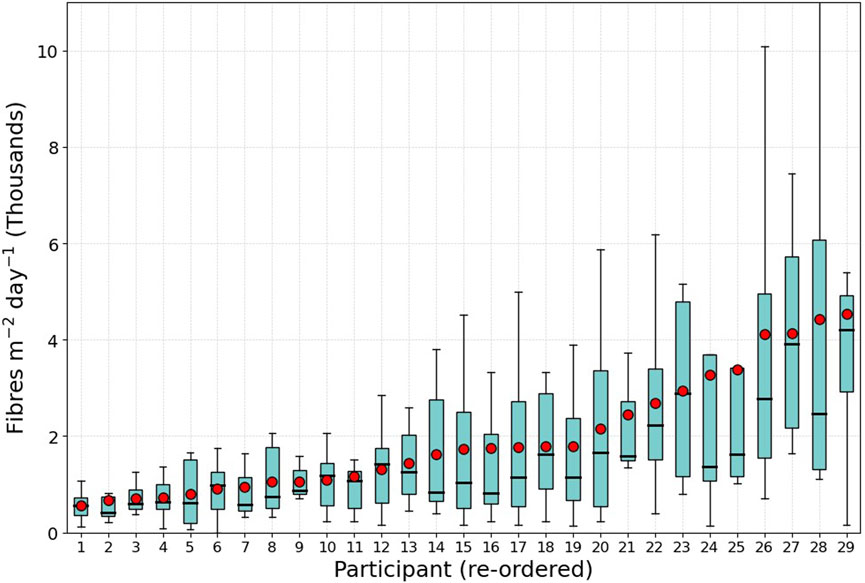
Figure 5. Microfibre deposition rate per participant (arranged in ascending order of mean, black bar shows the median and red dot the mean). The range shown in the box and whisker is from the range sampled across the eight dishes per home.
3.4 Variability between rooms
The sample data was grouped by the room type reported by the participants. As participants were given free choice as to which rooms to sample a large range of room types were reported. The most standard room types dominated (bedroom, bathroom, kitchen) but some room types were sampled by only a small number of participants (craft room, utility room, stairway/hall). There is insufficient data to generalise the data from the less common room types (fewer than six sample dishes returned) so these have been grouped in a single “other” group. “Ensuite” was grouped within the bathroom category and “spare room” was categorised as bedroom. On one sample no room type was reported that sample was grouped within “other” for this section. Of the named rooms office/study had the fewest samples (8) followed bathrooms (30), kitchen (48), living room (50) and bedroom (72). Some rooms may have dual use, e.g., spare room and office which makes the categorisation less clear. The range of microfiber deposition rates for each category of room is shown in Figure 6. The highest average microfibre deposition rate was recorded in bedrooms (2,893 fibres m-2 day-1) closely followed by bathrooms (2,482 fibres m-2 day-1) while other rooms were much lower, with kitchen (1,225 fibres m-2 day-1) and living room (942 fibres m-2 day-1).
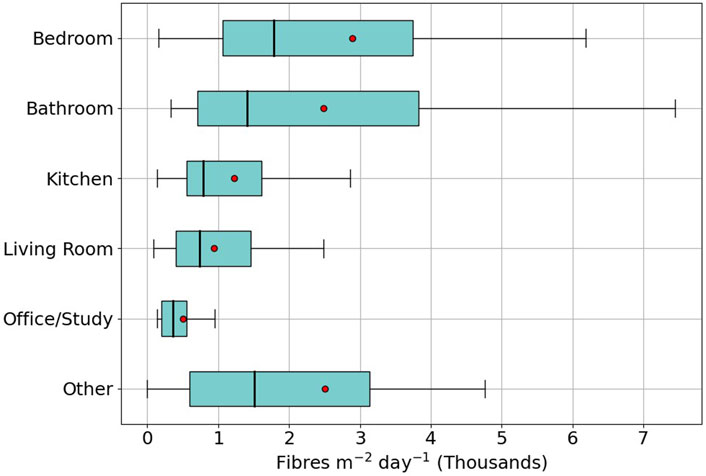
Figure 6. Average microfibre deposition rate per room measured by the HOMES pilot participants. Median shown by the black bar and mean by the red dot.
3.5 Use and evaluation of the automatic counting tool
Participants were invited to upload photos to the HOMES website, where an image processing tool automatically counted the particles and gave participants a short report detailing the microfibre count, dominant fibre colours and shape. It was made clear to the pilot participants that the tool was still under development and that data from the images was for information and engagement only and not crucial to the main scientific aim of the project. No fibre counts from the images taken by the participants have been used in this paper as the methodology is still under development.
As expected, the photos captured by the participants varied in quality; some were rotated, some had a vignetted (dark circle) area created by the microscope and quite a few were slightly out of focus or taken with little light. The image processing tool had some skill in identifying fibres, but several issues were also clear (highlighted in Figure 7). The tool had three main problems; 1) it erroneously counted the letters on the grid as fibres, 2) counted tiny particles as well as fibres and 3) often incorrectly split long fibres into multiple smaller ones. These were improved in a subsequent version trained using the images collected during the pilot phase.
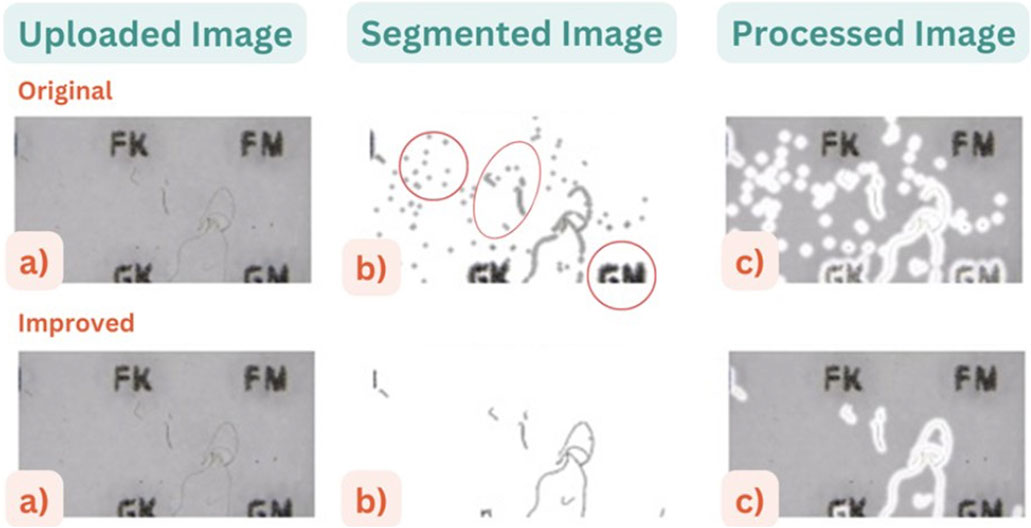
Figure 7. (a) an example image uploaded by participant and (b) the “segmented” image where the tool has attempted to separate the fibres from the background and (c) the processed image with the identified fibres marked in white shading. The top row shows results before improvements and the lower row the improved version (after the pilot).
Image processing offers an attractive way of greatly increasing the number of samples that can be analysed, but results from this pilot shows that further improvements are still needed. Giving participants more training or clearer examples to follow would likely improve the quality of the images. Advancements in machine learning, particularly in computer vision and deep learning, could help address key issues identified in the pilot study, such as misclassification, erroneous segmentation, and sensitivity to image quality.
4 Discussion
Indoor airborne microfibres are a potentially important type of indoor air pollution in the home, but they are understudied due to the relatively recent recognition of their importance and the difficulty of measuring within the home environment. Community (or citizen) science projects offer an opportunity for increased data collection while also raising awareness of the issue and building engagement and encouraging the public to take an active role in finding solutions to the problem (Nelms et al, 2022).
4.1 Microfiber concentrations in homes
This paper has presented the range of microfibre deposition rates in 29 homes in Bristol, UK. Participants placed two sample dishes per room in four rooms of their house. Across all samples, deposition rates were between 69 and 13,174 fibres m-2 day-1 which is within range of the limited data that exists, suggesting that the simple low-cost passive sampler used is able to capture deposition rates accurately. There was a factor of eight range between the lowest and the highest average deposition rate per home (range from 570 to 4,534 fibres m-2 day-1), showing that some homes have much higher overall microfibre deposition rates (and thus airborne concentrations) than others. Future work is required to understand the cause of these differences, but it is likely that the number of sources (e.g., amount of soft furnishings), strength of the sinks (e.g., ventilation) and residents behaviour (e.g., frequency of hoovering) will all affect microfiber concentrations (Nizamali et al, 2023).
Bedrooms and bathrooms were found to have much higher microfibre deposition rates than other room types (over 2,000 compared to around 1,000 fibres m-2 day-1) and thus should be the subject of future measurement studies, particularly bedrooms as they are of particular importance for health as they are a room in which people typically spend a significant amount of time. The relatively low values in the living room are surprising as these rooms typically have a significant amount of soft furnishings, thus it may be the how the room is used that contributes to the difference.
4.2 Participant engagement
Effective communication between researchers and participants is crucial in community science projects, not just in the recruitment phase but also during and after the study. In HOMES, a visual style was adopted with the use of a video (https://www.youtube.com/watch?v=WlYBIs4zSoA) and infographics to describe the project and convey results (Pringle, 2024). One challenge encountered was that ensuring that participants understood that the project was a pilot study, with novel methods that may not always work as expected. It was essential to communicate this uncertainty clearly without undermining participants' confidence in the scientific process. Feedback was provided through an infographic titled “Homes Under the Microscope: How You Changed the Project”, which acknowledged participants' contributions and highlighted how their contributions lead to improvements in the subsequent phase of the project. When designing the project, it was anticipated that participants would want to know about the concentrations in their samples without the long timescales required for full laboratory analysis. The online counting tool gave users a quick approximate microfibre count. The images participants uploaded to the website were used to identify errors and improve the tool (again this was passed back to participants). While the tool still requires further evaluation and development automatic counting of fibre samples has the potential to create a step change in the number of samples analysed. Because a single geographical location was chosen it was possible for HOMES staff to deliver and collect sample kits in person, with the added advantage that participants and researchers were often able to talk more informally. HOMES staff reported that feedback collected informally at sample collection pickup was often more comprehensive than the written feedback that was incorporated into the design of the project (Sardo, 2023). A full evaluation of the HOMES participants experiences is beyond the scope of this paper, but overall participants were positive about the project, one family commented “we all really enjoyed it, and it has taught us more about our home!” and another said “I found it a great experience, so interesting to take part.”
5 Conclusion
In this paper we describe the pilot phase of the Homes Under the Microscope community science project in which we piloted a simple, low-cost and accessible method to collect airborne microfibers. Measurements taken were within the range of those taken by other approaches. A community science approach was chosen for this project because although the home environment is important for health, their private nature makes it difficult for scientists to access a range of homes. The method presented has potential to be used in future studies as the sample collection method is very simple and easy to scale.
There is a growing recognition of the potential for airborne microfibers as a health and environmental concern, but airborne microfibers remain largely unregulated. Improved characterisation of the home environment could contribute to better understanding and the development of more appropriate regulations. There is also a need to integrate airborne microfibre research into broader discussions on sustainable building materials, ventilation strategies, and indoor air pollutant mitigation. Airborne microfibres in buildings pose an emerging environmental and health risk. Reducing emissions at the source through improved textile design requires industry and government collaboration, while better ventilation can help lower indoor concentrations and personal exposure. Community science can support these efforts by identifying pollution hotspots, guiding interventions, and fostering public awareness. Additionally, community science projects can help to foster an informed public that is more likely to engage with the issue and support the development of effective policies aimed at reducing microfiber pollution and mitigating its impact on health and the environment.
Data availability statement
The raw data supporting the conclusions of this article will be made available by the authors, without undue reservation.
Author contributions
KP: Formal Analysis, Funding acquisition, Writing – original draft, Writing – review and editing. AS: Conceptualization, Funding acquisition, Investigation, Methodology, Writing – review and editing. KL-R: Conceptualization, Formal Analysis, Funding acquisition, Investigation, Methodology, Writing – review and editing. LD: Conceptualization, Formal Analysis, Funding acquisition, Methodology, Writing – review and editing. AM: Investigation, Visualization, Writing – review and editing. SL: Conceptualization, Methodology, Writing – review and editing. MH: Conceptualization, Funding acquisition, Methodology, Software, Writing – review and editing. TC: Funding acquisition, Formal Analysis, Writing – review and editing. BW: Conceptualization, Formal Analysis, Funding acquisition, Investigation, Methodology, Project administration, Writing – review and editing.
Funding
The author(s) declare that financial support was received for the research and/or publication of this article. HOMEs under the microscope: Citizen-led characterisation Of airborne micropLAstic sources (HOME Co-LAb) was funded by BBSRC (BB/V012584/1).
Conflict of interest
The authors declare that the research was conducted in the absence of any commercial or financial relationships that could be construed as a potential conflict of interest.
Generative AI statement
The author(s) declare that Generative AI was used in the creation of this manuscript.
Publisher’s note
All claims expressed in this article are solely those of the authors and do not necessarily represent those of their affiliated organizations, or those of the publisher, the editors and the reviewers. Any product that may be evaluated in this article, or claim that may be made by its manufacturer, is not guaranteed or endorsed by the publisher.
References
Acharya, S., Rumi, S. S., Hu, Y., and Abidi, N. (2021). Microfibers from synthetic textiles as a major source of microplastics in the environment: a review. Text. Res. J. 91 (17–18), 2136–2156. doi:10.1177/0040517521991244
Allen, S., Allen, D., Phoenix, V. R., Le Roux, G., Jiménez, P. D., Simonneau, A., et al. (2019). Atmospheric transport and deposition of microplastics in a remote mountain catchment. Nat. Geosci. 12, 339–344. doi:10.1038/s41561-019-0335-5
Athey, S. N., and Erdle, L. M. (2022). Are we underestimating anthropogenic microfiber pollution? A critical review of occurrence, methods, and reporting. Environ. Toxicol. Chem. 41 (4), 822–837. doi:10.1002/etc.5173
Barrows, A. P. W., Christiansen, K. S., Bode, E. T., and Hoellein, T. J. (2018). A watershed-scale, citizen science approach to quantifying microplastic concentration in a mixed land-use river. Water Res. 147, 382–392. doi:10.1016/j.watres.2018.10.013
Blackburn, K., and Green, D. (2022). The potential effects of microplastics on human health: what is known and what is unknown. Ambio 51 (3), 518–530. doi:10.1007/s13280-021-01589-9
Cai, Y., Mitrano, D. M., Hufenus, R., and Nowack, B. (2021). Formation of fiber fragments during abrasion of polyester textiles. Environ. Sci. and Technol. 55 (12), 8001–8009. doi:10.1021/acs.est.1c00650
Carslaw, N., Bekö, G., Langer, S., Schoemaecker, C., Mihucz, V. G., Dudzinska, M., et al. (2024). A new framework for indoor air chemistry measurements: towards a better understanding of indoor air pollution. Indoor Environ. 1 (1), 100001. doi:10.1016/j.indenv.2023.100001
Catarino, A. I., Macchia, V., Sanderson, W. G., Thompson, R. C., and Henry, T. B. (2018). Low levels of microplastics (MP) in wild mussels indicate that MP ingestion by humans is minimal compared to exposure via household fibres fallout during a meal. Environ. Pollut. 237, 675–684. doi:10.1016/j.envpol.2018.02.069
Chen, G., Feng, Q., and Wang, J. (2020). Mini-review of microplastics in the atmosphere and their risks to humans. Sci. Total Environ. 703, 135504. doi:10.1016/j.scitotenv.2019.135504
Chen, Q., Gao, J., Yu, H., Su, H., Yang, Y., Cao, Y., et al. (2022). An emerging role of microplastics in the etiology of lung ground glass nodules. Environ. Sci. Eur. 34 (1), 25. doi:10.1186/s12302-022-00605-3
De Falco, F., Cocca, M., Avella, M., and Thompson, R. C. (2020). Microfiber release to water, via laundering, and to air, via everyday use: a comparison between polyester clothing with differing textile parameters. Environ. Sci. and Technol. 54 (6), 3288–3296. doi:10.1021/acs.est.9b06892
De Falco, F., Di Pace, E., Cocca, M., and Avella, M. (2019). The contribution of washing processes of synthetic clothes to microplastic pollution. Sci. Rep. 9 (1), 6633. doi:10.1038/s41598-019-43023-x
Domenech, J., and Marcos, R. (2021). Pathways of human exposure to microplastics, and estimation of the total burden. Current Opinion in Food Science 39, 144–151. doi:10.1016/j.cofs.2021.01.004
Dris, R., Gasperi, J., Mirande, C., Mandin, C., Guerrouache, M., Langlois, V., et al. (2017). A first overview of textile fibers, including microplastics, in indoor and outdoor environments. Environ. Pollut. 221, 453–458. doi:10.1016/j.envpol.2016.12.013
Finnegan, A. M. D., Süsserott, R., Gabbott, S. E., and Gouramanis, C. (2022). Man-made natural and regenerated cellulosic fibres greatly outnumber microplastic fibres in the atmosphere. Environ. Pollut. 310, 119808. doi:10.1016/j.envpol.2022.119808
Forrest, S. A., Holman, L., Murphy, M., and Vermaire, J. C. (2019). Citizen science sampling programs as a technique for monitoring microplastic pollution: results, lessons learned and recommendations for working with volunteers for monitoring plastic pollution in freshwater ecosystems. Environ. Monit. Assess. 191 (3), 172. doi:10.1007/s10661-019-7297-3
Gasperi, J., Wright, S. L., Dris, R., Collard, F., Mandin, C., Guerrouache, M., et al. (2018). Microplastics in air: are we breathing it in? Curr. Opin. Environ. Sci. and Health 1, 1–5. doi:10.1016/j.coesh.2017.10.002
Isley, C. F., Fry, K. L., Sharp, E. L., and Taylor, M. P. (2022). Bringing citizen science to life: evaluation of a national citizen science program for public benefit. Environ. Sci. and Policy 134, 23–33. doi:10.1016/j.envsci.2022.03.015
Jones, D. M., Potts, J., and Hale, M. S. (2024). The sampling and analysis of coastal microplastic and mesoplastic: development of a citizen science approach. J. Coast. Conservation 28 (1), 14. doi:10.1007/s11852-023-01023-0
Kawabe, L. A., Ghilardi-Lopes, N. P., Turra, A., and Wyles, K. J. (2022). Citizen science in marine litter research: a review. Mar. Pollut. Bull. 182, 114011. doi:10.1016/j.marpolbul.2022.114011
Klepeis, N. E., Nelson, W. C., Ott, W. R., Robinson, J. P., Tsang, A. M., Switzer, P., et al. (2001). The National Human Activity Pattern Survey (NHAPS): a resource for assessing exposure to environmental pollutants. J. Expo. Sci. and Environ. Epidemiol. 11 (3), 231–252. doi:10.1038/sj.jea.7500165
Kullenberg, C., and Kasperowski, D. (2016). What is citizen science? – a scientometric meta-analysis. PLoS One 11 (1), e0147152. doi:10.1371/journal.pone.0147152
Liu, J., Liu, Q., An, L., Wang, M., Yang, Q., Zhu, B., et al. (2022). Microfiber pollution in the earth system. Rev. Environ. Contam. Toxicol. 260 (1), 13. doi:10.1007/s44169-022-00015-9
Materić, D., Ludewig, E., Brunner, D., Röckmann, T., and Holzinger, R. (2021). Nanoplastics transport to the remote, high-altitude Alps. Environ. Pollut. 288, 117697. doi:10.1016/j.envpol.2021.117697
McGoran, A. R., Clark, P. F., Smith, B. D., and Morritt, D. (2023). Macrolitter and mesolitter in the Thames Estuary: a temporal litter assessment and brand audit of submerged and riverbed debris. Environ. Pollut. 337, 122484. doi:10.1016/j.envpol.2023.122484
Napper, I. E., and Thompson, R. C. (2016). Release of synthetic microplastic plastic fibres from domestic washing machines: effects of fabric type and washing conditions. Mar. Pollut. Bull. 112 (1), 39–45. doi:10.1016/j.marpolbul.2016.09.025
Nelms, S. E., Easman, E., Anderson, N., Berg, M., Coates, S., Crosby, A., et al. (2022). The role of citizen science in addressing plastic pollution: challenges and opportunities. Environ. Sci. and Policy 128, 14–23. doi:10.1016/j.envsci.2021.11.002
Nihart, A. J., Garcia, M. A., El Hayek, E., Liu, R., Olewine, M., Kingston, J. D., et al. (2025). Bioaccumulation of microplastics in decedent human brains. Nat. Med., 1–6. doi:10.1038/s41591-024-03453-1
Nizamali, J., Mintenig, S. M., and Koelmans, A. A. (2023). Assessing microplastic characteristics in bottled drinking water and air deposition samples using laser direct infrared imaging. J. Hazard. Mater. 441, 129942. doi:10.1016/j.jhazmat.2022.129942
Pauly, J. L., Stegmeier, S. J., Allaart, H. A., Cheney, R. T., Zhang, P. J., Mayer, A. G., et al. (1998). Inhaled cellulosic and plastic fibers found in human lung tissue. Cancer Epidemiol. Biomarkers Prev. 7 (5), 419–428.
Perera, K., Ziajahromi, S., Nash, S. B., and Leusch, F. D. L. (2023). Microplastics in Australian indoor air: abundance, characteristics, and implications for human exposure. Sci. Total Environ. 889, 164292. doi:10.1016/j.scitotenv.2023.164292
Periyasamy, A. P. (2023). Microfiber emissions from functionalized textiles: potential threat for human health and environmental risks. Toxics 11 (5), 406. Article 5. doi:10.3390/toxics11050406
Prata, J. C. (2018). Airborne microplastics: consequences to human health? Environ. Pollut. 234, 115–126. doi:10.1016/j.envpol.2017.11.043
Pringle, K. (2024). HOMES Under the microscope: infographics [Graphic]. Zenodo. doi:10.5281/zenodo.14515137
Rotchell, J. M., Jenner, L. C., Chapman, E., Bennett, R. T., Bolanle, I. O., Loubani, M., et al. (2023). Detection of microplastics in human saphenous vein tissue using μFTIR: a pilot study. PloS One 18 (2), e0280594. doi:10.1371/journal.pone.0280594
Saha, S. C., and Saha, G. (2024). Effect of microplastics deposition on human lung airways: a review with computational benefits and challenges. Heliyon 10 (2), e24355. doi:10.1016/j.heliyon.2024.e24355
Saraluck, A., Techarang, T., Bunyapipat, P., Boonchuwong, K., Pullaput, Y., and Mordmuang, A. (2024). Detection of microplastics in human breast milk and its association with changes in human milk bacterial microbiota. J. Clin. Med. 13 (14), 4029. doi:10.3390/jcm13144029
Sardo, A. M., De Vito, L., Pringle, K. J., Hansen, M., Lamb-Riddell, K., Laggan, S., et al. (2025). Co-creation in citizen science: sharing learnings and good practice from an indoor, airborne microplastics project. J. Sci. Commun. 24 (1), N02. doi:10.22323/2.24010802
Sardo, M. (2023). HOMEs under the microscope: final evaluation report. Available online at: https://uwe-repository.worktribe.com/output/10925515/homes-under-the-microscope-final-evaluation-report.
Soltani, N. S., Taylor, M. P., and Wilson, S. P. (2021). Quantification and exposure assessment of microplastics in Australian indoor house dust. Environ. Pollut. 283, 117064. doi:10.1016/j.envpol.2021.117064
The Microfibre Consortium. (2025). The microfibre Consortium. Available online at: https://www.microfibreconsortium.com. (Accessed November 21, 2024).
Valdiviezo-Gonzales, L., Ortiz Ojeda, P., Espinoza Morriberón, D., Colombo, C. V., Rimondino, G. N., Forero López, A. D., et al. (2024). Influence of the geographic location and house characteristics on the concentration of microplastics in indoor dust. Sci. Total Environ. 917, 170353. doi:10.1016/j.scitotenv.2024.170353
Williams, B., Vito, L. D., Sardo, A. M., Pringle, K., Hansen, M., Taylor, M., et al. (2023). Embedding citizens within airborne microplastic and microfibre research. Camb. Prisms Plast. 1, e11. doi:10.1017/plc.2023.11
Xu, J.-L., Lin, X., Wang, J. J., and Gowen, A. A. (2022). A review of potential human health impacts of micro- and nanoplastics exposure. Sci. Total Environ. 851 (Pt 1), 158111. doi:10.1016/j.scitotenv.2022.158111
Xumiao, L., Prata, J. C., Alves, J. R., Duarte, A. C., Rocha-Santos, T., and Cerqueira, M. (2021). Airborne microplastics and fibers in indoor residential environments in Aveiro, Portugal. Environ. Adv. 6, 100134. doi:10.1016/j.envadv.2021.100134
Zhang, Q., Zhao, Y., Du, F., Cai, H., Wang, G., and Shi, H. (2020). Microplastic fallout in different indoor environments. Environ. Sci. and Technol. 54 (11), 6530–6539. doi:10.1021/acs.est.0c00087
Keywords: microfiber (MF), indoor air, textiles & clothing, citizen science (CS), microplastic (MP)
Citation: Pringle KJ, Sardo AM, Lamb-Riddell K, De Vito L, McGoran AR, Laggan S, Hansen M, Cox T and Williams B (2025) Homes under the microscope: results from a pilot community science approach to measure airborne microfibres in the home. Front. Built Environ. 11:1556698. doi: 10.3389/fbuil.2025.1556698
Received: 09 January 2025; Accepted: 07 April 2025;
Published: 24 April 2025.
Edited by:
Ilaria Pigliautile, University of eCampus, ItalyReviewed by:
Paul Netscher, Independent Researcher, Perth, WA, AustraliaCristina Piselli, University of Florence, Italy
Copyright © 2025 Pringle, Sardo, Lamb-Riddell, De Vito, McGoran, Laggan, Hansen, Cox and Williams. This is an open-access article distributed under the terms of the Creative Commons Attribution License (CC BY). The use, distribution or reproduction in other forums is permitted, provided the original author(s) and the copyright owner(s) are credited and that the original publication in this journal is cited, in accordance with accepted academic practice. No use, distribution or reproduction is permitted which does not comply with these terms.
*Correspondence: Kirsty J. Pringle, ay5wcmluZ2xlQGVwY2MuZWQuYWMudWs=