 Amin Khoshnoud1
 Shahrzad Tayaran
- 1Department of Civil Engineering, Arak Branch, Islamic Azad University, Arak, Iran
- 2Industrial Management Department, Central Tehran Branch, Islamic Azad University, Tehran, Iran
- 3Department of Industrial Engineering, Arak Branch, Islamic Azad University, Arak, Iran
- 4Department of Chemical Engineering, Faculty Engineering, Islamic Azad University, Arak Branch, Arak, Iran
Introduction: The seismic vulnerability of urban critical infrastructure presents significant challenges for disaster preparedness and risk management. This study investigates the seismic risks associated with Pressure Reduction Stations (PRS) in Tehran, Iran.
Methods: An integrated decision-making framework combining Geographic Information Systems (GIS), Dominance-Based Decision-Making (DBDM), and Density-Based Spatial Clustering of Applications with Noise (DBSCAN) was used. Risk factors such as fault line proximity, ground motion, structural integrity, and population density were analyzed.
Results: High-risk zones and outlier PRS facilities were identified. Districts 2 and 10 were determined to be the most vulnerable. PRS-26 and PRS-10 were prioritized for retrofitting. The framework enabled robust spatial and probabilistic assessments.
Discussion: The integration of GIS, DBDM, and DBSCAN enhances the ability to identify seismic risk hotspots. This approach provides practical guidance for urban planners to improve resilience and disaster risk management for gas distribution infrastructure.
1 Introduction
Urban infrastructure planning and disaster management are facing increasing challenges due to rapid urbanization and escalating seismic risks worldwide. Addressing these challenges requires robust analytical methodologies capable of handling diverse and often conflicting criteria. Multi-Criteria Decision-Making (MCDM) techniques have emerged as effective tools in this domain, providing structured approaches for evaluating trade-offs and prioritizing vulnerabilities in critical infrastructure (Mardani et al., 2015; Triantaphyllou, 2000). Among these techniques, DBDM has gained attention for its ability to systematically rank alternatives. However, when integrated with GIS, referred to as DBDM-GIS, several limitations arise, particularly in handling spatially dependent and heterogeneous datasets (Greco et al., 2001).
Recent advancements in MCDM methodologies, including MULTIMOORA, VIKOR, and COPRAS, have extended their applicability in infrastructure planning by addressing challenges related to subjective weighting and trade-off complexities (Brauers and Zavadskas, 2010; Opricovic and Tzeng, 2004). For instance, VIKOR has been effectively employed in balancing conflicting criteria in seismic risk assessments, demonstrating its usefulness in urban disaster management (Shakerian et al., 2016). Similarly, MULTIMOORA has been utilized in optimizing decision-making processes for energy and environmental studies, including the integration of uncertain or incomplete data (Li et al., 2023). COPRAS has also been instrumental in prioritizing infrastructure projects under conditions of high uncertainty (Zavadskas et al., 2008). Despite their strengths, these methods lack advanced spatial analytical capabilities, limiting their effectiveness in seismic risk evaluations (Malczewski, 2006).
In parallel, significant progress has been made in seismic vulnerability assessment methodologies. Traditionally, seismic fragility analysis has been applied to evaluate the probability of structural failure under earthquake loads. Recent studies have proposed automated approaches, such as the META-FORMA-XL framework, which utilizes mechanical-typological modeling to derive fragility curves for masonry aggregates in urban environments (Mansouri Daneshvar et al., 2013). Additionally, multisource methodologies have been introduced to assess the regional seismic fragility of historical buildings by integrating typological, morphological, and construction-related data into vulnerability classifications (Delavar and Moradi, 2007). Analytical-mechanical frameworks have also been developed for reinforced concrete (RC) buildings, focusing on probabilistic fragility estimation at a municipal scale (Dall’erba and Jiang, 2013). While these approaches offer valuable insights into building-level vulnerability, they are primarily designed for urban-scale or historical structures and may not fully capture the unique risk factors associated with critical infrastructure such as gas distribution networks.
Integrating MCDM techniques with GIS helps overcome this limitation by incorporating spatial data into decision-making frameworks. GIS facilitates comprehensive analyses of critical seismic factors, such as proximity to fault lines, ground motion intensity, and urban density, as demonstrated in studies focused on earthquake vulnerability assessments in urban environments (Delgado et al., 2024; Momani and Fadil, 2019). Researchers have applied fuzzy MCDM models within GIS for seismic risk evaluations in regions with incomplete or uncertain data (Chen et al., 2018; Chen et al., 2015). Additionally, hybrid approaches combining Analytical Hierarchy Process (AHP) and GIS have been used to determine optimal infrastructure locations and mitigate seismic hazards (Ebrahimi and Koch, 2019; Cutter et al., 2010). Beyond earthquakes, GIS-MCDM frameworks have been successfully implemented in disaster management scenarios, including flood risk mapping (Hosseini et al., 2020), wildfire control (Malczewski, 1999), and urban resilience planning (Shekhar et al., 2003). However, despite these advancements, most studies primarily address general seismic risks and fail to comprehensively assess the unique vulnerabilities of critical infrastructure, such as gas stations, particularly in seismically active regions like Iran (Ester et al., 1996).
While the DBDM-GIS framework effectively ranks alternatives, it faces challenges in handling data complexity and heterogeneity. Specifically, DBDM-GIS methods frequently assume uniform spatial data distribution and fail to account for irregular clusters or outliers that might indicate heightened vulnerability. For example, the relationship between fault line proximity and urban density is often non-linear and cannot be fully captured by conventional DBDM-GIS models (Campello et al., 2013). Furthermore, traditional DBDM frameworks are less effective in integrating real-world anomalies, such as isolated areas with high seismic risk or clusters with distinct vulnerability profiles (Ruggieri et al., 2023).
To overcome these limitations, this study proposes an enhanced DBDM-GIS framework integrating density-based clustering through DBSCAN. Unlike traditional clustering methods like k-means, which rely on pre-defined cluster shapes and assume equal density, DBSCAN identifies clusters based on point density, making it particularly suitable for geospatial datasets with irregular distributions (Tosto et al., 2025). Additionally, DBSCAN explicitly detects outliers, which enables the identification of unexpected vulnerability patterns that might otherwise be overlooked in conventional DBDM-GIS applications (Ruggieri et al., 2022). Previous research has demonstrated the potential of DBSCAN in urban planning, such as mapping informal settlements (Mian and Ghanbari, 2017), analyzing traffic congestion patterns (Lahijanian and Hashemi, 2016), and geospatial crime analysis (Berberian and Yeats, 1999). However, its application in seismic vulnerability assessment remains underexplored.
Urban infrastructure, particularly gas distribution networks, faces significant risks in earthquake-prone regions such as Tehran. PRSs, a critical component of these networks, are especially vulnerable. Their failure during seismic events can result in cascading consequences, including widespread gas supply disruptions, fires, explosions, and severe economic losses (JICA, 2000). Recognizing these risks, a systematic and spatially-aware approach is essential for evaluating the seismic vulnerability of PRS facilities (Zare et al., 2021).
Tehran’s geological landscape is diverse, with alluvial deposits, volcanic, and metamorphic rocks contributing to varying degrees of seismic hazard. The city’s proximity to major faults, including the Mosha, North Tehran, and Ray faults, further amplifies its vulnerability. Historical earthquake records and hazard maps indicate a pattern of high ground motion potential across densely populated regions (Karimi et al., 2019). However, understanding the specific seismic vulnerability of PRS facilities requires a tailored analytical framework that accounts for spatial variability and structural risk factors (Ebrahimian et al., 2020).
This study aims to develop an advanced DBDM-GIS framework integrated with DBSCAN clustering to provide a more robust and spatially-sensitive approach for assessing seismic vulnerability in Tehran’s gas distribution infrastructure. By incorporating advanced spatial analysis, probabilistic modeling, and data-driven clustering, the proposed methodology will improve risk identification, enhance predictive accuracy, and support decision-makers in implementing more effective seismic mitigation strategies for critical urban infrastructure.
To provide a spatial understanding of Tehran’s seismic hazards, Figure 1 illustrates the distribution of major fault lines and ground motion levels based on historical earthquake records. This visual representation serves as a foundation for the vulnerability assessment framework discussed in subsequent sections.
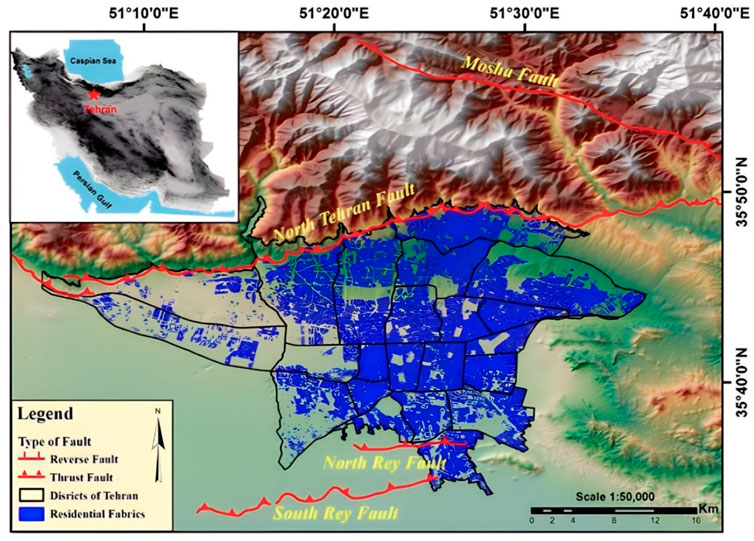
Figure 1. Seismic hazard map of tehran and surrounding areas, highlighting the main faults and ground motion levels based on historical earthquake records (JICA, 2000).
This study employs a two-tiered seismic risk assessment framework consisting of:
• Broad Vulnerability Analysis (BVA): A GIS-based approach that maps fault lines, seismic hazard zones, and population density across Tehran to identify high-risk districts where PRS facilities may be vulnerable.
• Localized PRS Analysis (LPA): A facility-level assessment that integrates two analytical techniques. The Dominance-Based Decision-Making (DBDM) method evaluates PRS facilities using four key risk factors: (1) proximity to active fault lines, (2) ground motion intensity, (3) structural integrity, and (4) population/economic exposure. The resulting composite vulnerability scores are then analyzed through Density-Based Spatial Clustering of Applications with Noise (DBSCAN) to identify spatial clusters of high-risk facilities and outliers with unique vulnerability profiles.
This two-stage framework ensures that BVA first identifies vulnerable districts, while LPA prioritizes and spatially clusters PRS facilities, providing a comprehensive foundation for seismic mitigation planning.
2 Methodology
The methodology adopted in this study integrates advanced decision-making and spatial analysis techniques to assess the seismic vulnerability of PRSs in Tehran’s gas distribution network. This systematic framework combines the DBDM, DBSCAN, and GIS, ensuring a robust and spatially-informed vulnerability assessment (Figure 2).
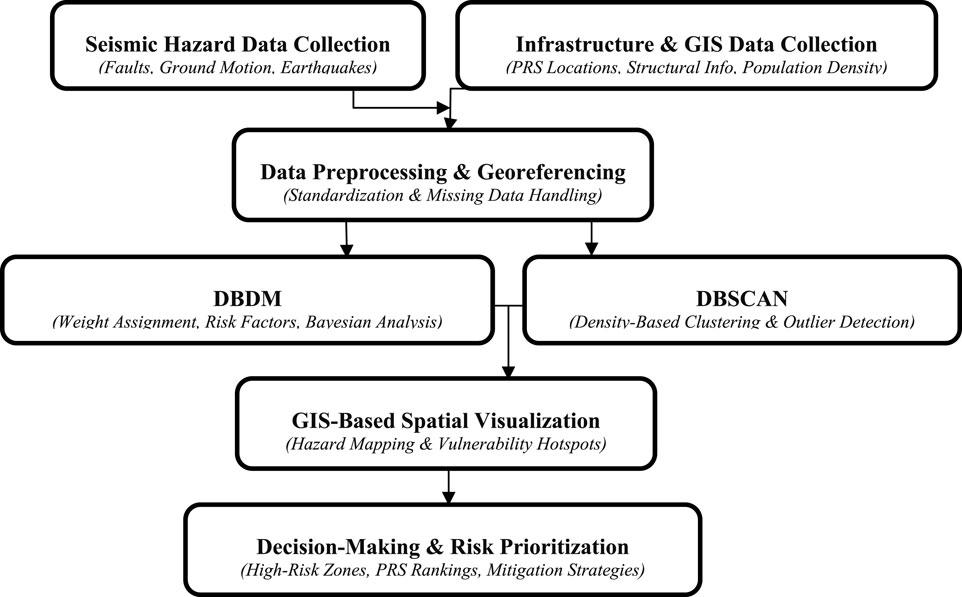
Figure 2. Framework for seismic vulnerability assessment using DBDM, GIS, and DBSCAN.
The methodology is explained in detail in the following steps:
2.1 Data collection and preparation
A comprehensive dataset was compiled and pre-processed to support the seismic vulnerability assessment of PRSs in Tehran. The dataset integrates seismic hazard indicators, infrastructure characteristics, population exposure, and spatial data into a multi-layered analytical framework.
The data sources include official records from seismic hazard assessment agencies, Tehran’s municipal gas authority, demographic statistics, and geospatial databases. Preprocessing steps involved georeferencing, missing data interpolation, and standardization to ensure consistency across datasets. Table 1 summarizes the dataset components:
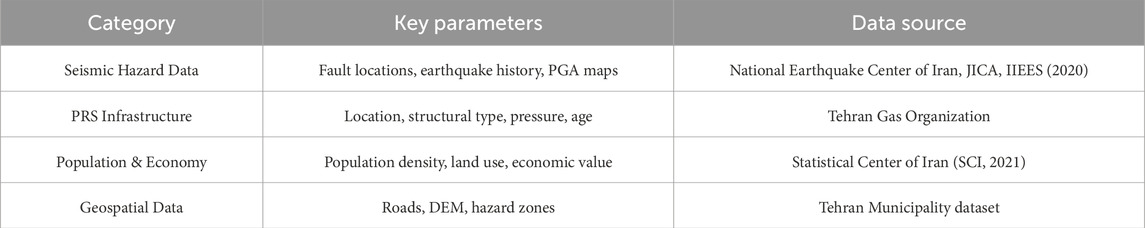
Table 1. Dataset components.
The data preparation process involved three key components:
• Seismic Hazard Data:
Fault line locations, historical earthquake records, and ground motion intensity maps were collected from the National Earthquake Center of Iran. These datasets were georeferenced and analyzed to calculate seismic hazard intensity at specific PRS locations. Ground motion intensity (
where:
This calculation provided a detailed spatial distribution of seismic intensity across the metropolitan area.
• Infrastructure Information:
Detailed information regarding the PRS facilities, including their geographic locations, structural characteristics, and operational importance, was gathered from Tehran’s municipal gas authority. Facility-specific parameters, such as structural integrity (
where:
These indices were incorporated into the decision-making model to prioritize facilities based on their vulnerability and importance.
• Geospatial Data:
Topographic maps, population density distributions, and urban layout information were collected to understand the spatial context of vulnerabilities. Geospatial layers were integrated using GIS software, enabling multi-layered analysis. For instance, population density (
where:
This spatial processing allowed for the visualization of population exposure to potential hazards, which was a critical input for the GIS-based analysis.
2.1.1 Georeferencing and Pre-Processing
All collected datasets were standardized to a unified spatial coordinate system (WGS84WGS 84WGS84) to ensure compatibility. Missing data points were addressed using interpolation techniques, such as Inverse Distance Weighting (IDW) for geospatial layers and Bayesian methods for probabilistic data. Additionally, spatial overlays were performed in GIS to align fault lines, PRS locations, and population density maps within a single analytical framework.
By completing these data preparation steps, the research ensured a robust and accurate foundation for integrating seismic, structural, and spatial criteria into the subsequent vulnerability assessment process.
2.1.2 Broad vulnerability analysis (BVA)
The Broad Vulnerability Analysis (BVA) was conducted at the district level using GIS-based spatial mapping. This analysis identified seismic risk hotspots across Tehran by overlaying fault lines, ground motion intensity zones, and population density distributions. The goal of BVA was to highlight high-risk urban districts likely to contain vulnerable PRS infrastructure. These findings served as an initial filter for deeper, facility-level assessments carried out in the subsequent Localized PRS Analysis (LPA).
2.2 Localized PRS analysis (LPA) – DBDM approach
DBDM was employed in this study to evaluate and prioritize the seismic risk associated with PRSs in Tehran. This approach incorporates probabilistic analysis to address uncertainties inherent in seismic data and adapt dynamically as new information becomes available. In this study, the term “alternatives” refers to the geographic districts of Tehran that were selected for evaluation based on PRS density, seismic exposure, and urban risk factors. The following steps were performed:
• Defining Risk Factors
Four critical risk factors were identified to comprehensively evaluate the seismic vulnerability of PRS facilities:
- Proximity to Active Fault Lines (
The distance from each PRS facility to the nearest fault line was calculated using GIS tools, ensuring precise spatial measurements. Facilities closer to fault lines were assigned higher risk levels.
- Ground Motion Intensity (
Ground motion intensity at each facility location was calculated using the attenuation relationship (1).
- Structural Integrity (
The structural integrity of each facility was quantified as Equation 2
Higher values of
- Population Density and Economic Loss Potential (
Population density and potential economic impacts in the vicinity of each PRS were evaluated using Kernel Density Estimation (KDE):
where:
These factors were selected based on their relevance to seismic vulnerability and their potential impact on public safety and economic stability.
• Bayesian Modeling
Probabilities of PRS failure were estimated using Bayesian inference, which allowed for the incorporation of prior knowledge and the dynamic updating of risk estimates as new data became available. The failure probability (
where:
The model dynamically adjusted
• Weight Assignment
To ensure a balanced assessment, weights (
where:
The weights were normalized (
• Risk Prioritization
The results of the Bayesian modeling and weighted risk scores were integrated into GIS to spatially visualize and rank PRS facilities based on their overall risk. High-priority facilities were those with close proximity to active fault lines, high ground motion intensity, low structural integrity indices and high population and economic exposure in surrounding areas.
To facilitate interpretation and support mitigation planning, the computed composite risk scores from the DBDM model were used to classify PRS facilities into three distinct risk categories:
• High Risk: Composite score ≥0.50
• Moderate Risk: Composite score between 0.35 and 0.49
• Low Risk: Composite score <0.35
This classification provided a clear basis for prioritizing PRS facilities for seismic mitigation and retrofitting.
2.3 Localized PRS analysis (LPA) – DBSCAN clustering
To enhance the seismic vulnerability assessment of PRSs and address the limitations of conventional DBDM methods, the DBSCAN algorithm was employed. This clustering technique effectively identifies spatial patterns and outliers in the vulnerability data.
• Clustering Process
The DBSCAN algorithm was applied to group PRS facilities based on their vulnerability scores and geographic distribution. The clustering process involved the following steps:
- Parameter DDefinition:
Epsilon (
Minimum Points (
Point Classification:
Core Points: Points with at least
Border Points: Points within the
Noise Points: Points that do not fall within any cluster, treated as outliers.
Clustering Algorithm:
For each point
If
If
• Mathematical Basis
DBSCAN’s clustering mechanism is based on density connectivity:
A point
A cluster is defined as the maximal set of density-connected points.
Mathematically:
Core points satisfy:
Density-reachable points satisfy:
This density-based connectivity ensures that clusters can take irregular shapes, making DBSCAN highly suitable for geospatial data.
• Integration with GIS
The output of the DBSCAN algorithm was seamlessly integrated into the GIS framework, enabling spatial visualization and further analysis. The clustering results included geographic groupings of PRS facilities into clusters and also spatial identification of noise points, representing outlier PRS facilities.
These spatial insights were utilized in subsequent stages of the analysis, ensuring the comprehensive assessment of seismic vulnerabilities.
DBSCAN clustering results were interpreted for risk classification purposes. Facilities located within dense clusters near active faults and high PGA zones were classified as High Risk. Noise points or spatial outliers with elevated vulnerability indicators were labeled as Localized High Risk, while facilities in lower-density or less severe clusters were categorized as Moderate to Low Risk.
In the DBSCAN clustering analysis, PRS facilities were classified into risk categories based on their spatial grouping.
• High Risk: Facilities located within dense clusters identified near active faults and high PGA zones.
• Moderate Risk: Facilities within medium-density clusters or mixed-character zones.
• Outlier Risk: Noise points or isolated PRSs flagged by DBSCAN were treated as unique risk cases and assessed individually for critical vulnerabilities.
This classification allowed to distinguish clustered high-risk zones from anomalous but potentially severe outlier risks.
2.4 GIS-based visualization
The integration of results from DBDM and DBSCAN clustering analysis into GIS enabled spatial visualization of seismic vulnerabilities across Tehran’s PRS facilities. This step translated analytical outputs into actionable insights through intuitive and detailed geospatial mapping.
• Mapping Vulnerability Hotspots
High-risk PRS facilities identified through the DBDM analysis were georeferenced and visualized in GIS. The mapping process included:
Fault Line Proximity Analysis:
PRS facilities were overlaid on fault line maps to highlight their spatial relationships with active seismic zones. The proximity (
where:
Urban Center Proximity:
Urban centers and high-density population zones were overlaid with PRS locations to identify facilities whose failures could result in significant public safety and economic impacts.
Hotspot Identification:
Using DBSCAN clusters, spatial groupings of high-risk PRS facilities were highlighted as vulnerability hotspots. Outliers flagged during clustering were separately visualized to emphasize facilities with unique risk profiles.
• Developing Seismic Vulnerability Maps
Seismic vulnerability maps were created by integrating multiple spatial layers derived from the analysis, including:
Vulnerability Scores:
Each PRS facility was assigned a composite risk score based on the weighted outputs from DBDM. These scores were visualized using a gradient scale (red for high risk, yellow for medium risk, green for low risk).
Cluster Overlays:
DBSCAN clusters were overlaid on the vulnerability map to distinguish grouped high-risk areas from isolated outliers.
Population and Economic Exposure:
Additional layers for population density and economic exposure were added to the maps to provide a comprehensive risk context. This was calculated as:
where:
Mitigation Priority Zones:
Areas requiring urgent mitigation efforts were marked based on their composite risk scores and proximity to urban centers or critical infrastructure.
• Technical Implementation
The GIS visualization was implemented using the following steps:
Data Integration:
Outputs from DBDM and DBSCAN analyses were imported into GIS software (ArcGIS) as geospatial layers.
Symbology and Layer Customization:
Fault lines were visualized as polylines with varying widths based on seismic activity levels.
PRS facilities were represented as point features, color-coded by risk scores.
Vulnerability clusters and outliers were highlighted using distinct symbology.
Map Composition:
Final maps included essential elements such as legends, scales, and annotations, ensuring clarity and usability for decision-makers.
• Outputs and Applications
The GIS-based maps developed in this study serve as actionable tools for:
Identifying high-risk PRS facilities for targeted inspections or retrofitting.
Prioritizing mitigation efforts in vulnerability hotspots.
Supporting disaster management and urban planning by providing a spatial understanding of seismic risks.
The proposed methodology combines the strengths of DBDM and DBSCAN to address the unique challenges of seismic vulnerability assessment for PRS infrastructure.
• DBDM for Probabilistic Risk Assessment: The model evaluates the likelihood of failure for each facility based on diverse factors, incorporating uncertainty into the analysis.
• DBSCAN for Clustering and Anomaly Detection: The algorithm identifies spatial clusters of high-risk PRS facilities and flags outliers with unique vulnerabilities.
• GIS for Visualizing and Prioritizing Risk: Spatial visualization enhances the interpretability of results, supporting more effective disaster management planning.
2.5 Decision criteria for PRS seismic risk evaluation
To systematically evaluate the seismic vulnerabilities of Tehran’s PRSs, the insights gained from GIS-based spatial visualization and DBSCAN clustering were integrated into a structured multi-criteria decision matrix. This matrix accounts for critical factors such as fault proximity, ground motion intensity, structural resilience, and population density, ensuring a comprehensive assessment of seismic risk. Each criterion was carefully selected and weighted based on its influence on PRS vulnerability, aligning with established seismic risk evaluation frameworks. By leveraging GIS for spatial analysis and DBSCAN for clustering high-risk areas, this methodology enhances risk prioritization, guiding targeted retrofitting and mitigation strategies. Figure 3 illustrates the GIS-based seismic vulnerability assessment criteria, providing a structured framework for evaluating PRS seismic risks.
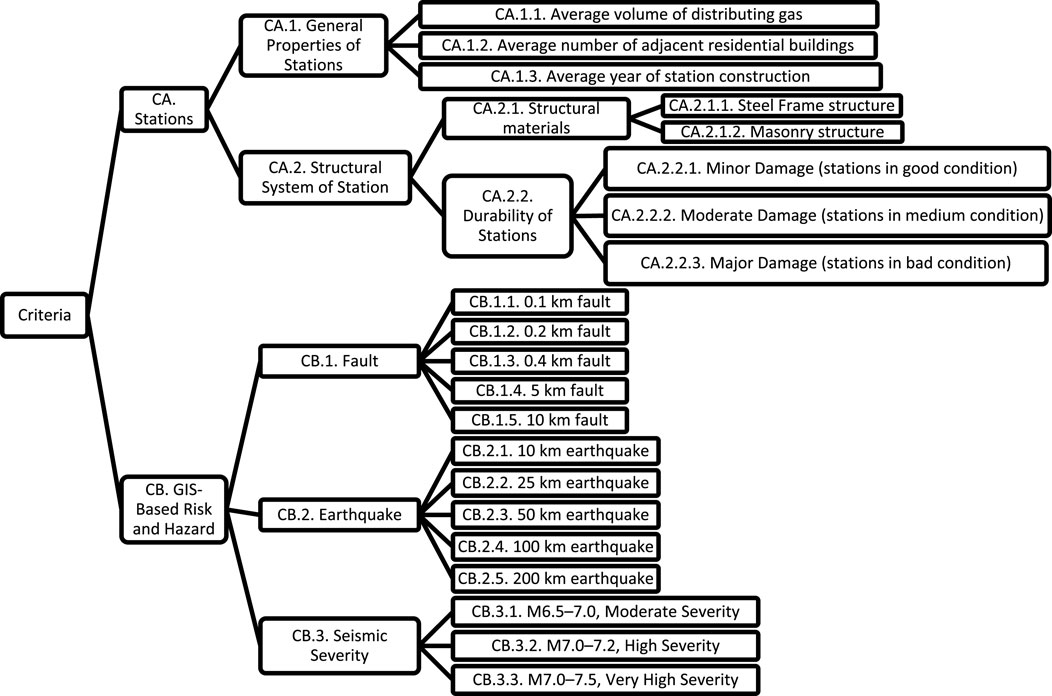
Figure 3. GIS-based Seismic vulnerability assessment criteria.
3 Results
The results are presented in alignment with the two-tiered framework introduced earlier. First, findings from the Broad Vulnerability Analysis (BVA) are shown to identify high-risk districts. Then, the Localized PRS Analysis (LPA) results are detailed, including DBDM-based rankings and DBSCAN spatial clustering for individual PRS facilities.
As outlined in Section 2.2, the DBDM method was applied to systematically evaluate the seismic vulnerability of PRS facilities using four primary risk factors: proximity to fault lines (
• Constructing the Decision Matrix, where alternatives are evaluated across multiple criteria.
• Dominance and Is Dominated Matrices, which analyze the relationships between alternatives based on benefit and cost criteria.
• Weighted Dominance Matrices, where expert-assigned weights are used to refine the dominance relationships.
• Calculating Dominance Coefficients, which rank alternatives based on their overall performance.
3.1 Localized PRS analysis (LPA) – application of DBDM
This study employs DBDM to assess the seismic vulnerability of PRSs in Tehran. The method evaluates alternatives (districts or PRS facilities) based on multiple criteria relevant to seismic risk: proximity to fault lines (
Step 1: To systematically assess the seismic vulnerability of gas PRSs in Tehran, a decision matrix (X) was developed, representing the performance of m alternatives (Tehran’s districts) across n evaluation criteria. The criteria were systematically categorized into three main groups: (1) Seismic Hazard Factors, which have the highest impact on PRS vulnerability (fault proximity, ground motion intensity); (2) Structural and Operational Factors, reflecting the resilience of PRSs (construction material, maintenance status); and (3) Exposure and Economic Impact Factors, which account for the consequences of PRS failure (population density, infrastructure criticality). The relative importance of each factor was determined based on expert consultation and literature review, ensuring that the decision matrix reflects realistic risk priorities. Table 2 presents the decision matrix, where criteria values are derived from seismic, structural, and geospatial analyses.
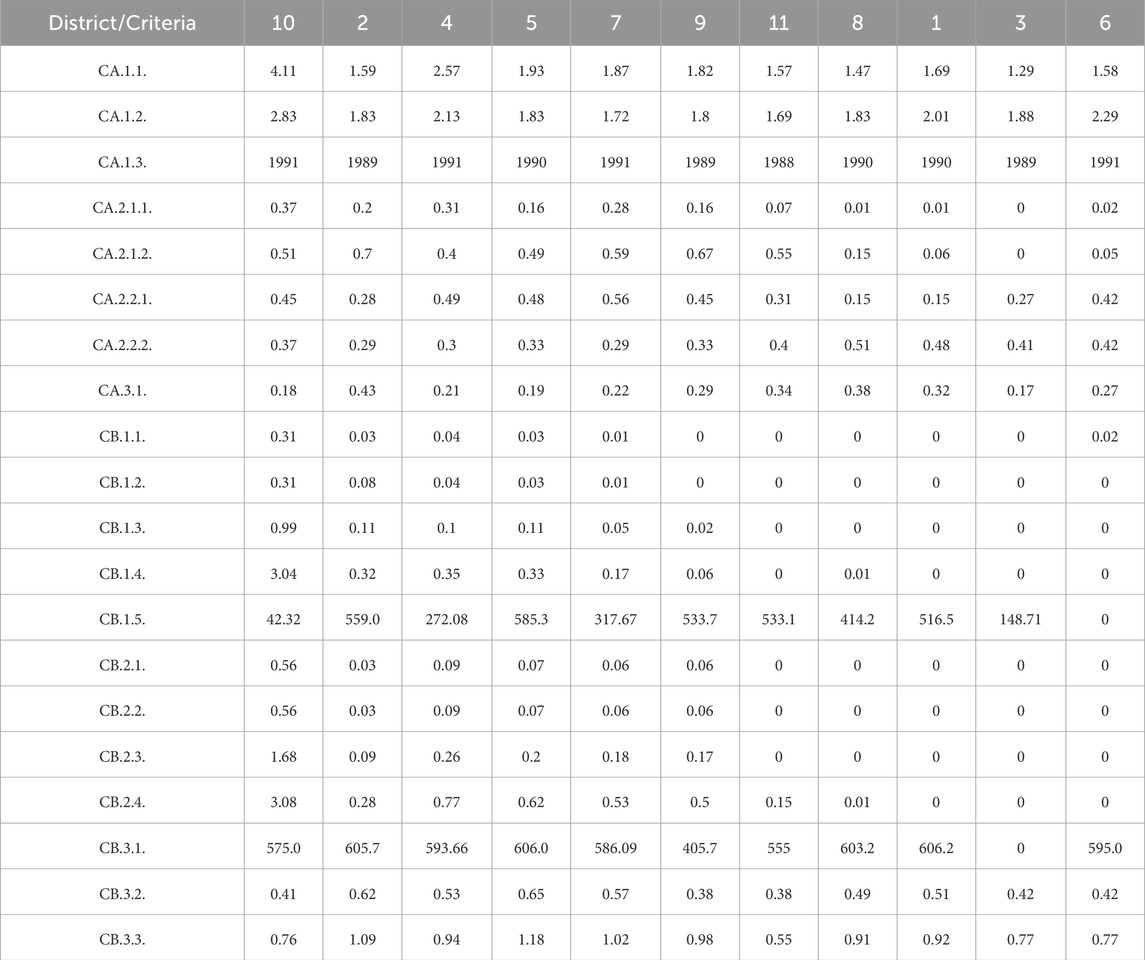
Table 2. Decision matrix values for criteria across districts.
The study focused on eleven key districts in Tehran, chosen based on three primary factors:
1. PRS Density: Districts with a higher number of PRS facilities were prioritized, as they play a crucial role in the gas distribution network.
2. Seismic Exposure: Districts located closer to active fault lines or with higher recorded ground motion intensity were included.
3. Urban Risk Factors: Districts with high population density, aging infrastructure, or significant economic activity were selected due to their greater potential impact in the event of a PRS failure.
Based on these considerations, the following eleven districts were analyzed:
District 2 – High seismic exposure due to proximity to the North Tehran Fault; multiple PRS facilities located in densely populated areas.
District 4 – Moderate fault line exposure but significant urban development, making it a key area for seismic risk evaluation.
District 5 – Located in a region with intermediate seismic hazard; includes PRS facilities of varying structural conditions.
District 7 – Contains PRS facilities near urban centers; moderate risk due to structural conditions.
District 9 – Located near industrial zones, with PRS facilities serving both residential and commercial areas.
District 10 – One of the most vulnerable areas due to aging PRS facilities, high ground motion intensity, and proximity to seismic sources.
District 11 – PRS facilities in this district are critical to the city’s gas supply infrastructure.
Districts 1, 3, 6, and 8 – These districts were selected due to their strategic PRS locations and varying levels of seismic exposure.
The values shown in Table 2 were estimated based on the procedures described in Section 2.2. Specifically, proximity to fault lines (CA.1.1) and ground motion intensity (CA.1.2) were calculated using GIS-based spatial analysis and the attenuation formula (Eq. 1). Structural and operational parameters (e.g., CA.1.3, CA.2.1.1) were derived from infrastructure data provided by the Tehran Gas Organization. Economic and population exposure values were computed using kernel density estimation and land-use data from the Statistical Center of Iran. All criteria were normalized before inclusion in the matrix.
Step 2: Dominance and Is Dominated Matrices The dominance relationships between alternatives were evaluated using:
• Dominated Matrix (DoM): Indicates whether one alternative outperforms another for a specific criterion.
• Is Dominated Matrix (IDoM): Indicates whether an alternative is outperformed by another.
The matrices are mathematically represented as:
Step 3: Weighted Dominance Matrices Weights (
Step 4: Calculating Dominance Coefficients For each alternative, dominance coefficients (
Higher
Table 3 summarizes the dominance coefficients (
• District 2 exhibited the highest vulnerability (
• District 6 had the lowest vulnerability (
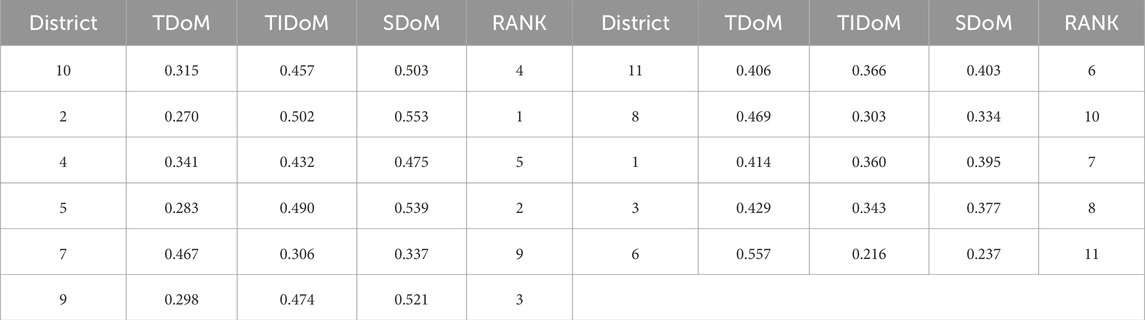
Table 3. Final dominance coefficients (
Figure 4 illustrates the dominance-based ranking of districts in Tehran, identifying those most at risk and requiring prioritized interventions. These results, derived from DBDM, account for proximity to fault lines, ground motion intensity, structural integrity, and population exposure. The rankings serve as a robust foundation for integrating clustering DBSCAN and GIS-based spatial analyses in subsequent sections.
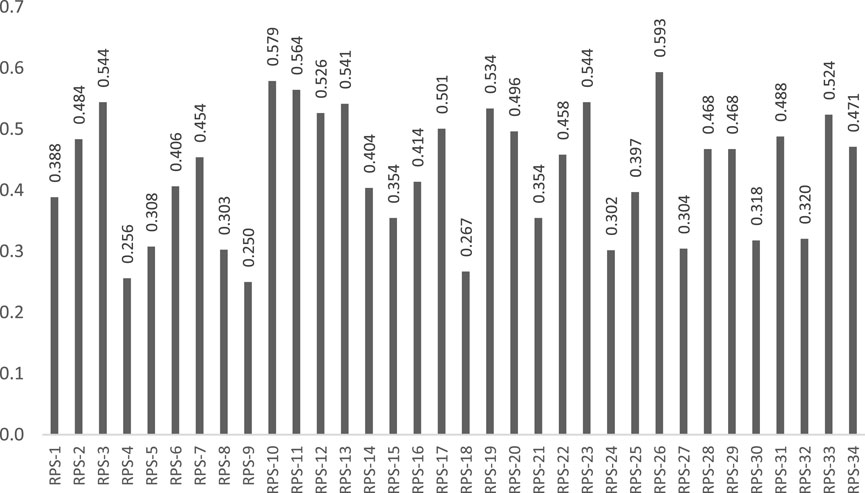
Figure 4. Ranking of Tehran’s districts based on seismic vulnerability using DBDM.
To integrate PRS-specific vulnerabilities with the district-level DBDM rankings shown in Figure 4, each facility was georeferenced and spatially assigned to its corresponding administrative district. This enabled the visualization of PRS risk profiles within district boundaries, offering a clearer perspective on how localized infrastructure vulnerabilities contribute to broader district-level seismic risk. Notably, Districts 2 and 10—ranked highest in the DBDM analysis—are also home to PRS-26 and PRS-10, respectively, both of which were identified as high-risk facilities in the DBSCAN clustering.
3.2 GIS-based earthquake vulnerability in Tehran
Tehran’s unique geological and urban characteristics, combined with its high seismic activity, necessitate a detailed spatial analysis of earthquake vulnerabilities. This section integrates GIS with DBSCAN algorithm to evaluate and cluster earthquake vulnerabilities across the city’s districts and PRSs.
GIS was employed to process and visualize critical spatial data, including fault line locations, ground motion intensities, and the distribution of critical infrastructure. The integration of GIS provided a comprehensive framework for analyzing spatial relationships and visualizing seismic risks. By overlaying infrastructure data, geological features, and population density, GIS facilitated the identification of vulnerability hotspots across Tehran. Figure 5 presents the geographic clustering of vulnerabilities based on seismic risk factors, highlighting high-risk zones and outlier facilities.
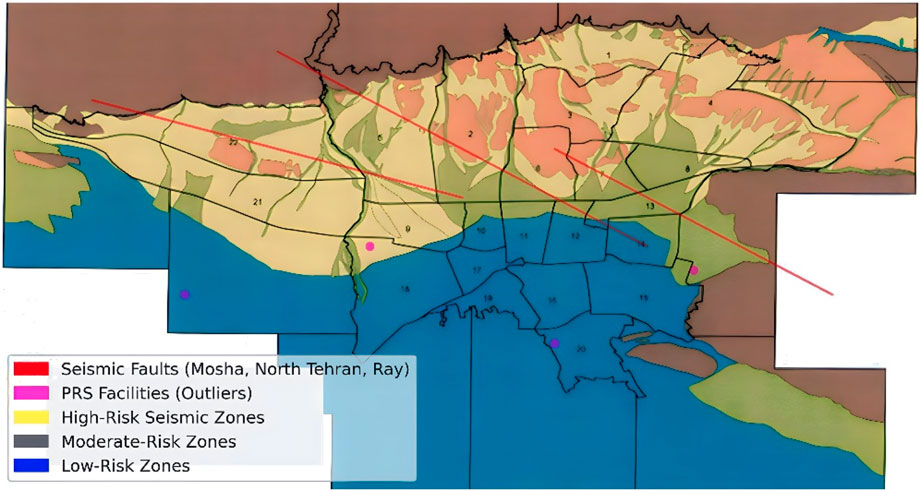
Figure 5. Geographic clustering of seismic vulnerabilities in Tehran, highlighting high-risk zones and outlier PRS facilities.
To enhance the granularity of the analysis, the DBSCAN algorithm was applied to cluster PRS vulnerabilities. Unlike conventional clustering methods, DBSCAN identifies clusters based on density thresholds, making it well-suited for irregular and heterogeneous spatial datasets. This approach enabled the differentiation of clustered high-risk areas from isolated outliers, which represent unique vulnerabilities requiring focused interventions. Table 4 summarizes the optimized parameters for the DBSCAN algorithm, including epsilon (ϵ) and minimum points (MinPts), which were critical for meaningful clustering.
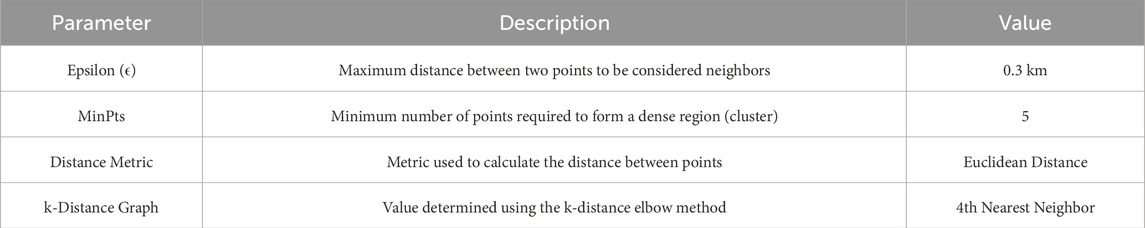
Table 4. DBSCAN parameter values for clustering seismic vulnerabilities in Tehran.
The clustering process involved the following steps:
1. Parameter Selection: The DBSCAN parameters—epsilon (ϵ) and minimum points (MinPts)—were optimized using the k-distance method to ensure meaningful clustering of vulnerabilities.
2. Point Classification: PRS facilities were classified into core points, border points, and noise points based on their spatial proximity and density. Core points formed the backbone of clusters, while noise points highlighted facilities with atypical risk profiles.
3. Cluster Formation: DBSCAN identified density-connected clusters, grouping PRS facilities with similar risk profiles into high-risk zones. Outliers were flagged for individual analysis, ensuring no critical vulnerability was overlooked.
While the visual outputs of GIS and DBSCAN analyses provide valuable insights, this study emphasizes a tabular and textual interpretation of clustering results. By systematically incorporating these findings into the decision matrix, the approach ensures comprehensive seismic vulnerability assessments that remain robust and reproducible, even in the absence of complete visual representations.
The results of the DBSCAN clustering were integrated into the GIS framework, generating detailed spatial maps that highlighted high-risk clusters and outliers. These maps provided actionable insights into the geographic distribution of vulnerabilities, guiding targeted mitigation strategies for PRS infrastructure. Figure 6 visualizes the results of clustering, including high-risk zones near active fault lines and isolated outliers.
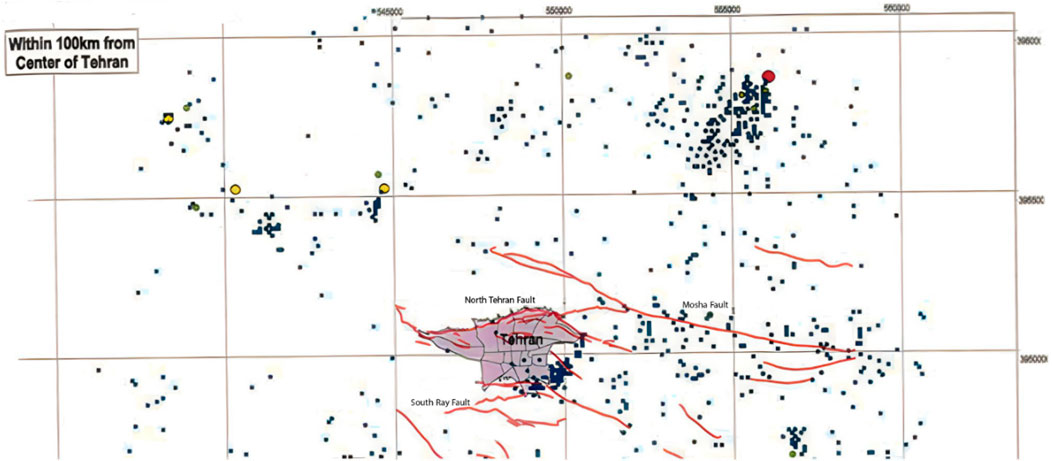
Figure 6. Results of DBSCAN clustering, visualizing high-risk zones and isolated outliers.
The integration of GIS and DBSCAN revealed critical insights into Tehran’s seismic vulnerabilities:
• High-Risk Zones: Areas with dense clusters of high-risk PRS facilities were identified near active fault lines and regions with high ground motion intensities.
• Outlier Facilities: Isolated PRS facilities with unique vulnerabilities, such as those located in geologically unstable areas or serving densely populated neighborhoods, were flagged for focused interventions.
• Spatial Relationships: The clustering analysis highlighted spatial dependencies, such as the correlation between fault line proximity and the density of high-risk PRS facilities.
By integrating GIS-based spatial visualization with DBSCAN clustering, this study identified high-risk zones and outlier PRS facilities, enabling a data-driven prioritization of seismic mitigation efforts. This approach ensures a targeted allocation of resources for retrofitting and reinforces the resilience of Tehran’s gas distribution network against seismic hazards, particularly in regions near active fault lines and densely populated urban areas.
3.3 Earthquake Vulnerability Decision Matrix
The insights gained from GIS-based spatial visualization and DBSCAN clustering were systematically quantified in a multi-criteria decision matrix to assess seismic vulnerabilities across Tehran’s PRSs. This decision matrix served as the core tool for prioritizing mitigation efforts by integrating diverse seismic risk factors and infrastructure-specific characteristics. In the context of the decision matrix analysis, “alternatives” correspond to the eleven selected districts of Tehran, each of which contains one or more PRS facilities. These districts were evaluated and ranked based on multiple seismic vulnerability criteria.
The criteria included in the decision matrix were derived from two complementary sources. The DBDM analysis contributed quantitative seismic risk indicators such as fault proximity, ground motion intensity, structural integrity, and population/economic exposure. These indicators formed the core of the PRS-specific and GIS-based criteria. Meanwhile, the DBSCAN analysis provided spatial insights by identifying vulnerability clusters and outliers. These clustering outcomes were translated into matrix criteria by assigning additional weights or adjusting scores for PRSs located in high-risk clusters or flagged as noise points. This dual-sourced approach ensured that both probabilistic risk factors and spatial distribution patterns were comprehensively captured in the decision-making framework.
The matrix incorporated 21 sub-criteria organized into two main categories: PRS-specific characteristics and GIS-based risk factors. These criteria were selected to capture the multifaceted nature of seismic vulnerability. Table 5 lists the complete set of criteria, along with their weights and classifications as either cost or benefit criteria. The criteria were derived from structural data provided by the Tehran Gas Company, seismic hazard information from the Seismic Microzonation Project of Greater Tehran conducted by JICA, and the 2020 Damavand Earthquake Damage Report by the International Institute of Earthquake Engineering and Seismology (IIEES).
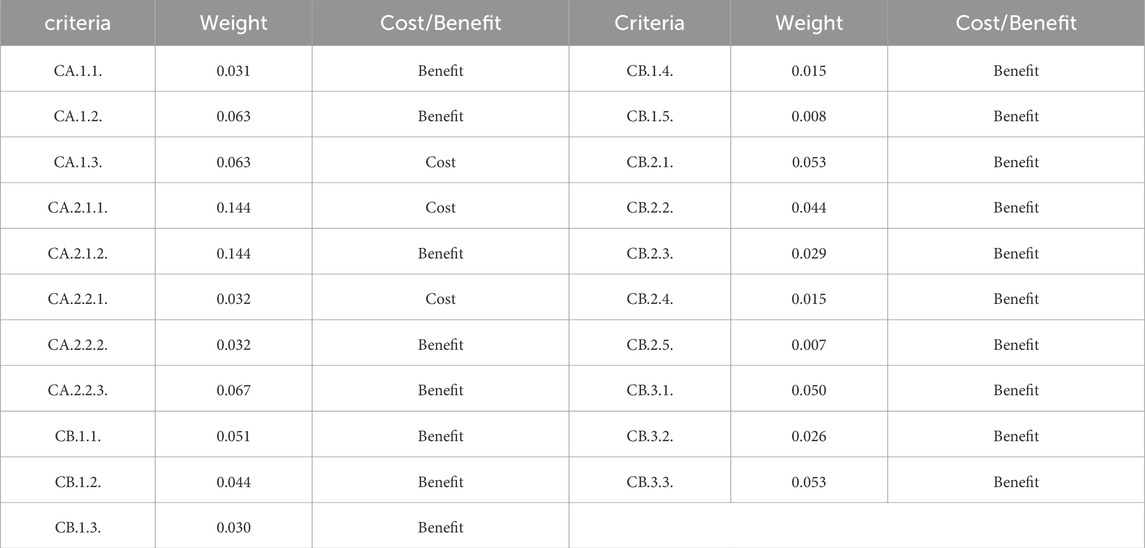
Table 5. Criteria weights and classification for the decision matrix, illustrating the importance of cost and benefit factors in evaluating seismic vulnerability.
The development of the decision matrix followed a systematic framework, as illustrated in Figure 2, which outlines the integration of GIS data, DBSCAN clustering results, and weighted criteria into a cohesive decision-making process. This framework enabled the evaluation and ranking of PRS facilities based on their composite risk scores, ensuring a transparent and scientifically grounded approach.
The 21 sub-criteria were categorized into two main groups:
1. PRS-Specific Characteristics: These criteria assessed the structural and operational attributes of each PRS. For example:
CA.1.1 (Structural Resilience): A critical benefit criterion reflecting the capacity of PRS facilities to withstand seismic forces.
CA.1.3 (Maintenance History): A cost criterion addressing the frequency and effectiveness of maintenance activities.
2. GIS-Based Risk Factors: These criteria evaluated the spatial risk characteristics of PRS locations. Key examples include:
CB.1.1 (Fault Density Within 0.5 km): A benefit criterion assessing the proximity of PRSs to active fault lines.
CB.2.1 (Peak Ground Acceleration at PRS Location): A critical benefit criterion derived from seismic hazard maps, indicating expected ground motion intensity.
The assigned weights reflect the relative importance of each criterion, with higher weights given to factors such as fault proximity and ground motion intensity. For example, CA.2.1.1 (Seismic Risk) and CB.1.1 (Fault Density) received the highest weights due to their direct impact on seismic vulnerability. These weights were finalized through expert consultations and literature reviews to ensure reliability and validity (Table 5).
DBSCAN clustering results provided key inputs for refining the decision matrix. High-risk clusters identified in Section 4 were assigned elevated scores, reflecting their critical vulnerability levels. Similarly, outlier facilities flagged by DBSCAN were subjected to individual analyses, ensuring that unique vulnerabilities were not overlooked.
For example, densely clustered PRSs near fault lines and high ground motion zones were prioritized for retrofitting, while isolated facilities in geologically unstable areas received additional scrutiny. This integration of clustering results into the decision matrix ensured that spatial dependencies and unique risk profiles were appropriately captured.
Based on these scores, districts and PRSs were ranked to identify high-priority targets for mitigation. The rankings provided actionable insights for seismic risk management. Districts such as District two and District 10 emerged as high-risk zones, primarily due to their dense fault line networks and high ground motion intensities. Specific PRS facilities, including PRS-26 and PRS-10, were identified as top priorities for retrofitting.
The classification into cost and benefit criteria was not based on numerical estimation but was determined based on the nature of each factor and its directional impact on seismic vulnerability. Benefit criteria are those for which higher values indicate reduced vulnerability (e.g., structural resilience or newer construction), whereas cost criteria represent factors where higher values are associated with increased vulnerability (e.g., ground motion intensity or age of infrastructure). These categories were defined to guide the dominance-based ranking process and ensure correct mathematical treatment of each criterion in the DBDM model.
The weights assigned to each criterion were derived through a structured expert elicitation process using a modified version of the Direct Rating Method. Experts in seismic engineering, urban infrastructure, and gas distribution were asked to assign relative importance values to each criterion on a scale from one to 9. These raw scores were then normalized to ensure that the total weight across all criteria equaled 1. The final weights presented in Table 5 reflect the aggregated and normalized consensus of five experts.
For prioritizing seismic mitigation efforts, we used the Dominance-Based Decision-Making (DBDM) algorithm described in Section 2.2. This method evaluates the performance of each alternative (district or PRS facility) based on cost and benefit criteria, applying the assigned weights in the construction of Weighted Dominance Matrices. Facilities or districts were then ranked using Dominance Coefficients (SDoM), which provide a composite score representing overall vulnerability. Higher SDoM values indicate greater seismic risk and were used to identify top-priority targets for retrofitting or intervention.
3.4 Ranking and prioritization of seismic mitigation efforts
The integration of GIS-based spatial visualization, DBSCAN clustering, and the Earthquake Vulnerability Decision Matrix provided a comprehensive framework for evaluating seismic risks across Tehran’s districts and PRSs. By synthesizing these tools, actionable priorities for seismic mitigation were established, focusing on both district-level and facility-level vulnerabilities.
The decision matrix quantified vulnerability scores for each district and PRS facility, revealing significant variations in seismic risk. Among Tehran’s districts, District two emerged as the most vulnerable due to its high density of fault lines, including the North Tehran Fault, and significant ground motion intensities. District 10 was identified as the second most vulnerable, primarily because of its aging masonry PRS facilities and densely populated neighborhoods. District four ranked third, with moderate fault density and structural resilience challenges. These findings align closely with the Seismic Microzonation Project of Greater Tehran conducted by JICA, which similarly identified Districts 2 and 10 as seismic hotspots. Additionally, studies such as those by Shafiei et al. (2018) corroborate the heightened risk profile of these districts, particularly regarding fault proximity and infrastructure vulnerability.
At the facility level, PRS-26 in Shahrak-e Gharb was ranked as the most vulnerable due to its proximity to high-seismic zones and inadequate structural capacity to withstand significant ground shaking. PRS-10 in Saadat Abad and PRS-11 in Tehranpars also emerged as high-priority targets for retrofitting, reflecting their location in fault-prone areas and their aging infrastructure. These results echo findings by Ebrahimian et al. (2020), who highlighted the disproportionate vulnerability of older masonry-based facilities in urban seismic risk assessments.
The DBSCAN clustering process provided critical insights into the spatial distribution of vulnerabilities. High-risk clusters were identified near fault lines in Districts 2, 10, and 4, highlighting areas requiring prioritized intervention. Isolated facilities, such as PRS-23 in Sorkhe Hesar, demonstrated unique vulnerabilities attributed to their specific geological or infrastructural contexts. These results emphasize the need for tailored mitigation strategies, as similarly highlighted by Karimi et al. (2019), who stressed the importance of addressing outlier risks in urban seismic planning. Moreover, the clustering revealed strong spatial dependencies between fault proximity, ground motion intensity, and PRS density, reinforcing the critical role of spatial factors in seismic risk assessments.
The rankings derived from the decision matrix provided actionable insights for mitigation strategies. For Districts 2 and 10, immediate retrofitting of public infrastructure and detailed microzonation studies are essential to improving local resilience. District 4 requires targeted interventions to address areas with moderate fault density. At the facility level, structural reinforcement of PRS-26, PRS-10, and PRS-11 using advanced techniques such as FRP wrapping and base isolation is recommended to enhance their resilience. Installing automated shut-off valves and real-time seismic monitoring systems across high-priority PRS facilities is also necessary to minimize operational disruptions during seismic events.
This study’s findings align with prior research but offer enhanced specificity by integrating DBSCAN clustering with GIS-based spatial analyses. The identification of high-risk zones and outlier facilities provides a nuanced understanding of seismic vulnerabilities, enabling targeted mitigation strategies. Compared to traditional clustering approaches, DBSCAN’s ability to identify density-connected clusters and noise points offers a higher granularity of analysis, which is critical for urban seismic risk planning. For example, Zare et al. (2021) highlighted the utility of density-based clustering in urban seismic assessments, validating the approach used in this study.
The final rankings of districts and PRS facilities are summarized in Table 6, offering a clear prioritization for seismic risk mitigation efforts. Districts 2 and 10, along with facilities such as PRS-26 and PRS-10, should be the focal points of retrofitting and disaster preparedness measures.
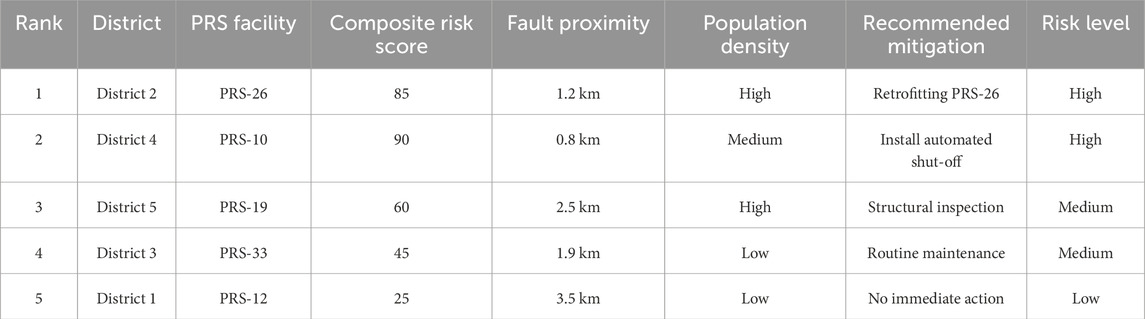
Table 6. Ranked list of Tehran’s high-risk districts and PRS facilities.
By focusing on scientifically grounded, data-driven assessments, this study provides a robust framework for prioritizing seismic risk mitigation in Tehran. The integration of GIS-based spatial visualization, DBSCAN clustering, and decision matrix analyses ensures that resource allocation for retrofitting and disaster preparedness is both efficient and effective, ultimately enhancing the resilience of Tehran’s critical gas distribution infrastructure.
The structural damage analysis revealed distinct vulnerabilities in PRS buildings under fault-specific seismic scenarios. Masonry structures exhibited significantly higher levels of damage compared to steel-frame designs, particularly under earthquakes originating from the Mosha, South Rey, and North Tehran Faults. This is illustrated in Figure 7, which provides a visual comparison of damage patterns. Masonry structures consistently showed extensive cracking and structural instability, emphasizing the need for retrofitting in older districts, whereas steel-frame structures demonstrated comparatively better resilience.
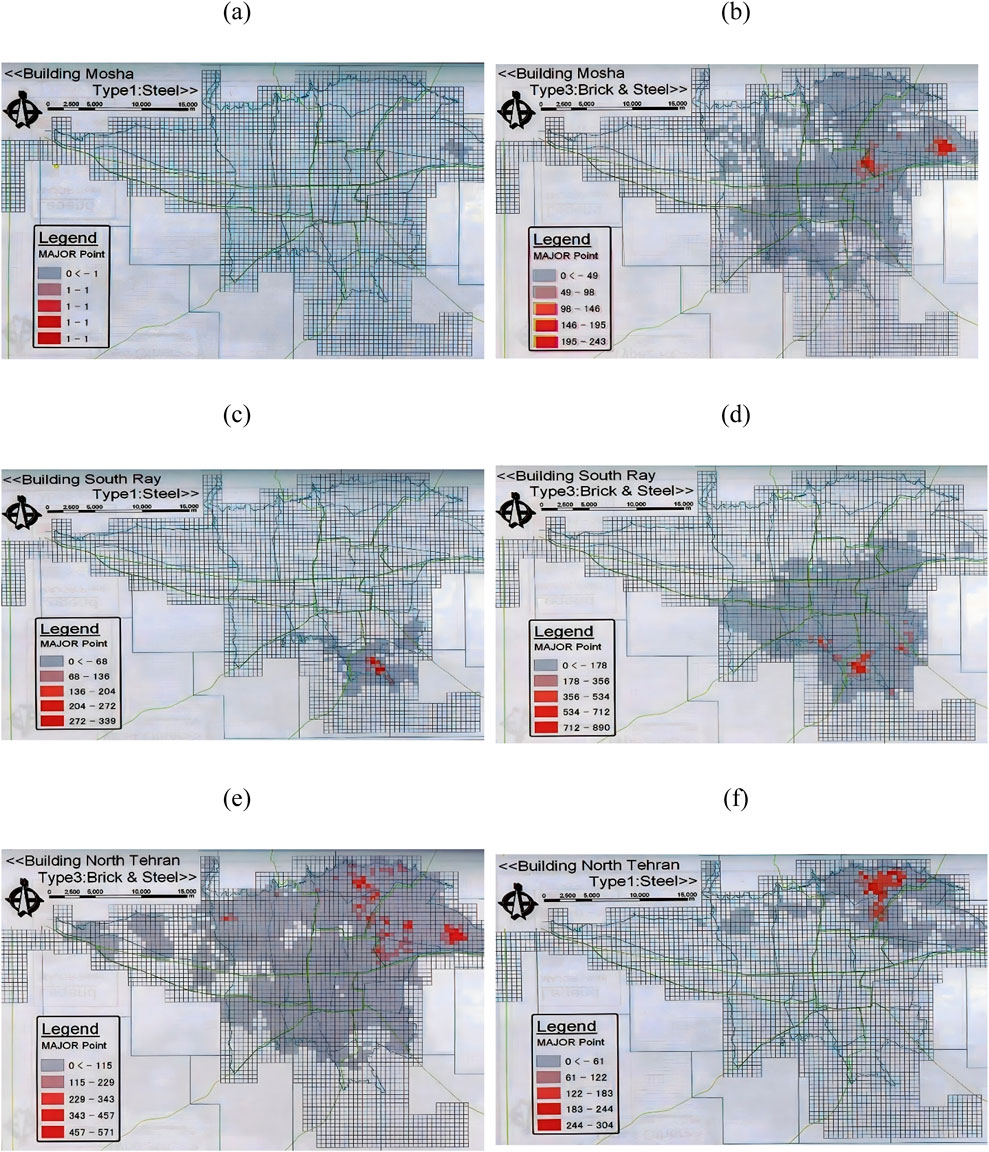
Figure 7. Major Damage to Gas PRS Buildings (a) Steel frame structure under Mosha Fault earthquake (b) Masonry structure under Mosha Fault earthquake (c) Steel frame structure under South Rey Fault earthquake (d) Masonry structure under South Rey Fault earthquake (e) Steel frame structure under North Tehran Fault earthquake (f) Masonry structure under North Tehran Fault earthquake.
3.5 Damage probability distributions for seismic scenarios
The seismic performance of PRS infrastructure was evaluated under several critical damage modes that represent typical failure mechanisms during earthquake events. Figure 8 illustrates the spatial distributions of damage probabilities for each mode. These damage scenarios were derived by integrating GIS-based hazard data with structural vulnerability indicators, calibrated using empirical fragility curves and expert judgment. The following modes are described:
(a) Ground Shaking on Straight Pipelines:
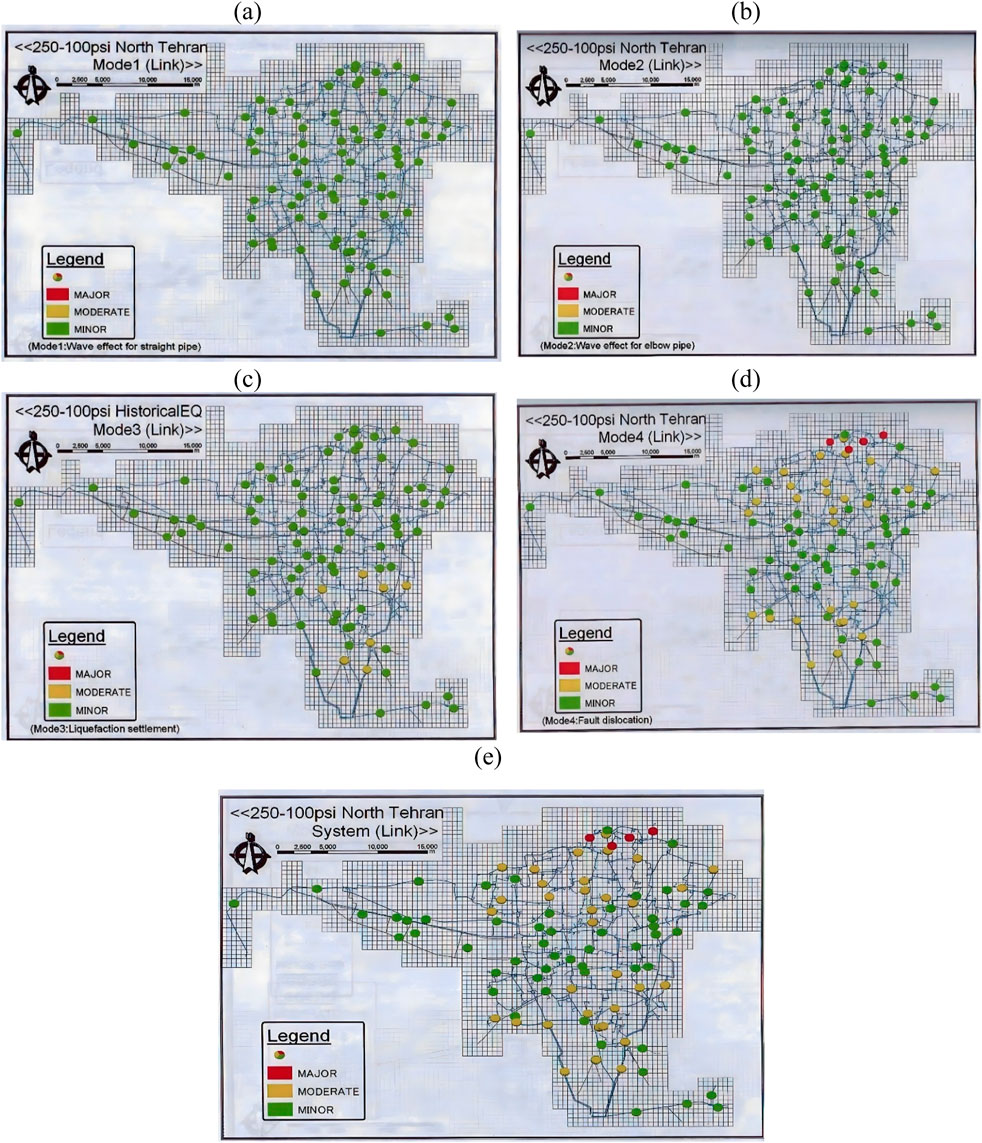
Figure 8. Damage probability distributions under various seismic modes for PRS facilities (a) Effect of seismic waves on straight pipelines, (b) Effect of seismic waves on pipeline bends, (c) Settlement caused by liquefaction, (d) Effect of fault displacement, and (e) Overall probability of damage for PRS facilities under seismic scenarios.
This mode represents axial and shear stresses induced on long straight pipeline segments due to strong ground motion. The probability of damage was calculated based on peak ground acceleration (PGA) values interpolated across the network and applied to pipeline fragility thresholds. Higher probabilities were observed in areas with shallow buried pipelines and poor soil conditions.
(b) Seismic Effects on Pipeline Bends (Elbows):
Bends and elbows in the pipeline network are especially vulnerable due to stress concentrations. Damage probabilities were estimated by correlating geometric discontinuities with site-specific seismic demand. Areas with multiple directional changes in high-PGA zones exhibited elevated risk.
(c) Liquefaction-Induced Settlement:
Seismic shaking in saturated, unconsolidated soils may induce liquefaction, leading to differential ground settlements that affect pipeline stability. Damage probabilities were modeled by overlaying liquefaction susceptibility zones with pipeline locations and assigning risk scores based on empirical pipeline deformation data.
(d) Fault Displacement:
Pipelines intersecting or near active faults are susceptible to rupture from fault displacement. The damage probability in this mode was calculated based on buffer zones around mapped fault traces and displacement projections. These locations pose the highest risk for catastrophic failure due to direct fault offset.
(e) Composite Damage Probability (Integrated Risk):
This cumulative mode aggregates the probability distributions from the previous four scenarios to present an overall risk profile. It reflects the compounded vulnerability of PRS facilities under multifactorial seismic threats. This comprehensive layer was used to prioritize pipeline retrofitting and emergency response planning.
These damage modes provide a multi-dimensional understanding of seismic threats, allowing for targeted interventions at both the component and system levels. The resulting damage probability maps inform strategic decisions regarding PRS reinforcement and seismic risk mitigation.
4 Discussion and implications for seismic resilience
The findings of this study provide a comprehensive framework for assessing and prioritizing seismic vulnerabilities in Tehran’s gas distribution network. By integrating GIS and the DBSCAN clustering algorithm, high-risk zones and outlier PRS facilities were identified with precision, enabling data-driven decision-making for retrofitting and mitigation efforts. The multi-criteria decision matrix further quantified these vulnerabilities by incorporating 21 sub-criteria, each weighted to reflect its relative importance. This systematic approach not only highlights critical areas requiring intervention but also ensures transparency and reproducibility in the evaluation process. The decision matrix revealed that Districts 2 and 10 emerged as the most vulnerable due to their proximity to active fault lines, high ground motion intensities, and the presence of aging masonry PRS structures. Facilities such as PRS-26 and PRS-10 were ranked as top priorities for retrofitting, reflecting their critical role in maintaining the city’s gas distribution network. The integration of DBSCAN clustering into the decision matrix underscored the importance of spatial clustering in identifying high-risk areas and unique outliers, such as densely clustered PRSs near fault lines and isolated facilities in geologically unstable areas.
Comparison with similar studies highlights the novelty of this framework. Unlike previous research, which often focuses on generalized seismic assessments, this study combines advanced spatial analysis with infrastructure-specific evaluations. By incorporating GIS, DBSCAN clustering, and a multi-criteria decision matrix, it bridges gaps in existing methodologies, offering a more targeted and actionable approach to seismic risk management. Despite its strengths, the framework has limitations that should be acknowledged. The reliability of the findings depends on the quality and completeness of the input data, including seismic hazard maps, historical earthquake records, and structural characteristics of PRS facilities. One of the key limitations is the lack of reliable data on the year of construction of PRSs in Tehran. The construction year is a crucial factor in seismic vulnerability assessments, as older facilities—particularly those built before modern seismic codes (1990)—tend to exhibit higher fragility. However, due to the absence of a comprehensive dataset on PRS construction years, this study relied on alternative structural parameters for evaluating PRS vulnerability. While these alternative indicators offer a practical approach, future studies would benefit from a more complete dataset that explicitly includes age-related deterioration and retrofitting history of PRSs. Additionally, the selection of DBSCAN parameters, such as epsilon (ϵ) and MinPts, introduces subjectivity into the clustering process, which may affect the classification of high-risk areas. Sensitivity analyses were conducted to optimize these parameters, but further refinement could enhance robustness. Another important consideration is the minimum data requirements necessary to apply this framework in other contexts. At a minimum, essential datasets should include seismic hazard information such as fault line locations, ground motion intensity maps, and historical earthquake records, along with infrastructure data on PRS locations, structural types, and operational parameters. Additional geospatial information, including population density, road networks, and land use classification, is also crucial to ensure a comprehensive risk assessment.
While the methodology is transferable to other regions or infrastructure types, the results of this study are specific to Tehran and should be adapted to account for differing geological and infrastructural contexts elsewhere. Future research could enhance the robustness of this framework by incorporating real-time seismic monitoring data, which would allow for dynamic updates to risk assessments. Expanding the application of this methodology to other types of critical infrastructure, such as transportation networks or water supply systems, would further strengthen urban resilience by providing a holistic approach to disaster preparedness. The development of machine learning-based approaches to optimize DBSCAN clustering and refine seismic vulnerability classifications could improve clustering accuracy and predictive modeling. Long-term evaluations of implemented mitigation measures would provide valuable insights into the practical effectiveness of the proposed framework. Additionally, acquiring and integrating historical construction data would significantly improve vulnerability modeling and provide a more accurate assessment of aging infrastructure. By addressing these future research areas, the proposed methodology can continue to evolve and contribute to seismic risk management strategies for urban infrastructure systems.
5 Conclusion
This study provides a novel and practical framework for assessing seismic vulnerabilities in urban infrastructure by integrating GIS, DBDM, and DBSCAN. The framework effectively combines advanced spatial analysis and decision-making tools to offer a reliable and detailed approach to seismic risk assessment. Its application to Tehran’s PRSs demonstrated the framework’s ability to identify high-risk zones and critical infrastructure requiring immediate attention.
The results highlight the significance of integrating clustering algorithms like DBSCAN, which successfully identified both high-risk clusters and outliers, offering a level of detail and precision beyond conventional methods. Additionally, GIS-based spatial mapping provided clear visualizations of vulnerability distributions, aiding policymakers in prioritizing interventions. By combining these tools, the study enables a multi-layered analysis of seismic hazards, accommodating the complexities of urban infrastructure in seismically active regions. The adaptability of the DBDM framework, which dynamically incorporates probabilistic data, ensures that risk assessments remain relevant and reliable as new seismic or structural information becomes available.
Despite its strengths, this research is context-specific and relies on the availability and quality of input data. While the framework is transferable to other regions or infrastructure systems, further customization is necessary to account for local geological and infrastructural conditions. To enhance the robustness of the framework, future research should explore the integration of real-time seismic monitoring systems to allow dynamic updates to vulnerability assessments. Expanding the application of the framework to other types of critical infrastructure, such as transportation networks, water supply systems, and power grids, would also validate its broader applicability. Additionally, future studies could leverage machine learning algorithms to improve clustering accuracy and predictive modeling of seismic risks. Long-term evaluations of the effectiveness of retrofitting measures and disaster mitigation strategies would provide valuable insights for optimizing resource allocation and enhancing urban resilience.
In conclusion, this research offers a scientifically robust and scalable solution for seismic vulnerability assessment, with applications that extend beyond the case study of Tehran. The proposed framework sets a precedent for integrating advanced decision-making and spatial analysis tools, enabling effective disaster preparedness and resource allocation in urban environments. By addressing both spatial and decision-making complexities, this framework provides actionable solutions to enhance the resilience of critical infrastructure and lays the foundation for broader applications in urban disaster management and resilience planning.
Data availability statement
The raw data supporting the conclusions of this article will be made available by the authors, without undue reservation.
Author contributions
AK: Funding acquisition, Resources, Writing – original draft. ST: Conceptualization, Methodology, Supervision, Validation, Writing – original draft, Writing – review and editing. ME: Data curation, Formal Analysis, Software, Writing – review and editing. HM: Conceptualization, Methodology, Project administration, Writing – review and editing.
Funding
The author(s) declare that no financial support was received for the research and/or publication of this article.
Conflict of interest
The authors declare that the research was conducted in the absence of any commercial or financial relationships that could be construed as a potential conflict of interest.
Generative AI statement
The author(s) declare that Generative AI was used in the creation of this manuscript. In preparing this manuscript, we have utilized artificial intelligence (AI) tools for grammar checking, language enhancement, and assisting in identifying relevant references. However, all intellectual contributions, research methodologies, analysis, and conclusions are solely the work of the authors. The AI tools were used to refine clarity and improve readability without altering the scientific content or originality of the study.
Publisher’s note
All claims expressed in this article are solely those of the authors and do not necessarily represent those of their affiliated organizations, or those of the publisher, the editors and the reviewers. Any product that may be evaluated in this article, or claim that may be made by its manufacturer, is not guaranteed or endorsed by the publisher.
References
Berberian, M., and Yeats, R. S. (1999). Patterns of historical earthquake rupture in the Iranian plateau. Bull. Seismol. Soc. Am. 89 (1), 120–139. doi:10.1785/bssa0890010120
Brauers, W. K. M., and Zavadskas, E. K. (2010). Project management by multimoora as an instrument for transition economies/projektų vadyba su multimoora kaip priemonė pereinamojo laikotarpio ūkiams. Technol. Econ. Dev. Econ. 16 (1), 5–24. doi:10.3846/tede.2010.01
Campello, R. J. G. B., Moulavi, D., and Sander, J. (2013). “Density-based clustering based on hierarchical density estimates,” in, Advances in knowledge discovery and data mining. PAKDD 2013. Lecture Notes in Computer Science (Springer) 7819 (pp. 160–172). doi:10.1007/978-3-642-37456-2_14
Chen, W., Li, Y., and Gu, X. (2018). A GIS-based AHP approach to flood risk management in the dongting lake region, China. Nat. Hazards 90 (2), 963–978. doi:10.1080/19475705.2018.1524400
Chen, Y., Chen, T., and Li, S. (2015). Flood risk assessment and mapping in taiwan using GIS, fuzzy logic, and multi-criteria decision-making approach. Environ. Earth Sci. 74 (9), 7319–7329.
Cutter, S. L., Burton, C. G., and Emrich, C. T. (2010). Disaster resilience indicators for benchmarking baseline conditions. J. Homel. Secur. Emerg. Manag. 7 (1), 1–22. doi:10.2202/1547-7355.1732
Dall’erba, S., and Jiang, T. (2013). Fuzzy multicriteria decision-making approach for seismic risk evaluation in southwestern US. Appl. Geogr. 45, 158–167.
Delavar, M. R., and Moradi, A. (2007). “Seismic hazard assessment and earthquake scenario simulation for the city of tehran,” in Methods and tools for earthquake ground motion simulation (Springer), 517–526.
Delgado, M., Chen, W., and Chen, T. (2024). Fuzzy MCDM-GIS framework for seismic risk evaluations with incomplete data: a case study in central asia. Appl. Geosci. 19 (1), 67–79.
Ebrahimi, S., and Koch, M. (2019). Wildfire risk assessment using a GIS-based multi-criteria decision analysis approach: a case study in golestan province, Iran. Earth Syst. Environ. 3 (2), 303–316.
Ebrahimian, H., Shafiei, S., and Lahiji, A. (2020). Vulnerability assessment of aging masonry-based infrastructure in seismic regions. J. Seismol. Earthq. Eng. 22 (4), 387–409.
Ester, M., Kriegel, H.-P., Sander, J., and Xu, X. (1996). “A density-based algorithm for discovering clusters in large spatial databases with noise,” in Proceedings of the second international conference on knowledge discovery and data mining. KDD ’96, 226–231.
Greco, S., Matarazzo, B., and Slowinski, R. (2001). Rough sets theory for multicriteria decision analysis. Eur. J. Operational Res. 129 (1), 1–47. doi:10.1016/s0377-2217(00)00167-3
Hosseini, M., Izadkhah, Y. O., and Wangel, J. (2020). Challenges for earthquake risk management in tehran. Int. J. Disaster Risk Reduct. 49, 101650.
JICA (2000). The study on seismic microzoning of the greater tehran area in the Islamic Republic of Iran. Japan International Cooperation Agency.
Karimi, A., Shafiei, S., and Ebrahimian, H. (2019). Assessment of outlier risks in urban seismic planning. Nat. Hazards 95 (3), 1165–1181.
Lahijanian, H., and Hashemi, M. (2016). Seismic risk assessment of gas distribution networks in tehran using GIS-based approaches. Nat. Hazards 83 (2), 847–864.
Li, X., Zavadskas, E. K., and Mardani, A. (2023). Enhanced MULTIMOORA approach for energy and environmental decision-making under uncertainty. Sustainability 15 (10), 8432–8449.
Malczewski, J. (2006). GIS-based multicriteria decision analysis: a survey of the literature. Int. J. Geogr. Inf. Sci. 20 (7), 703–726. doi:10.1080/13658810600661508
Mansouri Daneshvar, M. R., Ebrahimpour, M., and Mirmohammadi, M. (2013). Earthquake vulnerability assessment in Iran using GIS-based analytic Hierarchy process. Nat. Hazards 68 (2), 1019–1036.
Mardani, A., Jusoh, A., Nor, K. M., Khalifah, Z., Zavadskas, E. K., and Valipour, A. (2015). Multiple criteria decision-making techniques and their applications – a review of the literature from 2000 to 2014. Econ. Research-Ekonomska Istraživanja 28 (1), 516–571. doi:10.1080/1331677x.2015.1075139
Mian, Q., and Ghanbari, A. (2017). Risk assessment of gas pressure reduction stations in earthquake-prone regions of Iran. J. Loss Prev. Process Industries 48, 90–99.
Momani, N. M., and Fadil, A. A. (2019). Integrating AHP and GIS for earthquake hazard mapping in Jordan. Geomatics, Nat. Hazards Risk 10 (1), 1638–1657.
Opricovic, S., and Tzeng, G.-H. (2004). Compromise solution by MCDM methods: a comparative analysis of VIKOR and topsis. Eur. J. Operational Res. 156 (2), 445–455. doi:10.1016/s0377-2217(03)00020-1
Ruggieri, S., Calò, M., Cardellicchio, A., and Uva, G. (2022). Analytical-mechanical based framework for seismic overall fragility analysis of existing RC buildings in town compartments. Bull. Earthq. Eng. 20, 8179–8216. doi:10.1007/s10518-022-01516-7
Ruggieri, S., Liguori, F. S., Leggieri, V., Bilotta, A., Madeo, A., Casolo, S., et al. (2023). An archetype-based automated procedure to derive global-local seismic fragility of masonry building aggregates: META-FORMA-XL. Int. J. Disaster Risk Reduct. 95, 103903. doi:10.1016/j.ijdrr.2023.103903
Shakerian, M., Alizadeh, B., and Ashrafi, A. (2016). A new hybrid model for earthquake hazard zonation using ANP, GIS, and VIKOR. Earth Sci. Inf. 9, 147–163.
Shafiei, M., Motamedi, A., and Hammad, A. (2018). Enhancing resilience of infrastructure systems to seismic hazards: A decision-support framework. Natural Hazards Review 19 (3), 04018009. doi:10.1061/(ASCE)NH.1527-6996.0000294
Shekhar, S., Lu, C.-T., and Zhang, P. (2003). A unified approach to detecting spatial outliers. GeoInformatica 7 (2), 139–166.
Tosto, C., Leggieri, V., Ruggieri, S., and Uva, G. (2025). A multisource methodology for the regional seismic fragility assessment of existing masonry buildings in historical centres. Int. J. Archit. Herit., 1–26. doi:10.1080/15583058.2025.2461119
Triantaphyllou, E. (2000). Multi-criteria decision making methods: a comparative study. Boston, MA: Springer.
Zare, M., Soghrat, M. R., and Eskandari, A. (2021). Seismic risk assessment of urban infrastructure using machine learning algorithms. Earthq. Eng. and Struct. Dyn. 50 (8), 1021–1043.
Keywords: seismic vulnerability, GIS, pressure reduction stations, dominance-based decision-making, DBSCAN clustering, disaster risk management, urban resilience
Citation: Khoshnoud A, Tayaran S, Ehsanifar M and Mazaheri H (2025) A decision-making framework for seismic risk assessment in gas distribution networks: a case study of Tehran, Iran. Front. Built Environ. 11:1569624. doi: 10.3389/fbuil.2025.1569624
Received: 01 February 2025; Accepted: 15 April 2025;
Published: 28 April 2025.
Edited by:
Qiang Zhang, Guangxi University, ChinaReviewed by:
Maria Rosa Trovato, University of Catania, ItalyJosé-Lázaro Amaro-Mellado, Sevilla University, Spain
Copyright © 2025 Khoshnoud, Tayaran, Ehsanifar and Mazaheri. This is an open-access article distributed under the terms of the Creative Commons Attribution License (CC BY). The use, distribution or reproduction in other forums is permitted, provided the original author(s) and the copyright owner(s) are credited and that the original publication in this journal is cited, in accordance with accepted academic practice. No use, distribution or reproduction is permitted which does not comply with these terms.
*Correspondence: Shahrzad Tayaran, c2gudGF5ZXJhbkBpYXUuYWMuaXI=