 Angelo Di Egidio
 Alessandro Contento
- 1Department of Civil, Construction-Architectural and Environmental Engineering, University of L’Aquila, L’Aquila, Abruzzo, Italy
- 2College of Civil Engineering, Fuzhou University, Fuzhou, China
Improving the seismic response of new and existing structures is a fundamental topic in civil engineering. Often, in structural mechanics this issue is addressed through low-dimensional mechanical models capable of capturing the primary dynamics of the structure. In contrast to most studies in the scientific literature that use two-dimensional models to describe structural behavior, this paper employs a low-dimensional, three-dimensional (3D) mechanical model to capture the seismic response of a structure, also accounting for its torsional effects. This low-dimensional model is used to investigate two different methods for improving seismic response. One approach involves inerter devices directly connected to the structure, while the other is based on connecting the structure to external auxiliary structures, equipped in turn with inerters. Therefore, in this case, the inerter devices are connected directly to the external structures. The responses of the original stand-alone frame structure and those with the two proposed methods are compared to assess the effectiveness of each approach. Three different earthquake records are used as base excitation. The results are presented in performance curves and maps, showing the response in terms of displacements of key points of the structure as various system parameters are varied. The results reveal the good performance of both methods over a wide range of parameters, with particularly favorable results for the approach using external structures equipped with inerter devices.
1 Introduction
Improving the seismic response of new and existing structures is a fundamental topic in civil engineering. Often, structural mechanics, this issue addressed through low-dimensional mechanical models capable of capturing the primary dynamics of the structure.
The seismic behavior of actual structures is often studied by using low-dimensional models. A general three-dimensional (3D), multi-degree-of-freedom (M-DOF) frame structure is modeled through a planar, two-degree-of-freedom (2-DOF) shear-type system. For instance, such low-dimensional model were employed to explore the conceptual aspects of the base isolation technique as proposed by (Kelly, 1995), as well as tuned mass damper (TMD) systems discussed in (Den Hartog, 1956; Rana and Soong, 1998; Miranda, 2005). Furtherly, (Tsai, 1995), and (Taniguchi et al., 2008) examined the reduction of base displacement in a base-isolated system using a TMD.
In recent years, the same approach utilizing low-dimensional models was employed to explore the application of TMDs as common techniques for protecting frame structures against earthquake. In (Dadkhah et al., 2020; Khatibinia et al., 2018; Kamgar et al., 2018; Kamgar et al., 2025), TMD systems were implemented to safeguard high-rise buildings, while in (Salimi et al., 2021; Kamgar et al., 2020) a friction TMD and a modified tuned liquid damper were used to enhance the seismic response of buildings. Additionally, in (Reggio and De Angelis, 2015; Fabrizio et al., 2017a; Fabrizio et al., 2019; Pagliaro and Di Egidio, 2022a; Wang et al., 2013; Pagliaro and Di Egidio, 2022a; Di Egidio et al., 2023), the use of an intermediate discontinuity as a non-conventional TMD was studied.
Typically, TMDs require a small mass to function effectively. However, when subjected to seismic excitation, the use of a small mass may hinder the TMD’s performance. This issue can be mitigated by coupling the TMD with an inerter device, which acts as a virtual mass to amplify inertial forces, as illustrated in (Marian and Giaralis, 2014). This combination led to the development of the Tuned Mass Damper Inerter (TMDI), a device that was extensively studied in various papers (Brzeski et al., 2015; Pietrosanti et al., 2017; De Domenico and Ricciardi, 2018; De Domenico et al., 2018; Giaralis and Taflanidis, 2018; Pietrosanti et al., 2020; Prakash and Jangid, 2022).
Different external devices that are suitable combinations of TMDs and inerters or that have hysteretic behavior were proposed to improve the seismic performances of structures. Also using low-dimensional mechanical models, recently in (Di Egidio and Contento, 2023; Di Egidio and Contento, 2022) a hysteretic device connecting the Tuned Mass Damper Inerter to the structure was used, referred to as the Hysteretic Mass Damper (HMDI), or in (Di Egidio et al., 2022a) where the connection of the frame structure with a short, hysteretic exoskeleton was considered.
Among the different possibilities to improve the seismic response of structures, one option is the regularization of torsional modes, particularly as architectural innovation increasingly prioritizes aesthetic asymmetry. Uncontrolled torsion during seismic or wind events amplifies localized damage, accelerates structural fatigue, and threatens life safety, as tragically illustrated by torsional failures in the 1985 Mexico City earthquake (Osteraas and Krawinkler, 1989). Contemporary building codes, such as ASCE 7–22 (2022) (American Society of Civil Engineers, 2022), now enforce stricter limits on torsional irregularities, reflecting lessons from past disasters.
Research on the regularization of torsional modes, aimed at mitigating vulnerabilities in asymmetric structures under seismic excitations, has evolved through analytical, experimental, and computational approaches. Early work by (Rutenberg, 1992) provided a critical review of nonlinear responses in asymmetric buildings, emphasizing the inadequacy of linear code provisions to address torsional coupling under extreme seismic demands. This work underscored the necessity of incorporating nonlinear behavior into design codes. Building on this, (Anagnostopoulos et al., 2015), expanded the discourse by systematically reviewing earthquake-induced torsion, highlighting challenges such as bidirectional excitation effects and the underestimation of torsional amplification in static code-based methods. Their synthesis advocated for dynamic analysis and performance-based design for torsionally irregular structures. Further analytical advancements were pioneered by De la Llera and Chopra (De la Llera and Chopra, 1995), who modeled the inelastic seismic behavior of asymmetric-plan buildings, demonstrating that torsional coupling amplifies ductility demands and interstory drift. Their findings necessitated code-compliant stiffness redistribution strategies. Subsequent studies, such as (Lim et al., 2018), empirically validated these analytical insights by analyzing a 3D asymmetric multi-story reinforced concrete structure. Their results showed that torsional irregularities exacerbate floor displacements and shear forces under bidirectional ground motions. Similarly, (Manish and Syed, 2017), compared symmetric and asymmetric buildings, revealing that even minor plan irregularities induce significant torsional responses, necessitating stricter code compliance.
The role of strong-motion duration in torsional response scaling was later investigated in (Málaga-Chuquitaype, 2021), revealing that prolonged seismic durations intensify torsional demands in systems with nonlinear behavior, particularly those experiencing strength and stiffness degradation. This work highlighted the need for duration-sensitive design criteria in modern codes. Analytical methods have also evolved to support regularization: (Zalka, 2001): introduced a simplified approach for calculating natural frequencies in wall-frame systems, enabling efficient preliminary assessments of torsional stiffness distribution. For nonlinear modeling, (Pelletier and Leger, 2017), developed a framework for reinforced concrete cores, capturing torsional-axial coupling effects and advocating for detailed 3D analysis to prevent premature damage.
Mitigation strategies have been explored across computational and experimental studies. In (Takewaki et al., 2012), the authors proposed a “worst-case scenario” framework for optimizing passive dampers, such as tuned mass dampers (TMDs), to decouple torsional and translational modes during earthquakes, thereby improving energy dissipation. Practical retrofitting techniques, such as stiffening and mass redistribution, were demonstrated by (Harbic et al., 2011) to reduce torsion in existing structures (Botis et al., 2018). extended these efforts by proposing layout optimization of shear walls in rectangular RC buildings to balance torsional resistance without compromising functionality. For new designs (Maske and Pajgade, 2013), emphasized symmetric stiffness distribution, showing that strengthening perimeter elements suppresses torsional vibrations.
Most of the mentioned contributions in the literature address the control of torsional modes by adding or strengthening elements within the structure to be protected. In contrast, this study adopts a different perspective; in particular, this paper extends the study presented in (Di Egidio et al., 2022b), which investigated the seismic response of a frame structure coupled with an external structure equipped with an inerter device. In that study, a general M-DOF frame structure was modeled as a 2-DOF shear-type system. Although the coupling with the external structures proved to be effective in reducing in-plane seismic effects, limited insight was obtained regarding torsional motion, which occurs in spatial frame structures during earthquake excitation. To overcome this limitation a low-dimensional spatial model is developed to investigate the seismic response of a general frame structure. This model is a two-level, spatial shear-type structure, in which it is assumed that the floor slabs are infinitely rigid within their own plane. Consequently, the model has six degrees of freedom, three for each level. While the two papers adopt conceptually similar approaches, employing inerter-based systems to enhance the seismic performance of frame structures, the present paper specifically focuses on mitigating torsional effects induced by asymmetric mass or stiffness distribution. This is achieved by strategically placing inertial devices to counteract rotational responses, whereas the previous study emphasizes the reduction of translational displacements and inter-storey drifts through coupling with an external, deformable structure.
The present study assumes linear behavior for both the structural system and the damping devices. While this simplification enables clearer interpretation of the fundamental dynamic mechanisms, particularly under moderate to strong excitations, it does not capture potential nonlinear effects such as yielding or stiffness degradation. The adoption of a linear model, widely accepted for preliminary design and parametric assessment, avoids the need to define a specific nonlinear formulation, which would require selecting a structural typology and significantly increasing the input data and model complexity, thus limiting generalizability.
Two distinct methods are proposed to enhance the seismic response of a three-dimensional (3D) frame structure. The first approach (System 1) integrates inerter devices directly into the structural system, whereas the second (System 2) couples the frame with external auxiliary structures incorporating inerters. The developed model facilitates a comprehensive assessment of torsional effects and evaluates the comparative efficacy of both systems in mitigating such responses. Using a Lagrangian formulation, the equations of motion are derived for three configurations: (i) the stand-alone frame structure, (ii) System 1, and (iii) System 2.
Three different earthquake records are used as base excitation to assess the effectiveness of each approach. An extensive parametric analysis is conducted by varying the fundamental parameters of the mechanical systems. Two performance indexes are introduced to evaluate the effectiveness of the proposed methods in comparison to the stand-alone frame structure. These indexes are defined as the ratios of the displacements or drifts of System one or System two and those of the stand-alone frame structure. A value of these indexes less than unity indicates that Systems one and two are effective in reducing the seismic effects on the frame structure. The results of the parametric analysis are presented in performance curves and maps that plot the performance indexes as functions of one or two parameters, respectively. Special attention is devoted to the effects of aligning the mass and stiffness centers at the first level in both System 1 and System 2.
2 Mechanical system
Two different methods are investigated to improve the seismic performance of a 3D frame structure. In the following analysis, a general spatial multi-degree-of-freedom (M-DOF) frame structure is consistently modeled as a two-level, three-dimensional shear-type system (see Figure 1).
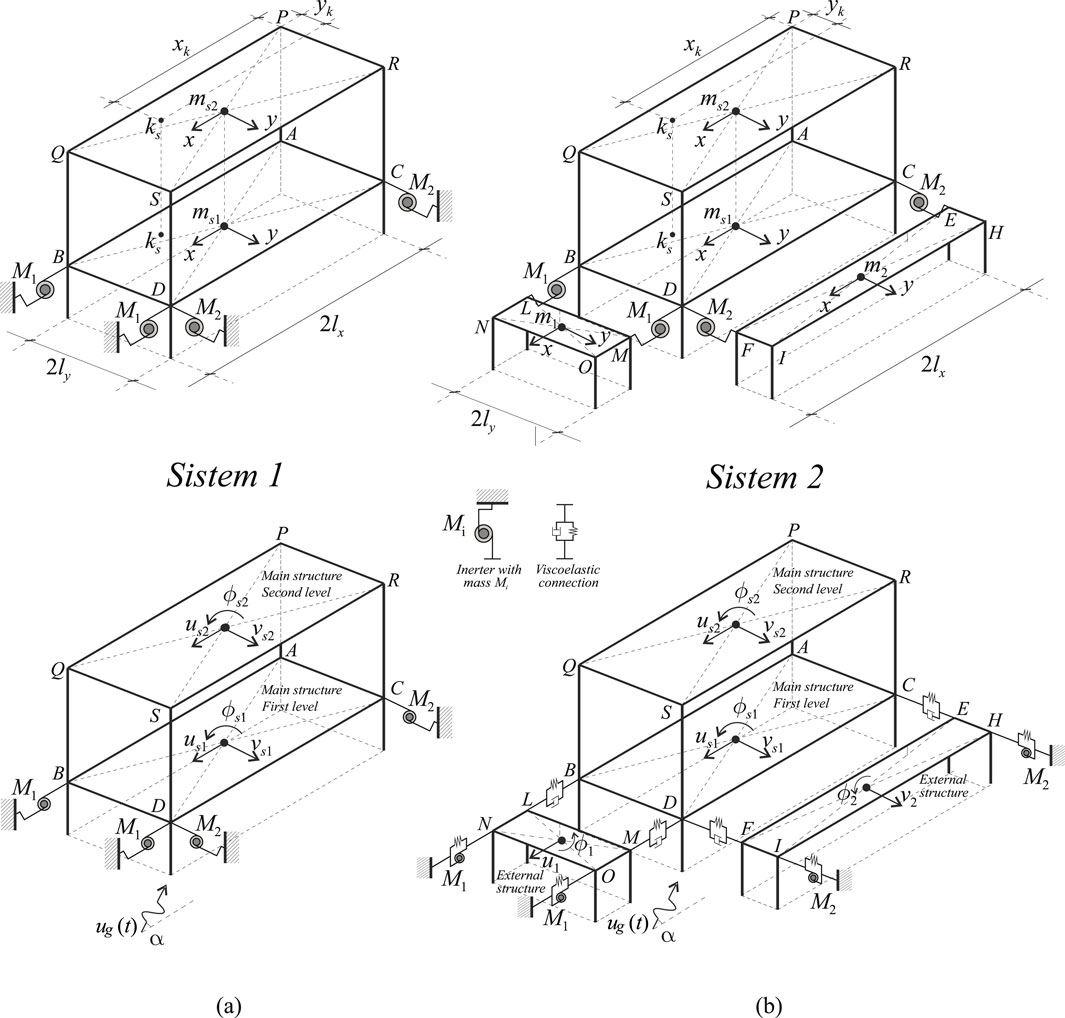
Figure 1. Mechanical systems: (a) System with only inerters (System 1); (b) System with external structures equipped with inerters (System 2).
Each level has the same dimensions
Additionally, the mass distribution is considered uniform, with the center of mass at each level located at the intersection of its diagonals. The masses of the levels are denoted as
The mechanical characteristics of the 6-DOF, 3D shear-type system are selected to be dynamically equivalent to a real M-DOF frame structure, utilizing the dynamic equivalence criterion developed in (Fabrizio et al., 2017a; Fabrizio et al., 2019; Fabrizio et al., 2017b). Specifically, since this criterion was originally formulated for 2D frame structures, it is applied here to define the total stiffness of the two levels of the 6-DOF shear-type system separately along the
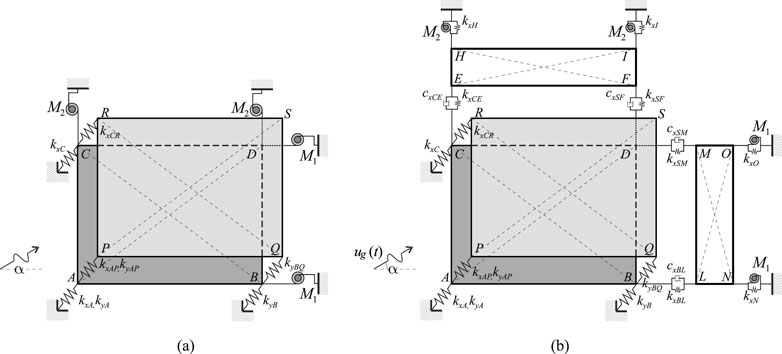
Figure 2. Mechanical systems, location of stiffness and damping elements: (a) System with only inerters (System 1); (b) System with external structures equipped with inerters (system 2).
The two investigated methods to improve the seismic performances of the frame structure both involve the use of inerter devices (see Section 2.4 for a brief description of these devices). In the case of System 1, the inerter devices are directly connected to the first level of the frame structure whose seismic performance is to be improved (see Figure 1a). Specifically, the two inerters
In the case of System 2, the structure to be protected is connected at the first level to two external, auxiliary, rectangular-shaped structures with masses
In both System 1 and System 2 the polar inertia of the sections of the columns are considered negligible. The equations of motion of both the System 1 and System 2 are obtained through a Lagrangian approach.
2.1 Damping of the 3D frame structure
The general equations of motion of the stand-alone, two-level, 3D shear-type system can be formally written as in Equation 1:
where
The damping matrix
where coefficients
In Equation 3,
2.2 System 1: 3D frame structure equipped with inerters
The equations of motion are obtained by a Lagrangian approach. To write the kinetic
where
where
where
To account for the non-conservative forces due to the damping of the structure, their virtual work
where
By introducing the Lagrangian function
The equations of motion are omitted for brevity, but all the equations presented in this section permit their derivation.
2.3 System 2: 3D frame structure coupled to an external apparatus with inerters
To derive the equations of motion of the System 2 (see Figure 1b), the displacements of all the vertexes of the 3D frame structure need to be evaluated. Their displacements are exactly equal to those written for System 1 and reported in Equation 4. Moreover, also the displacements of all the vertexes of the external auxiliary structures have to be written. With respect to coordinate systems that have origin in the mass centers of the two external structures (intersection of the diagonals, see Figure 1b), such displacements read as in Equation 9:
Then kinetic energy
where
where
To account for the non-conservative forces due to the damping of the structure, their virtual work
where
Quantities
Damping coefficients
where
Damping coefficients
where it is always considered
By introducing the Lagrangian function
and can be synthetically written as in Equation 18:
The explicit expressions of such equations are presented in the Supplementary Appendix.
2.4 Inerter device
An inerter is a mechanical device designed to exert a force,
Here,
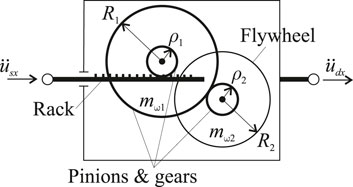
Figure 3. Rack-pinion-flywheel rotational inertia system.
The first two terms of Equation 20 define the virtual mass
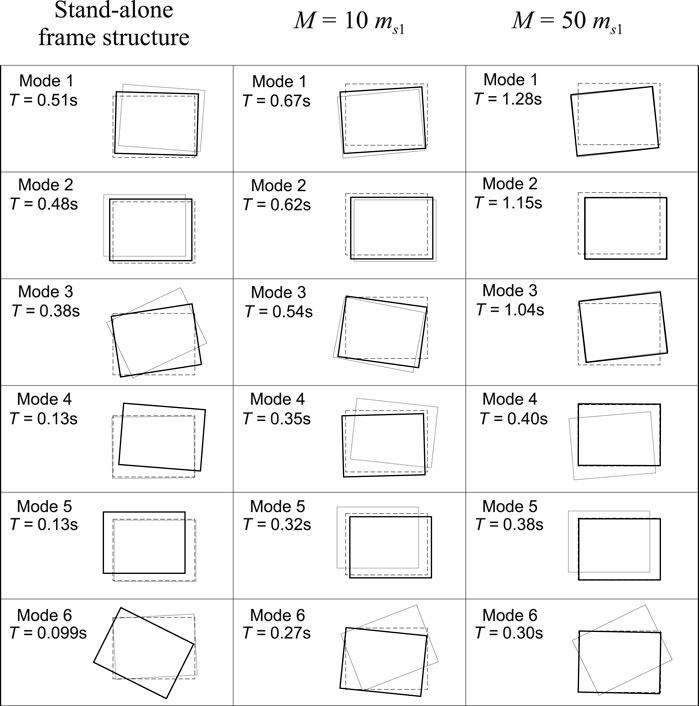
Figure 4. Periods and modal shapes of system 1 with only inerters.
3 Parametric analysis
An extensive parametric analysis is conducted by varying several parameters that characterize the coupled mechanical system. This analysis encompasses both System 1 and System 2 and aims to highlight the role of these parameters in promoting a more informed application of the proposed improvement methods.
3.1 Variable parameters for System 1
After selecting the frame characteristics for the parametric analysis, the fundamental parameter to consider as a variable is the value of the virtual mass provided by the inerters. The total virtual mass
Therefore, for equal inerters along the
3.2 Variable parameters for System 2
For System 2, a higher number of variable parameters than System 1 are investigated to analyse the performance of the protection method. The variable parameters considered in the analysis are.
For equal inerters along the
where
• The total stiffness
The distribution of stiffness is considered variable to allow for adjusting the position of the stiffness center of the global coupled structure. Specifically (Equation 25):
Coefficients
In all the analyses the mass of the auxiliary structures are considered fixed quantities,
3.3 Geometrical and mechanical characteristics of the 3D frame structure
The parametric analyses are performed on two different frame structures. Table 1 shows the original geometrical characteristics of the studied M-DOF frame structures, that are then modeled by two-level, 3D shear-type systems. Specifically, the columns Storeys, Area,

Table 1. Geometrical and mechanical characteristics of the two reference frame structures.
The remaining columns of Table 1 refer to the mechanical characteristics of the two-level, 3D shear-type systems, which are dynamically equivalent to the actual structures. The previously mentioned dynamic equivalence criterion ((Fabrizio et al., 2017a; Fabrizio et al., 2019; Fabrizio et al., 2017b)), used to assess the characteristics of the 3D shear-type systems, determines the values of masses and stiffnesses such that the first level corresponds to the first level of the actual structure, while the second level corresponds to the top level of the actual structure. Consequently, the displacement differences between the two levels serves as a measure of the drift in the actual structure. Columns
The position of the stiffness centers
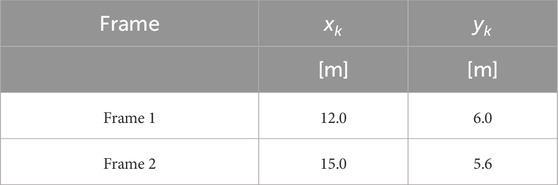
Table 2. Position of the stiffness center of the two reference frame structure.
The eccentricity of the stiffness center with respect to the mass center is caused by the non-uniform distribution of stiffness among the columns along the two alignments parallel to the
3.4 Performance indexes
To evaluate the performance of the proposed methods, two performance indexes are introduced (Equation 27). They read:
where
Two additional performance indexes related to the torsion of the structure are used to assess the performance of the protection methods (Equation 28). They are defined as:
where
With this formulation, the effectiveness of the external apparatus improves as the values of
4 Spectral analysis
The first analysis aims to investigate the impact of the total virtual mass
4.1 Periods and modes of System 1
Both the stand-alone 3D frame structure and System 1 are 6-DOF mechanical systems, therefore they admit six frequencies and oscillation modes. The results of the spectral analysis is reported in Figure 4, which shows the periods and modal shapes of the stand-alone frame structure (left columns), and those of the System 1 with two different total virtual mass
4.2 Periods and modes of System 2
The spectral analysis on System 2 is performed under the hypothesis that
Figure 5 shows the frequencies and modal shapes of the stand-alone frame structure and of System 2 for two different values of
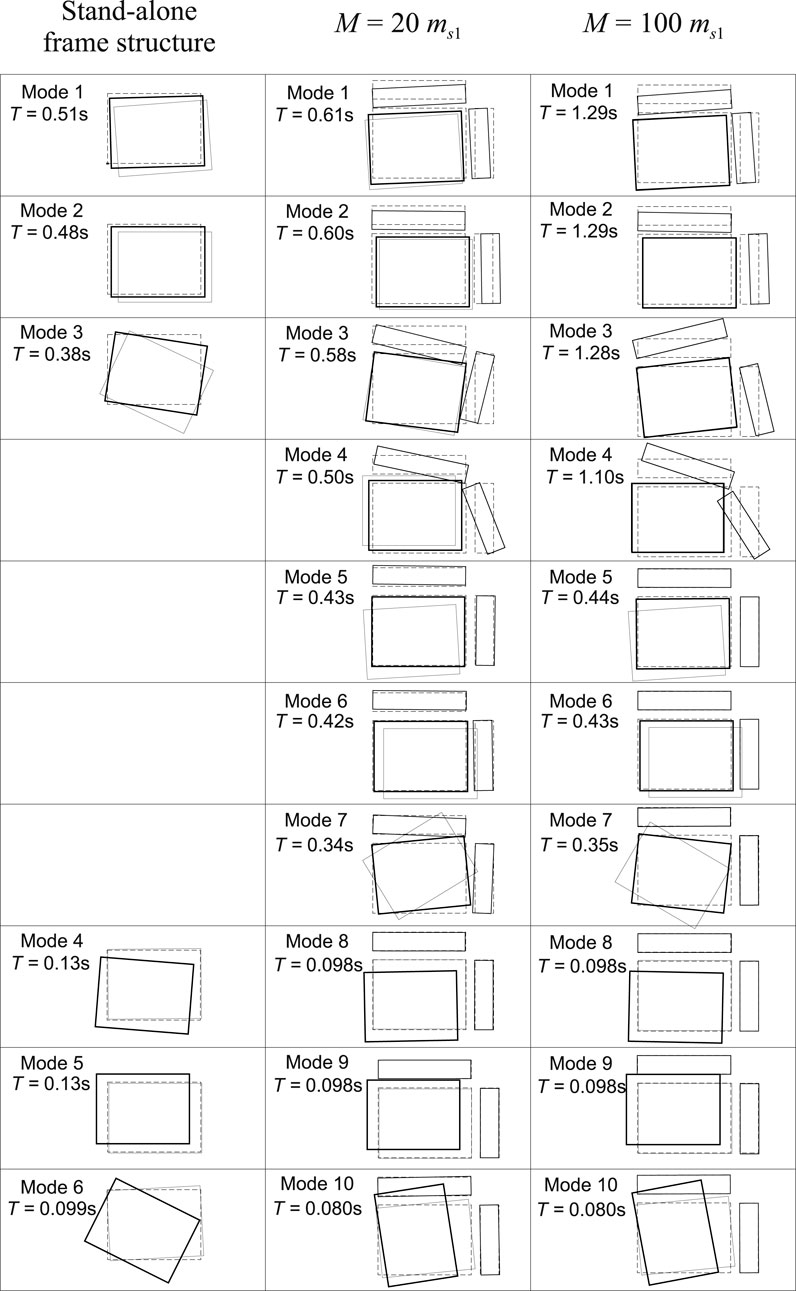
Figure 5. Periods and modal shapes of system 2 with external structures equipped with inerters.
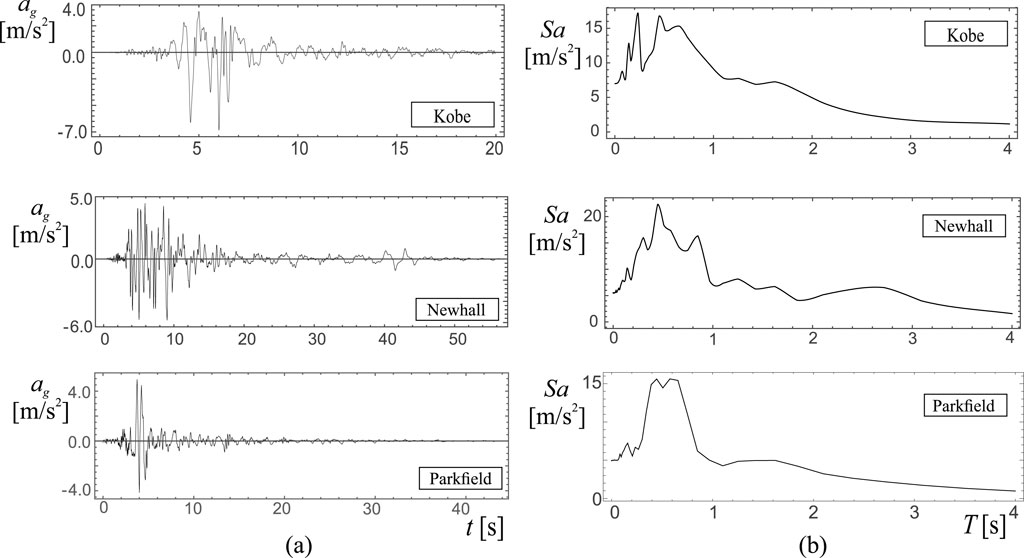
Figure 6. Records of kobe, newhall and parkfield events: (a) Time histories; (b) Pseudo-acceleration spectra.
For the smallest value of
An increase of the virtual mass up to the value of
5 Seismic analysis
The seismic analysis is conducted by subjecting System 1 or System 2 to specific earthquake records and varying one or more parameters (see Section 3). Specifically, the parametric analysis on System 1 is carried out by evaluating the performance indexes
In the regions of the curves or maps where the performance indexes are less than unity, the seismic effects on System 1 and System 2 are smaller than those on the stand-alone frame structure.
5.1 Earthquake records
The following earthquake records are considered in this study (Figure 6).
(a) Kobe, 1995 Japan earthquake, Takarazuka station, 0 deg, ground level, position of the station: 34.8090N, 135.3440W;
(b) Northridge, Newhall, 1994 California earthquake,- LA County Fire station no.24279, 360 deg, position of the station: 34.387N, 118.530W;
(c) Parkfield, 1966 California earthquake, station no.013, comp N65E, position of the station: 35.726N, 120.287W.
For ease of reference, each record is labeled using the underlined name provided in the list.
The use of three natural earthquake records (Kobe, Newhall, and Parkfield) is driven by the need for an initial evaluation of the protection system’s performance under seismic inputs characterized by distinct spectral contents. These records are selected based on their effective use in prior studies by the authors, where they demonstrated marked differences in system dynamics due to variations in frequency content. This distinction is further supported by their pseudo-acceleration spectra, which highlight how different excitations can engage different modal responses of the structural system.
In this preliminary phase of the study, the earthquake records are used without scaling to a specific design spectrum or code-based intensity level. The aim is to qualitatively assess the sensitivity of the protection system to differences in seismic frequency content using natural, unmodified ground motions, thus preserving the intrinsic variability present in real earthquake data. This choice avoids potential distortions introduced by artificial scaling and is justified in the context of the linear structural model adopted in the study. Since the performance of the proposed systems is expressed through normalized response ratios (e.g.,
5.2 Seismic response of System 1
The parametric seismic analysis involves evaluating the performance indices,
Figure 7 shows the results obtained by exciting Frame 1 (see Table 1) with the three selected earthquake records. Each graph displays two performance curves: the solid curve corresponds to the
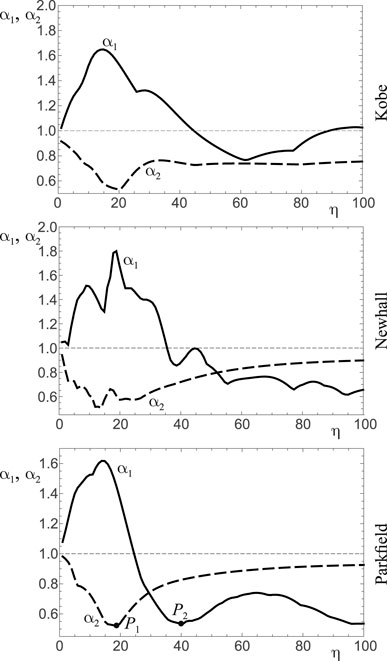
Figure 7. Performance curves
The time-histories of the total displacement
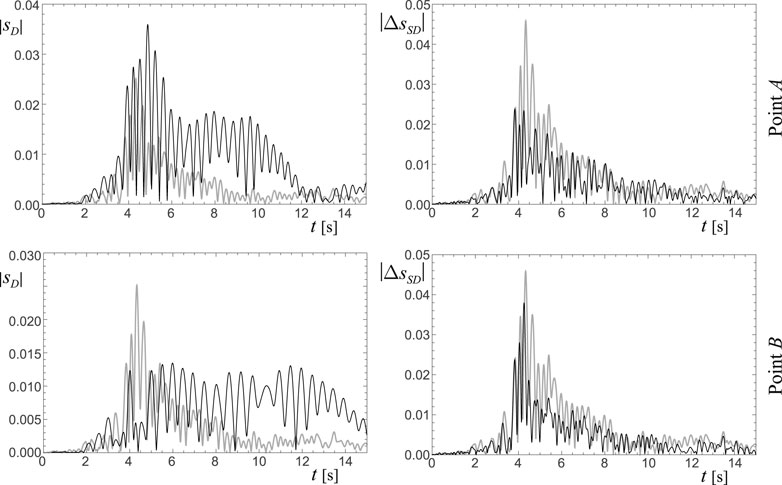
Figure 8. Time-histories of the system 1 under Parkfield earthquake (Frame 1,
The performance curves obtained from Frame 2 (see Table 1) and shown in Figure 9 are qualitatively similar to those referring to Frame one that are shown in Figure 7. Independently from the earthquake record, the performance index
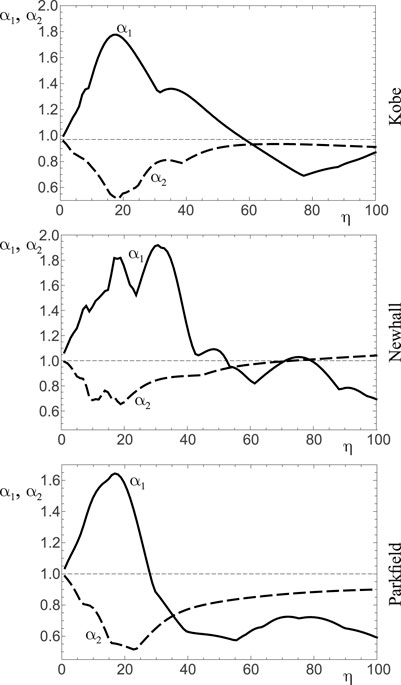
Figure 9. Performance curves
5.3 Seismic response of System 2
The parametric seismic analysis involves mapping the values of the performance indexes,
The first performance maps presented are those referring to Frame 1 (see Table 1), excited by Parkfield earthquake, are obtained. The stiffness of the coupling devices (
Figure 10 shows the performance maps, arranged in matrix form. Specifically, along the rows the maps refer to different values of
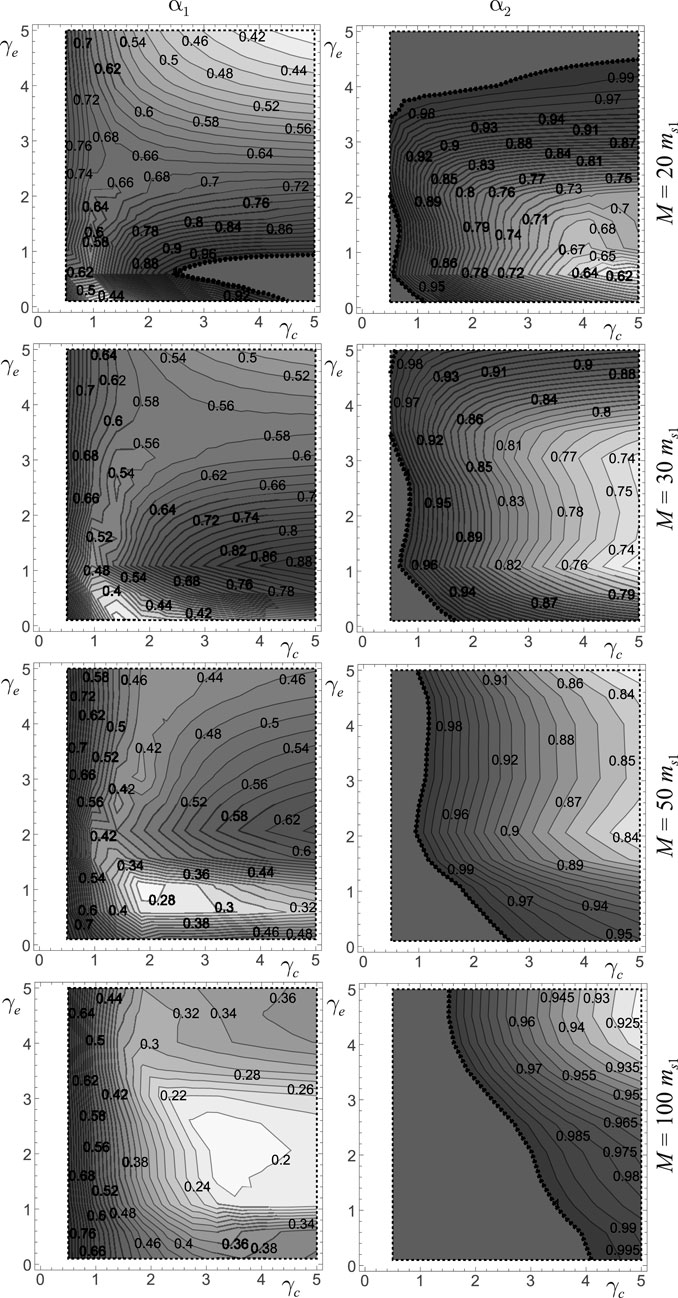
Figure 10. Performance maps
It is of great interest to evaluate the effects occurring from the coincidence between the stiffness and mass centers at the first level. Therefore, while the results shown in the previous Figure 10 are obtained considering this coincidence, in Figure 11 the performance maps with and without such coincidence are compared. The results refer to Frame 1, excited by Parkfield earthquake, and fixed
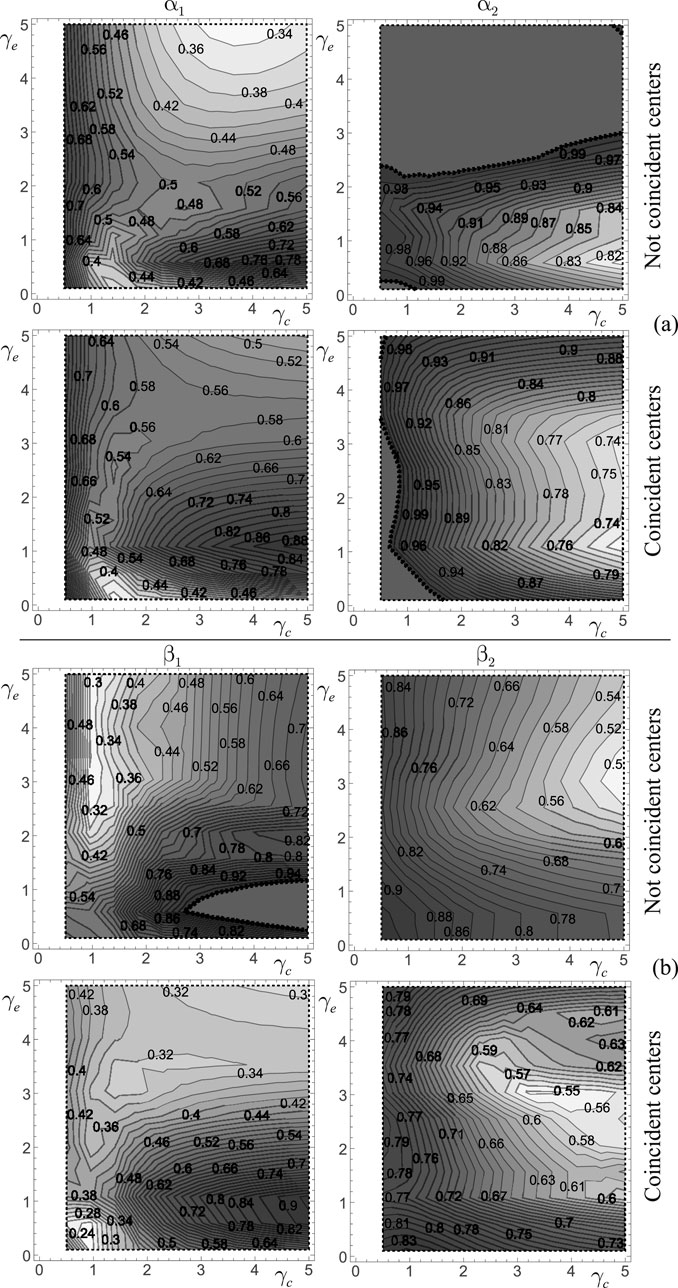
Figure 11. Effects of the centering of the mass and stiffness centers: (a) Performance maps
The coinciden\ce between the stiffness and mass centers at the first level has a limited effect on the
To further assess the effectiveness of System two in mitigating seismic effects, Frame 1 with a total virtual mass of
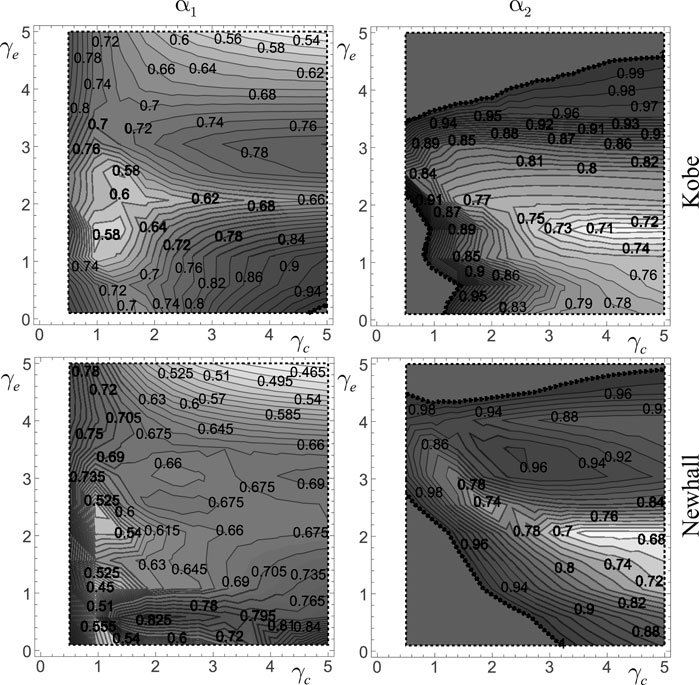
Figure 12. Performance maps
The performance maps for Frame 2, subjected to seismic excitation from the three selected earthquakes, are presented in Figure 13. All results are obtained for a fixed value of the total virtual mass
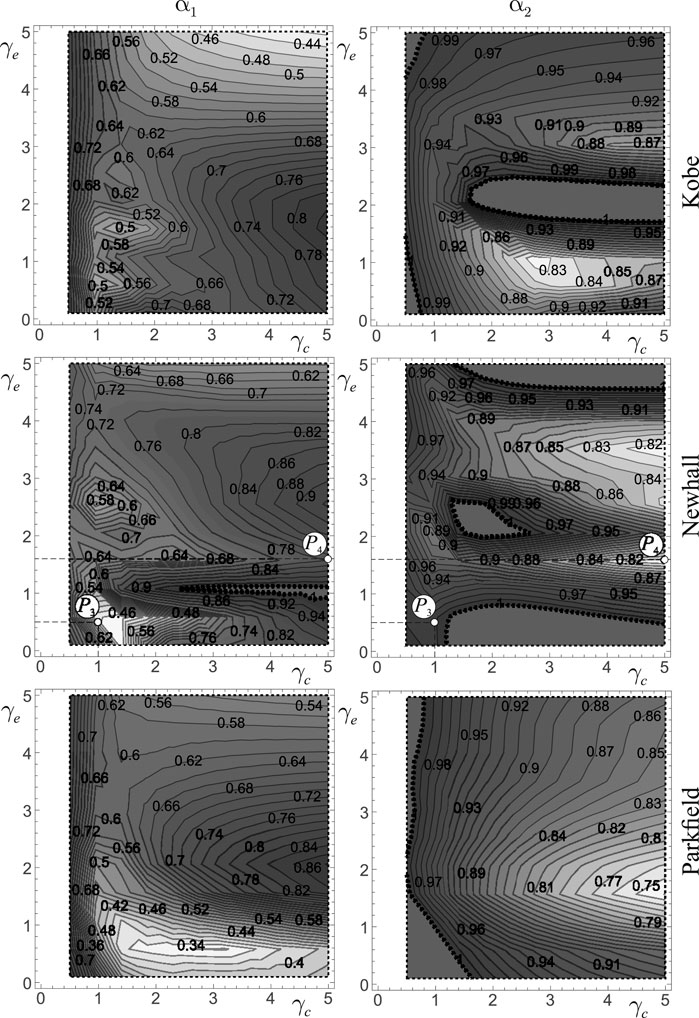
Figure 13. Performance maps
Nonetheless, the maps also reveal that the regions of optimal performance vary depending on the specific performance index considered. In particular, the minima of the displacement performance index
Finally, to understand how the coupling with external auxiliary structures works in reducing the seismic effects on frame structures, the time-histories of systems represented by labels
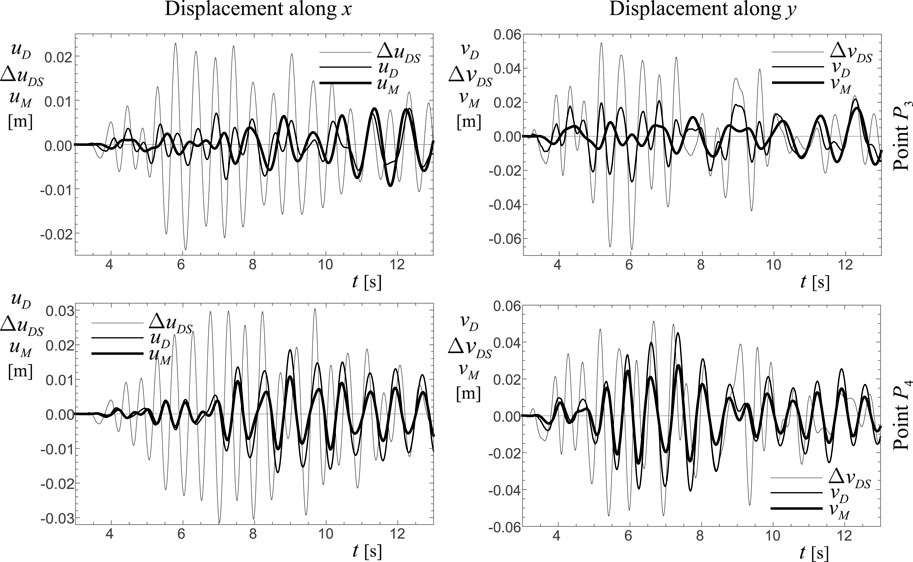
Figure 14. Time-histories of the System two under Newhall earthquake (Frame 5p,
5.4 Final remarks
System one adds only the inerter devices to the stand-alone structure. By appropriately distributing the virtual masses along the sides of the frame, the structure’s center of mass can shift to any desired point. A notable choice could be to align the center of mass with the center of stiffness at the first level of the structure. Notably, base isolation has an opposite effect on the protected system, as it can shift the center of stiffness of the isolated level to align with the structure’s center of mass. However, the benefits provided by inerter devices are accompanied by certain limitations. Specifically, shifting the center of mass at the first level leaves the center of mass of the second level (
In contrast, System two is derived from the stand-alone structure by adding both structural elements with appropriate stiffness and virtual masses through inerter devices. This approach enhances the ability to modify the characteristics of the coupled structure. Specifically, beyond the capacity to shift the mass center, as explained above, there is also the possibility to adjust the stiffness center to align it with the mass center of the structure. This coincidence can be achieved by appropriately distributing the stiffness of the external auxiliary structures. As previously mentioned, this mechanism is similar to that provided by base isolation. Such capability enhances the performance of System two compared to System 1, as confirmed by the numerical simulations shown in Section 5.3.
However, the virtual mass of the inerter device needs to be sufficiently large to significantly alter the structural modes. When the virtual mass reaches 50 times the mass of the first floor, it may correspond to 10 times the total mass of the structure. Even considering the mass amplification effect of the inerter device, achieving such magnitude is quite challenging. Additionally, employing additional stiffness or reducing stiffness (seismic isolation) may provide a more cost-effective and feasible means to adjust the center of stiffness. Consequently, the practical implementation of the studied protection strategy would be justified only in cases when interventions on the internal part of the building to be protected are prohibitive and there is a compelling need to operate on the outside of the structure.
6 Conclusion
Using low-dimensional mechanical models is a classical approach in Structural Mechanics to capture the predominant dynamic and seismic response of actual structures. Often, such models are employed to investigate the effectiveness of various external devices in enhancing the dynamic and seismic performance of different types of structures. Typically, these studies utilize planar models to capture the primary in-plane seismic response of frame structures.
In this paper, a low-dimensional spatial model has been used to investigate the seismic response of a general frame structure. This model represents a two-level frame structure, assuming the floor slabs are infinitely rigid within their own plane. Consequently, the model has six degrees of freedom, three for each level. The mechanical properties of the low-dimensional model have been calibrated to be dynamically equivalent to actual structures, using an established equivalence criterion.
Two different methods for enhancing the seismic response of a three-dimensional (3D) frame structure have been proposed. The first approach involves directly attaching inerter devices to the structure, while the second connects the structure to external auxiliary structures equipped with inerters. The developed 3D model enabled a detailed examination of the torsional effects acting on the frame structure and the effectiveness of both methods in reducing these torsional effects.
The equations of motion for three distinct mechanical systems have been derived using a Lagrangian approach. Specifically, the first system pertains to the stand-alone frame structure; the second incorporates inerter devices applied directly to the first level of the frame; and the third involves external auxiliary structures connected to the first level, each equipped with inerter devices.
The responses of the original stand-alone frame structure and those with the two proposed methods have been compared to assess the effectiveness of each approach. Three different earthquake records have been used as base excitation. These records were chosen due to their proven ability in previous studies by the authors to induce distinct dynamic responses, attributed to their differing spectral characteristics.
The results have been presented in performance curves and maps, illustrating the outcomes of an extensive parametric analysis in terms of the frame structure’s displacements and drifts.
The main elements of novelty of the proposed research can be summarised as follows.
• A low-dimensional, dynamically equivalent 3D mechanical model of an actual frame structure has been used to evaluate the seismic response, also accounting for the structural torsional motion.
•Two original, distinct structural schemes, both incorporating inerter devices, have been developed with the aim of reducing the seismic response of a frame structure.
•The effects on the seismic response due to the alignment of the stiffness and mass centers of the structure by adjusting the distribution of virtual mass and stiffness in the inerter devices and external auxiliary structures have been investigated.
The analyses performed to verify the effectiveness of the proposed protection methods led to the following relevant findings.
•Both the proposed structural schemes, named System one and System 2, perform efficiently since they both reduce the seismic response of the frame structure in a wide range of their mechanical parameters.
•The maximum reductions of the displacement of the first level (that is directly connected to the inerters or the external structure) and the drift of the superstructure never occur for the same values of the parameters. Therefore, design choices have to achieve a trade-off between these two objectives.
•The ability to align the mass center with the stiffness centers at the first level by appropriately adjusting the distribution of virtual masses provided by the inerters results in worse structural performance compared to the stand-alone frame structure.
•The capability offered exclusively by System two to align the stiffness and mass centers of the structure, achieved by appropriately distributing the stiffness of the external structures, leads to an improved seismic performance by reducing both displacements and torsional effects at each level.
For a comprehensive assessment of practical applicability on a specific structure, several limitations of the proposed approach should be addressed. In particular, ground motions should be selected and scaled according to seismic code provisions, hazard levels, and target spectra. Future research will address this by incorporating code-compliant inputs for more rigorous performance evaluation of the proposed protection systems. A second issued to be addressed is the assumption of infinitely rigid floor diaphragms that is not suitable for structure with significant floor deformability, such as structures having internal courts or timber structures. For these structures, the floor deformability makes the structure unsuitable for the proposed protection mechanism. Additionally, the current analysis assumes linear behavior for both the structure and damping devices to enable clearer interpretation of the fundamental mechanisms. While this is appropriate for preliminary studies, future work will consider nonlinear effects to improve realism and applicability under extreme seismic demands. Notably, the proposed strategy for enhancing the seismic performance of 3D frame structures could also be applied to improve the performance of piping systems, and ongoing studies are investigating this potential application.
Data availability statement
The raw data supporting the conclusions of this article will be made available by the authors, without undue reservation.
Author contributions
AD: Writing – original draft, Formal Analysis, Writing – review and editing, Investigation, Software, Visualization, Conceptualization. AC: Visualization, Writing – review and editing, Formal Analysis, Investigation, Conceptualization, Writing – original draft.
Funding
The author(s) declare that financial support was received for the research and/or publication of this article. This work is partially funded by the European Union - Next-Generation EU, Mission 4 Component 2 Investment 1.1, in the framework of the project PRIN 2022 PNRR, \P2022ZT5X5 - SmartUnder-Ground Infra-Structures for Secure Communities and Post-Disaster Emergency Response: Eco-Friendly Seismic Protection Solutions” (CUP: E53D2301762 0001, University of L'Aquila.The research in this paper was partially sponsored by the National Natural Science Foundation of China (Grant Nos. W2433120).
Conflict of interest
The authors declare that the research was conducted in the absence of any commercial or financial relationships that could be construed as a potential conflict of interest.
Generative AI statement
The author(s) declare that no Generative AI was used in the creation of this manuscript.
Publisher’s note
All claims expressed in this article are solely those of the authors and do not necessarily represent those of their affiliated organizations, or those of the publisher, the editors and the reviewers. Any product that may be evaluated in this article, or claim that may be made by its manufacturer, is not guaranteed or endorsed by the publisher.
Supplementary material
The Supplementary Material for this article can be found online at: https://www.frontiersin.org/articles/10.3389/fbuil.2025.1607520/full#supplementary-material
References
American Society of Civil Engineers (2022). Minimum design loads and associated criteria for buildings and other structures. Reston, Virginia. asce/sei 7-22 edition.
Anagnostopoulos, S. A., Kyrkos, M., and Stathopoulos, K. (2015). Earthquake induced torsion in buildings: critical review and state of the art. Earthq. Struct. 8 (2), 305–377. doi:10.12989/eas.2015.8.2.305
Botis, M. F., Cerbu, C., and Shi, H. (2018). “Study on the reduction of the general/overall torsion on multi-story, rectangular, reinforced concrete structures,” in Proceedings of the 3rd China-Romania science and technology seminar (CRSTS) (Brasov, Romania: Transilvania University).
Brzeski, P., Kapitaniak, T., and Perlikowski, P. (2015). Novel type of tuned mass damper with inerter which enables changes of inertance. J. Sound Vib. 349, 56–66. doi:10.1016/j.jsv.2015.03.035
Dadkhah, M., Kamgar, R., Heidarzadeh, H., Jakubczyk-Gałczyńska, A., and Jankowski, R. (2020). Improvement of performance level of steel moment-resisting frames using tuned mass damper system. Appl. Sci. 10 (10), 3403. doi:10.3390/app10103403
De Domenico, D., Impollonia, N., and Ricciardi, G. (2018). Soil-dependent optimum design of a new passive vibration control system combining seismic base isolation with tuned inerter damper. Soil Dyn. Earthq. Eng. 105, 37–53. doi:10.1016/j.soildyn.2017.11.023
De Domenico, D., and Ricciardi, G. (2018). An enhanced base isolation system equipped with optimal tuned mass damper inerter (TMDI). Earthq. Eng. Struct. Dyn. 47 (5), 1169–1192. doi:10.1002/eqe.3011
De la Llera, J. C., and Chopra, A. K. (1995). Understanding the inelastic seismic behaviour of asymmetric-plan buildings. Earthq. Eng. and Struct. Dyn. 24 (4), 549–572. doi:10.1002/eqe.4290240407
Di Egidio, A., and Contento, A. (2022). Improvement of the dynamic and seismic behaviour or rigid block-like structures with a hysteretic mass damper coupled with an inerter. Appl. Sci. 127 (22), 11527. doi:10.3390/app122211527
Di Egidio, A., and Contento, A. (2023). Seismic benefits from coupling frame structures with a hysteretic mass damper inerter. Appl. Sci. 13 (8), 5017. doi:10.3390/app13085017
Di Egidio, A., Pagliaro, S., and Contento, A. (2022a). Elasto-plastic short exoskeleton to improve the dynamic and seismic performance of frame structures. Appl. Sci. 12 (20), 10398. doi:10.3390/app122010398
Di Egidio, A., Pagliaro, S., and Contento, A. (2022b). Seismic benefits of deformable connections between a frame structure and an external structure with inerter. Eng. Struct. 256, 114025. doi:10.1016/j.engstruct.2022.114025
Di Egidio, A., Pagliaro, S., and Contento, A. (2023). Seismic performance of frame structure with hysteretic intermediate discontinuity. Appl. Sci. 13, 5373. doi:10.3390/app13095373
Fabrizio, C., de Leo, A. M., and Di Egidio, A. (2017b). Structural disconnection as a general technique to improve the dynamic and seismic response of structures: a basic model. Procedia Eng. 199, 1635–1640. doi:10.1016/j.proeng.2017.09.086
Fabrizio, C., de Leo, A. M., and Di Egidio, A. (2019). Tuned mass damper and base isolation: a unitary approach for the seismic protection of conventional frame structures. J. Eng. Mech. 145 (4). doi:10.1061/(asce)em.1943-7889.0001581
Fabrizio, C., Di Egidio, A., and de Leo, A. M. (2017a). Top disconnection versus base disconnection in structures subjected to harmonic base excitation. Eng. Struct. 152, 660–670. doi:10.1016/j.engstruct.2017.09.041
Giaralis, A., and Taflanidis, A. A. (2018). Optimal tuned mass-damper-inerter (TMDI) design for seismically excited MDOF structures with model uncertainties based on reliability criteria. Struct. Control Health Monit. 25 (2), e2082. doi:10.1002/stc.2082
Harbic, C., Cismas, C., Dubasaru, V., and Botis, M. (2011). Aspects regarding reduction of general torsion in the structures of the braşov campus. Bull. Transilvania Univ. Braşov, Ser. I Eng. Sci. 4, 153–160. Available online at: https://webbut.unitbv.ro/index.php/Series_I/article/view/6200
Kamgar, R., Dadkhah, M., Heidarzadeh, H., and Seidali Javanmardi, M. (2025). Utilizing tuned mass damper for reduction of seismic pounding between two adjacent buildings with different dynamic characteristics. Soil Dyn. Earthq. Eng. 188, 109036. doi:10.1016/j.soildyn.2024.109036
Kamgar, R., Gholami, F., Zarif Sanayei, H. R., and Heidarzadeh, H. (2020). Modified tuned liquid dampers for seismic protection of buildings considering soil-structure interaction effects. Iran. J. Sci. Technol. Trans. Civ. Eng. 44 (1), 339–354. doi:10.1007/s40996-019-00302-x
Kamgar, R., Samea, P., and Khatibinia, M. (2018). Optimizing parameters of tuned mass damper subjected to critical earthquake. Struct. Des. Tall Special Build. 27 (7), e1460. doi:10.1002/tal.1460
Kelly, J. (1995). Base isolation: linear theory and design. Earthq. Spectra 6 (2), 223–244. doi:10.1193/1.1585566
Khatibinia, M., Gholami, H., and Kamgar, R. (2018). Optimal design of tuned mass dampers subjected to continuous stationary critical excitation. Int. J. Dyn. Control 6 (3), 1094–1104. doi:10.1007/s40435-017-0386-7
Lim, H. K., Kang, J. W., Pak, H., Chi, H. S., Lee, Y. G., and Kim, J. (2018). Seismic response of a three-dimensional asymmetric multi-storey reinforced concrete structure. Appl. Sci. 8, 479. [Green Version]. doi:10.3390/app8040479
Makris, N., and Kampas, G. (2016). Seismic protection of structures with supplemental rotational inertia. J. Eng. Mech. 142 (11). doi:10.1061/(asce)em.1943-7889.0001152
Málaga-Chuquitaype, C. (2021). Strong-motion duration and response scaling of yielding and degrading eccentric structures. Earthq. Eng. and Struct. Dyn. 50 (1), 123–137. doi:10.1002/eqe.3350
Manish, A. K., and Syed, Z. I. (2017). Seismic analysis of torsional irregularity in multi-storey symmetric and asymmetric buildings. Eurasian J. Anal. Chem. 13, 286–292. Available online at: https://eurasianjournals.com/index.php/ej/article/view/847/847
Marian, L., and Giaralis, A. (2014). Optimal design of a novel tuned mass-damper-inerter (TMDI) passive vibration control configuration for stochastically support-excited structural systems. Probabilistic Eng. Mech. 38, 156–164. doi:10.1016/j.probengmech.2014.03.007
Maske, S. G., and Pajgade, P. S. (2013). Torsional behaviour of asymmetrical buildings. Int. J. Mod. Eng. Res. (IJMER) 3, 1146–1149. Available online at: http://www.ijmer.com.
Mazza, F., Donnici, A., and Labernarda, R. (2024). Structural and non-structural numerical blind prediction of shaking table experimental tests on fixed-base and base-isolated hospitals. Earthq. Eng. and Struct. Dyn. 53 (10), 2961–2987. doi:10.1002/eqe.4146
Mazza, F., and Labernarda, R. (2022). Internal pounding between structural parts of seismically isolated buildings. J. Earthq. Eng. 26 (10), 5175–5203. doi:10.1080/13632469.2020.1866122
Miranda, J. C. (2005). On tuned mass dampers for reducing the seismic response of structures. Earthq. Engng. Struct. Dyn. 34 (7), 847–865. doi:10.1002/eqe.461
Osteraas, J., and Krawinkler, H. (1989). The Mexico earthquake of september 19, 1985—behavior of steel buildings. Earthq. Spectra 5 (1), 51–88. doi:10.1193/1.1585511
Pagliaro, S., and Di Egidio, A. (2022a). Archetype dynamically equivalent 3-d.o.f. model to evaluate seismic performances of intermediate discontinuity in frame structures. J. Eng. Mech. 148 (3). doi:10.1061/(asce)em.1943-7889.0002083
Pelletier, K., and Leger, P. (2017). Nonlinear seismic modeling of reinforced concrete cores including torsion. Eng. Struct. 136, 380–392. doi:10.1016/j.engstruct.2017.01.042
Pietrosanti, D., De Angelis, M., and Basili, M. (2017). Optimal design and performance evaluation of systems with tuned mass damper inerter (TMDI). Earthq. Eng. Struct. Dyn. 46 (8), 1367–1388. doi:10.1002/eqe.2861
Pietrosanti, D., De Angelis, M., and Basili, M. (2020). A generalized 2-DOF model for optimal design of MDOF structures controlled by Tuned Mass Damper Inerter (TMDI). Int. J. Mech. Sci. 185, 105849. doi:10.1016/j.ijmecsci.2020.105849
Prakash, S., and Jangid, R. S. (2022). Optimum parameters of tuned mass damper-inerter for damped structure under seismic excitation. Int. J. Dyn. Control 10, 1322–1336. doi:10.1007/s40435-022-00911-x
Rana, R., and Soong, T. T. (1998). Parametric study and simplified design of tuned mass dampers. Eng. Struct. 20 (31), 193–204. doi:10.1016/s0141-0296(97)00078-3
Reggio, A., and De Angelis, M. (2015). Optimal energy-based seismic design of non-conventional Tuned Mass Damper (TMD) implemented via inter-story isolation. Earthq. Eng. Struct. Dyn. 44 (10), 1623–1642. doi:10.1002/eqe.2548
Rutenberg, A. (1992). Nonlinear response asymmetric building structures and seismic codes: a state of the art review. Amsterdam, Netherlands: Elsevier, 328–356.
Salimi, R., Kamgar, M., and Heidarzadeh, H. (2021). An evaluation of the advantages of friction tmd over conventional tmd. Innov. Infrastruct. Solutions 6 (95), 95. doi:10.1007/s41062-021-00473-5
Takewaki, I., Moustafa, A., and Fujita, K. (2012). Improving the earthquake resilience of buildings: the worst-case approach. Heidelberg, Germany: Springer.
Taniguchi, T., Der Kiureghian, A., and Melkumyan, M. (2008). Effect of tuned mass damper on displacement demand of base-isolated structures. Eng. Struct. 30 (12), 3478–3488. doi:10.1016/j.engstruct.2008.05.027
Thiers-Moggia, R., and Málaga-Chuquitaype, C. (2018). Seismic protection of rocking structures with inerters. Earthq. Eng. Struct. Dyn. 48 (5), 528–547. doi:10.1002/eqe.3147
Tsai, H.-H. (1995). The effect of tuned-mass dampers on the seismic response of base-isolated structures. Int. J. Solid Struct. 32 (8/9), 1195–1210. doi:10.1016/0020-7683(94)00150-u
Wang, J.-S., Hwang, S.-J., Chang, K.-C., Lin, M.-H., and Lee, B. H. (2013). Analytical and experimental studies on midstory isolated buildings with modal coupling effect. Earthq. Engng. Struct. Dyn., 42(2):201–219. doi:10.1002/eqe.2203
Keywords: 3D frame structure, coupling, inerter device, seismic behavior, torsional modes
Citation: Di Egidio A and Contento A (2025) Seismic performance enhancement of three-dimensional frame structures via inerter-based control systems. Front. Built Environ. 11:1607520. doi: 10.3389/fbuil.2025.1607520
Received: 07 April 2025; Accepted: 16 May 2025;
Published: 20 June 2025.
Edited by:
Cristiano Loss, University of British Columbia, CanadaReviewed by:
Christian Málaga-Chuquitaype, Imperial College London, United KingdomReza Soleimanpour, Australian University - Kuwait, Kuwait
Rodolfo Labernarda, University of Calabria, Italy
Copyright © 2025 Di Egidio and Contento. This is an open-access article distributed under the terms of the Creative Commons Attribution License (CC BY). The use, distribution or reproduction in other forums is permitted, provided the original author(s) and the copyright owner(s) are credited and that the original publication in this journal is cited, in accordance with accepted academic practice. No use, distribution or reproduction is permitted which does not comply with these terms.
*Correspondence: Alessandro Contento, YWxlc3NhbmRyb0BmenUuZWR1LmNu