 Yuting Cheng
 Qiushi Chen
 Weichiang Pang
- 1Guangzhou Institute of Building Science Group Co., Ltd., Guangzhou, Guangdong, China
- 2Glenn Department of Civil Engineering, Clemson University, Clemson, SC, United States
Modern seismic codes ensure life safety, but code-compliant buildings can still suffer significant economic losses from earthquake-induced damage, even during moderate events. Performance-Based Seismic Design (PBSD) has been developed to mitigate the impact of disproportionate financial losses. However, optimizing seismic retrofits involves complex trade-offs and requires explicit consideration of design robustness against uncertainties. This study introduces a novel Robust Multi-objective Optimization framework for Performance-Based Seismic Design (RMO-PBSD). This framework addresses the inherent conflict between three key objectives: economic efficiency, post-earthquake repair costs, and design robustness. Economic efficiency is quantified by the cost of fluid viscous dampers (FVDs), a common retrofit measure. Repair costs are estimated using the FEMA P-58 methodology, while robustness is quantified by the variability of structural response under seismic uncertainty. The core contribution lies in integrating these three metrics (FVD cost, repair cost, and a robustness measure) into an integrated optimization process using the Non-dominated Sorting Genetic Algorithm II (NSGA-II). The framework’s applicability and effectiveness are demonstrated through a case study of a 4-story steel moment-resisting frame retrofitted with FVDs, modeled in OpenSees. Seismic demand uncertainty is rigorously quantified using a series of ground motion records. Optimization results reveal a clear Pareto front, generally showing that higher FVD costs lead to lower repair costs and more robust designs (i.e., less sensitive to ground motion variability), although the robustness measure displays a non-linear relationship with the cost metrics. By analyzing designs along the Pareto front, the framework facilitates informed decision-making, identifying optimal, cost-effective FVD configurations that significantly enhance seismic performance while explicitly managing performance variability. This work provides a practical tool for achieving resilient and economically efficient seismic retrofits.
1 Introduction
Earthquakes are among the most devastating natural hazards, resulting in substantial loss of life and economic damage. The widespread destruction caused by the 1994 Northridge Earthquake in the United States prompted the Structural Engineers Association of California to develop a pioneering performance-based methodology for seismic design to limit damage caused by earthquakes (Structural Engineers Association of California, 1995). This methodology has since been widely adopted in seismic design, and its primary goal is to design a structure to satisfy a set of desired performance levels defined by the users or building owners (Bertero and Bertero, 2002), (Ghobarah, 2001). A performance level is defined as the probability of achieving a target performance objective at a given seismic hazard level (Pang et al., 2010). For example, a performance level may be defined as the peak inter-story drift ratio of the building not exceeding 1% of the story height with a 50% non-exceedance probability (performance objective) under a 50-year return period earthquake (hazard level). Performance-based seismic design (PBSD) can be used to produce designs that meet the requirements of multiple performance levels and ensure that the structures can adequately resist seismic loads of various intensities.
The initial development of performance-based design can be traced back to FEMA 273 (FEMA 273, 1997) and FEMA 356 (FEMA 356, 2000), pre-standards with guidelines for seismic rehabilitation of existing buildings to achieve various performance levels. In FEMA 273 and FEMA 356, four performance levels were specified to define the corresponding damage states of a structure: operational (very light), immediate occupancy (light), life safety (moderate), and collapse prevention (severe). Following FEMA 273/356, FEMA P-58 (FEMA P58-1, 2018) has been developed as the next-generation of PBSD procedures for quantifying the seismic performance of new and existing buildings under earthquakes, which includes estimating potential losses in terms of casualties, repair costs, and downtime. The ASCE 41-23 (American Society of Civil Engineers, 2023) standard further expands the four performance levels defined in FEMA 273/356 pre-standards into six performance levels: immediate occupancy, damage control, life safety, limited safety, collapse prevention, and not considered, to characterize the damage states of existing structures. These damage states are typically evaluated using two commonly used Engineering Demand Parameters (EDPs): peak inter-story drift ratio (pIDR) and peak floor acceleration (pFA), which quantify the performance of primary structural components and some non-structural components (Lavan and Dargush, 2009; Mazza et al., 2023; Mazza et al., 2024).
In traditional seismic design, shear walls (Kaplan et al., 2011) and diagonal braces, such as buckling-restrained braces (Güneyisi, 2012; Aristizabal-Ochoa, 1986; Gong et al., 2024; Zhong, 2024), have been frequently used to enhance seismic performance. These components can contribute to energy dissipation through hysteretic behavior due to their material properties, thereby increasing the structure’s dissipative capacity. However, such methods primarily increase the structure’s stiffness, which can alter a structure’s vibration behavior or natural period.
In modern structural design, energy dissipation systems, such as fluid viscous dampers (FVDs), have been integrated into structural frames. These systems can significantly improve seismic performance by increasing the damping ratio of the structure without altering its stiffness (Del Gobbo et al., 2018; Mazza and Labernarda, 2023). Unlike traditional methods that primarily increase stiffness, FVDs dissipate seismic energy through a velocity-dependent force, effectively reducing both pIDR and pFA. Their ease of installation makes them particularly suitable for retrofitting existing buildings. However, the peak resistance force of an FVD, a key design parameter, is generally proportional to its cost, creating a fundamental trade-off: maximizing seismic performance enhancement while minimizing the initial retrofit cost.
Multi-objective optimization techniques have been applied previously in seismic design to balance competing goals like performance enhancement and initial cost. For instance, Kaveh et al. (2010) applied ant colony optimization to design steel frames satisfying multiple performance levels on reducing drift and meeting earthquake load requirements. Lavan et al. (2008) used multi-objective optimization to meet performance targets for passive energy dissipation systems, balancing enhanced damping with cost. Dogruel et al. (2008) developed a unified framework for performance-based multi-objective optimization, targeting efficient energy dissipation and stability. Brando et al. (2015) evaluated the seismic performance of steel moment-resisting frames equipped with various hysteretic and viscous dampers, using incremental dynamic analysis and a damage-based design approach to derive equivalent behavior factors for simplified design applications. Askari et al. (2017) set up three objective functions to seek the minimum values of three EDPs: pIDR, pFA, and base shear force. Gholizadeh and Baghchevan (2017) defined steel sections as design variables to minimize the initial construction cost and pIDR. Charmpis et al. (2012) considered the seismic performance and initial construction cost to minimize the pIDR, base displacement, and the cost of the seismic isolation system. More recently, Dong et al. (2023) presented a performance-based design optimization framework to minimize material costs in multi-story reinforced concrete frames while meeting seismic performance targets. Mohebbi and Bakhshinezhad (2021) developed a multi-objective optimization method aimed at reducing the exceedance probability of specific performance levels over the building’s design lifetime, while simultaneously minimizing the total damping coefficient of FVDs as a proxy for the cost criterion. Jiang et al. (2022) used the Non-dominated Sorting Genetic Algorithm II (NSGA-II) to optimize the structure of the magnetorheological damper and determine the optimal design parameters of the magnetorheological damper.
Despite these advances, critical gaps remain. First, while minimizing initial cost or specific EDPs has been explored, the explicit trade-off between the initial retrofit investment (economic efficiency) and the potential long-term post-earthquake repair costs has rarely been explored. More importantly, the robustness of optimized designs against inherent uncertainties, particularly ground motion variability, has often been overlooked. An optimized design might perform well on average but could exhibit high sensitivity to variations in earthquake characteristics, leading to unreliable performance in practice.
To address these limitations, this study proposes a novel Robust Multi-objective Optimization framework for Performance-Based Seismic Design (RMO-PBSD). This framework integrates performance-based design and robust optimization algorithms. It addresses the “trade-off” between economic efficiency, repair costs, and robustness, delivering solutions with optimal performance while reducing variability in expected performance due to earthquake demand uncertainty. The key novelty of the RMO-PBSD framework lies in its explicit inclusion of a quantifiable robustness measure alongside economic and repair cost objectives within a multi-objective optimization context.
To illustrate the proposed RMO-PBSD framework, the problem of finding optimal designs for the rehabilitation of an existing 4-story steel moment frame building with an energy dissipation system (fluid viscous dampers) is used as an example. In this study, the optimization objectives are (1) maximizing economic efficiency (or minimizing retrofit costs), (2) minimizing post-earthquake repair costs, and (3) maximizing robustness (i.e., minimizing variability in repair costs).
A genetic algorithm-based robust multi-objective optimization approach is used to simultaneously optimize these three objectives. This approach generates a set of compromise solutions, known as the Pareto front, which represents a set of non-dominated optimal solutions that balance trade-offs between the optimization objectives. The parameters of FVDs are chosen as design variables. These design variables determine the peak resistance force of FVDs, which in turn influences the cost of FVDs and the overall seismic performance of the building. The optimal FVD design variables are determined for two earthquake hazard levels, namely, the maximum considered earthquake (MCE) and the design basis earthquake (DBE) levels. These two hazard levels account for different probabilities of earthquake occurrence. The MCE level has a 2% probability of being exceeded in 50 years, while the DBE level has a 10% probability of being exceeded in 50 years.
The FEMA P-58 provides guidance on the assessment of the seismic performance of structures in terms of repair costs, downtimes, and casualty risks (FEMA 356, 2000; Brando et al., 2015). Typically, pIDR and pFA are used as predictors of damage state fragility curves for structural and non-structural components, which help determine the corresponding repair cost for each component (Zeng et al., 2016). The total repair cost of a structure is calculated as the sum of the repair costs of its individual components. The FEMA P-58 method has been applied to estimate repair costs for various building types, including tall concrete buildings (Yang et al., 2012), steel buildings (Wang et al., 2017), and office buildings with energy dissipation systems (Terzic et al., 2014). By extending the traditional FEMA P-58 methodology and PBSD, the proposed framework explicitly integrates the key engineering parameters into the objective function, leading to more stable and reliable retrofit decisions with direct implications for seismic risk mitigation.
2 Robust multi-objective optimization framework for performance-based seismic design (RMO-PBSD)
Figure 1 shows a schematic illustration of the proposed Robust Multi-objective Optimization Framework for Performance-Based Seismic Design (RMO-PBSD). In this figure, the framework starts with the left-hand-side structural model using the damper parameters, Kd, Cd, and α, as the input design variables. A three-dimensional numerical model of the structure of interest is developed using OpenSees (McKenna et al., 2000). Numerical simulations are performed to obtain the seismic performance of the structure and the corresponding pIDR and pFA as the outputs. The key components of the optimization framework are shown on the right-hand side of this figure. Objective 1 is to maximize economic efficiency (or minimize retrofit cost). For the as-built building used in this study, the economic efficiency is quantified by considering the retrofit cost of installing FVDs, while the cost is computed as a function of the damper design parameters, as shown in the figure. Objective 2 aims to minimize repair costs, which are evaluated using the FEMA P-58 methodology and quantified through EDPs such as pIDR and pFA. Two key components of this objective are illustrated here: fragility curves, which relate EDPs to damage states, and consequence function, which maps damage states to economic losses. Objective 3 is to maximize robustness, which reflects the consistency of structural performance under varying seismic inputs. Robustness quantifies the variability of the objective values (e.g., repair costs) and is estimated using the COV of pIDR, obtained from 44 nonlinear time histories using the FEMA P-695 far-field ground motion set. Since pIDR strongly influences repair costs, a lower COV indicates reduced variability in structural response and thus a more robust design. The NSGA-II-based multi-objective optimization algorithm is then employed to identify the optimal design by simultaneously optimizing these three objectives. The optimization results are visualized via the Pareto front, shown in the center-bottom portion of the figure, which demonstrates the trade-offs between the competing objectives and guides the selection of an optimal design. In the following sections, the metrics of three optimization objectives (i.e., FVD costs, repair costs, and robustness measure) and the multi-objective optimization approach will be presented in detail.
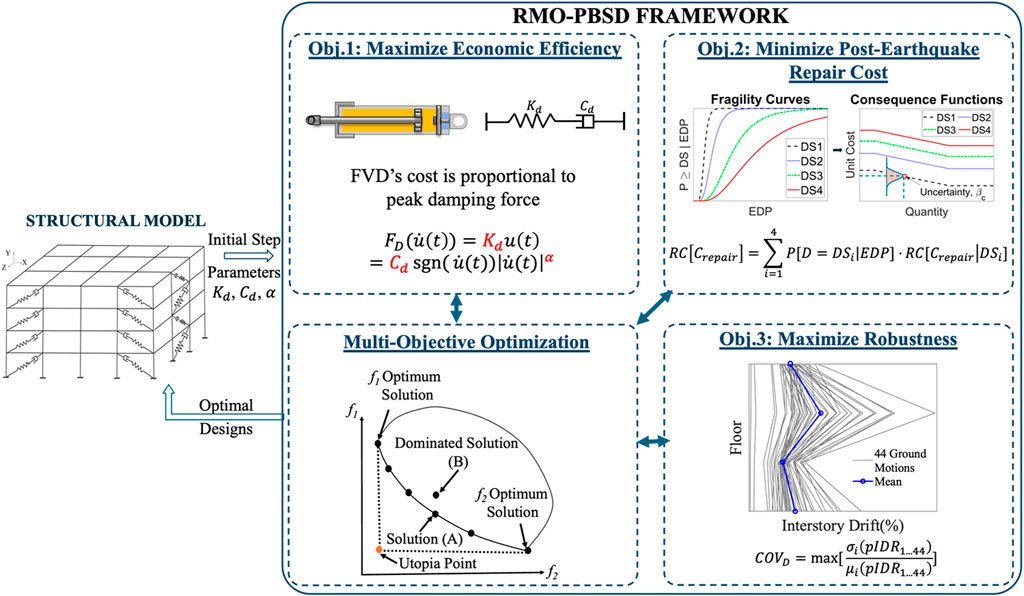
Figure 1. Overview of the proposed RMO-PBSD framework.
2.1 Economic efficiency (fluid viscous damper retrofit cost)
Fluid viscous dampers (FVDs) are used in the as-built building to enhance its seismic performance, largely due to their ease of installation for structural reinforcement without adding extra stiffness. Therefore, economic efficiency is quantified based on the retrofit costs of installing FVDs. The structure with supplemental FVDs is regarded as a dual system. The resistance force of the dual system is generated from both the lateral load-resisting components and the damper devices. For a given single degree of freedom (SDOF) system with a FVD, the governing equation of motion for the SDOF system can be expressed as:
where m, c, and k are the structure’s mass, damping coefficient, and stiffness, respectively; u(t),
Generally, the behavior of the FVD is simulated by the Maxwell model, which consists of a spring (with stiffness Kd) and a dashpot (with damping coefficient Cd) in series (Singh et al., 2003; Greco and Marano, 2015; Zoccolini et al., 2023). The force-velocity relationship of the dashpot can be expressed by the fractional power law:
where sgn(•) is the sign function, α is the velocity exponent, which typically varies between 0.3 and 1.95 (Liu, 2010).
The resistance force of the FVD can be expressed as:
Herein, α, Kd, and Cd are the critical factors that control the resistance force of the FVD, which directly influences the cost of the FVD. Some commonly used peak resistance forces of FVDs and their corresponding unit costs are listed in Table 1 (Liu, 2010). The reported costs reflect initial acquisition only and do not account for maintenance over the structure’s service life. The interpolation method is used when the peak resistance damper force falls between the provided values.
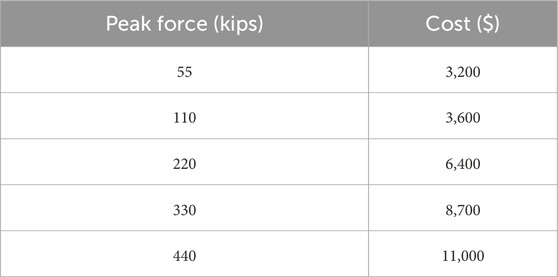
Table 1. Unit damper device cost for different peak forces [based on data from (Liu, 2010)].
2.2 Post-earthquake repair cost
Recent studies have revealed that FVDs can effectively improve the seismic performance of both structural and non-structural components. The FEMA P-58 methodology provides procedures for assessing the structure’s seismic performance in terms of repair costs, including the costs related to both structural and non-structural components (FEMA 356, 2000; Brando et al., 2015). Fragility curves and consequence functions have been developed for both types of components. The fragility curve describes the probability that a component exceeds a specific damage state as a function of the EDP, as shown in Figure 2. Commonly used EDPs include pIDR, pFA, peak floor velocity, and residual drift. The probability that the damage (D) of a building component is equal to or exceeds a particular damage state given an EDP value can be expressed as:
where DS refers to the damage state (very light, light, moderate or severe),
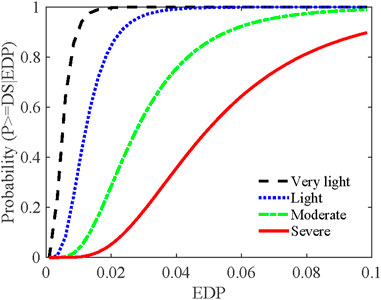
Figure 2. Illustration of fragility curves for very light, light, moderate, and severe damage states.
The FEMA P-58 method generally consists of four analysis steps to assess the repair costs: (1) determine the loss prediction method; (2) assemble the structural model; (3) analyze damage by evaluating the EDPs of the structure; and (4) estimate the total repair cost of the structure. The intensity-based nonlinear performance assessment method is one of the loss prediction methods, which requires the user to specify the earthquake intensity. The other two methods are scenario-based and time-based methods, which require more details about building sites or seismic hazards. In this study, the intensity-based nonlinear performance assessment method is adopted to estimate seismic losses, and the nonlinear time history dynamic analysis is utilized to simulate the structural behavior under the effect of ground motion (Wu, 2014). The obtained EDPs are used with fragility functions to determine the probable damage states of each component. For a component with four damage states, the probability that this component is in each damage state can be calculated as:
Once the damage state probabilities are computed, the consequence functions are used to estimate the repair cost of each component. The total repair cost of each component is the sum of the repair costs for that component in each damage state, expressed as:
where
The total repair cost of the structure,
where
2.3 Robustness measure
Regardless of the numerical model’s sophistication and detail, simulating the seismic performance of a structure requires accounting for uncertainties in structural responses. These uncertainties can stem from various sources, including seismic loads, numerical modeling assumptions, simplifications, and variations in input parameters.
Uncertainties can be classified into two main categories: epistemic and aleatoric. Epistemic uncertainty arises due to incomplete information or knowledge gaps, such as unknown material characteristics or model simplifications, and can be reduced with more data or improved models. In contrast, aleatoric uncertainty represents inherent, irreducible randomness, such as variability in material properties and the frequency content of earthquakes. Ground motion variability is typically the largest contributor among the various sources of uncertainty in PBSD (Bracchi et al., 2015; Cocco et al., 2024; Manfredi et al., 2022; Gentile and Galasso, 2021).
The seismic responses, including pIDR and pFA of a structure, are sensitive to earthquake record-to-record variability, commonly referred to as ground motion uncertainty (Deng et al., 2017). A series of ground motion records are typically applied to the numerical model to address MCE in PBSD. The ASCE 7-22 standard specifies that more than three ground motion records should be considered in structural design (Ame rican Society of Civil Engineers, 2022). In this study, the 22 pairs of far-field bi-axial ground motions in FEMA P-695 and the associated modeling approach are utilized to quantify the ground motion uncertainty. This approach accounts for ground motion variability and provides a more comprehensive evaluation of the structure’s seismic performance. Although ground motion uncertainty is irreducible, it may be managed. A robust structural design approach has been proposed to minimize the impact of uncertainties, often referred to as “noise factors” (Kang, 2005). The goal of robust design is to reduce the influence of these noise factors, thereby achieving a reliable and efficient structural design without completely eliminating the uncertainties.
Recently, the robust optimization design concept has been proposed, integrating optimization algorithms with robustness measures. Typically, robust optimization involves minimizing two objective functions: the mean and the standard deviation of EDPs (Doltsinis and Kang, 2004). In this study, the maximum COV of the pIDRs is used as the robustness measure, COVD:
where pIDR1…44 is the pIDR under each biaxial ground motion, i is the story number of the structure, μ and σ represent the mean and standard deviation of pIDRs of each story, and COVD is the maximum COV value. A lower COVD value indicates greater robustness of the structure.
In this context, the multi-objective robust optimization framework for PBSD aims to identify the optimal sets of design parameters (i.e., α, Kd, and Cd of the FVD) to minimize three metrics of optimization objectives simultaneously: the FVD cost, repair cost (
3 Multi-objective optimization methods
In the context of performance-based design optimization, multi-objective optimization problems arise when multiple, often conflicting objectives must be optimized simultaneously. A general multi-objective optimization problem can be formulated as follows (Konak et al., 2006):
where fi represents the ith objective function, n is the number of objective functions, x denotes the set of design variables within a feasible parameter space θ, and h(x) represents the constraint function, which defines the boundaries of this feasible space by imposing restrictions that the design variables x must satisfy. Specifically,
This study employs the Non-dominated Sorting Genetic Algorithm II (NSGA-II) to solve the multi-objective optimization problem. NSGA-II features a fast, non-dominated sorting procedure, a parameterless niching operator (the crowding distance), and an elitist-preserving approach that preserves the best solutions across generations. The fundamental principles of NSGA-II include selection, recombination, and mutation, which are used to generate new populations until an optimal solution is achieved (Deb et al., 2002). NSGA-II is particularly effective in determining the Pareto front, as it ensures a well-distributed set of solutions that converge to the non-dominated front while maintaining diversity among solutions (Erbas et al., 2006).
In the context of NSGA-II, the Pareto front represents a set of optimal non-dominated solutions. The domination relation is illustrated in Figure 3 for a two-objective case. Solution A is said to dominate solution B if either of the following conditions is met: (1) solution A is superior to solution B in both objectives, or (2) solution A is better than solution B in at least one objective while not worse in the other (Mishra and Harit, 2010). Solutions that do not dominate each other collectively form the Pareto front.
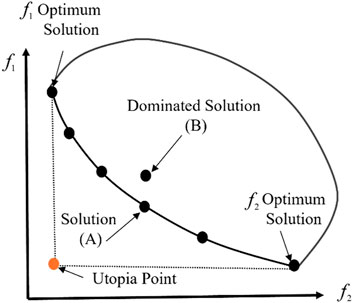
Figure 3. Domination relation between Pareto front and dominated solution.
The shape of the Pareto front can vary, manifesting as concave, convex, mixed (partially convex and concave), or discontinuous, depending on the nature of the trade-offs between objectives (Parsopoulos and Vrahatis, 2002). This shape visually represents the level of compromise required to improve one objective at the expense of another. As solutions approach the extreme points of the Pareto front, the level of compromise typically decreases. In our formulation, all three metrics of optimization objectives are aimed to be minimized, resulting in a Pareto front that generally displays a monotonically decreasing shape.
4 Case study: steel moment-resisting frame with fluid viscous dampers
4.1 Numerical model of the steel frame
The proposed conceptual framework is applied to a four-story office building designed as a steel moment-resisting frame. The prototype building is a special moment resisting frame with fully restrained reduced beam sections, which is designed to withstand vertical and lateral loads following the Load and Resistance Factor Design (LRFD) specifications and complies with the design provisions from IBC-2003, ASCE 7-02, and AISC-2005. This structure was previously evaluated in (Lignos, 2008) and is assumed to be located in the Los Angeles area, characterized by soil type D and risk category II. The MCE spectral response acceleration at short periods (SMS) and at 1 s period (SM1) are assumed to be 1.5g and 0.9g. The DBE spectral response acceleration at short periods (SDS) and at 1 s period (SD1) are 1.0g and 0.6g.
A three-dimensional numerical model of the steel frame was developed using OpenSees (McKenna et al., 2000). In this model, all beams and girders are represented as linear elastic elements. In the presented modeling approach, beams are expected to remain elastic under service and design-level seismic demands and are thus modeled as linear elastic elements, whereas columns–being critical for frame stability and susceptible to axial–flexural interaction, P–Δ effects, and buckling with distributed inelasticity–are modeled using the “non-linear beam-column” element that capture both material and geometric nonlinearities in frame members by combining kinematic and equilibrium transformations with flexible modeling of cross-sectional and material behavior (Scott et al., 2008). All structural components are assumed to be made of A992 grade 50 steel. The columns are selected from standard W24 sections. On the first and second floors, columns in the middle two spans use W24 × 131 sections, while the outer spans use W24 × 117. For the upper two floors, all columns are W24 × 76. Beams are W27 × 102 on the first and second floors, and W21 × 93 on the upper floors. The first three dominated natural periods of the steel frame are: 1.258s, 1.039s, 1.022s. To enhance seismic performance, a total of 24 FVDs are symmetrically placed in the exterior frames. The FVDs are arranged on the exterior of the building and do not occupy its internal space. The symmetrical arrangement of FVDs makes the stiffness and weight even as well as the seismic capacity of each story, as illustrated in Figure 4. The layout of the FVDs is determined using the story shear strain energy distribution method that considers both the seismic energy demand and capacity of each story, while also ensuring compatibility with architectural design constraints.
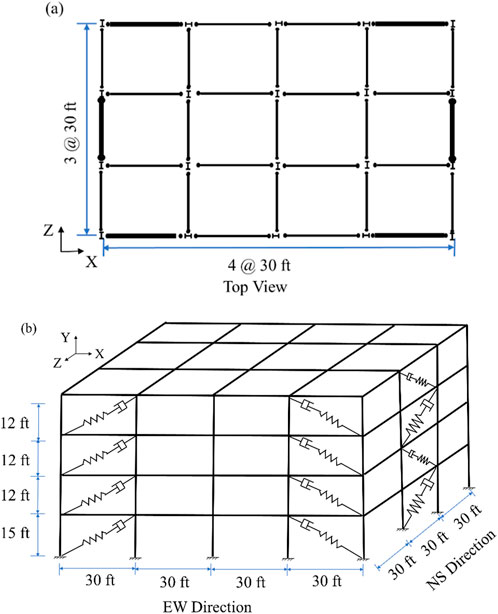
Figure 4. (a) Plan view and (b) isometric view of the example 4-story steel frame building.
4.2 Application of the RMO-PBSD framework to steel frame building
The proposed multi-objective optimization framework is applied to the four-story office building. In this framework, three design variables are considered: the stiffness of the brace and damper portion (Kd), the velocity exponent (α), and the damping coefficient (Cd). Among these three parameters, Kd plays a critical role in balancing the structural stiffness and the damping effectiveness. A proper Kd ensures that the dampers can effectively dissipate energy without excessively increasing structural stiffness, which could otherwise lead to undesirable dynamic responses or reduced flexibility during seismic events. Constraining Kd ensures that the damper systems contribute to the lateral load resistance without becoming the sole source of stiffness and strength in the structure. Additionally, FVDs located on the same floor and within the same horizontal direction are assigned identical values for the design variables to maintain consistency in the optimization process.
This study uses the far-field record dataset in FEMA P-695 in the Pacific Earthquake Engineering Research Center (PEER) Next-Generation Attenuation (NGA) database, which includes 22 biaxial ground motions (Applied Technology Council, 2009). These records are selected to capture far-field effects and allow for statistical evaluation of record-to-record variability. For each of the 22 biaxial ground motions, the building model undergoes two non-linear time history analyses, resulting in a total of 44 analyses per hazard level. In the first analysis, the two horizontal ground motions are applied to the two principal horizontal axes of the building model. In the second analysis, the two horizontal ground motions are rotated by 90° and the building model is re-analyzed. This procedure ensures a comprehensive assessment of record-to-record uncertainty across all orientations, totaling 44 analyses per hazard level. The pIDR for each story is recorded for the 44 time history analyses. For each story, the coefficient of variation (COV) of the pIDRs is calculated, and the maximum COV of pIDR is used as the robustness measure in this study. The optimization objectives are integrated into the optimization loop, which aims to minimize three metrics: the total cost of FVDs, repair costs, and the robustness measure. The final output of the optimization process is the Pareto front, which provides a range of optimized designs for decision-makers to evaluate and select.
Moreover, the repair cost is expressed as a percentage of the total replacement cost of the building. This cost includes the repair costs of structural and non-structural components. Non-structural components considered in this estimate include the exterior glass curtain wall, gypsum board partitions with steel studs, suspended ceiling, wall finishing, roof covering, and fire sprinkler system. Removable equipment and furnishings are excluded from this estimation. Table 2 provides critical fragility parameters for both structural and non-structural components, in which MEDP and β are the median and standard deviation of the EDP for the corresponding damage state. This critical fragility information is referenced and extracted from the Performance Assessment Calculation Tool (PACT) fragility database.
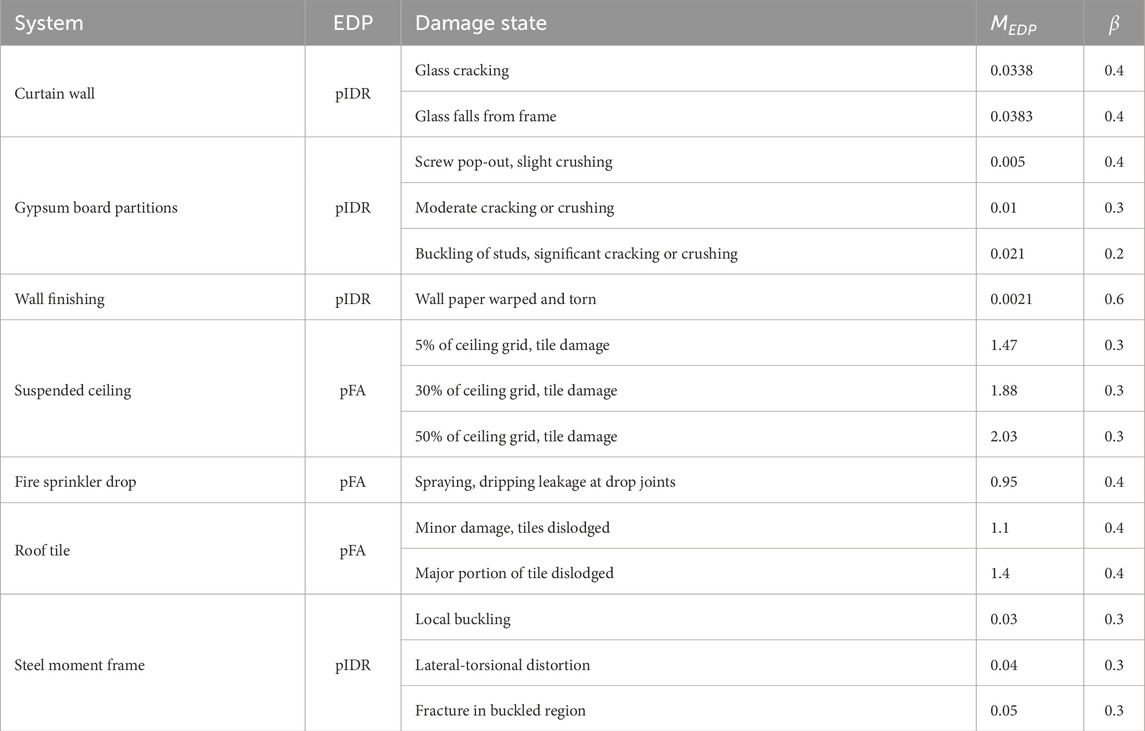
Table 2. Critical fragility parameters for structural and non-structural components.
This study utilizes the default consequence functions in the PACT tool, which are based on the 2011 repair costs for structural and non-structural components in Northern California (FEMA P58-2, 2018). For the purpose of this case study, these costs are assumed to apply to the office building located in Southern California, with a cost multiplier of one. The dispersion input is set to zero to ensure deterministic unit cost values. The total replacement cost of the building is estimated at $8,640,000, equating to $200 per square foot.
5 Optimization results
5.1 Optimization design based on MCE level
First, all ground motion records are scaled to the MCE level for the intensity-based performance assessment method, as shown in Figure 5. In the figure, the grey lines represent the scaled response spectrum for the MCE level, the blue line represents the design response spectrum (RS), the dashed red line represents the mean of the scaled Square-Root-of-Sum-of-Squares (SRSS) RS, and the solid red line represents the scaled maximum SRSS RS.
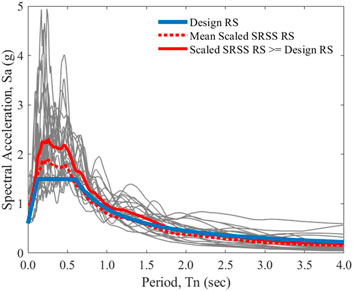
Figure 5. Acceleration response spectra for the far-field ground motions scaled to the MCE level.
The specific variation ranges for each design variable are predefined as follows:
1. Kd is varied from 0 to 1500 kips/in with an increasing interval of 250 kips/in. This limitation of the stiffness ensures that the brace of the supplemental damper is smaller than the size of the column [7 options].
2. α is varied from 0.3 to 1.0 with an increasing interval of 0.1 [8 options].
3. Cd is varied from 0 to 70 kips-sec/in with an increasing interval of 10 kips-sec/in [8 options].
The NSGA-II is implemented to solve this multi-objective optimization problem with 20 generations and 22 individuals in each generation, in the consideration of the effective trade-off between convergence of the optimization procedure and computational feasibility based on preliminary tests. The obtained optimized designs form a Pareto front, showing the trade-offs among the three optimization objectives, as plotted in Figure 6. The red boxes represent the optimized designs along the Pareto front, while the gray points denote dominated designs from the past 19 generations. The values of the optimized designs along the Pareto front, along with the corresponding values of design variables, are listed in Supplementary Tables SA1, SA2. The Pareto front reveals the trade-offs among the three objectives. Generally, the robustness measure (COVD) and repair cost (
![Four scatter plots labeled (a), (b), (c), and (d) show optimization data with red squares for optimized designs and gray crosses for dominated designs. Plot (a) compares FVD Cost to RC[C_repairtotal], (b) compares COV to FVD Cost, (c) compares COV to RC[C_repairtotal], and (d) is a 3D plot of FVD Cost, RC[C_repairtotal], and COV. Arrows labeled A, B, and C highlight specific data points in all plots.](https://www.frontiersin.org/files/Articles/1617542/fbuil-11-1617542-HTML/image_m/fbuil-11-1617542-g006.jpg)
Figure 6. Pareto front and dominated designs of MCE level: (a) repair cost
Choosing a suitable, cost-effective design is critical for structural designers. Three optimized designs, A, B, and C, are selected from the Pareto front (see Figure 6). Design A is the most expensive design with the minimum repair cost and COVD value (i.e., the most robust among the three designs). Design B is the design closest to the utopia point (the theoretical point representing the minimum possible value for all objectives simultaneously), representing a design with balanced performance across all three objectives. Design C has the lowest FVD cost but the highest repair cost. The properties of these selected designs are listed in Table 3. While the FVD cost increases from $11,450 for Design C to $46,956 for Design B, the post-MCE-level earthquake repair cost
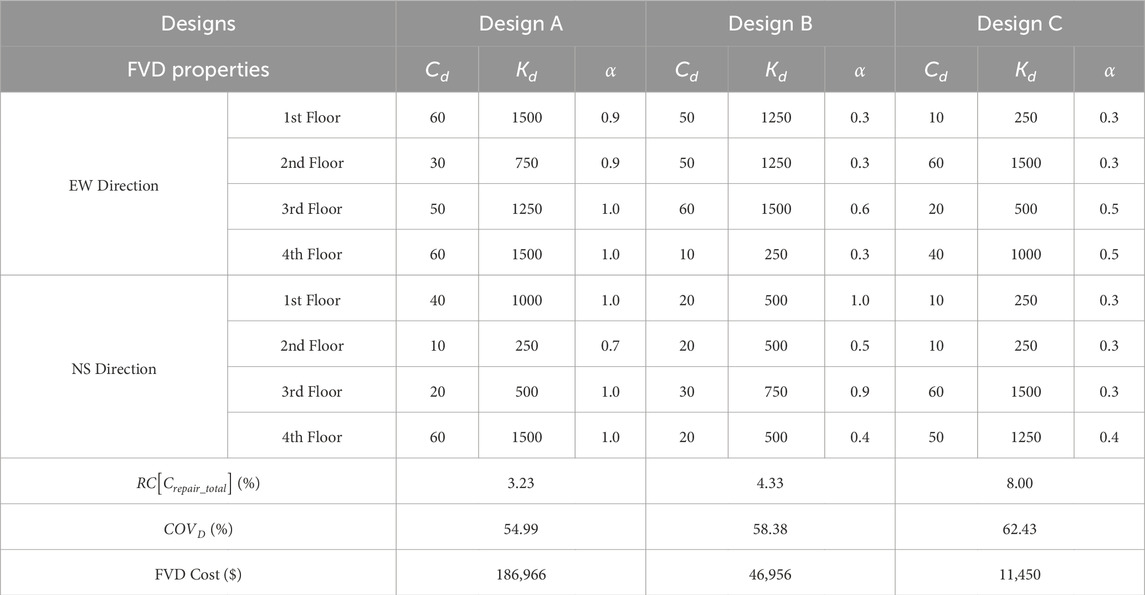
Table 3. Properties of FVDs of the selected designs for MCE level.
5.2 Optimization design based on DBE level
To achieve a more cost-efficient design for earthquake occurrences, the same optimization procedure is applied with all ground motions scaled to the DBE level. The scale factor of the DBE level is 2/3 of the MCE level, and the scaled ground motions are shown in Figure 7.
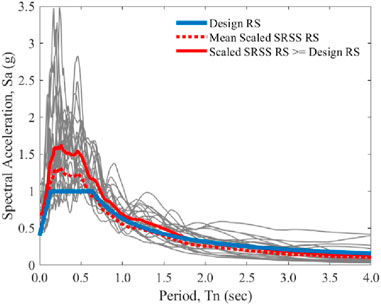
Figure 7. Acceleration response spectra for the far-field ground motions scaled to the DBE level.
The variation ranges for Kd, Cd, and α remain consistent with those defined in the MCE section. NSGA-II is employed to solve this multi-objective optimization problem using 20 generations with 22 individuals in each generation.
All the dominated designs are indicated in gray color and drawn in Figure 8. The optimized designs along the Pareto front are highlighted using red boxes. The values of the optimized designs along the Pareto front and the corresponding values of design variables are listed in Supplementary Tables SA3, SA4, respectively.
![Four scatter plots labeled (a), (b), (c), and (d) show optimization data with red squares for optimized designs and gray crosses for dominated designs. (a) compares FVD Cost against RC[C_repairtotal], showing a downward trend. (b) plots COV_D against FVD Cost, with points spread across a range. (c) plots COV_D against RC[C_repairtotal]. Chart (d) is a 3D plot with FVD Cost, COV_D, and RC[C_repairtotal] axes. Arrows labeled a, b, and c highlight specific data points in all plots.](https://www.frontiersin.org/files/Articles/1617542/fbuil-11-1617542-HTML/image_m/fbuil-11-1617542-g008.jpg)
Figure 8. Pareto front and dominated designs of DBE level: (a) repair cost
Similar to the analysis presented in the MCE section, three optimized designs, a, b, and c, are selected from the Pareto front (see Figure 8). Design a is the most expensive design but has the minimum repair cost and COVD (i.e., most robust with the least variability in pIDRs). Design b is the design closest to the utopia point. Design c has the least FVD cost and the highest repair cost. The properties of these selected designs are listed in Table 4.
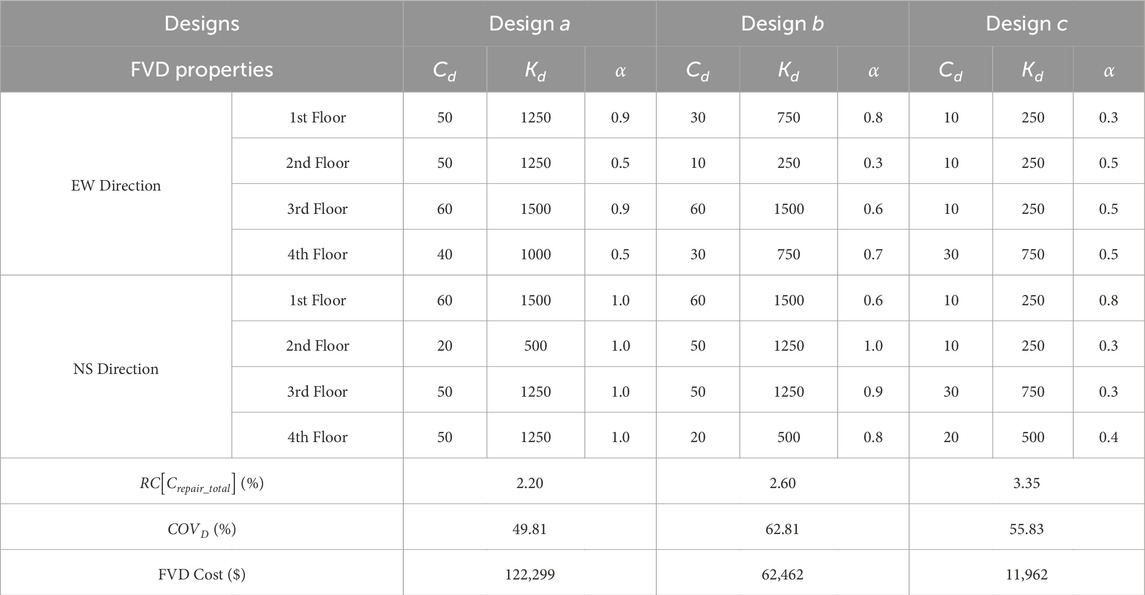
Table 4. Properties of FVDs of the selected designs for DBE level.
As shown in Table 4, when the FVD cost increases from $11,962 (Design c) to $62,462 (Design b), the COVD decreases from 55.83% to 62.81%, and the
5.3 Evaluation and comparison of selected designs
To further select the optimal design across multiple hazard levels, the seismic performance of each chosen design is evaluated under both MCE and DBE levels. The median values of pIDR and pFA in the EW and NS directions are plotted in Figures 9, 10. The solid black lines indicate the EDPs of the bare frame (a structure without any damper devices). The solid and dashed red lines depict the EDPs of Design A (MCE level) and Design a (DBE level). The solid and dashed yellow lines represent the EDPs of Design B and Design b, while the solid and dashed blue lines show the EDPs of Design C and Design c.
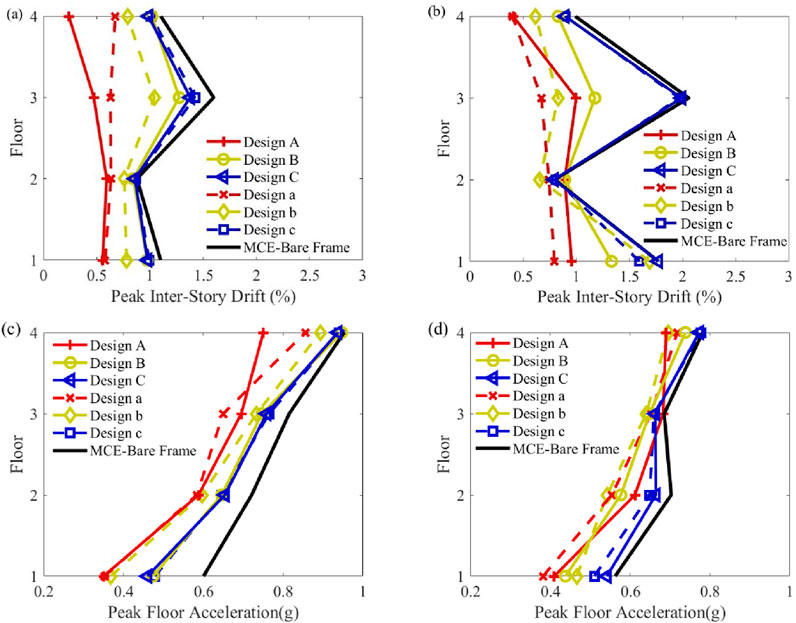
Figure 9. Seismic performance of selected designs under the effect of MCE level: (a) pIDR of EW direction; (b) pIDR of NS direction; (c) pFA of EW direction; (d) pFA of NS direction.
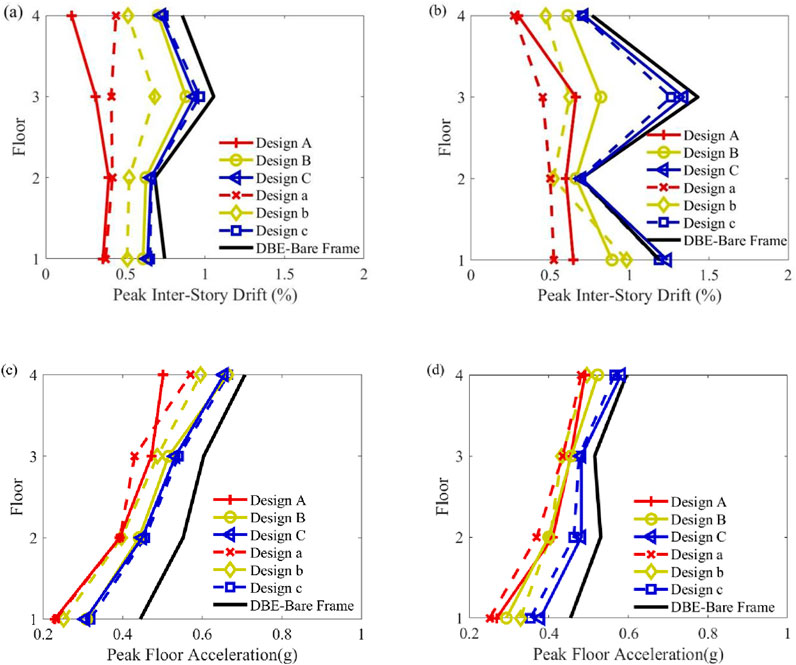
Figure 10. Seismic performance of selected designs under the effect of DBE level: (a) pIDR of EW direction; (b) pIDR of NS direction; (c) pFA of EW direction; (d) pFA of NS direction.
By analyzing the results, it is evident that Design A achieves the optimal pIDR values compared to the bare frame and the other designs. The relatively weaker stories, particularly the first and third floors, which initially exhibit higher pIDR values, show significant improvement. For the bare frame under MCE conditions, the pIDR values in the EW direction from the 1st to the 4th story are 1.10%, 0.88%, 1.60%, and 1.10%, respectively (Figure 9a). After applying Design A, these values are notably reduced to 0.56%, 0.59%, 0.47%, and 0.24%.
However, in the NS direction, Design a achieves better seismic performance in terms of pIDR values. For the bare frame under the MCE hazard level, the pIDR values from the 1st to the 4th story in the NS direction are 1.77%, 0.79%, 2.06%, and 0.99%, respectively (Figure 9b). After applying Design a, these values are reduced to 0.80%, 0.74%, 0.67%, and 0.40%. Similar optimization results are observed under the DBE level (see Figures 10a,b).
Furthermore, the pFA values of Design a are 0.35g, 0.58g, 0.65g, and 0.86g (Figure 9c); 0.38g, 0.55g, 0.65g, and 0.72g (Figure 9d); 0.23g, 0.39g, 0.43g, and 0.57g (Figure 10c); and 0.25g, 0.37g, 0.44g, and 0.48g (Figure 10d), which indicated significant reductions in pFA at MCE and DBE levels compared to the bare frame. Notably, Design a achieves smaller pFA values, indicating better seismic performance even with a lower FVD cost than Design A.
After evaluating the median values of pIDR and pFA for the selected designs, Design a is identified as the optimal choice. It offers a balanced combination of moderate FVD cost, repair cost, and robustness. All the recorded values of pIDR for Design a and the bare frame are shown in Figures 11, 12. It can be observed that the seismic performance of the steel frame building has been significantly improved under both the MCE and DBE levels.
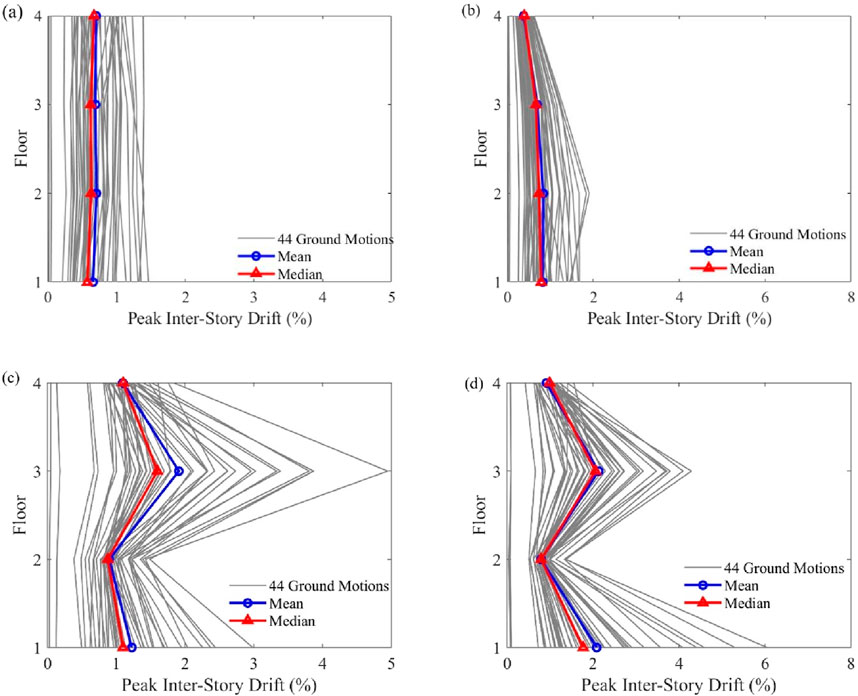
Figure 11. pIDR of each floor under the effects of MCE level: (a) Design a (EW direction); (b) Design a (NS direction); (c) bare frame (EW direction); (d) bare frame (NS direction).
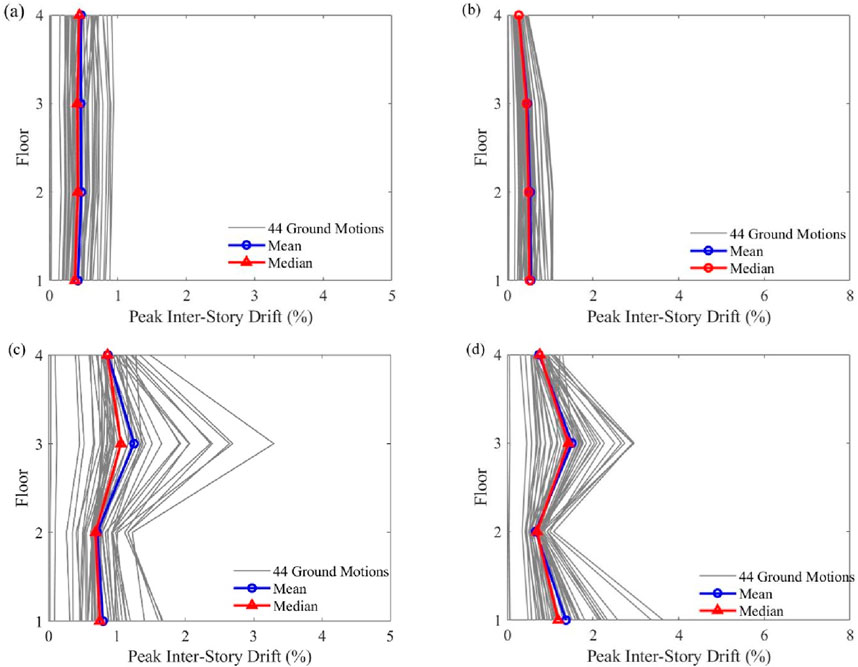
Figure 12. pIDR of each floor under the effects of DBE level: (a) Design a (EW direction); (b) Design a (NS direction); (c) bare frame (EW direction); (d) bare frame (NS direction).
6 Summary
In this study, a novel Robust Multi-objective Optimization framework for Performance-Based Seismic Design (RMO-PBSD) has been proposed. The primary contribution of this work is the explicit integration of design robustness, economic efficiency (FVD retrofit cost), and post-earthquake repair cost into an integrated seismic design optimization process. The framework utilizes FEMA P-58 methodology for repair cost estimation and employs the NSGA-II algorithm to optimize the three conflicting objectives: minimizing FVD cost, minimizing repair cost, and maximizing robustness. Its effectiveness is validated through a case study involving a 4-story steel moment frame retrofitted with FVDs, considering seismic uncertainty via multiple ground motion analyses.
The case study results highlight three key findings that demonstrate the effectiveness of the proposed framework and its value for practical seismic design decision-making:
1. Dominant influence of FVD cost on trade-offs: FVD cost generally governs the balance among the three objectives: higher FVD costs are often associated with lower repair costs and improved robustness. For example, when the FVD cost increased from $11,962 to $62,462, the COVD decreased from 62.81% to 55.83%, and the repair cost ratio dropped from 3.35% to 2.60%. This influence, however, diminishes near the extremes of the Pareto front, where additional cost yields limited benefit.
2. Diminishing returns and non-monotonic performance trends: Increasing FVD cost does not always produce continuous performance improvements; lower-cost solutions can still achieve competitive results. For instance, Design a, with a cost of $122,299, achieved smaller pFA values (0.35 g–0.86 g), indicating better seismic performance than Design A, which had a higher cost of $186,966.
3. Identification of optimal designs: Optimal selection of FVD design variables is essential for decision-makers. Based on MCE and DBE design requirements, six designs were selected from each Pareto front, including the extremes and the most balanced point, for performance comparison. By analyzing representative non-dominated solutions from the Pareto fronts generated for both MCE and DBE hazard levels, the framework provides a data-driven tool for decision-makers. The findings provide practical insights for achieving cost-effective yet resilient structural designs, balancing economic efficiency with enhanced seismic performance.
Data availability statement
The original contributions presented in the study are included in the article/Supplementary Material, further inquiries can be directed to the corresponding authors.
Author contributions
YC: Data curation, Methodology, Formal Analysis, Writing – original draft, Validation, Visualization, Investigation. QC: Resources, Project administration, Supervision, Writing – review and editing, Conceptualization, Funding acquisition, Methodology. WP: Methodology, Conceptualization, Resources, Writing – review and editing, Supervision.
Funding
The author(s) declare that financial support was received for the research and/or publication of this article. This research is supported in part by the Glenn Department of Civil Engineering at Clemson University. This research used in part resources on the Palmetto Cluster at Clemson University under National Science Foundation awards MRI 1228312, II NEW 1405767, MRI 1725573, and MRI 2018069. The views expressed in this article do not necessarily represent the views of Clemson University, NSF or the United States government.
Conflict of interest
Author YC was a Ph.D. student at Clemson University and is currently employed by Guangzhou Institute of Building Science Group Co., Ltd.
The remaining authors declare that the research was conducted in the absence of any commercial or financial relationships that could be construed as a potential conflict of interest.
Generative AI statement
The author(s) declare that no Generative AI was used in the creation of this manuscript.
Any alternative text (alt text) provided alongside figures in this article has been generated by Frontiers with the support of artificial intelligence and reasonable efforts have been made to ensure accuracy, including review by the authors wherever possible. If you identify any issues, please contact us.
Publisher’s note
All claims expressed in this article are solely those of the authors and do not necessarily represent those of their affiliated organizations, or those of the publisher, the editors and the reviewers. Any product that may be evaluated in this article, or claim that may be made by its manufacturer, is not guaranteed or endorsed by the publisher.
Supplementary material
The Supplementary Material for this article can be found online at: https://www.frontiersin.org/articles/10.3389/fbuil.2025.1617542/full#supplementary-material
References
American Society of Civil Engineers (2022). Minimum design loads and associated criteria for buildings and other structures. Am. Soc. Civ. Eng. doi:10.1061/9780784415788
American Society of Civil Engineers (2023). Seismic evaluation and retrofit of existing buildings. Am. Soc. Civ. Eng. doi:10.1061/9780784416112
Applied Technology Council (2009). Quantification of building seismic performance factors. U. S. Dep. Homel. Secur. FEMA.
Aristizabal-Ochoa, J. D. (1986). Disposable knee bracing: improvement in seismic design of steel frames. J. Struct. Eng. 112 (7), 1544–1552. doi:10.1061/(asce)0733-9445(1986)112:7(1544)
Askari, M., Li, J., and Samali, B. (2017). Cost-effective multi-objective optimal positioning of magnetorheological dampers and active actuators in large nonlinear structures. J. Intell. Mater. Syst. Struct. 28 (2), 230–253. doi:10.1177/1045389x16649449
Bertero, R. D., and Bertero, V. V. (2002). Performance-based seismic engineering: the need for a reliable conceptual comprehensive approach. Earthq. Eng. Struct. Dyn. 31 (3), 627–652. doi:10.1002/eqe.146
Bracchi, S. T., Rota, M., Penna, A., and Magenes, G. (2015). Consideration of modelling uncertainties in the seismic assessment of masonry buildings by equivalent-frame approach. Bull. Earthq. Eng. 13 (11), 3423–3448. doi:10.1007/s10518-015-9760-z
Brando, G., D'Agostino, F., and De Matteis, G. (2015). Seismic performance of MR frames protected by viscous or hysteretic dampers. Struct. Des. Tall Spec. Build. 24 (9), 653–671. doi:10.1002/tal.1204
Charmpis, D. C., Komodromos, P., and Phocas, M. C. (2012). Optimized earthquake response of multi-storey buildings with seismic isolation at various elevations. Earthq. Eng. Struct. Dyn. 41 (15), 2289–2310. doi:10.1002/eqe.2187
Cocco, G., Spacone, E., and Brando, G. (2024). Seismic vulnerability assessment of urban areas made of adobe buildings through analytical and numerical methods: the case study of the historical center of Cusco (Peru). Int. J. Disaster Risk Reduct. 112, 104786. doi:10.1016/j.ijdrr.2024.104786
Deb, K., Pratap, A., Agarwal, S., and Meyarivan, T. (2002). A fast and elitist multiobjective genetic algorithm: NSGA-II. IEEE Trans. Evol. Comput. 6 (2), 182–197. doi:10.1109/4235.996017
Del Gobbo, G. M., Blakeborough, A., and Williams, M. S. (2018). Improving total-building seismic performance using linear fluid viscous dampers. Bull. Earthq. Eng. 16, 4249–4272. doi:10.1007/s10518-018-0338-4
Deng, P., Pei, S., van de Lindt, J. W., Liu, H., and Zhang, C. (2017). An approach to quantify the influence of ground motion uncertainty on elastoplastic system acceleration in incremental dynamic analysis. Adv. Struct. Eng. 20 (11), 1744–1756. doi:10.1177/1369433217693630
Dogruel, S., Lavan, O., and Dargush, G. F. (2008). “A unified framework for evolutionary optimization with application to structural engineering,” in International conference on engineering optimization (Brazil: Rio de Janeiro), 393–412.
Doltsinis, I., and Kang, Z. (2004). Robust design of structures using optimization methods. Comput. Methods Appl. Mech. Eng. 193 (23–26), 2221–2237. doi:10.1016/j.cma.2003.12.055
Dong, G., Hajirasouliha, I., Pilakoutas, K., and Asadi, P. (2023). Multi-level performance-based seismic design optimisation of RC frames. Eng. Struct. 293, 116591. doi:10.1016/j.engstruct.2023.116591
Erbas, C., Cerav-Erbas, S., and Pimentel, A. D. (2006). Multiobjective optimization and evolutionary algorithms for the application mapping problem in multiprocessor system-on-chip design. IEEE Trans. Evol. Comput. 10 (3), 358–374. doi:10.1109/tevc.2005.860766
FEMA 273 (1997). NEHRP guidelines for the seismic rehabilitation of buildings (FEMA 273). Build. Seism. Saf. Counc. Wash. D.C. U. S. A.
FEMA 356 (2000). Prestandard and commentary for the seismic rehabilitation of buildings. Fed. Emerg. Manag. Agency Wash. D.C. U. S. A.
FEMA P58-1 (2018). Seismic performance assessment of buildings volume 1—methodology. Fed. Emerg. Manag. Agency Wash. D.C. U. S. A.
FEMA P58-2 (2018). Seismic performance assessment of buildings volume 2—implementation guide. Fed. Emerg. Manag. Agency Wash. D.C. U. S. A.
Gentile, R., and Galasso, C. (2021). Simplicity versus accuracy trade-off in estimating seismic fragility of existing reinforced concrete buildings. Soil Dyn. Earthq. Eng. 144, 106678. doi:10.1016/j.soildyn.2021.106678
Ghobarah, A. (2001). Performance-based design in earthquake engineering: state of development. Eng. Struct. 23 (8), 878–884. doi:10.1016/s0141-0296(01)00036-0
Gholizadeh, S., and Baghchevan, A. (2017). Multi-objective seismic design optimization of steel frames by a chaotic meta-heuristic algorithm. Eng. Comput. 33 (4), 1045–1060. doi:10.1007/s00366-017-0515-0
Gong, C., Zhang, Q., and Wu, C. (2024). New double-stage yield buckling-restrained brace simulation analysis research. Guangzhou Archit. 52 (1), 13–16.
Greco, R., and Marano, G. C. (2015). Identification of parameters of Maxwell and Kelvin–Voigt generalized models for fluid viscous dampers. J. Vib. Control 21 (2), 260–274. doi:10.1177/1077546313487937
Güneyisi, E. M. (2012). Seismic reliability of steel moment resisting framed buildings retrofitted with buckling restrained braces. Earthq. Eng. Struct. Dyn. 41 (5), 853–874. doi:10.1002/eqe.1161
Jiang, M., Rui, X., Yang, F., Zhu, W., and Zhang, Y. (2022). Multi-objective optimization design for a magnetorheological damper. J. Intell. Mater. Syst. Struct. 33 (1), 33–45. doi:10.1177/1045389x211006907
Kang, Z. (2005). “Robust design optimization of structures under uncertainties,” in Doctoral Dissertation, Institut fur Statik und Dynamik der Luft und Raumfahrkonstruktionen Universitat Stuttgart.
Kaplan, H., Yilmaz, S., Cetinkaya, N., and Atimtay, E. (2011). Seismic strengthening of RC structures with exterior shear walls. Sadhana 36, 17–34. doi:10.1007/s12046-011-0002-z
Kaveh, A., Azar, B. F., Hadidi, A., Sorochi, F. R., and Talatahari, S. (2010). Performance-based seismic design of steel frames using ant colony optimization. J. Constr. Steel Res. 66 (4), 566–574. doi:10.1016/j.jcsr.2009.11.006
Konak, A., Coit, D. W., and Smith, A. E. (2006). Multi-objective optimization using genetic algorithms: a tutorial. Reliab. Eng. Syst. Saf. 91 (9), 992–1007. doi:10.1016/j.ress.2005.11.018
Lavan, O., and Dargush, G. F. (2009). Multi-objective evolutionary seismic design with passive energy dissipation systems. J. Earthq. Eng. 13 (6), 758–790. doi:10.1080/13632460802598545
Lavan, O., Dargush, G. F., and Reinhorn, A. M. (2008). “Multi-objective evolutionary optimization of passive energy dissipation systems under seismic loading,” in Proceeding of the XIVth world conference on earthquake engineering.
Lignos, D. G. (2008). Sidesway collapse of deteriorating structural systems under seismic excitations. Stanford University. Doctoral Dissertation.
Liu, J. (2010). Risk-based seismic design optimization of steel building systems with passive damping devices. Marquette University. Doctoral Dissertation.
Manfredi, V., Masi, A., Özcebe, A. G., Paolucci, R., and Smerzini, C. (2022). Selection and spectral matching of recorded ground motions for seismic fragility analyses. Bull. Earthq. Eng. 20 (10), 4961–4987. doi:10.1007/s10518-022-01393-0
Mazza, F., and Labernarda, R. (2023). Seismic retrofitting of framed structures by damped braces considering the out-of-plane response of masonry infills. Proc. 9th ECCOMAS Themat. Conf. Comput. Methods Struct. Dyn. Earthq. Eng. COMPDYN, 2261–2270. doi:10.7712/120123.10558.20679
Mazza, F., Donnici, A., and Labernarda, R. (2023). Seismic vulnerability of fixed-base and base-isolated hospitals: blind comparison between shaking table and numerical tests. Procedia Struct. Integr. 44, 147–154. doi:10.1016/j.prostr.2023.01.020
Mazza, F., Donnici, A., and Labernarda, R. (2024). Structural and non-structural numerical blind prediction of shaking table experimental tests on fixed-base and base-isolated hospitals. Earthq. Eng. Struct. Dyn. 53 (10), 2961–2987. doi:10.1002/eqe.4146
McKenna, F., Fenves, G. L., and Scott, M. H. (2000). Open system for earthquake engineering simulation, 40. Berkeley, CA: Univ. California.
Mishra, K. K., and Harit, S. (2010). A fast algorithm for finding the non dominated set in multi-objective optimization. Int. J. Comput. Appl. 1 (25), 46–54. doi:10.5120/460-764
Mohebbi, M., and Bakhshinezhad, S. (2021). Seismic risk-based optimal design of fluid viscous dampers for seismically excited nonlinear structures. Numer. Methods Civ. Eng. 6 (2), 14–24. doi:10.52547/nmce.6.2.14
Pang, W., Rosowsky, D. V., Pei, S., and Van De Lindt, J. W. (2010). Simplified direct displacement design of six-story woodframe building and pretest seismic performance assessment. J. Struct. Eng. 136 (7), 813–825. doi:10.1061/(asce)st.1943-541x.0000181
Parsopoulos, K. E., and Vrahatis, M. N. (2002). “Particle swarm optimization method in multiobjective problems,” in Proceedings of the 2002 ACM symposium on Applied computing, 603–607.
Scott, M. H., Fenves, G. L., McKenna, F., and Filippou, F. C. (2008). Software patterns for nonlinear beam-column models. J. Struct. Eng. 134 (4), 562–571. doi:10.1061/(asce)0733-9445(2008)134:4(562)
Singh, M. P., Verma, N. P., and Moreschi, L. M. (2003). Seismic analysis and design with Maxwell dampers. J. Eng. Mech. 129 (3), 273–282. doi:10.1061/(asce)0733-9399(2003)129:3(273)
Structural Engineers Association of California (SEAOC) (1995). Vision 2000, Performance-based seismic engineering of buildings. Part 2: Conceptual framework, Sacramento, California.
Terzic, V., Mahin, S. A., and Comerio, M. (2014). “Comparative life-cycle cost and performance analysis of structural systems for buildings,” in Tenth US national conference on earthquake engineering.
Wang, S., Lai, J. W., Schoettler, M. J., and Mahin, S. A. (2017). Seismic assessment of existing tall buildings: a case study of a 35-story steel building with pre-Northridge connection. Eng. Struct. 141, 624–633. doi:10.1016/j.engstruct.2017.03.047
Wu, X. (2014). A study of nonlinear time history analysis vs. Current codes analysis procedure of comparing linear dynamic demand with nonlinear static capacity for ordinary standard bridge. Challenges Adv. Sustain. Transp. Syst., 467–480. doi:10.1061/9780784413364.058
Yang, T. Y., Moehle, J. P., Bozorgnia, Y., Zareian, F., and Wallace, J. W. (2012). Performance assessment of tall concrete core-wall building designed using two alternative approaches. Earthq. Eng. Struct. Dyn. 41 (11), 1515–1531. doi:10.1002/eqe.2219
Zeng, X., Lu, X., Yang, T. Y., and Xu, Z. (2016). Application of the FEMA-P58 methodology for regional earthquake loss prediction. Nat. Hazards 83 (1), 177–192. doi:10.1007/s11069-016-2307-z
Zhong, W. (2024). Structural design and analysis of large-span steel corridor in a exhibition center. Guangzhou Archit. 52 (8), 34–38.
Keywords: performance-based seismic design, robustness, multi-objective optimization, steel frame structure, energy dissipation system
Citation: Cheng Y, Chen Q and Pang W (2025) Robust multi-objective optimization framework for performance-based seismic design of steel frame with energy dissipation system. Front. Built Environ. 11:1617542. doi: 10.3389/fbuil.2025.1617542
Received: 24 April 2025; Accepted: 18 August 2025;
Published: 04 September 2025.
Edited by:
Panagiotis Mergos, City University of London, United KingdomReviewed by:
Giuseppe Brando, University of Studies G. d’Annunzio Chieti and Pescara, ItalyRodolfo Labernarda, University of Calabria, Italy
Copyright © 2025 Cheng, Chen and Pang. This is an open-access article distributed under the terms of the Creative Commons Attribution License (CC BY). The use, distribution or reproduction in other forums is permitted, provided the original author(s) and the copyright owner(s) are credited and that the original publication in this journal is cited, in accordance with accepted academic practice. No use, distribution or reproduction is permitted which does not comply with these terms.
*Correspondence: Qiushi Chen, cWl1c2hpQGNsZW1zb24uZWR1; Weichiang Pang, d3BhbmdAY2xlbXNvbi5lZHU=