 Yoshiyuki Yamada1,2
 Takayuki Michikawa1,2,3*
 Mitsuhiro Hashimoto4,5
 Kazuki Horikawa6† Takeharu Nagai6
 Atsushi Miyawaki7
 Michael Häusser8
 Katsuhiko Mikoshiba1,2*
- 1 Japan Science and Technology Agency, International Cooperative Research Project and Solution-Oriented Research for Science and Technology, Calcium Oscillation Project, Wako-shi, Saitama, Japan
- 2 Laboratory for Developmental Neurobiology, Brain Science Institute, RIKEN, Wako-shi, Saitama, Japan
- 3 Laboratory for Molecular Neurogenesis, Brain Science Institute, RIKEN, Wako-shi, Saitama, Japan
- 4 Hashimoto Research Unit, Brain Science Institute, RIKEN, Wako-shi, Saitama, Japan
- 5 Department of Anatomy and Cell Biology, Nagoya University Graduate School of Medicine, Nagoya-shi, Aichi, Japan
- 6 Laboratory for Nanosystems Physiology, Research Institute for Electronic Science, Hokkaido University, Sapporo, Hokkaido, Japan
- 7 Laboratory for Cell Function Dynamics, RIKEN Brain Science Institute, Wako-shi, Saitama, Japan.
- 8 Department of Neuroscience, Physiology, and Pharmacology, Wolfson Institute for Biomedical Research, University College London, London, UK
Genetically encoded Ca2+ indicators (GECIs) are promising tools for cell type-specific and chronic recording of neuronal activity. In the mammalian central nervous system, however, GECIs have been tested almost exclusively in cortical and hippocampal pyramidal cells, and the usefulness of recently developed GECIs has not been systematically examined in other cell types. Here we expressed the latest series of GECIs, yellow cameleon (YC) 2.60, YC3.60, YC-Nano15, and GCaMP3, in mouse cortical pyramidal cells as well as cerebellar Purkinje cells using in utero injection of recombinant adenoviral vectors. We characterized the performance of the GECIs by simultaneous two-photon imaging and whole-cell patch-clamp recording in acute brain slices at 33 ± 2°C. The fluorescent responses of GECIs to action potentials (APs) evoked by somatic current injection or to synaptic stimulation were examined using rapid dendritic imaging. In cortical pyramidal cells, YC2.60 showed the largest responses to single APs, but its decay kinetics were slower than YC3.60 and GCaMP3, while GCaMP3 showed the largest responses to 20 APs evoked at 20 Hz. In cerebellar Purkinje cells, only YC2.60 and YC-Nano15 could reliably report single complex spikes (CSs), and neither showed signal saturation over the entire stimulus range tested (1–10 CSs at 10 Hz). The expression and response of YC2.60 in Purkinje cells remained detectable and comparable for at least over 100 days. These results provide useful information for selecting an optimal GECI depending on the experimental requirements: in cortical pyramidal cells, YC2.60 is suitable for detecting sparse firing of APs, whereas GCaMP3 is suitable for detecting burst firing of APs; in cerebellar Purkinje cells, YC2.60 as well as YC-Nano15 is suitable for detecting CSs.
Introduction
Understanding the spatio-temporal patterns of neuronal activity underlying brain function is one of the fundamental goals in neuroscience research, and requires techniques for the large-scale recording in living animals. The repertoire of in vivo multi-cell recording techniques has been enriched by the recent establishment of in vivo Ca2+ imaging, a combination of multi-photon imaging and bolus loading of synthetic Ca2+ dyes (Stosiek et al., 2003). In vivo Ca2+ imaging allows not only multi-cell recording based on fast Ca2+ transients generated by action potentials (APs; Markram et al., 1995; Schiller et al., 1995; Helmchen et al., 1996), but also the precise localization of recorded cells. It has thus contributed to unveiling the functional micro-architecture of many brain regions (Ohki et al., 2005, 2006; Kerr et al., 2005, 2007; Sullivan et al., 2005; Rothschild et al., 2010; Smith and Häusser, 2010), which was difficult to achieve using classical electrode-based techniques. However, the lack of cell type specificity, the unrepeatability, and the short-lived nature (typically less than 1 day) of imaging using synthetic Ca2+ dyes has remained an obstacle for further applications.
Genetically encoded Ca2+ indicators (GECIs; for review, Miyawaki, 2005; Mank and Griesbeck, 2008), which are Ca2+-sensitive fluorescent proteins (FPs), can in principle offer an excellent solution to these problems, since they can be stably and specifically expressed in a targeted cell type by the use of appropriate promoters and transfection methods. [Ca2+]i changes cause structural changes of the Ca2+-sensing domains in GECIs, which further cause changes in either (1) fluorescence resonance energy transfer (FRET) efficiency between two FPs or (2) the fluorescent intensity of a single circularly permutated (cp) FP, depending on the design of GECIs. GECIs have been successfully applied in many model organisms including Caenorhabditis elegans (Kerr et al., 2000), Drosophila melanogaster (Fiala et al., 2002), and Danio rerio (Higashijima et al., 2003), where electrode penetration and exogenous dye application are technically challenging. In the mammalian central nervous system (CNS), initial attempts using prototypical GECIs were somewhat disappointing (Hasan et al., 2004; Pologruto et al., 2004), but recently developed GECIs have been shown to display improved performance (Heim et al., 2007; Mank et al., 2008; Wallace et al., 2008; Tian et al., 2009; Horikawa et al., 2010; Lütcke et al., 2010) and have been used to address biologically relevant questions (e.g., Dombeck et al., 2010). Nevertheless, most applications of GECIs in the mammalian CNS have been limited to cortical and hippocampal pyramidal cells, and how GECIs perform in other cell types has remained largely unknown. There are a few exceptions where GCaMP2 has been tested in cerebellar granule cells as well as Purkinje cells (Díez-García et al., 2005, 2007; Akemann et al., 2009), but the relationship between fluorescent changes and intracellular electrical responses of imaged cells was not investigated, nor was the performance of multiple GECIs compared under the same experimental conditions. The application of novel GECIs to broader contexts should be facilitated by quantitative comparison of their performance in reference to intracellular electrical signals.
In the present study, we selected the latest series of FRET-based GECIs (Figure 1A): yellow cameleon (YC) 2.60, YC3.60 (Nagai et al., 2004), YC-Nano15 (Horikawa et al., 2010), and the latest cpGFP-based GECI, GCaMP3 (Tian et al., 2009). We expressed each of them in mouse cortical pyramidal cells as well as in cerebellar Purkinje cells by in utero injection of recombinant adenoviral vectors (Hashimoto and Mikoshiba, 2003, 2004). All the YCs above utilize calmodulin (CaM) and M13 (Ca2+/CaM-binding peptide derived from skeletal muscle myosin light chain kinase) as Ca2+-sensing domain, but their in vitro affinities are modified by molecular engineering: YC3.60 carries a mutation in EF-hand motif of CaM (E104Q) resulting in a larger dissociation constant (Kd) value (~250 nM) than that of YC2.60 (~95 nM), while YC-Nano15 has an elongated linker between CaM and M13 (GGGGS) than that used in YC2.60 and YC3.60 (GGS), resulting in an extremely smaller Kd value (~15 nM). GCaMP3, which also utilizes CaM and M13 as Ca2+-sensing domain, was constructed by mutagenesis of GCaMP2, resulting in slightly lower Kd value (660 nM; GCaMP2, 840 nM), improved baseline brightness, and expanded dynamic range. Using simultaneous patch-clamp recording and two-photon imaging in acute brain slices at physiologically relevant temperatures (33 ± 2°C), we characterized the performance of these GECIs, and investigated which GECIs could be optimal for applications in each cell type.
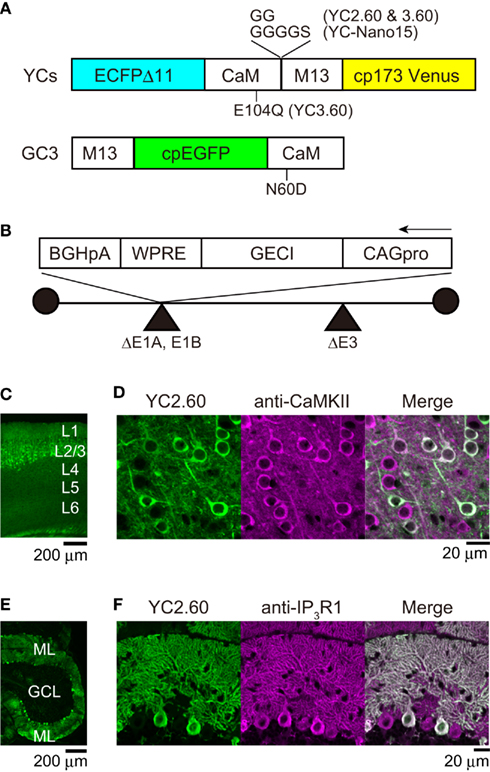
Figure 1. Adenovirus-mediated expression of GECIs. (A) The domain structure of GECIs. ECFPΔC11, enhanced CFP with C-terminal 11 amino acids deleted; CaM, calmodulin; M13, Ca2+/CaM-binding peptide from skeletal muscle myosin light chain kinase; cp173Venus, circularly permuted Venus; cpEGFP, circularly permutated enhanced green fluorescent protein. (B) The structure of recombinant adenovirus vector for expression of GECIs. CAG pro, cytomegalovirus enhancer and β-actin promoter; WPRE, woodchuck hepatitis virus post-transcriptional regulatory element; BGHpA, bovine growth hormone polyadenylation signal. (C) Confocal image of a parasagittal section from an E14:P20 YC2.60 mouse. Each cortical layer (L) position is indicated in white. (D) Confocal image of the neocortex immunostained with anti-CaMKII antibody, a marker for excitatory pyramidal cells. (E) Confocal image of a parasagittal section from an E11:P21 YC2.60 mouse. ML, molecular layer; GCL, granule cell layer. (F) Confocal image of the cerebellum immunostained with anti-IP3R1 antibody, a marker for Purkinje cells.
Materials and Methods
All experimental procedures were performed in accordance with the guidelines of the Animal Experiment Committee of the RIKEN Brain Science Institute and with the UK Animal (Scientific Procedures) Act 1986.
Expression of GECIs
cDNAs encoding YC2.60, YC3.60, YC-Nano15, and GCaMP3 (Figure 1A) were subcloned into a cosmid vector carrying the cytomegalovirus enhancer and β-actin (CAG) promoter, woodchuck hepatitis virus post-transcriptional regulatory element (WPRE), and bovine growth hormone (BGH) polyadenylation signal (Figure 1B). Recombinant adenovirus was generated either by full-length DNA transfer method (Takara) or by COS–TPC method (Miyake et al., 1996) using HEK293 cells (kindly provided by the Cell Resource Center for Biomedical Research, Institute of Development, Aging and Cancer, Tohoku University). Viral clones were screened by restriction mapping of their genomic DNA, and appropriate clones were amplified and then purified by double cesium chloride step gradient ultracentrifugation (Kanegae et al., 1994). The titer of purified virus was measured by plaque forming assay with HEK293 cells. Purified viral solution (total 0.2 to 6 × 10⁷ plaque forming units) was pressure-injected (IM-300, Narishige) into the lateral ventricle of ICR mice on embryonic day (E) 11 or E12 for expression in cerebellar Purkinje cells or E14 for cortical layer 2/3 pyramidal cells, respectively. In the following, a mouse virus-injected at E14 and sacrificed at P20, for instance, is described as “E14:P20.”
Immunohistochemistry
Mice were transcardially perfused with phosphate buffer saline (PBS) followed by 4% paraformaldehyde in 0.1 M phosphate buffer (pH 7.4) under ether anesthesia. The brain was dissected out, cryoprotected by serial equilibration in 10, 15, and 20% (w/v) sucrose in PBS at 4°C and frozen in O.C.T compound (Sakura Fineteh). Parasagittal sections (14–20 μm) were prepared on a cryostat (CM1850, Leica), attached to MAS-coated glass slides (Matsunami) and subjected to immunohistochemistry as follows. Cryosections were washed three times with PBS, blocked with 10% normal goat serum (NGS) in PBS containing 0.2% TritonX-100 (PBS-T) for 1 h at room temperature, incubated with primary antibodies diluted by 1% NGS in PBS-T overnight at 4°C, washed three times with PBS, incubated with species-specific secondary antibodies (anti-rabbit or anti-mouse IgG) conjugated with Alexa-488 or 594 (Invitrogen) diluted by 1% NGS in PBS-T (1:500) for 1 h at room temperature and washed three times with PBS. The sections were then coverslipped with VECTASHIELD (Vector) or ProLong Gold (Invitrogen).
The primary antibodies used were as follows: anti-GFP (rabbit, 1:1000; mouse, 1:200, both from MBL), anti-calcium/calmodulin-dependent protein kinase (CaMKII; rabbit, 1:500, Epitomics), and anti-inositol 1,4,5-triphosphate receptor type1 (IP3R1; mouse, 1:1000, generated in our laboratory). The sections were imaged by an inverted confocal laser-scanning microscope (IX-81 and FV-1000, Olympus) equipped with a 10 × (UPlanApo NA 0.40, Olympus) or 40 × objective (UPlanApo NA 1.00, Olympus). Alexa-488 was excited by 473 nm laser and its emission between 490 and 550 nm was collected; Alexa-594 was excited by 559 nm laser and its emission between 600 and 700 nm was collected.
Electrophysiology and Two-Photon Imaging in Acute Brain Slice
Mice were decapitated under ether anesthesia, and parasagittal slices (250–300 μm) were prepared using a vibratome (VT1000S, Leica) on postnatal day (P) 15–57 (except data in Figure 4; Table 5, where mice between P113 and 114 were used), as described previously (Davie et al., 2006). Brain dissection and slice preparation were performed in ice-cold cutting solution containing 120 mM Choline-Cl, 3 mM KCl, 8 mM MgCl2, 1.25 mM NaH2PO4, 26 mM NaHCO3, 20 mM D-glucose, and transferred to artificial cerebral spinal fluid (ACSF) containing 125 mM NaCl, 2.5 mM KCl, 25 mM NaHCO3, 25 mM D-glucose, 1.25 mM NaH2PO4, 2 mM CaCl2, and 1 mM MgCl2, incubated at 34°C for 30–60 min and preserved at room temperature until use. Slices were perfused at approximately 2 ml/min with ACSF, which was constantly bubbled with carbogen and warmed up to 33 ± 2°C by an in-line heater (TC-324B, Warner Instruments). GECI-expressing cells with non-fluorescent nuclei (Tian et al., 2009) were identified by epifluorescence and targeted for patch-clamp recording under infra-red differential interference contrast microscopy (Olympus). Electrophysiological signals were low-pass filtered at 2–10 kHz by four-pole Bessel filter and acquired at 20–50 kHz using a combination of MultiClamp 700B (Molecular Devices) and ITC-16 or ITC-18 (Instrutech) controlled by AxoGraphX software (AxoGraph Scientific). For whole-cell current-clamp recording, borosilicate glass pipettes (4–7 MΩ) were filled with the internal solution containing 140 mM K-gluconate, 4 mM NaCl, 10 mM HEPES, 4 mM Mg-ATP, 0.3 mM Na-GTP, and 5 mM Na2-phosphocreatine (pH 7.3 titrated with KOH, 285–295 mmol/kg). APs were elicited by brief somatic current pulses (1–3 nA, 2 ms) delivered through recording patch pipettes. Synaptic responses were elicited by extracellular electrical stimulation (1–50 V, 200 μs) by pipettes filled with the HEPES-buffered solution containing 150 mM NaCl, 2.5 mM KCl, 10 mM HEPES, 2 mM CaCl2, 1 mM MgCl2 (pH 7.3 titrated with NaOH). For pyramidal cell recording, no holding current was injected; for Purkinje cell recording, holding current up to −500 pA was injected to suppress spontaneous firing.
Fluorescent signals were acquired in line-scan mode (approximately 200 Hz) with an upright two-photon laser-scanning microscope (BX-61WI and FV300, Olympus) equipped with a 60 × water-immersion objective (LUMPlan Fl/IR NA 0.90, Olympus). The Ti:sapphire laser (Maitai VF-TIM, Spectra-Physics) for excitation was tuned to 840 nm for YCs or 920 nm for GCaMP. Emitted fluorescence was short-pass filtered (650 nm, Olympus), split with a dichroic mirror (for YC, 510 nm, Chroma; for GCaMP3, 570 nm, Olympus), band-pass filtered (for YC, 460–500 and 520–550 nm for cyan and yellow fluorescence, respectively, Chroma; for GCaMP3, 495–540 nm, Olympus), and detected by photomultipliers (R3896, Hamamatsu).
The electrophysiological recording and two-photon imaging were synchronized by a trigger pulse generated upon laser-scanning.
Data Analysis
After subtraction of dark noise on the photomultipliers, the baseline ratio of yellow to cyan fluorescence (R0, YCs) or baseline fluorescence (F0, GCaMP3) was calculated as the mean ratio or mean fluorescence, respectively, of the approximately 1-s window immediately before stimulus onset (baseline period). Subsequently, the fractional change of the ratio (ΔR/R0, YCs) or the fractional change of the fluorescence (ΔF/F0, GCaMP3) was calculated. Peak amplitude was calculated from ΔR/R0 or ΔF/F0 trace filtered with a 35-ms moving window and defined as the maximum value between the stimulus onset and 500 ms after the stimulus cessation. The signal-to-noise ratio (SNR) was calculated as the peak amplitude divided by the baseline noise (the SD of the raw trace during the baseline period). Both peak amplitude and SNR were calculated from individual trials and averaged over three trials for each stimulus condition (Table 2, 4, and 5). Responses were judged to be suprathreshold when SNR exceeds 2. Half rise time and half decay time were calculated from the 3-trial-averaged and filtered traces for 10 APs (pyramidal cells) or 5 complex spikes (CSs; Purkinje cells) only when responses were suprathreshold. Statistical difference was assessed using one-way ANOVA (p = 0.05) followed by Tukey’s post-hoc tests unless otherwise noted. Data analysis was performed with AxoGraphX, Igor Pro 6 (WaveMetrics), NeuroMatic (http://www.neuromatic.thinkrandom.com/), Fluoview (Olympus), ImageJ (US National Institutes of Health), Excel (Microsoft), and GraphPad Prism4 (GraphPad software). All values are presented as mean ± SD unless otherwise noted.
Results
Adenovirus-Mediated Expression of GECIs in Cortical Pyramidal Cells and Cerebellar Purkinje Cells
In order to express GECIs in the mouse brain, we performed in utero injection of adenoviral vectors (Hashimoto and Mikoshiba, 2003, 2004). This allows “neuronal birthday-specific” introduction of a foreign gene, since adenoviral infection is temporarily short (up to 4 h) and the adenoviral gene is transferred exclusively to the neuronally committed-daughter cells divided from stem cells on the ventricular surface of embryonic brain. We previously used LacZ-carrying adenovirus and demonstrated that injection at E14 led to expression in cortical superficial layer and that injection at E11 or E12 led to expression in cortical deep layer as well as cerebellar Purkinje cells. We performed immunohistochemical analysis to test if this specific expression pattern is reproducible with adenoviral vectors carrying GECIs (Figure 1). The injection of YC2.60-carrying adenovirus at E14 resulted in expression in the superficial layer of neocortex (Figure 1C). The majority (97%; n = 119 of 123 cells) of expressing cells were immunopositive for CaMKII (Figure 1D), indicating that they were pyramidal cells. The injection of YC2.60-carrying adenovirus at E11 or E12 resulted in expression in cortical deep layer (data not shown) as well as cerebellum (Figure 1E). All (n = 76 of 76 cells) of the expressing cells in cerebellum were immunopositive for IP3R1, indicating that they were Purkinje cells. These results show that in utero injection of recombinant adenoviral vectors carrying GECIs could lead to their specific expression in cortical pyramidal cells as well as cerebellar Purkinje cells, successfully reproducing our previous results.
Comparison of GECIs in Cortical Layer 2/3 Pyramidal Cells
We characterized the performance of GECIs expressed in the cortical layer 2/3 pyramidal cells by simultaneous two-photon imaging and whole-cell patch-clamp recording in acute brain slice preparations (Figure 2A). The expression of GECIs did not have any significant effects on the electrophysiological properties of pyramidal cells (Table 1). We evoked APs by somatic current injection and recorded fluorescent changes by line-scan imaging at apical dendritic segments (Figures 2B,C). Responses to 1, 2, 5, 10, and 20 APs at 20 Hz were analyzed (Figures 2D,E; Table 2). In response to single APs, YC2.60 as well as YC-Nano15 showed signal changes well over the threshold (SNR = 2), YC3.60 showed barely suprathreshold changes, but GCaMP3 did not; YC2.60 showed the largest SNR among all, and YC-Nano15 showed significantly larger SNR than GCaMP3 (Figure 2F; Table 2; YC2.60, 4.3 ± 1.7, n = 19; YC3.60, 2.1 ± 0.4, n = 11; YC-Nano15, 3.1 ± 1.0, n = 14; GCaMP3, 1.3 ± 0.6, n = 7). Responses to single APs were suprathreshold in 89% (n = 17 of 19) of YC2.60-expressing cells and 93% (n = 13 of 14) of YC-Nano15-expressing cells, but only in 55% (n = 6 of 11) of YC3.60-expressing cells and 14% (n = 1 of 7) of GCaMP3-expressing cells. YC2.60, YC3.60, and GCaMP3 showed nearly linear increase of SNR up to 20 APs in majority of cells, while YC-Nano15 showed signal saturation to a large number of APs, as expected from its extremely high affinity to Ca2+ (Figures 2D,E). In response to 20 APs, GCaMP3 showed the largest SNR among all (YC2.60, 23 ± 12, n = 10; YC3.60, 19 ± 2.3, n = 8; YC-Nano15, 8.0 ± 3.9, n = 7; GCaMP3, 41 ± 15, n = 6). Half rise time values (Figure 2G) of YC2.60 (185 ± 55 ms, n = 10) and YC-Nano15 (159 ± 28 ms, n = 7) were significantly smaller than those of YC3.60 (214 ± 28 ms, n = 8) and GCaMP3 (288 ± 18 ms, n = 6), whereas half decay time values (Figure 2H) of YC2.60 (2.31 ± 0.95 s, n = 10) and YC-Nano15 (2.38 ± 0.92 s, n = 7) were significantly larger than those of YC3.60 (0.40 ± 0.06 s, n = 8) and GCaMP3 (0.22 ± 0.06 s, n = 6).
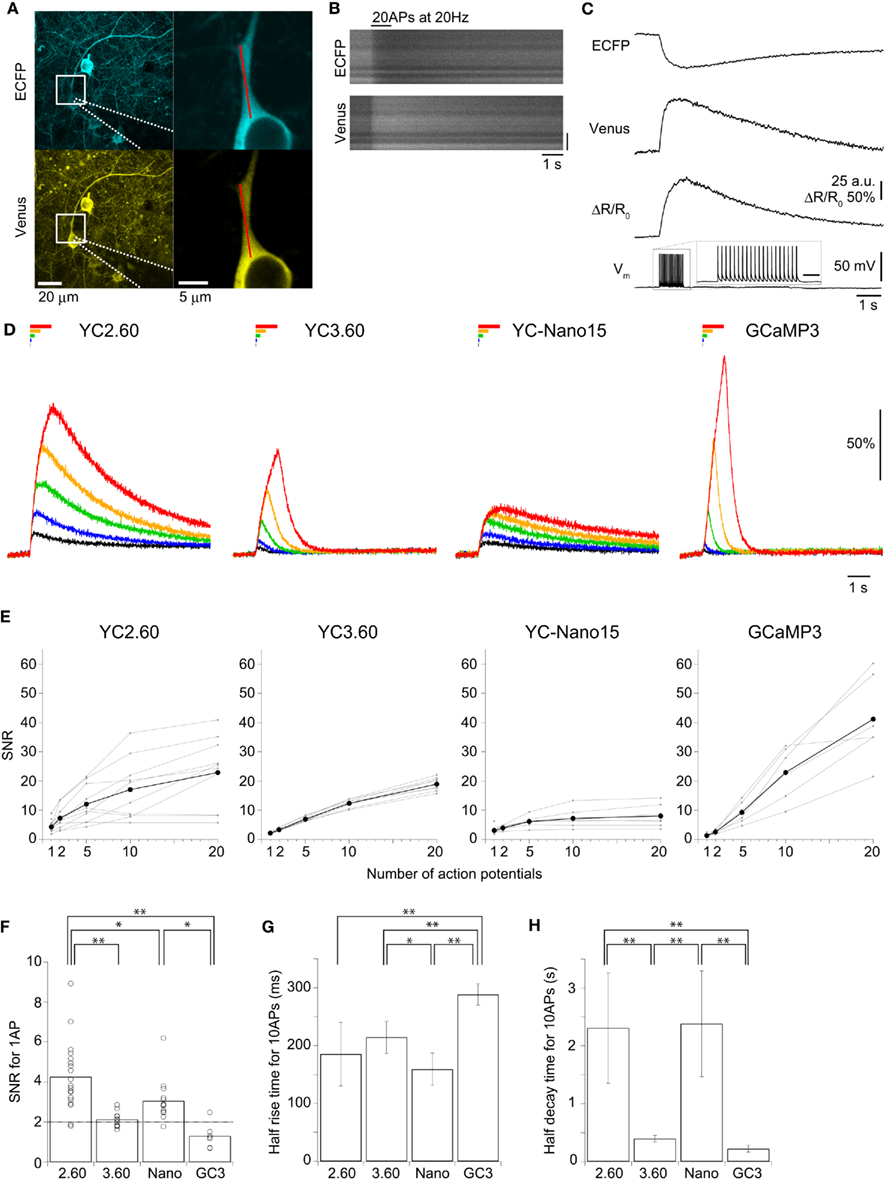
Figure 2. Quantitative comparison of GECIs in cortical layer 2/3 pyramidal cells. (A) Maximum intensity projection images of an E14:P19 YC2.60-expressing pyramidal cells (left), and expanded single z-section images within the white boxes (right). A patch pipette is drawn with dotted lines. Line-scan imaging was performed along the proximal apical dendrite as indicated by the red line. (B) Line-scan images of a YC2.60-expressing pyramidal cell in response to 20 action potentials (APs) at 20 Hz evoked during the period indicated. Vertical scale bar, 5 μm. (C) Traces calculated from line-scan images in (B) were averaged across three trials and smoothed by 35 ms moving window. ΔR/R0, FRET signal change; Vm, membrane potential. The scale bar in Vm inset, 200 ms. (D) ΔR/R0 (YC) or ΔF/F0 (GC3) traces in response to 1 (black), 2 (blue), 5 (green), 10 (orange), and 20 (red) APs evoked at 20 Hz. Each trace is the mean across cells (n = 10 cells for YC2.60, 8 for YC3.60, 7 for YC-Nano15, and 6 for GCaMP3). (E) Signal-to-noise ratio (SNR) plotted against the number of APs, calculated for individual pyramidal cells (gray) and the mean across cells (black). For 1 AP, n = 19 for YC2.60, n = 11 for YC3.60, n = 14 for YC-Nano15 and n = 7 for GCaMP3; For 2, 5, 10, and 20 APs, n = 10 for YC2.60, n = 8 for YC3.60, n = 7 for YC-Nano15, and n = 6 for GCaMP3. (F) SNR in response to single APs taken from (E). Each dot represents a value taken from an individual cell, and the bar represents the mean across cells. (G,H) Mean half rise time (G) and mean half decay time (H) of smoothed trial-averaged traces in response to 10 APs at 20 Hz. Error bars show SD. *p < 0.05, **p < 0.01 in Tukey’s post-hoc test following one-way ANOVA.
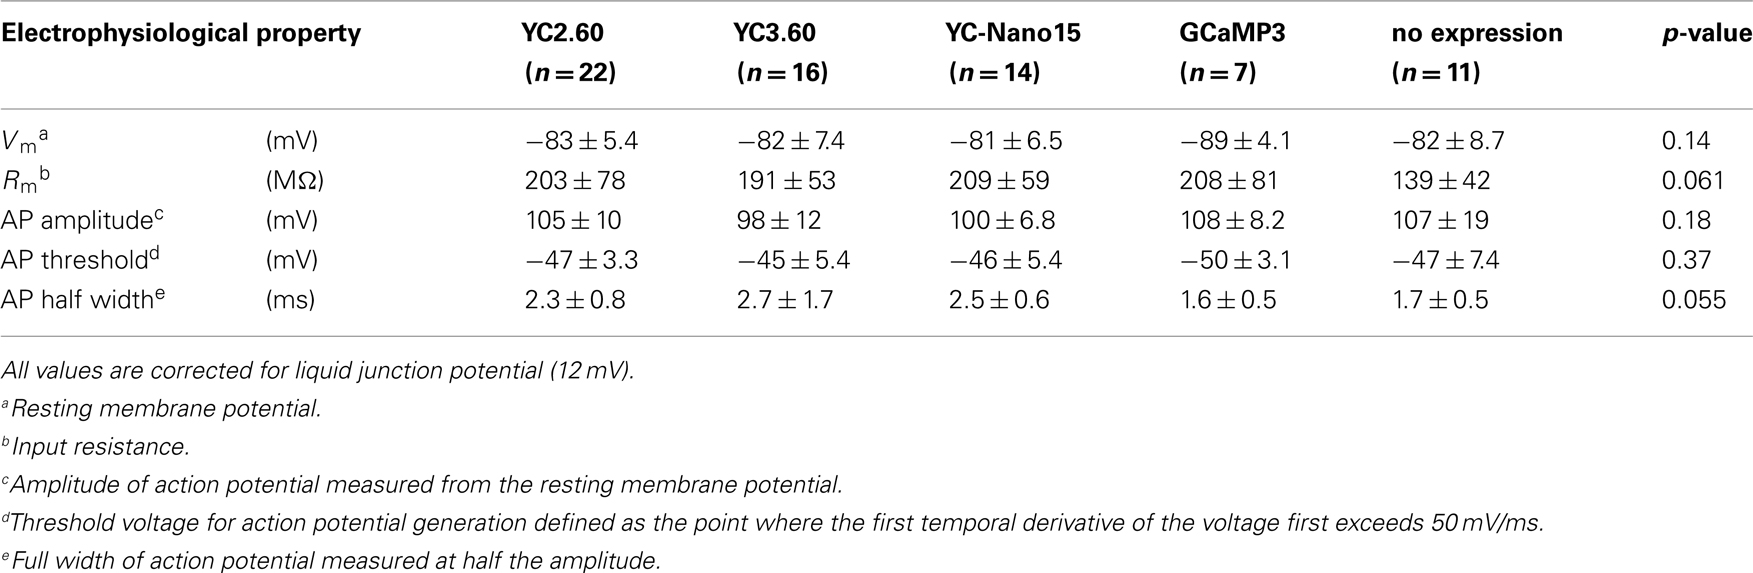
Table 1. Electrophysiological properties of layer 2/3 pyramidal cells expressing GECIs.
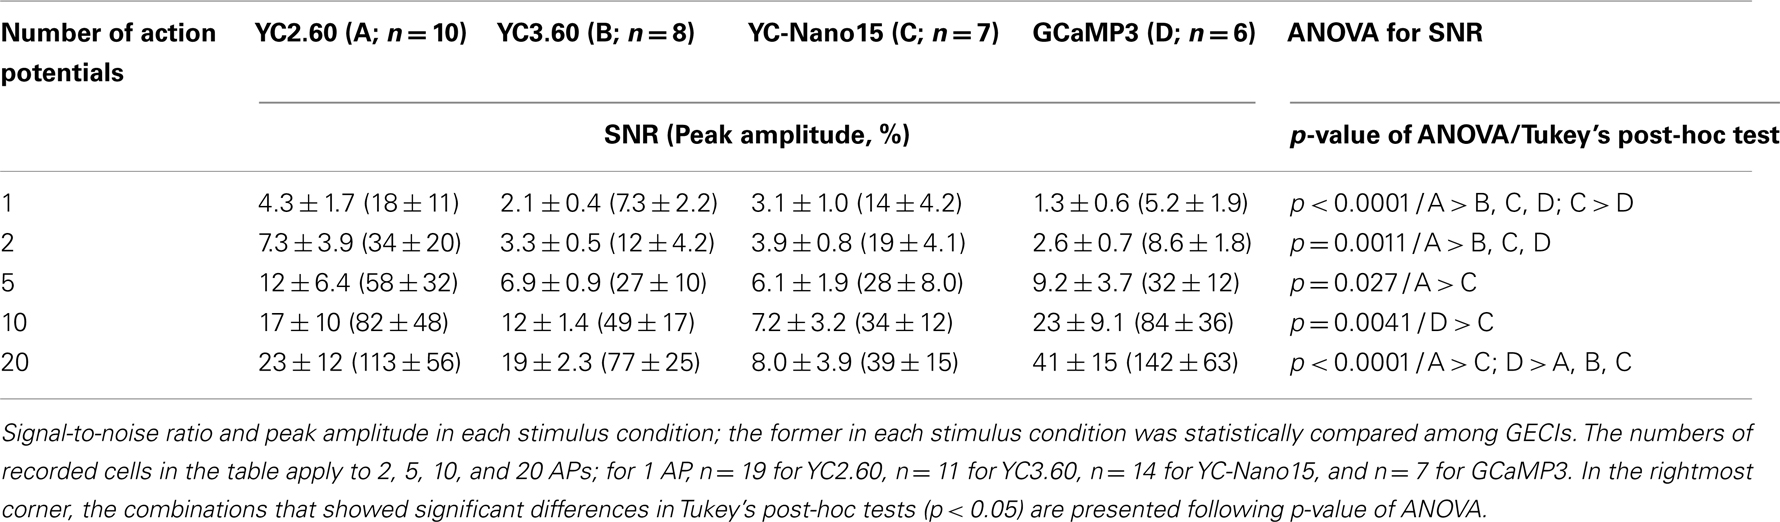
Table 2. Responses of GECIs in cortical layer 2/3 pyramidal cells.
These results show that in cortical pyramidal cells, YC2.60 would be suitable for reliable detection of sparse firing of APs, while GCaMP3 would be suitable for detecting large number of APs due to its large SNR and fast signal decay.
Comparison of GECIs in Cerebellar Purkinje Cells
We next characterized the performance of GECIs expressed in cerebellar Purkinje cells by simultaneous two-photon imaging and whole-cell patch-clamp recording in acute brain slice preparations (Figure 3A). The expression of GECIs did not have any significant effects on the electrophysiological properties of Purkinje cells (Table 3). Since Purkinje cells generate very small amplitude of Ca2+ transients in response to simple spikes upon somatic current injection (Lev-Ram et al., 1992), we evoked CSs to examine the performance of GECIs in Purkinje cells. CSs were evoked by extracellular stimulation in the granule cell layer and fluorescent changes were recorded by line-scan imaging of distal dendritic segments (Figures 3A,B), where maximal Ca2+ changes were previously reported (Konnerth et al., 1992; Miyakawa et al., 1992). Responses to 1, 2, 5, and 10 CSs at 10 Hz were analyzed (Figures 3C,D; Table 4). In response to single CSs, YC2.60, and YC-Nano15 showed suprathreshold signal changes, whereas YC3.60 and GCaMP3 did not; SNR of YC2.60 and YC-Nano15 were significantly larger than those of YC3.60 and GCaMP3 (Figure 3E; Table 4; YC2.60, 2.3 ± 0.8, n = 17; YC3.60, 1.1 ± 0.3, n = 11; YC-Nano15, 3.3 ± 1.6, n = 12; GCaMP3, 1.0 ± 0.4, n = 8). Responses to single CSs were suprathreshold in 59% (n = 10 of 17) of YC2.60-expressing cells and 83% (n = 10 of 12) of YC-Nano15-expressing cells, but in none of YC3.60-expressing cells (n = 0 of 12) or GCaMP3-expressing cells (n = 0 of 8). YC2.60 and YC-Nano15 showed larger SNR than YC3.60 and GCaMP3 over the entire stimulus range tested, both displaying little sign of saturation. Half rise time values (Figure 3F) were not significantly different among GECIs (YC2.60, 356 ± 171 ms, n = 8; YC3.60, 300 ± 41 ms, n = 7; YC-Nano15, 299 ± 30 ms, n = 7; GCaMP3, 334 ± 61 ms, n = 4), whereas half decay time values (Figure 3G) of YC2.60 (1.26 ± 0.58 s, n = 8) and YC-Nano15 (1.74 ± 0.54 s, n = 7) were significantly larger than those of YC3.60 (0.25 ± 0.11 s, n = 7) and GCaMP3 (0.16 ± 0.07 s, n = 4).
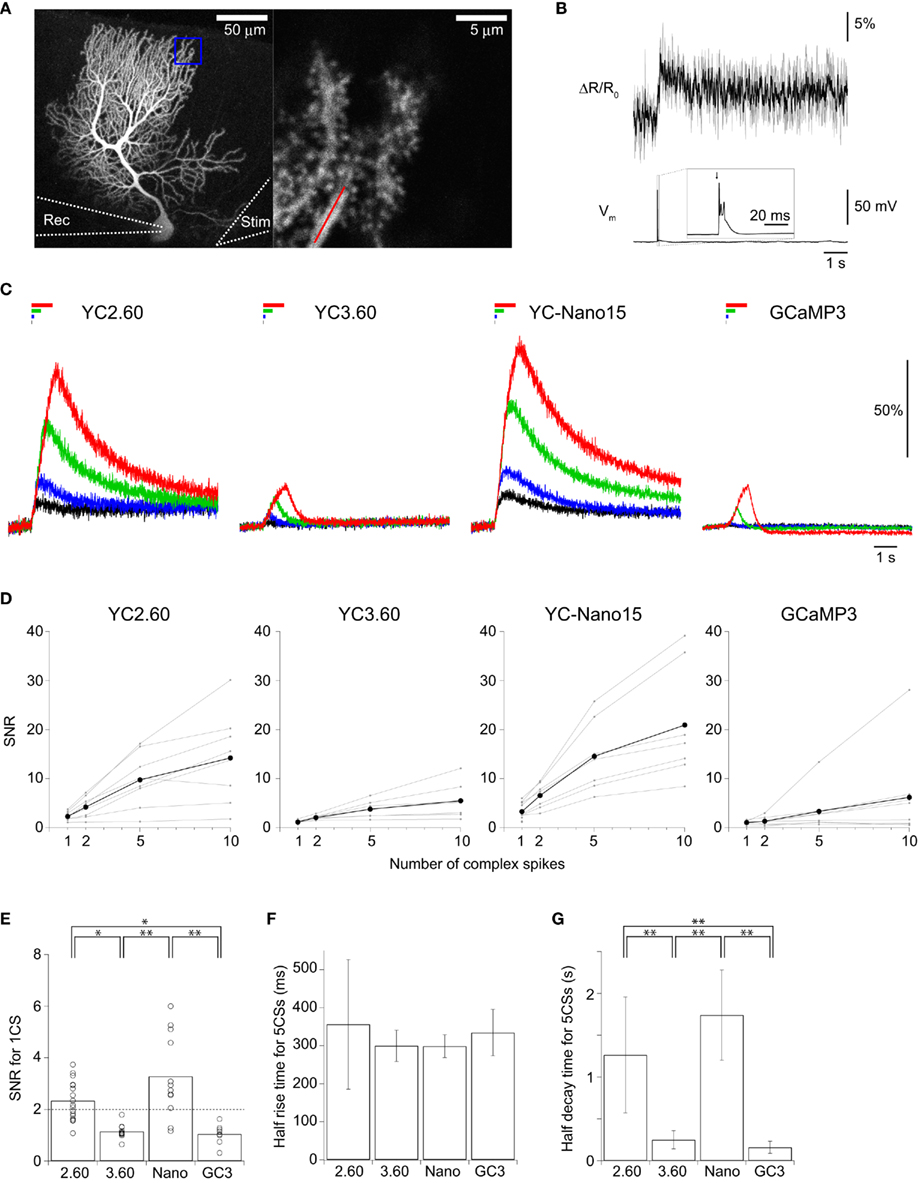
Figure 3. Quantitative comparison of GECIs in cerebellar Purkinje cells. (A) Maximum intensity projection image (Venus emission) of an E12:P56 YC2.60-expressing Purkinje cell (left), and an expanded single z-section image within the blue box (right). Line-scan imaging was performed along the distal dendrite as indicated by the red line. Rec, an eletrode for patch-clamp recording; stim, an electrode for extracellular stimulation. (B) Smoothed ΔR/R0 traces of YC2.60 in response to a single complex spike (CS) for individual trials (gray) and the mean across trials (black). (C) ΔR/R0 (YC) or ΔF/F0 (GC3) traces in response to 1 (black), 2 (blue), 5 (green), 10 (red) CSs evoked at 10 Hz. Each trace is the mean across cells (n = 8 cells for YC2.60, 7 for YC3.60, 7 for YC-Nano15, and 8 for GCaMP3). (D) SNR plotted against the number of CSs, calculated for individual Purkinje cells (gray) and the mean across cells (black). For 1 CS, n = 17 for YC2.60, n = 11 for YC3.60, n = 12 for YC-Nano15, and n = 8 for GCaMP3; for 2, 5, and 10 CS, n = 8 for YC2.60, n = 7 for YC3.60, n = 7 for YC-Nano15, and n = 8 for GCaMP3. (E) SNR in response to single CSs taken from (D). Each dot represents a value taken from an individual cell, and the bar represents the mean across cells. (F,G) Mean half rise time (F) and mean half decay time (G) of trial-averaged traces in response to 5 CSs at 10 Hz. Error bars show SD. *p < 0.05, **p < 0.01 in Tukey’s post-hoc test following one-way ANOVA.
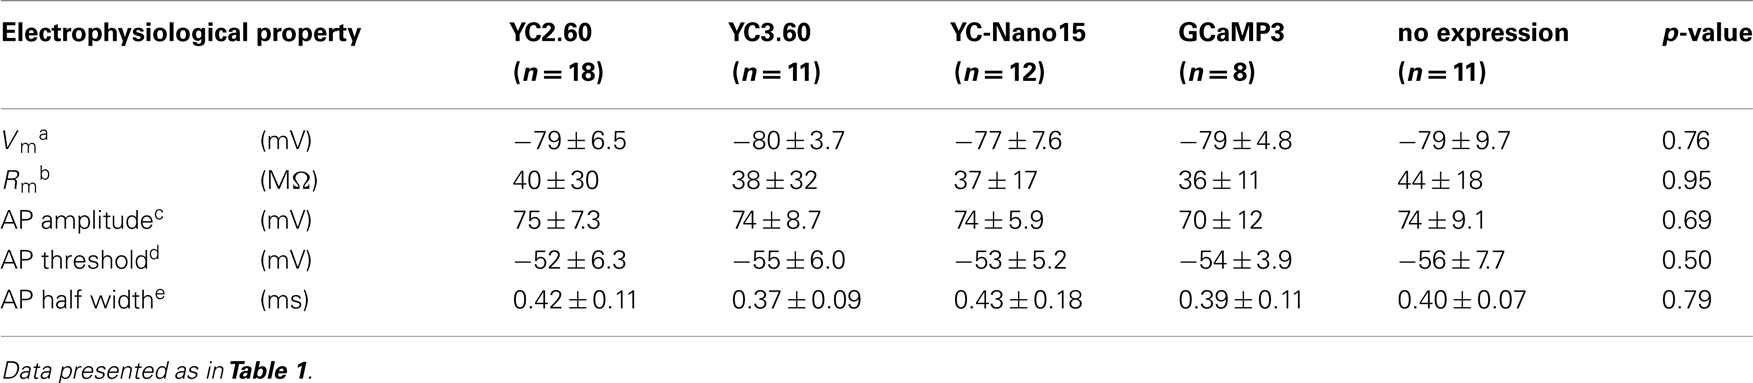
Table 3. Electrophysiological properties of cerebellar Purkinje cells expressing GECIs.
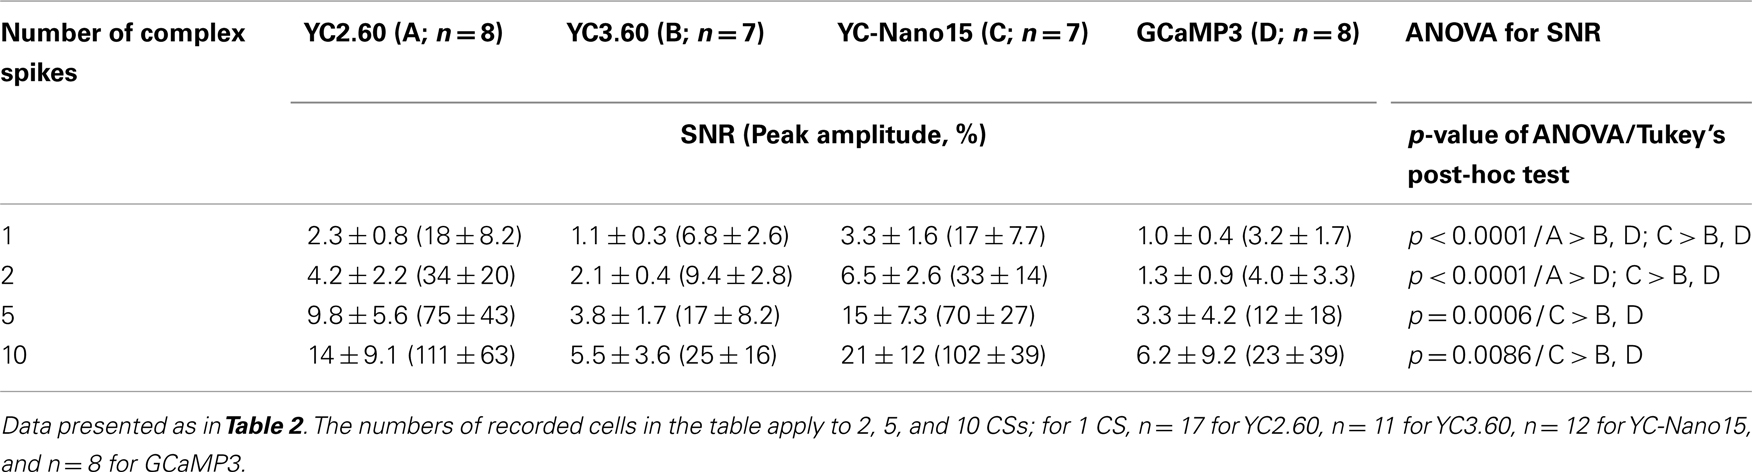
Table 4. Responses of GECIs in cerebellar Purkinje cells.
These results show that YC2.60 and YC-Nano15 are suitable for detecting CSs in cerebellar Purkinje cells despite the slow decay kinetics.
The Stability of GECI Expression and Responses
One of the major advantages of GECIs over synthetic Ca2+ dyes should be its stable expression over time, allowing its application to tracking long-term plasticity of neuronal activity. It was previously demonstrated that the performance of GECIs could remain stable for weeks to months after expression in cortical pyramidal cells (Mank et al., 2008; Tian et al., 2009; Horikawa et al., 2010). To test if this is also the case in Purkinje cells, we prepared acute cerebellar slices from YC2.60-expressing mice older than P100. The expression of YC2.60 was stable (Figure 4A), and its responses to a train of CSs were not significantly different from those in younger animals (P22–56; Figures 4B,C; Table 5; unpaired Student’s t-test). These results confirm the idea that GECIs can be promising tools for chronic recording of neuronal activity.
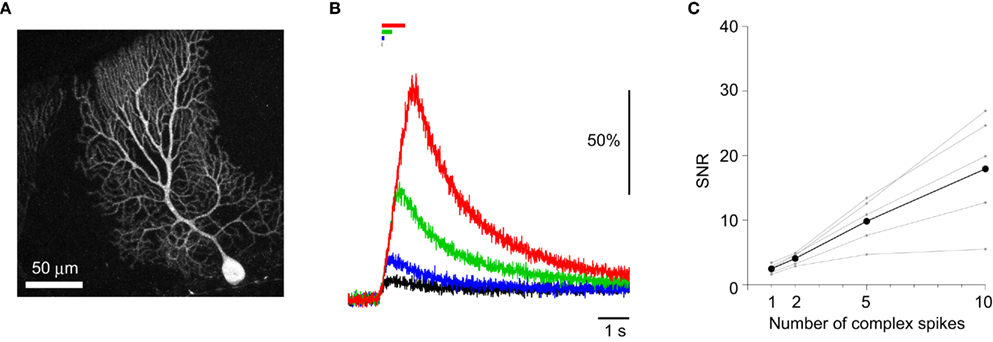
Figure 4. Stability of YC2.60 expression and responses. (A) Maximum intensity projection image (Venus emission) of an E12:P113 YC2.60-expressing Purkinje cell. (B) ΔR/R0 traces in response to 1 (black), 2 (blue), 5 (green), 10 (red) CSs evoked at 10 Hz, recorded from YC2.60-expressing Purkinje cells at P113–114. Each trace is the mean across cells (n = 5). (C) SNR plotted against the number of CSs, calculated for individual Purkinje cells (gray) and the mean across cells (black, n = 5).
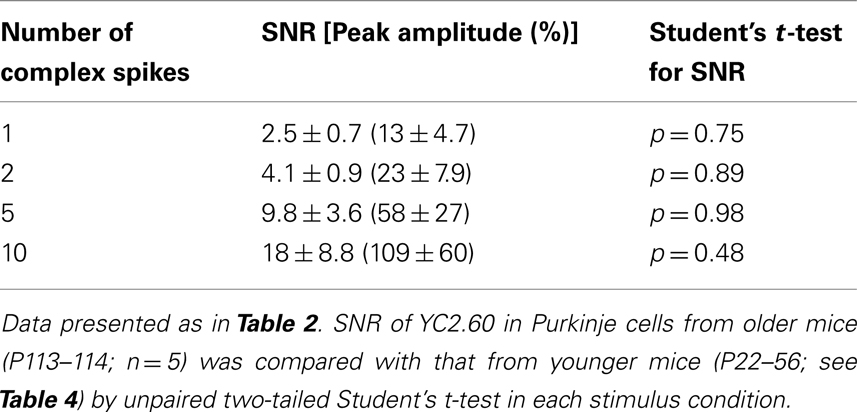
Table 5. Responses of YC2.60 in cerebellar Purkinje cells from older mice.
Discussion
We tested the performance of YC2.60, YC3.60, YC-Nano15, and GCaMP3 in mouse cortical pyramidal cells and cerebellar Purkinje cells. Our results suggest that (1) YC2.60 would be suitable for reliable detection of sparse firing of APs in cortical pyramidal cells; (2) GCaMP3 would be suitable for detecting burst firing of APs in pyramidal cells; and (3) YC2.60 as well as YC-Nano15 would be suitable for detecting CSs in cerebellar Purkinje cells. To our knowledge, this is the first study that quantitatively compares the performance of multiple GECIs in Purkinje cells, and thus should provide useful implications for the broader application of GECIs in mammalian CNS.
Comparison with Previous Studies Using the Same GECIs
In the present study, we performed the first quantitative characterization of the performance of YC2.60 in multiple mammalian neurons, and found that it exhibits good performance with little sign of signal saturation both in cortical pyramidal cells and cerebellar Purkinje cells.
In our previous work, YC-Nano15 showed much higher affinity than YC2.60 in Ca2+ titration experiment using purified proteins (Kd of YC-Nano15, 15 nM; Kd of YC2.60, 95 nM; Horikawa et al., 2010). In the present study, we found (1) in pyramidal cells YC2.60 was as sensitive to single APs as YC-Nano15 and showed better responses to larger number of APs without signal saturation and (2) in Purkinje cells they showed comparable responses, YC-Nano15 showing slightly (but not significantly) better SNR over the entire stimulus range tested (1–10 CSs at 10 Hz). The fact that YC-Nano15 was still responsive to stimulation without being saturated by the resting [Ca2+]i (~53 nM in cortical pyramidal cells (Schiller et al., 1995) and ~67 nM in Purkinje cells (Konnerth et al., 1992) implies that its affinity may decrease when expressed in neurons (see Hendel et al., 2008). YC-Nano15 still seems to have a higher affinity than YC2.60 in cortical pyramidal cells, whereas there seems to be little difference between YC-Nano15 and YC2.60 in Purkinje cells. This inconsistency between the two cell types will be discussed in the next section.
The relatively low reliability of single AP detection with YC3.60 and GCaMP3 in cortical L2/3 pyramidal cells contrasts with previous in vitro results (Tian et al., 2009; Lütcke et al., 2010), but is reminiscent of in vivo results in the same studies. This could be explained in part by the difference in the recording temperatures: ~33°C in our study vs. room temperature (22–24°C) for their in vitro experiments. Higher temperature should make Ca2+ transients smaller and faster, probably due to more active Ca2+ extrusion mechanisms and narrower APs (Markram et al., 1995). These factors should in turn decrease responses of GECIs, as predicted and demonstrated by the same group (Hires et al., 2008; Mao et al., 2008). Indeed, we also found that SNR of GCaMP3 in response to single APs was larger at room temperature (2.2 ± 0.4, n = 4) than at 31–35°C (1.3 ± 0.6, n = 7; p < 0.05, unpaired two-tailed Student’s t-test). Taken together, our results underscore the importance of appropriately designed in vitro experiments for accurate estimation of GECI performance in vivo.
Difference in GECI Performance between Pyramidal Cells and Purkinje Cells
Previous studies using synthetic Ca2+ dyes show that Ca2+ transients generated by single APs in cortical pyramidal cells (262 ± 25 nM, Helmchen et al., 1996) and those by single CSs in Purkinje cells (~150 nM, Wang et al., 2000) are comparable in vitro, and that both are detectable in vivo with comparably high fidelity (up to ~97% for L2/3 pyramidal cells (Kerr et al., 2005) and ~95% for Purkinje cells (Ozden et al., 2009). However, all the tested GECIs had a tendency to show remarkably smaller responses in Purkinje cells than in pyramidal cells, as is evident from the smaller SNR (for instance, SNR of YC2.60 in response to single pulse of stimulation were 4.3 ± 1.7 in pyramidal cells and 2.3 ± 0.8 in Purkinje cells, respectively) and the smaller percentage of cells with suprathreshold responses (for instance, YC2.60 showed suprathreshold responses to single pulse of stimulation in 89% of pyramidal cells and 59% of Purkinje cells, respectively). The mechanism responsible for this strikingly different performance of GECIs in these two cell types is unclear, but it may be accounted for, at least in part, by the much higher endogenous Ca2+ buffering capacity in Purkinje cells (Fierro and Llano, 1996; Helmchen et al., 1996; Maeda et al., 1999), which presumably reflects the total activity of Ca2+-binding proteins. We speculate that a larger amount of Ca2+-binding proteins expressed in Purkinje cells might have decreased the performance of all the GECIs tested and also somehow masked the difference between YC2.60 and YC-Nano15. In line with the notion above that GECI performance could be dramatically altered in different cell types expressing different amount of Ca2+-binding proteins, it was previously reported that the performance of YCs containing wild type CaM could be interfered with CaM in a concentration-dependent manner (Miyawaki et al., 1999; Palmer et al., 2004, 2006).
Implications for Future Improvement and Application of GECIs
YC2.60 and YC-Nano15 reliably responded to single APs and CSs, but their decay kinetics were slow, which could be a disadvantage for detecting individual events at frequency higher than 1 Hz (Horikawa et al., 2010). In contrast, YC3.60 and GCaMP3 showed faster signal decay, but they did not reliably detect small numbers of spikes. Resolving this tradeoff between sensitivity and on/off kinetics should be the focus of future improvement or development of GECIs.
Nevertheless, YC2.60 and YC-Nano15 might be fast enough for detecting spontaneous AP firing of cortical L2/3 pyramidal cells as well as spontaneous CS firing of Purkinje cells in vivo, which are both known to occur at relatively low frequency, typically 1 Hz or less (Thach, 1968; Margrie et al., 2002). It would thus be interesting to apply these GECIs to monitoring long-term plasticity of spontaneous activity in the context of learning, development and disease.
Conflict of Interest Statement
The authors declare that the research was conducted in the absence of any commercial or financial relationships that could be construed as a potential conflict of interest.
Acknowledgments
We thank Dr. Tomomi Shimogori (RIKEN BSI) for her excellent instruction on in utero surgery, Dr. Christian Wilms (UCL) for helpful comments on the manuscript, and Dr. Loren L Looger (Janelia Farm) for GCaMP3 cDNA (Addgene plasmid 22692). This work was supported by Japan Science and Technology Agency, International Cooperative Research Project and Solution-Oriented Research for Science and Technology (Katsuhiko Mikoshiba), by the Ministry of Education, Culture, Sports, Science and Technology of Japan (Takayuki Michikawa and Kastuhiko Mikoshiba), by the Wellcome Trust and Gatsby Charitable Foundation (Michael Häusser) and in part by the Special Postdoctoral Researchers Program in RIKEN (Yoshiyuki Yamada).
References
Akemann, W., Middleton, S. J., and Knöpfel, T. (2009). Optical imaging as a link between cellular neurophysiology and circuit modeling. Front. Cell. Neurosci. 3, 5. doi: 10.3389/neuro.03.005.2009
Davie, J. T., Kole, M. H. P., Letzkus, J. J., Rancz, E. A., Spruston, N., Stuart, G. J., and Häusser, M. (2006). Dendritic patch-clamp recording. Nat. Protoc. 1, 1235–1247.
Díez-García, J., Akemann, W., and Knöpfel, T. (2007). In vivo calcium imaging from genetically specified target cells in mouse cerebellum. Neuroimage 34, 859–869.
Díez-García, J., Matsushita, S., Mutoh, H., Nakai, J., Ohkura, M., Yokoyama, J., Dimitrov, D., and Knöpfel, T. (2005). Activation of cerebellar parallel fibers monitored in transgenic mice expressing a fluorescent Ca2+ indicator protein. Eur. J. Neurosci. 22, 627–635.
Dombeck, D. A., Harvey, C. D., Tian, L., Looger, L. L., and Tank, D. W. (2010). Functional imaging of hippocampal place cells at cellular resolution during virtual navigation. Nat. Neurosci. 13, 1433–1440.
Fiala, A., Spall, T., Diegelmann, S., Eisermann, B., Sachse, S., Devaud, J.-M., Buchner, E., and Galizia, C. G. (2002). Genetically expressed cameleon in Drosophila melanogaster is used to visualize olfactory information in projection neurons. Curr. Biol. 12, 1877–1884.
Fierro, L., and Llano, I. (1996). High endogenous calcium buffering in Purkinje cells from rat cerebellar slices. J. Physiol. (Lond.) 496(Pt 3), 617–625.
Hasan, M. T., Friedrich, R. W., Euler, T., Larkum, M. E., Giese, G., Both, M., Duebel, J., Waters, J., Bujard, H., Griesbeck, O., Tsien, R. Y., Nagai, T., Miyawaki, A., and Denk, W. (2004). Functional fluorescent Ca2+ indicator proteins in transgenic mice under TET control. PLoS Biol. 2, e163. doi: 10.1371/journal.pbio.0020163
Hashimoto, M., and Mikoshiba, K. (2003). Mediolateral compartmentalization of the cerebellum is determined on the “birth date” of Purkinje cells. J. Neurosci. 23, 11342–11351.
Hashimoto, M., and Mikoshiba, K. (2004). Neuronal birthdate-specific gene transfer with adenoviral vectors. J. Neurosci. 24, 286–296.
Heim, N., Garaschuk, O., Friedrich, M. W., Mank, M., Milos, R. I., Kovalchuk, Y., Konnerth, A., and Griesbeck, O. (2007). Improved calcium imaging in transgenic mice expressing a troponin C-based biosensor. Nat. Methods 4, 127–129.
Helmchen, F., Imoto, K., and Sakmann, B. (1996). Ca2+ buffering and action potential-evoked Ca2+ signaling in dendrites of pyramidal neurons. Biophys. J. 70, 1069–1081.
Hendel, T., Mank, M., Schnell, B., Griesbeck, O., Borst, A., and Reiff, D. F. (2008). Fluorescence changes of genetic calcium indicators and OGB-1 correlated with neural activity and calcium in vivo and in vitro. J. Neurosci. 28, 7399–7411.
Higashijima, S.-I., Masino, M. A., Mandel, G., and Fetcho, J. R. (2003). Imaging neuronal activity during zebrafish behavior with a genetically encoded calcium indicator. J. Neurophysiol. 90, 3986–3997.
Hires, S. A., Tian, L., and Looger, L. L. (2008). Reporting neural activity with genetically encoded calcium indicators. Brain Cell Biol. 36, 69–86.
Horikawa, K., Yamada, Y., Matsuda, T., Kobayashi, K., Hashimoto, M., Matsu-Ura, T., Miyawaki, A., Michikawa, T., Mikoshiba, K., and Nagai, T. (2010). Spontaneous network activity visualized by ultrasensitive Ca2(+) indicators, yellow Cameleon-Nano. Nat. Methods 7, 729–732.
Kanegae, Y., Makimura, M., and Saito, I. (1994). A simple and efficient method for purification of infectious recombinant adenovirus. Jpn. J. Med. Sci. Biol. 47, 157–166.
Kerr, J. N. D., De Kock, C. P. J., Greenberg, D. S., Bruno, R. M., Sakmann, B., and Helmchen, F. (2007). Spatial organization of neuronal population responses in layer 2/3 of rat barrel cortex. J. Neurosci. 27, 13316–13328.
Kerr, J. N. D., Greenberg, D., and Helmchen, F. (2005). Imaging input and output of neocortical networks in vivo. Proc. Natl. Acad. Sci. U.S.A. 102, 14063–14068.
Kerr, R., Lev-Ram, V., Baird, G., Vincent, P., Tsien, R. Y., and Schafer, W. R. (2000). Optical imaging of calcium transients in neurons and pharyngeal muscle of C. elegans. Neuron 26, 583–594.
Konnerth, A., Dreessen, J., and Augustine, G. J. (1992). Brief dendritic calcium signals initiate long-lasting synaptic depression in cerebellar Purkinje cells. Proc. Natl. Acad. Sci. U.S.A. 89, 7051–7055.
Lev-Ram, V., Miyakawa, H., Lasser-Ross, N., and Ross, W. N. (1992). Calcium transients in cerebellar Purkinje neurons evoked by intracellular stimulation. J. Neurophysiol. 68, 1167–1177.
Lütcke, H., Murayama, M., Hahn, T., Margolis, D. J., Astori, S., Zum Alten Borgloh, S. M., Göbel, W., Yang, Y., Tang, W., Kügler, S., Sprengel, R., Nagai, T., Miyawaki, A., Larkum, M. E., Helmchen, F., and Hasan, M. T. (2010). Optical recording of neuronal activity with a genetically-encoded calcium indicator in anesthetized and freely moving mice. Front. Neural Circuits 4, 9. doi: 10.3389/fncir.2010.00009
Maeda, H., Ellis-Davies, G. C. R., Ito, K., Miyashita, Y., and Kasai, H. (1999). Supralinear Ca2+ signaling by cooperative and mobile Ca2+ buffering in Purkinje neurons. Neuron 24, 989–1002.
Mank, M., and Griesbeck, O. (2008). Genetically encoded calcium indicators. Chem. Rev. 108, 1550–1564.
Mank, M., Santos, A. F., Direnberger, S., Mrsic-Flogel, T. D., Hofer, S. B., Stein, V., Hendel, T., Reiff, D. F., Levelt, C., Borst, A., Bonhoeffer, T., Hübener, M., and Griesbeck, O. (2008). A genetically encoded calcium indicator for chronic in vivo two-photon imaging. Nat. Methods 5, 805–811.
Mao, T., O’Connor, D. H., Scheuss, V., Nakai, J., and Svoboda, K. (2008). Characterization and subcellular targeting of GCaMP-type genetically-encoded calcium indicators. PLoS ONE 3, e1796. doi: 10.1371/journal.pone.0001796
Margrie, T. W., Brecht, M., and Sakmann, B. (2002). In vivo, low-resistance, whole-cell recordings from neurons in the anaesthetized and awake mammalian brain. Pflugers Arch. 444, 491–498.
Markram, H., Helm, P. J., and Sakmann, B. (1995). Dendritic calcium transients evoked by single back-propagating action potentials in rat neocortical pyramidal neurons. J. Physiol. (Lond.) 485(Pt 1), 1–20.
Miyakawa, H., Lev-Ram, V., Lasser-Ross, N., and Ross, W. N. (1992). Calcium transients evoked by climbing fiber and parallel fiber synaptic inputs in guinea pig cerebellar Purkinje neurons. J. Neurophysiol. 68, 1178–1189.
Miyake, S., Makimura, M., Kanegae, Y., Harada, S., Sato, Y., Takamori, K., Tokuda, C., and Saito, I. (1996). Efficient generation of recombinant adenoviruses using adenovirus DNA-terminal protein complex and a cosmid bearing the full-length virus genome. Proc. Natl. Acad. Sci. U.S.A. 93, 1320–1324.
Miyawaki, A. (2005). Innovations in the imaging of brain functions using fluorescent proteins. Neuron 48, 189–199.
Miyawaki, A., Griesbeck, O., Heim, R., and Tsien, R. Y. (1999). Dynamic and quantitative Ca2 + measurements using improved cameleons. Proc. Natl. Acad. Sci. U.S.A. 96, 2135–2140.
Nagai, T., Yamada, S., Tominaga, T., Ichikawa, M., and Miyawaki, A. (2004). Expanded dynamic range of fluorescent indicators for Ca2(+) by circularly permuted yellow fluorescent proteins. Proc. Natl. Acad. Sci. U.S.A. 101, 10554–10559.
Ohki, K., Chung, S., Ch’ng, Y. H., Kara, P., and Reid, R. C. (2005). Functional imaging with cellular resolution reveals precise micro-architecture in visual cortex. Nature 433, 597–603.
Ohki, K., Chung, S., Kara, P., Hübener, M., Bonhoeffer, T., and Reid, R. C. (2006). Highly ordered arrangement of single neurons in orientation pinwheels. Nature 442, 925–928.
Ozden, I., Sullivan, M. R., Lee, H. M., and Wang, S. S.-H. (2009). Reliable coding emerges from coactivation of climbing fibers in microbands of cerebellar Purkinje neurons. J. Neurosci. 29, 10463–10473.
Palmer, A. E., Giacomello, M., Kortemme, T., Hires, S. A., Lev-Ram, V., Baker, D., and Tsien, R. Y. (2006). Ca2+ indicators based on computationally redesigned calmodulin-peptide pairs. Chem. Biol. 13, 521–530.
Palmer, A. E., Jin, C., Reed, J. C., and Tsien, R. Y. (2004). Bcl-2-mediated alterations in endoplasmic reticulum Ca2+ analyzed with an improved genetically encoded fluorescent sensor. Proc. Natl. Acad. Sci. U.S.A. 101, 17404–17409.
Pologruto, T. A., Yasuda, R., and Svoboda, K. (2004). Monitoring neural activity and [Ca2+] with genetically encoded Ca2+ indicators. J. Neurosci. 24, 9572–9579.
Rothschild, G., Nelken, I., and Mizrahi, A. (2010). Functional organization and population dynamics in the mouse primary auditory cortex. Nat. Neurosci. 13, 353–360.
Schiller, J., Helmchen, F., and Sakmann, B. (1995). Spatial profile of dendritic calcium transients evoked by action potentials in rat neocortical pyramidal neurones. J. Physiol. (Lond.) 487(Pt 3), 583–600.
Smith, S. L., and Häusser, M. (2010). Parallel processing of visual space by neighboring neurons in mouse visual cortex. Nat. Neurosci. 13, 1144–1149.
Stosiek, C., Garaschuk, O., Holthoff, K., and Konnerth, A. (2003). In vivo two-photon calcium imaging of neuronal networks. Proc. Natl. Acad. Sci. U.S.A. 100, 7319–7324.
Sullivan, M. R., Nimmerjahn, A., Sarkisov, D. V., Helmchen, F., and Wang, S. S.-H. (2005). In vivo calcium imaging of circuit activity in cerebellar cortex. J. Neurophysiol. 94, 1636–1644.
Thach, W. T. (1968). Discharge of Purkinje and cerebellar nuclear neurons during rapidly alternating arm movements in the monkey. J. Neurophysiol. 31, 785–797.
Tian, L., Hires, S., Mao, T., Huber, D., Chiappe, M., Chalasani, S., Petreanu, L., Akerboom, J., Mckinney, S., Schreiter, E., Bargmann, C., Jayaraman, V., Svoboda, K., and Looger, L. L. (2009). Imaging neural activity in worms, flies and mice with improved GCaMP calcium indicators. Nat. Methods 6, 875–881.
Wallace, D. J., Meyer Zum Alten Borgloh, S., Astori, S., Yang, Y., Bausen, M., Kügler, S., Palmer, A. E., Tsien, R. Y., Sprengel, R., Kerr, J. N. D., Denk, W., and Hasan, M. T. (2008). Single-spike detection in vitro and in vivo with a genetic Ca2+ sensor. Nat. Methods 5, 797–804.
Keywords: genetically encoded Ca2+ indicators, adenovirus, two-photon imaging, patch-clamp recording, cortical pyramidal cell, cerebellar Purkinje cell, acute brain slice
Citation: Yamada Y, Michikawa T, Hashimoto M, Horikawa K, Nagai T, Miyawaki A, Häusser M and Mikoshiba K (2011) Quantitative comparison of genetically encoded Ca2+ indicators in cortical pyramidal cells and cerebellar purkinje cells. Front. Cell. Neurosci. 5:18. doi: 10.3389/fncel.2011.00018
Received: 19 August 2011;
Paper pending published: 06 September 2011;
Accepted: 11 September 2011;
Published online: 29 September 2011.
Edited by:
Dieter Wicher, Max Planck Institute for Chemical Ecology, GermanyReviewed by:
Heinz Beck, University of Bonn Medical Center, GermanyCorette Wierenga, Max Planck Institute of Neurobiology, Germany
Copyright: © 2011 Yamada, Michikawa, Hashimoto, Horikawa, Nagai, Miyawaki, Häusser and Mikoshiba. This is an open-access article subject to a non-exclusive license between the authors and Frontiers Media SA, which permits use, distribution and reproduction in other forums, provided the original authors and source are credited and other Frontiers conditions are complied with.
*Correspondence: Takayuki Michikawa, Laboratory for Molecular Neurogenesis, Brain Science Institute, RIKEN, 2-1 Hirosawa Wako-shi, Saitama, 351-0198, Japan. e-mail:dC1taWNoaWthd2FAYnJhaW4ucmlrZW4uanA=; Katsuhiko Mikoshiba, Laboratory for Developmental Neurobiology, Brain Science Institute, RIKEN, 2-1 Hirosawa Wako-shi, Saitama, 351-0198, Japan. e-mail:bWlrb3NpYmFAYnJhaW4ucmlrZW4uanA=
†Present address: Kazuki Horikawa, Multicellular Society Laboratory, Center for Frontier Research, National Institute of Genetics, Mishima, Shizuoka, Japan.