 Vanessa Budny1,2Chantal Bodenmann1Kathrin J. Zürcher1Maik Krüger1
 Sherida M. de Leeuw1,2
 Rebecca Z. Weber1Ruslan Rust3,4
 Luca Ravotto5
 Iván Ruminot6,7
 L. Felipe Barros6,8
 Bruno Weber2,5
 Christian Tackenberg1,2*
- 1Institute for Regenerative Medicine, University of Zurich, Schlieren, Switzerland
- 2Neuroscience Center Zurich, University of Zurich and ETH, Zurich, Switzerland
- 3Department of Physiology and Neuroscience, University of Southern California, Los Angeles, CA, United States
- 4Zilkha Neurogenetic Institute, Keck School of Medicine, University of Southern California, Los Angeles, CA, United States
- 5Institute for Pharmacology and Toxicology, University of Zurich, Zürich, Switzerland
- 6Centro de Estudios Científicos (CECs), Valdivia, Chile
- 7Facultad de Ciencias para el Cuidado de la Salud, Universidad San Sebastián, Valdivia, Chile
- 8Facultad de Medicina, Universidad San Sebastián, Valdivia, Chile
Introduction: The main genetic risk factor for Alzheimer’s disease (AD) is the presence of the apolipoprotein E4 (APOE4) allele. While APOE4 increases the risk of developing AD, the APOE2 allele is protective and APOE3 is risk-neutral. In the brain, APOE is primarily expressed by astrocytes and plays a key role in various processes including cholesterol and lipid transport, neuronal growth, synaptic plasticity, immune response and energy metabolism. Disruptions in brain energy metabolism are considered a major contributor to AD pathophysiology, raising a key question about how different APOE isoforms affect the energy metabolism of human astrocytes.
Methods: In this study, we generated astrocytes (iAstrocytes) from APOE-isogenic human induced pluripotent stem cells (iPSCs), expressing either APOE2, APOE3, APOE4 or carrying an APOE knockout (APOE-KO), and investigated APOE genotype-dependent changes in energy metabolism.
Results: ATP Seahorse assay revealed a reduced mitochondrial and glycolytic ATP production in APOE4 iAstrocytes. In contrast, glycolysis stress tests demonstrated enhanced glycolysis and glycolytic capacity in APOE4 iAstrocytes while genetically encoded nanosensor-based FLIM analysis revealed that APOE does not affect lactate dynamics. In agreement with the increased glycolytic activity, APOE4 iAstrocytes also showed elevated mitochondrial respiration and activity, indicated by proteomic GO enrichment analysis and mitochondrial stress test. This was accompanied by elevated proton leak in APOE4 iAstrocytes while levels of mitochondrial uncoupling proteins (UCPs) were not affected. Mass spectrometry-based metabolomic analysis identified various energy and glucose metabolism-related pathways that were differentially regulated in APOE4 compared to the other genotypes, including mitochondrial electron transport chain (ETC) and glycolysis. In general, APOE2 and APOE-KO iAstrocytes showed a very similar phenotype in all functional assays and differences between APOE2/APOE-KO and APOE4 were stronger than between APOE3 and APOE4.
Discussion: Our study provides evidence for APOE genotype-dependent effects on astrocyte energy metabolism and highlights alterations in the bioenergetic processes of the brain as important pathomechanisms in AD.
1 Introduction
The human brain is a highly energy-demanding organ and requires substantial metabolic resources to maintain its functions. Alterations in the bioenergetic processes of the brain are commonly observed during aging and are implicated in various neurodegenerative diseases, such as Alzheimer’s disease (AD). AD is the most common age-related neurodegenerative disease affecting memory and executive functions. Several genetic and non-genetic risk factors have been identified so far to influence the AD risk. Among those, the ε4 allele of the apolipoprotein E (APOE4) represents the strongest genetic risk factor (Tanzi, 2012). Three major allelic variants of human APOE have been identified: APOE2, APOE3 and APOE4. APOE4 increases the risk for developing AD by 2.5-4-fold in heterozygous and 12-15-fold in homozygous carriers (Corder et al., 1993; Grupe et al., 2007; Corneveaux et al., 2010), however the risk is affected by factors such as sex or population ancestry (Belloy et al., 2023). In contrast, APOE3 is defined as risk-neutral while APOE2 represents the strongest genetic protective factor (Corder et al., 1994; Farrer et al., 1997; Reiman et al., 2020). In the brain, APOE is mainly produced by astrocytes, which generate up to 80% of total brain APOE (Blumenfeld et al., 2024). APOE isoforms differentially affect astrocyte function (de Leeuw and Tackenberg, 2019). Human isogenic iPSC-derived astrocytes expressing APOE4 displayed a pro-inflammatory phenotype, reduced beta-amyloid uptake capacity and altered lipid metabolism compared to astrocytes expressing APOE3 or APOE2 (de Leeuw et al., 2022). Importantly, APOE is also implicated in regulating bioenergetic homeostasis of the brain.
Numerous studies have demonstrated altered glucose metabolism as a common phenotype in AD, especially in APOE4 carriers. [18F] fluorodeoxyglucose (FDG)-PET imaging showed hypometabolism in AD brains, mainly in the temporoparietal cortex including the precuneus and posterior cingulate cortex (Reiman et al., 1996; Foster et al., 2007). Interestingly, several studies in young APOE4 carriers or in APOE4-knock-in mice with no apparent neurodegenerative pathology, revealed increased brain metabolism and activity (Filippini et al., 2009; Evans et al., 2017; Nuriel et al., 2017; Venzi et al., 2017), indicating that the APOE4 effect on brain energy metabolism may differ depending on the degree of pathology. Further, post-mortem analysis of AD brains discovered higher brain tissue glucose concentration, reduced glycolytic flux and lower levels of neuronal glucose transporter GLUT3 but no effect on astrocytic glucose transporter GLUT1, suggesting cell type specific metabolic alterations in AD (An et al., 2018).
The proposed mechanisms of how APOE variants, especially APOE4, affect the energy metabolism of neural cells remain inconclusive. They range from reduced glycolysis in APOE4-expressing cells (Wu et al., 2018; Fang et al., 2021; Zhang et al., 2023), via a metabolic shift from oxidative phosphorylation to glycolysis in APOE4 or AD patient cells (Sonntag et al., 2017; Williams et al., 2020; Farmer et al., 2021; Lee et al., 2023) to an increase in oxidative phosphorylation in APOE4 induced neurons (Budny et al., 2024). Further, many studies only compare two APOE variants, mostly APOE4 and APOE3. Thus, more research is required to specifically show how APOE4, compared to both APOE3 and APOE2, alters glycolytic and mitochondrial function in human brain cells.
In the present study, we used human APOE-isogenic iPSC-derived astrocytes (iAstrocytes) to investigate the impact of APOE4, APOE3, APOE2 and APOE-KO on astrocyte energy metabolism. Our findings reveal APOE genotype-dependent metabolic and proteomic changes. APOE4 iAstrocytes showed upregulated oxidative phosphorylation (OXPHOS) proteomic pathways, accompanied by increased mitochondrial respiration and glycolysis. Interestingly, despite the elevated metabolic activity, APOE4 iAstrocytes produced less ATP compared to the other APOE variants. The substantial differences observed in comparison to APOE-KO indicate a gain-of-function mechanism by APOE4 rather than a loss-of-function.
2 Materials and methods
2.1 iPS cell culture
APOE-isogenic iPS cell lines BIONi10-C3 (APOE-KO), BIONi10-C6 (APOE2), BIONi10-C2 (APOE3), and BIONi10-C4 (APOE4); (Schmid et al., 2019; Schmid et al., 2020; de Leeuw et al., 2022) have been purchased from EBiSC. iPSCs were cultured on vitronectin (1:25; 100–0763, StemCell Technologies) coated plates in mTESR+ medium (100–0276, StemCell Technologies), split every 3–4 days and culture medium was exchanged every other day. For splitting, cells were washed with DPBS, incubated with ReLeSR (5,872, StemCell Technologies) for 4 min at 37°C with 5% CO2, detached in 1 mL mTESR+ and transferred to a new plate.
2.2 iAstrocyte differentiation
iAstrocyte differentiation was carried out as described earlier (de Leeuw et al., 2022). In brief, iPSC lines were differentiated into NPCs by applying dual SMAD inhibition. On day 0, cells (appr. 20% confluent) were washed with PBS and medium changed to Neural Induction Medium 1, including 50% advanced DMEM/F12 (21,331,020, Gibco), 50% Neurobasal (21103–049, Gibco), 1x N2 (17,502,048, Thermo scientific), 1x B27 (17,504,044, Thermo Scientific), 2 mM Glutamax (Gibco) and 10 ng/mL hLIF (AF-300-05, Peprotech), 4 μM CHIR99021 (130–103-926, Miltenyi), 3 μM SB431542 (130–106-543, Miltenyi), 2 μM Dorsomorphin (130–104-466, Miltenyi), and 0.1 μM Compound E (73,952, StemCell Technologies). Medium was changed daily. On day 3, cells were washed with PBS and medium was changed to Neural Induction Medium 2, including 50% advanced DMEM/F12, 50% Neurobasal, 1x N2, 1x B27, 2 mM Glutamax, 10 ng/mL hLIF, 4 mM CHIR99021, 3 mM SB431542, and 0.1 mM Compound E. On day 7, cells (appr. 80% confluent) were passaged from 12 well plates to 6 well plates coated with 15 mg/mL poly-L-ornithine (P4957, Sigma-Aldrich) and 10 mg/mL laminin (L2020, Sigma-Aldrich). The medium was changed to neural stem cell maintenance medium (NSMM), including 50% advanced DMEM/ F12, 50% Neurobasal, 1x N2, 1x B27, 2 mM Glutamax, 10 ng/mL hLIF, 3 μM CHIR99021, and 2 μM SB431542. Medium was changed every day and cells were passaged twice a week (at 90–100% confluency). The first five passages 2 μM Thiazovivin (SML1045, Sigma) was added to NSMM and after five passages 5 ng/mL FGF (PHG6015, Thermo Fisher) and 5 ng/mL epidermal growth factor (EGF; PHG6045, Thermo Fisher) was added.
NPC passages 1–4 were further differentiated to astrocytes replating them onto 1 mg/mL Fibronectin (F1141-1MG, Sigma-Aldrich; 135.000 cells/well in 6 well plates) coated plates and changing the medium 1 day later to complete astrocyte medium (AM; 1801, ScienCell) supplemented with 2% FCS (0010, ScienCell) and AGS (1852, ScienCell) and P/S (0503, ScienCell) for 30 days. Medium was changed every other day and cells were passaged at 80–100% confluency. For the main stock, cells were frozen in BAMBANKER serum-free cryopreservation medium (WAKO302-14681, Avantor) at d28 which was the last time point before maturation of the astrocytes. For maturation and elimination of remaining proliferative cells, astrocytes were replated (350.000 cells/well in 6 well plates) and medium was changed to AM with 2 mM AraC (C1768, Sigma) but without FCS and then changed every other day. From day 37, cells were cultured in AM without FCS and without AraC until day 45. Cells were always replated at least 24 h before an experiment.
2.3 Immunocytochemistry
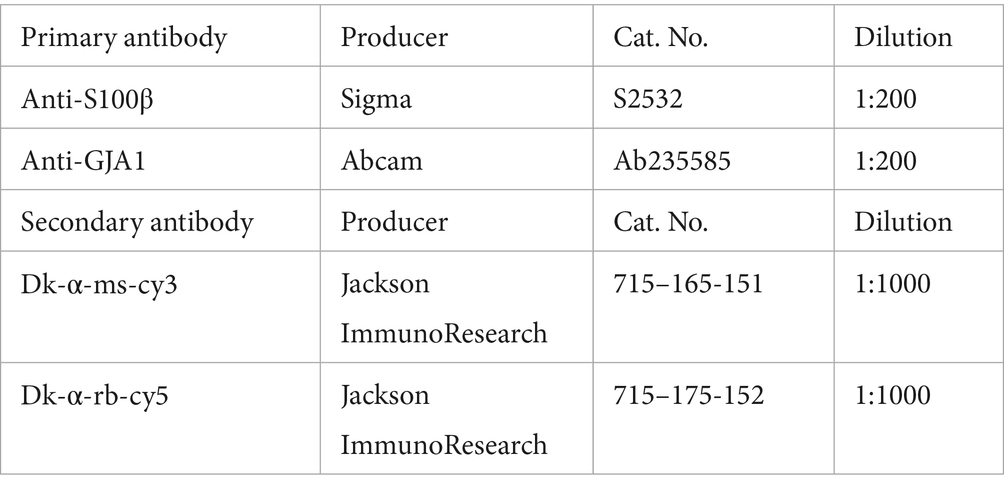
iAstrocytes were fixated after differentiation at d45 for 20 min at room temperature (RT) with 4% Paraformaldehyde (PFA; 47377.9 L, VWR) and 4% sucrose (S9378, Merck) in DPBS. After washing the cells three times with PBS for about 5 min at RT, cells were blocked with 10% donkey serum (D9663, Sigma Aldrich) and 0.1% Triton (X100, Sigma Aldrich) in DPBS for 1 h at RT. After washing with DPBS, cells were incubated with primary antibodies diluted in 3% donkey serum and 0.1% Triton in DPBS overnight at 4°C. After washing at the next day, secondary antibodies diluted in 3% donkey serum and 0.1% Triton in DPBS were added to the cells and incubated for 2 h at RT in the dark. After washing, cells were incubated with 0.4 ng/μl DAPI (D9542, Sigma Aldrich) diluted in DPBS for 10 min. After another washing step, the coverslips were mounted with Mowiol (81,381, Sigma Aldrich) on microscope objectives and stored over night at 4°C protected from light.
For calculation of differentiation efficiency, the number of s100β-positive cells was calculated per total DAPI count.
2.4 Protein extraction
iAstrocytes were harvested with Accutase. Cells were resuspended in RIPA buffer supplemented with protease inhibitor (11,697,498,001, Sigma Aldrich). Three cycles of 30s of sonication were used to disrupt the cellular membranes. To extract the proteins, samples were centrifuged at 20.000 g for 10 min at 4°C and the supernatant was finally collected and stored at −20°C until usage. Protein concentrations were determined with the Pierce BCA Assay Kit (23,252, Thermo Fisher Scientific) according to the manufacturer’s instructions and the absorption at 562 nm was measured with the Infinite M Nano plate reader (Tecan).
2.5 Immunoblotting
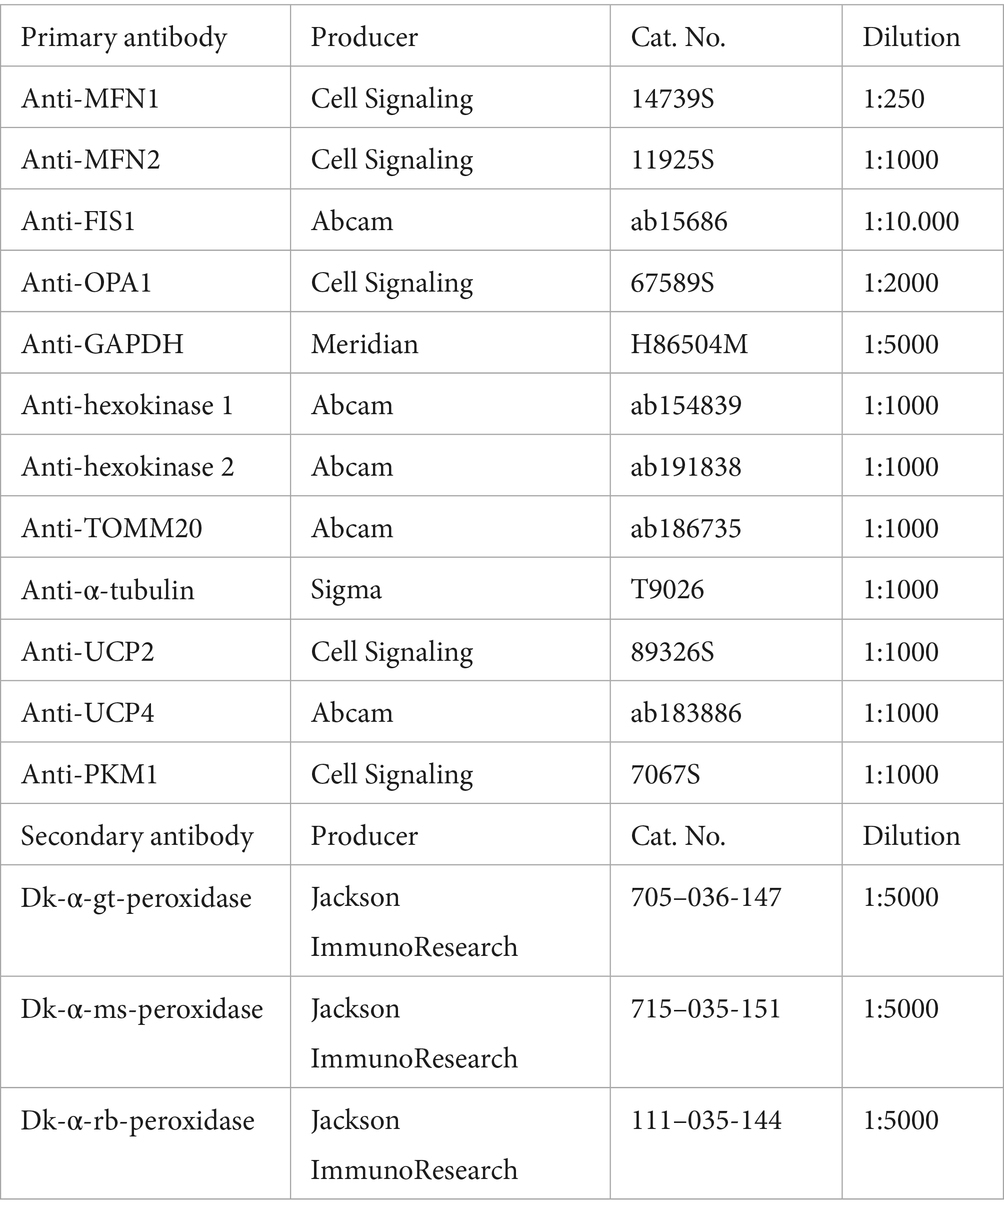
Each sample was diluted in RIPA buffer to obtain a concentration of 10 μg protein and mixed with sample buffer (NP0007, Thermo Fisher Scientific). Samples were denatured for 5 min at 95°C. Seeblue2 plus protein ladder (LC5925, Thermo Fisher Scientific) and samples were loaded onto 10–20% Tricine SDS-PAGE gels (EC6625BOX, Invitrogen) and run at 60 V for 15 min and 100 V for 90 min. Blotting was performed with the Trans-Blot Turbo Mini 0.2 μm nitrocellulose Transfer Pack (1,704,158, Bio-Rad) and the Trans-Blot Turbo Transfer System (1,704,158, Bio-Rad) at 2.5 A with 25 V for 7 min. Membranes were washed with 0.05% Tween (P1379, Sigma Aldrich) in PBS and blocked with 5% milk solution (A0830, ITW Reagents) in PBS for 1 h at RT shaking. Membranes were then washed three times with PBS-Tween and incubated with primary antibodies diluted in 5% milk solution in PBS-Tween overnight at 4°C shaking. The next day, membranes were washed three times with PBS-Tween and incubated with secondary antibodies diluted in 5% milk solution in PBS-Tween for 2 h at RT in the dark shaking. Membranes were washed three times, developed with one of the ECL selection kits (RPN2232/ RPN2235, Cytiva; 32,106, Thermo Fisher Scientific) and imaged at the Image Quant 800 (Cytiva). Background subtraction was performed, and protein expressions were normalized to the housekeeping marker GAPDH or α-tubulin.
2.6 Seahorse assay
Using the Seahorse XFe24 (Agilent) the oxygen consumption rate (OCR) and the extracellular acidification rate (ECAR) were measured. Based on these measurements, all other factors were calculated. Seahorse experiments were performed according to the manufacturer’s instructions. Sensors were preincubated in H2O at 37°C without CO2 overnight and changed to calibrant 1 h before the assay. Optimal cell density for each cell type was tested in prior Seahorse experiments. iAstrocytes were replated at 40.000 cells/well the day before the assay which was performed at day 45 or day 46 of differentiation. For each assay four measurements at baseline and three measurements after drug induction were performed. Each assay type was repeated three times for each cell line and included four background wells for each assay. The Seahorse DMEM medium (103575–100, Agilent) was freshly supplemented with 1 mM pyruvate and 2 mM L-glutamine and for the ATP rate and Mito Stress Test also with 10 mM glucose.
2.6.1 ATP rate assay
For the ATP Rate Assay drugs were used at the final concentrations of 1.5 μM oligomycin and 0.5 μM Rotenone + Antimycin A (ROT/AA). Based on OCR and ECAR measurements, ATP production rate was calculated as follows:
Glycolytic ATP production rate
Glycolysis converts glucose to lactate, producing 2 ATP and 2 H+ per molecule of glucose. Therefore, the glycoATP production rate is equivalent to the glycolytic proton efflux rate (glycoPER):
Where:
• 0.5 = buffer capacity of the measurement system, comprising the assay medium and XF assay conditions (instrument, sensor, labware).
Mitochondrial ATP production rate
The mitochondrial component of ATP production is determined from the OCR inhibited by oligomycin:
This value is then converted to mitochondrial ATP production using the formula:
Where:
• 2 ATP rate assay = number of O atoms per O₂ molecule
• P/O ratio = 2.75 (an average value validated across multiple cell types)
Total ATP production rate
The total ATP production rate is the sum of both pathways:
2.6.2 Mito stress test
For the Mito Stress Test drugs were used at the final concentrations of 1.5 μM oligomycin, 2 μM Carbonyl cyanide-4 phenylhydrazone (FCCP) for and 0.5 μM Rotenone + Antimycin A (ROT/AA). FCCP titration was done in earlier Seahorse experiments. Based on OCR measurements, mitochondrial respiration parameters were calculated as follows:
2.6.3 Glyco stress test
For the Glyco Stress Test drugs were used at a final concentration of 10 mM glucose, 1 μM oligomycin and 50 mM 2-deoxy-glucose (2-DG). Based on ECAR measurements, glycolytic parameters were calculated as follow:
After Seahorse assays, cells were immediately fixated with 4% PFA and 4% sucrose in DPBS and stained with 0.4 ng/μL DAPI for 10 min at RT. DAPI was imaged with an inverted fluorescence microscope (Zeiss) with 10x magnification. The number of nuclei in each well was automatically analyzed by a macro written in Fiji and used for normalization of the Seahorse data with the Wave Software.
2.7 Fluorescence lifetime imaging
7–8 days before imaging, d37-39 iAstrocytes were replated onto microscope dishes (IBL, 220.110.012) at a density of 120.000 cells/dish. Cells were transduced with 1 μL AAV nanosensor 2 h after replating, once the cells had begun to attach to the plate. The lactate sensor LiLac [Koveal et al., 2022; ssAAV-2/2-shortCAG-6xHis_LiLac-WPRE-SV40p(A)] was purchased from the viral vector facility of the University of Zurich. After 24 h, virus was removed with a medium change. Cells were normally cultured until the imaging experiment at day 45/46. Before imaging, cells were cultured for at least 1 h in reference buffer. During imaging, microscope dishes were constant perfused with reference buffer containing 112 mM NaCl, 3 mM KCl, 1.25 mM CaCl2, 24 mM NaHCO3, 1.25 mM MgSO4, 10 mM HEPES, 2 mM glucose, 1 mM lactate, 0.1 mM pyruvate, 2 mM L-glutamine, at a rate of about 2 mL/min at a constant temperature around 34°C using a customized version of the PiFlow pump (Kassis et al., 2018). For a stable baseline, cells were given about 5–10 min to adjust to the setup. Drugs were added in addition to the reference buffer at a concentration of 5 mM sodium azide (Merck, 1.06688.0100) and 2 μM AR-C155858 (MedChem, HY-13248).
FLIM imaging was performed on a custom two-photon microscope (Mayrhofer et al., 2015) coupled to an Insight Deep(see SpectraPhysics) femtosecond pulsed laser. A 25x water immersion objective (XLPlan N 25×/1.05w MP, WD = 2 mm, Olympus) was used for image acquisition. The excitation and emission beam paths were separated using a dichroic mirror. Emission light was further divided into specific wavelength components with dichroic mirrors at 560 and 506 nm, then focused on a PMA Hybrid 40-mod HPD detector (Picoquant) equipped with filters for CFP (475/50;) and laser rejection (770SP). Data acquisition and system control were performed using a customized version of ScanImage 3.8 and custom LabVIEW software (Version 2012; National Instruments)., while Time-Correlated Single-Photon Counting and FLIM image generation were performed using in-house instrumentation (Velasquez Moros et al., 2025). LiLac-expressing cells were excited at 870 nm and images were acquired at a 2.96 Hz with a 128×128 pixel resolution.
FLIM data analysis was conducted using FLIManalysis,1 a Matlab-based wrapper of the FLIMfit library (Warren et al., 2013) designed to facilitate batch processing. ROIs were selected using ImageJ and including ROI-based decay summation was performed before fitting.
2.8 Proteomics
For this study, we analyzed a proteomic dataset that we previously generated (de Leeuw et al., 2022) and focused on yet unpublished pathways related to energy metabolism. The detailed methodology for sample preparation, mass spectrometry acquisition and data processing has been described (de Leeuw et al., 2022). Briefly, iAstrocytes were cultured, treated and lysed in RIPA buffer before protein extraction using the iST Kit (PreOmics, Germany). Mass spectrometry analysis was performed using an Orbitrap Fusion Lumos (Thermo Scientific) coupled to an M-Class UPLC (Waters).
For the present study, we focused on proteins and pathways associated with cellular energy metabolism. The acquired raw MS data were reprocessed using MaxQuant and statistical analyses were performed in R. We conducted pathway enrichment analysis using the fgsea R/Bioconductor package, leveraging gene sets from the Molecular Signatures Database (MSigDB). Protein lists were ranked based on moderated t-statistics and enrichment scores were computed to identify significantly altered pathways. All data processing steps were conducted as previously described, with modifications specific to the analysis of metabolic pathways.
2.9 Metabolomics—sample preparation for LC–MS analysis of polar metabolites
iAstrocytes were cultured until day 45. Following a single PBS wash, polar metabolites were extracted using a MeOH: ACN: H2O (40:40:20) solution. The plate was manually shaken for 30 s and incubated at −80°C with closed lids for 15 min. Cells were then detached using a cell scraper, transferred to Eppendorf tubes and stored at −80°C. For each cell line three batches were collected before samples being delivered to the Functional Genomics Center Zurich. For each sample, 4 mL of extract was delivered to the Functional Genomic Center Zürich to perform LC–MS based untargeted analysis of the polar metabolites content.
The extracts have been centrifuged for 20 min at 7000 rpm and 4°C to precipitate proteins and cell debris, 3 mL of clear supernatant was progressively transferred to clean 2 mL test tubes and dried under nitrogen flow prior to solubilization of the metabolites in injection solvent (90% acetonitrile). The protein pellet was used to determine the protein content of each sample, and the protein content was later used for data normalization.
Before measuring, the samples were centrifuged for 10 min at 10.000 rpm/ 4°C and the clear supernatant was transferred to glass vials suitable for LC–MS analysis (Total Recovery Vials, Waters). In addition, method blanks, mixtures of pure standards, and pooled samples were prepared in the same way to serve as quality control for the measurements.
For heatmap visualization, log2-transformed protein expression was used. Proteins with missing values across any of the conditions were excluded. The data were then normalized by computing row-wise Z-scores (per protein). A heatmap was generated using pheatmap package in R.
2.10 Metabolomics—LC–MS data acquisition
Metabolites were separated on a Thermo Vanquish Horizon Binary Pump equipped with Waters Premier BEH Amide column (150 mm x 2.1 mm), applying a gradient of 10 mM ammonium bicarbonate in 5% acetonitrile pH9 (A) and 10 mM ammonium bicarbonate in 95% acetonitrile (B) from 99% B to 30% B over 12 min. The injection volume was 5 μL while the flow rate was 0.4 ul/min with column temperature of 40°C and autosampler temperature of 5°C.
The LC was coupled to Thermo Exploris 480 mass spectrometer by a HESI source. MS1 (molecular ion) and MS2 (fragment) data were acquired using negative polarization and Full MS / dd-MS2 (Top5) over a mass range of 70 to 1,050 m/z at MS1 and MS2 resolution of >17′500. Quality controls were run on pooled samples, reference compound mixtures, and blanks to determine technical accuracy and stability.
2.11 Metabolomics—untargeted metabolomics data analysis
The metabolomics dataset was evaluated in an untargeted fashion with Compound Discoverer software (Thermo Scientific). The modular data analysis workflow includes spectra selection, retention times alignment, compound detection and grouping, gap filling, background filtering and normalization (data are protein content normalized). mzCloud and mzVault have been used to score fragmentation patterns and assign MS2-based identities to the features. A filtering process was performed, leading to the manually annotated compound table, where each feature is annotated with the highest level of confidence. Filtering parameters used were the following: Signa/noise > 3, mzCloud or mzVault match >50, ppm mass error within +/− 5 ppm., match with in-house developed MS1_RT library within +/− 10 s, chromatographic peak and MS2 spectra quality.
Enrichment analysis was performed using Metaboanalyst 6.0 (Pang et al., 2024). For comparison of two groups the quantitative enrichment analysis function was selected, pathways were identified according to small molecule pathway database (SMDB) library and results were plotted using R.
2.12 Statistics
Normal distribution was tested by using the Shapiro–Wilk normality test and the Kolmogorov–Smirnov test. Outliers were identified with the ROUT test (Q = 1%). Differences between groups were analyzed by one-way ANOVA followed by Tukey test for multiple comparisons for normally distributed data or by the Kruskal-Wallis test followed by Dunn’s multiple comparisons test for not normally distributed data. For the Seahorse assays, 3–5 wells per cell line with each containing about 40.000 cells were analyzed per assay and each assay was repeated at least 3 times independently. One biological replicate (n) represents 1 well measured in the Seahorse assay. For FLIM, 10 cells per dish and experiment were analyzed. The 10 analyzed cells were averaged and represent 1 biological replicate (n) for our FLIM measurements. FLIM experiments were repeated at least 4 times independently. For the Western blot 1 biological sample represents 1 cell culture well, derived from an independent differentiation. For MS-based proteomics and metabolomics, 1 biological sample represents one well derived from an independent differentiation. Three biological replicates were analyzed per genotype for proteomics and metabolomics analysis.
3 Results
3.1 APOE4 decreases ATP production based on glycolysis and mitochondrial respiration
To determine the APOE effect on human astrocytes, we differentiated APOE-isogenic iPS cell lines (APOE-KO, APOE2, APOE3 and APOE4) into functional iAstrocytes (Figure 1A). Both the APOE-isogenic iPSCs and iAstrocytes had already been characterized and functionally validated in previous studies (de Leeuw et al., 2022; Budny et al., 2024). To verify successful iAstrocytes differentiation, immunostaining was performed confirming the expression of astrocyte markers s100β and GJA1 (Supplementary Figure S1A). Differentiation efficiency was calculated as s100β-positive cells per total DAPI counts and reached >97% for all cell lines (Supplementary Figure S1B). To determine whether APOE genotypes differentially regulate the glycolytic and mitochondrial ATP production in our APOE-isogenic iAstrocytes, a Seahorse ATP rate assay was performed. Oxygen consumption rate (OCR) and extracellular acidification rate (ECAR) were measured four times at baseline and three times after each drug administration (Figures 1B,C). Oligomycin and Rotenone/Antimycin A (ROT/AA) were used to inhibit respiratory complex V and I/III, respectively, based on which mitochondrial and glycolytic ATP production could be analyzed. Mitochondrial ATP production was significantly lower in APOE4 iAstrocytes than in all other APOE lines (E4 < E3 = E2 = KO; Figure 1D). ATP production based on glycolysis as well as total ATP production was lower in APOE3 and APOE4 iAstrocytes compared to APOE2 and APOE-KO (E4 = E3 < E2 = KO; Figures 1E,F). The lower total ATP production in APOE3 compared to APOE2 and APOE-KO iAstrocytes was mainly caused by a reduction in glycolysis rather than in mitochondrial respiration. Interestingly, the proportion of glycolsis-generated ATP was higher in APOE2 and APOE-KO iAstrocytes (41 and 42%, respectively) than in APOE3 (29%) and APOE4 iAstrocytes (33%; Figure 1G).
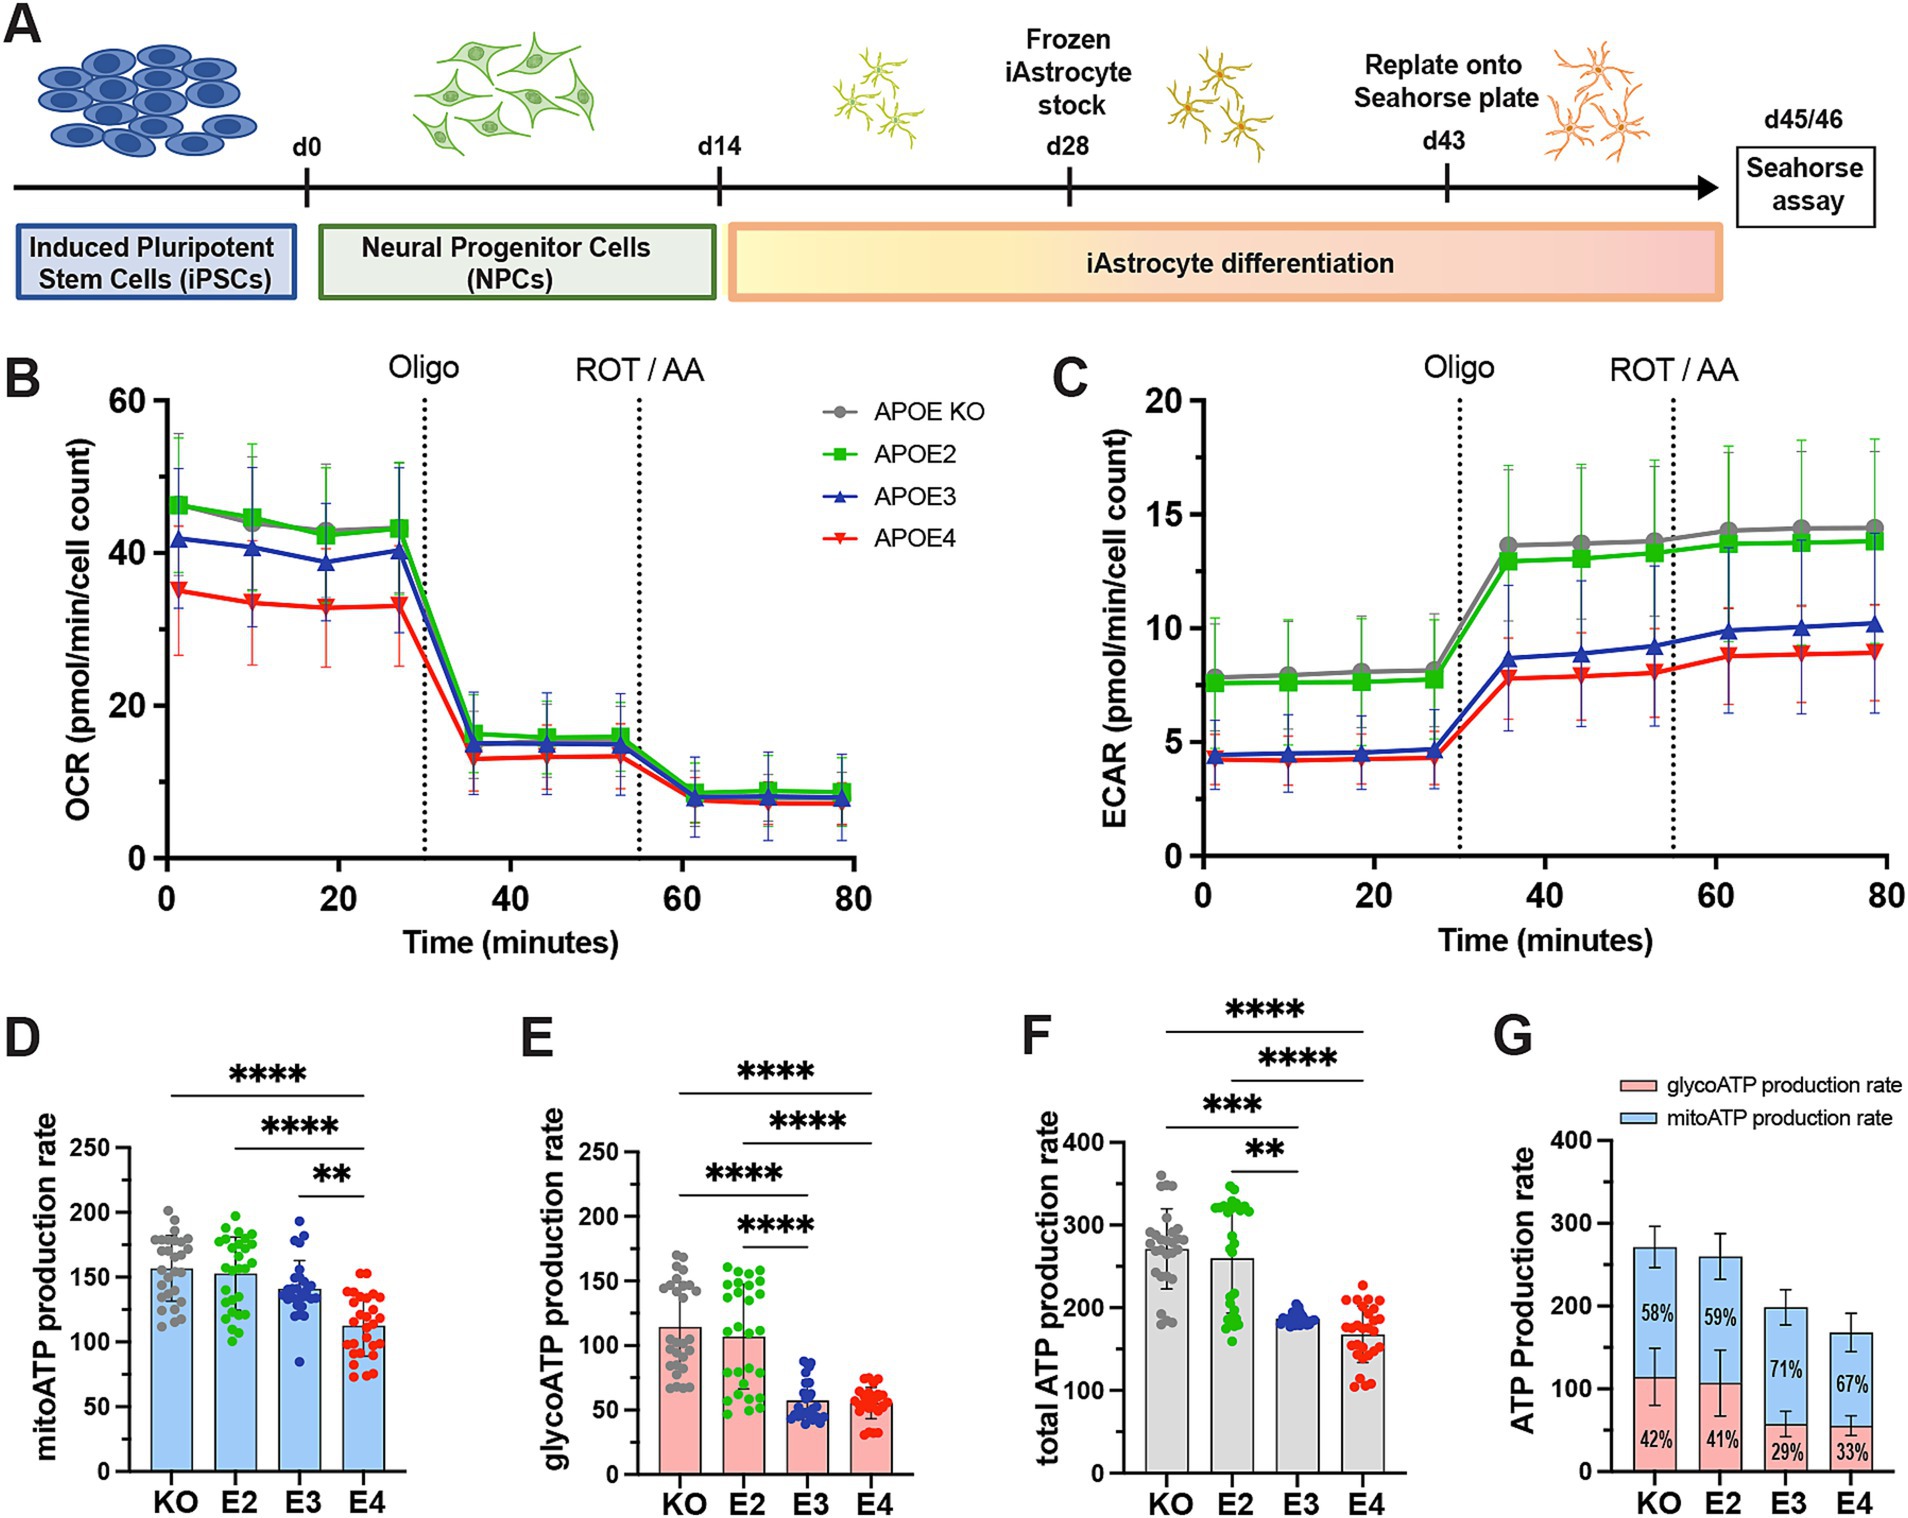
Figure 1. ATP production in APOE-isogenic astrocytes. (A) Schematic differentiation timeline of APOE-isogenic iAstrocytes for the seahorse assays. (B) OCR and (C) ECAR were measured in iAstrocytes. APOE-KO in gray, APOE2 in green, APOE3 in blue and APOE4 in red. Oligo: Oligomycin; ROT/AA: Rotenone/Antimycin A. (D) Mitochondrial ATP (mitoATP) production rate, (E) glycolytic ATP (glycoATP) production rate and (F, G) total ATP production rate, calculated based on OCR and ECAR measurements. glycoATP in red and mitoATP in blue. Data was analyzed using the Kruskal-Wallis test (Dunn’s multiple comparisons test) (D–F). ATP rate assay was repeated seven times independently. **p < 0.01, ***p < 0.001, ****p < 0.0001.
3.2 APOE4 increases glycolysis
We further assessed APOE genotype-dependent alterations of glycolytic function in iAstrocytes in more detail. Protein levels of the first enzymes in the glycolytic pathway, hexokinase 1 and 2 (HK1, HK2), were measured (Figure 2A). No differences in HK1 were observed (Figure 2C), while protein levels of HK2 were significantly lower in APOE3 and APOE4 compared to APOE-KO and APOE2 (KO = E2 > E3 = E4; Figure 2D). This is in agreement with the reduction of glycoATP production in APOE3 and APOE4 (Figure 1E). Interestingly, levels of pyruvate kinase (PKM1), the enzyme that catalyzes the last step in glycolysis, was not affected by the APOE genotype (Figures 2B,E). Subsequently, the Seahorse Glyco Stress Test was performed to tease out effects glycolytic function, glycolysis as well as glycolytic capacity and reserve. OCR and ECAR were measured both at baseline and after the addition of glucose, Oligomycin and 2-deoxy-glucose (2-DG; Figures 2F,G). 2-DG is a glucose analog that inhibits glycolysis by competitively binding HK. Based on ECAR values, glycolytic properties were analyzed. APOE4 astrocytes exhibited increased glycolysis and glycolytic capacity compared to APOE-KO and APOE2 (Figures 2H,I), while glycolytic reserve remained unchanged between APOE lines (Figure 2J). These results indicate that APOE4 affects glycolytic function on both protein and functional level.
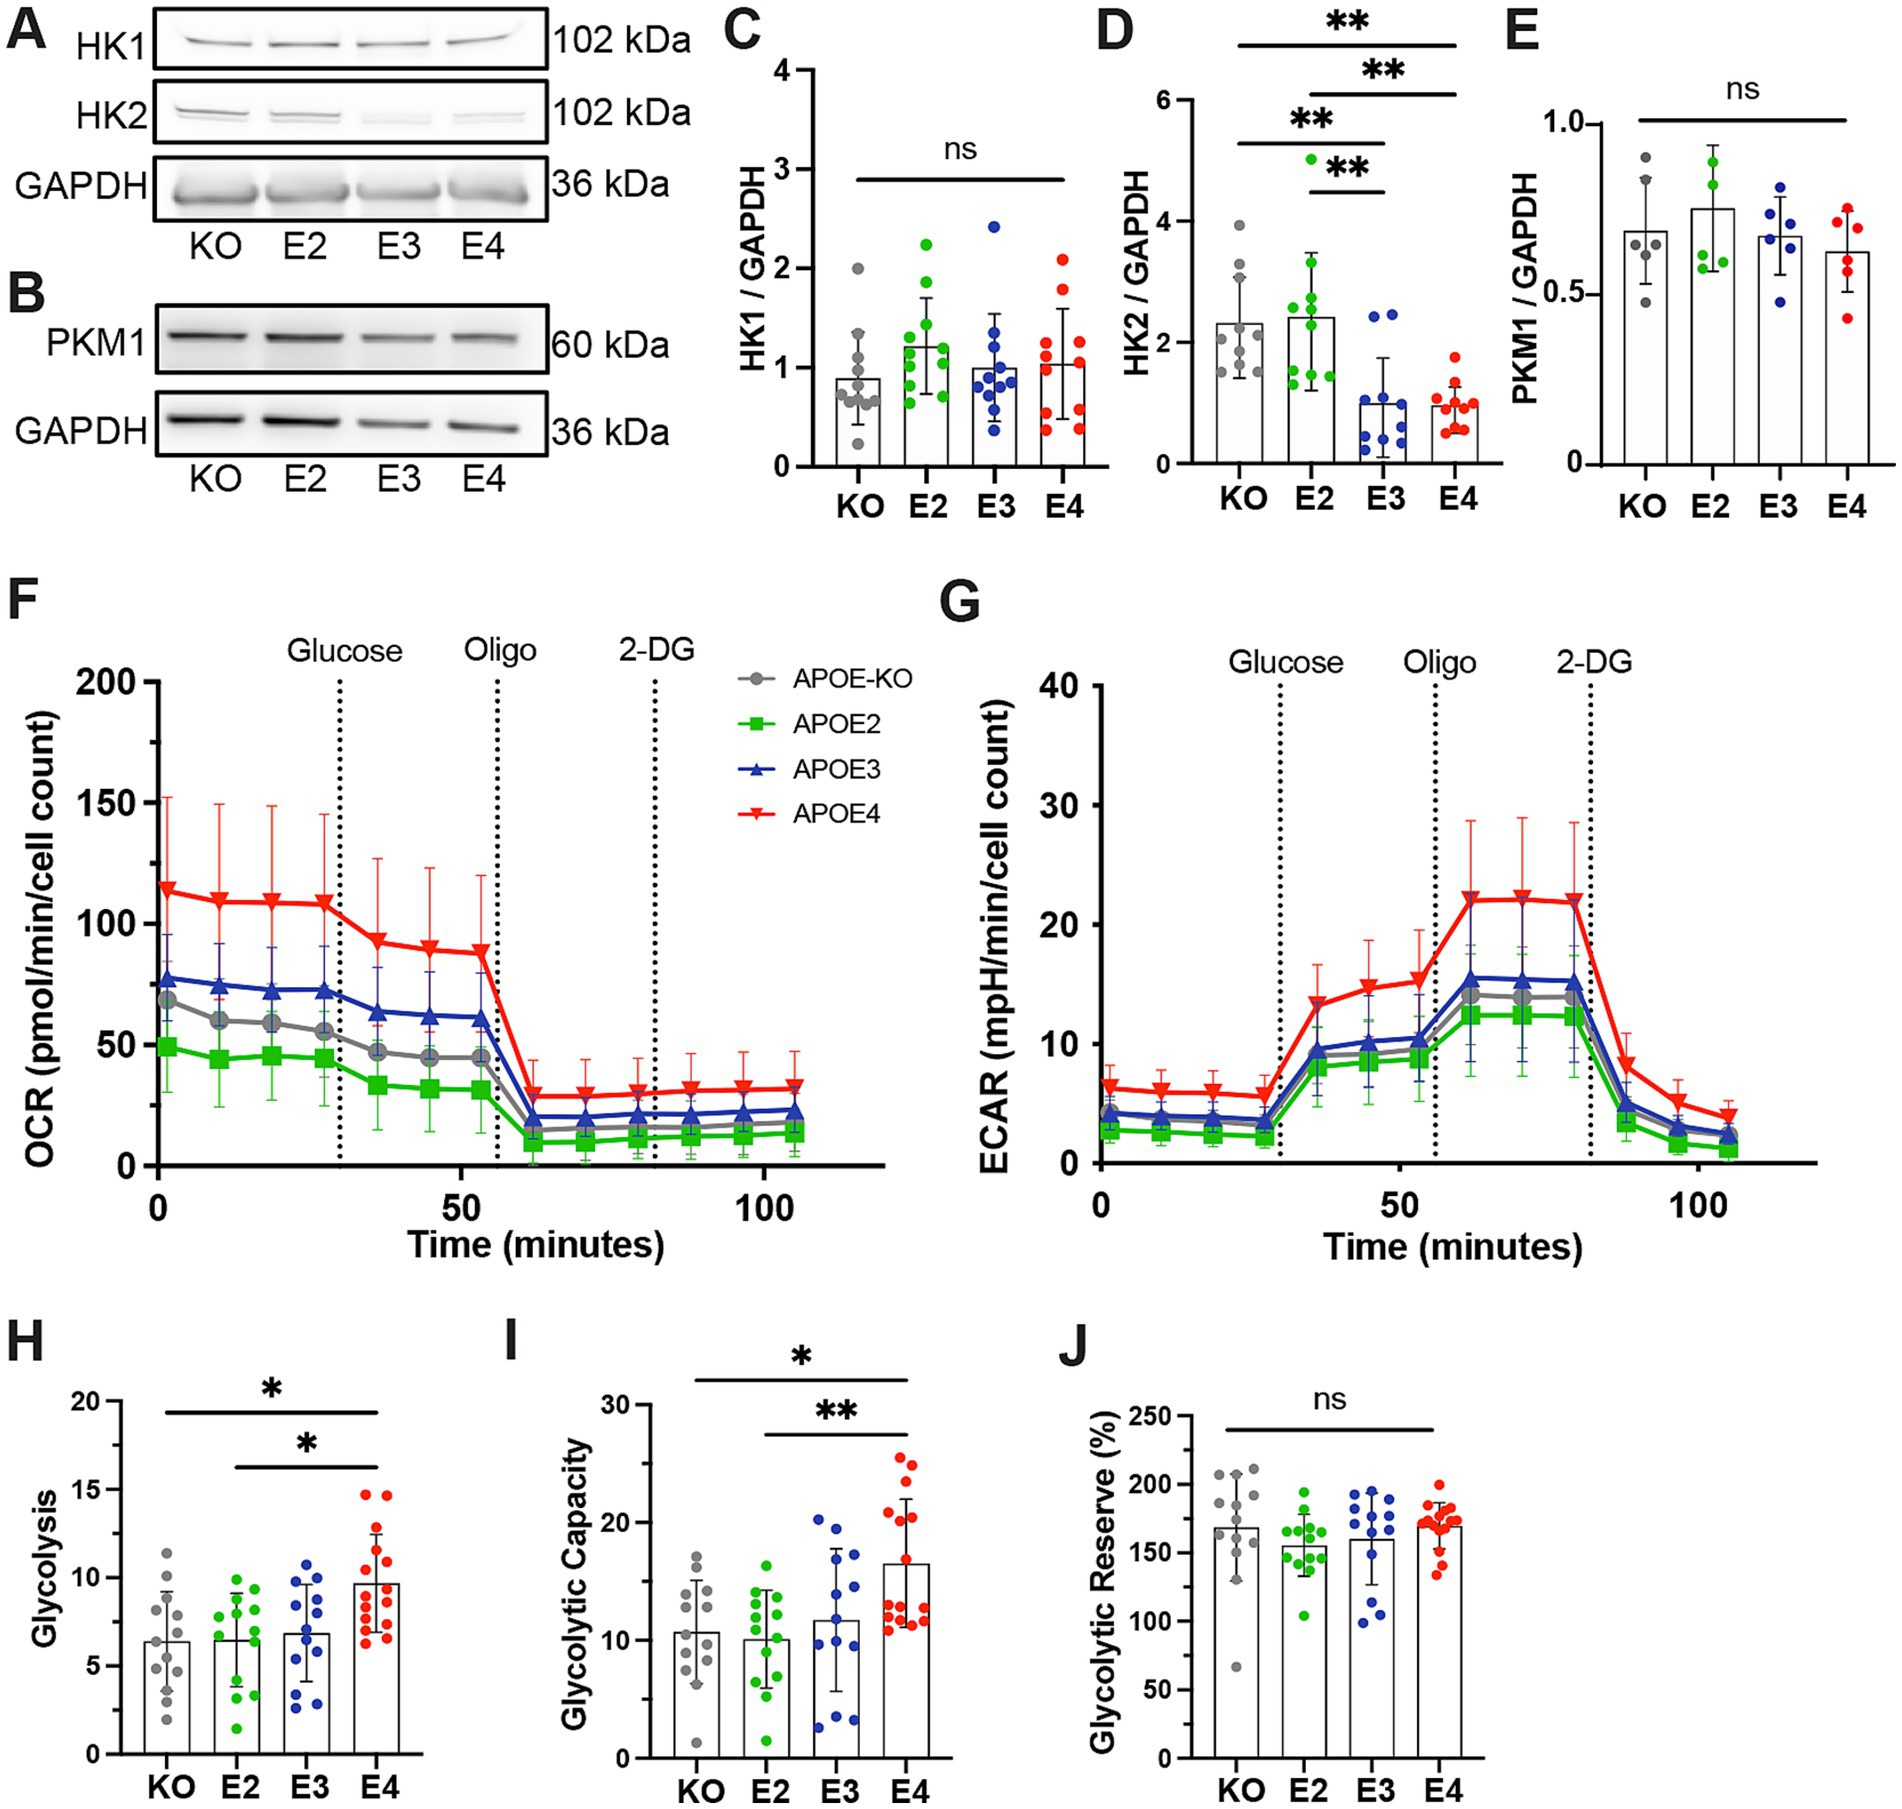
Figure 2. Glycolytic function in APOE-isogenic iAstrocytes. (A, B) Representative western blots of HK1, HK2, PKM1 and GAPDH in APOE-KO, −E2, −E3 and –E4 iAstrocytes. (C, E) Quantified protein levels of HK1, HK2 and PKM1 in APOE-KO, −E2, E3 and -E4 iAstrocytes. All protein levels were normalized to GAPDH. (F) OCR and (G) ECAR in iAstrocytes. APOE-KO in gray, APOE2 in green, APOE3 in blue and APOE4 in red. Oligo: Oligomycin; Glu: Glucose; 2-DG: Glucose analog 2-deoxy-D-glucose. (H) Glycolytic function, (I) glycolytic capacity and (J) glycolytic reserve in iAstrocytes. Data was analyzed using the Kruskal-Wallis test (Dunn’s multiple comparisons test) (D, J) or one-way ANOVA (Tukey test for multiple comparisons) (C, E, H, I). Western blots were repeated at least ten times (C, D) or six times (E) and Glyco Stress Test was repeated three times independently. ns, not significant, *p < 0.05, **p < 0.01.
3.3 APOE genotype does not affect lactate dynamics
Given the observed changes in glycolysis, we further investigated glycolytic function by analyzing lactate dynamics in more detail. iAstrocytes were transduced with LiLac, a nanosensor for lactate, and fluorescence lifetime microscopy (FLIM) imaging was used to analyze intracellular lactate levels (Koveal et al., 2022; Figures 3A–C; Supplementary Video 1). Imaging was performed under cell culture-like conditions at 34°C and with carboxygenated reference buffer (RB) flow (Figure 3B). Basal lactate levels were measured during the perfusion with RB at the beginning of each experiment. No differences in basal lactate levels were observed between the lines (Figure 3D). After a constant baseline, 5 mM sodium azide was added to inhibit mitochondrial function and stimulate glycolysis. The rate of lactate increase was then assessed by slope analysis (Figure 3E; Supplementary Figure S2). Similar rates of lactate increase through azide treatment were observed between APOE genotypes (Figure 3F). After a constant baseline again with RB, 2 μM of the monocarboxylate transport inhibitor AR-C was added (Figure 3G). The immediate decrease in measured lifetime is equivalent to an increase in intracellular lactate and shows that iAstrocytes predominantly produce lactate. By using slope analysis, the rate of lactate increases, which represents the rate of intracellular lactate accumulation after the inhibition of lactate export through monocarboxylate transporters was determined (Figure 3H). Similar rates of lactate increase through AR-C were observed between APOE lines. The Warburg index, a measure of the balance between glycolytic and oxidative metabolism, was then calculated based on dividing the AR-C slope through the azide slope. This indicates whether cells rely on aerobic glycolysis rather than mitochondrial respiration for energy production. While APOE4 and APOE3 showed a slightly reduced Warburg index, the difference between the genotypes was not significant (Figure 3I). Taken together, APOE genotypes differentially affect mitochondrial respiration and glycolysis, but have no observable effect on lactate dynamics.
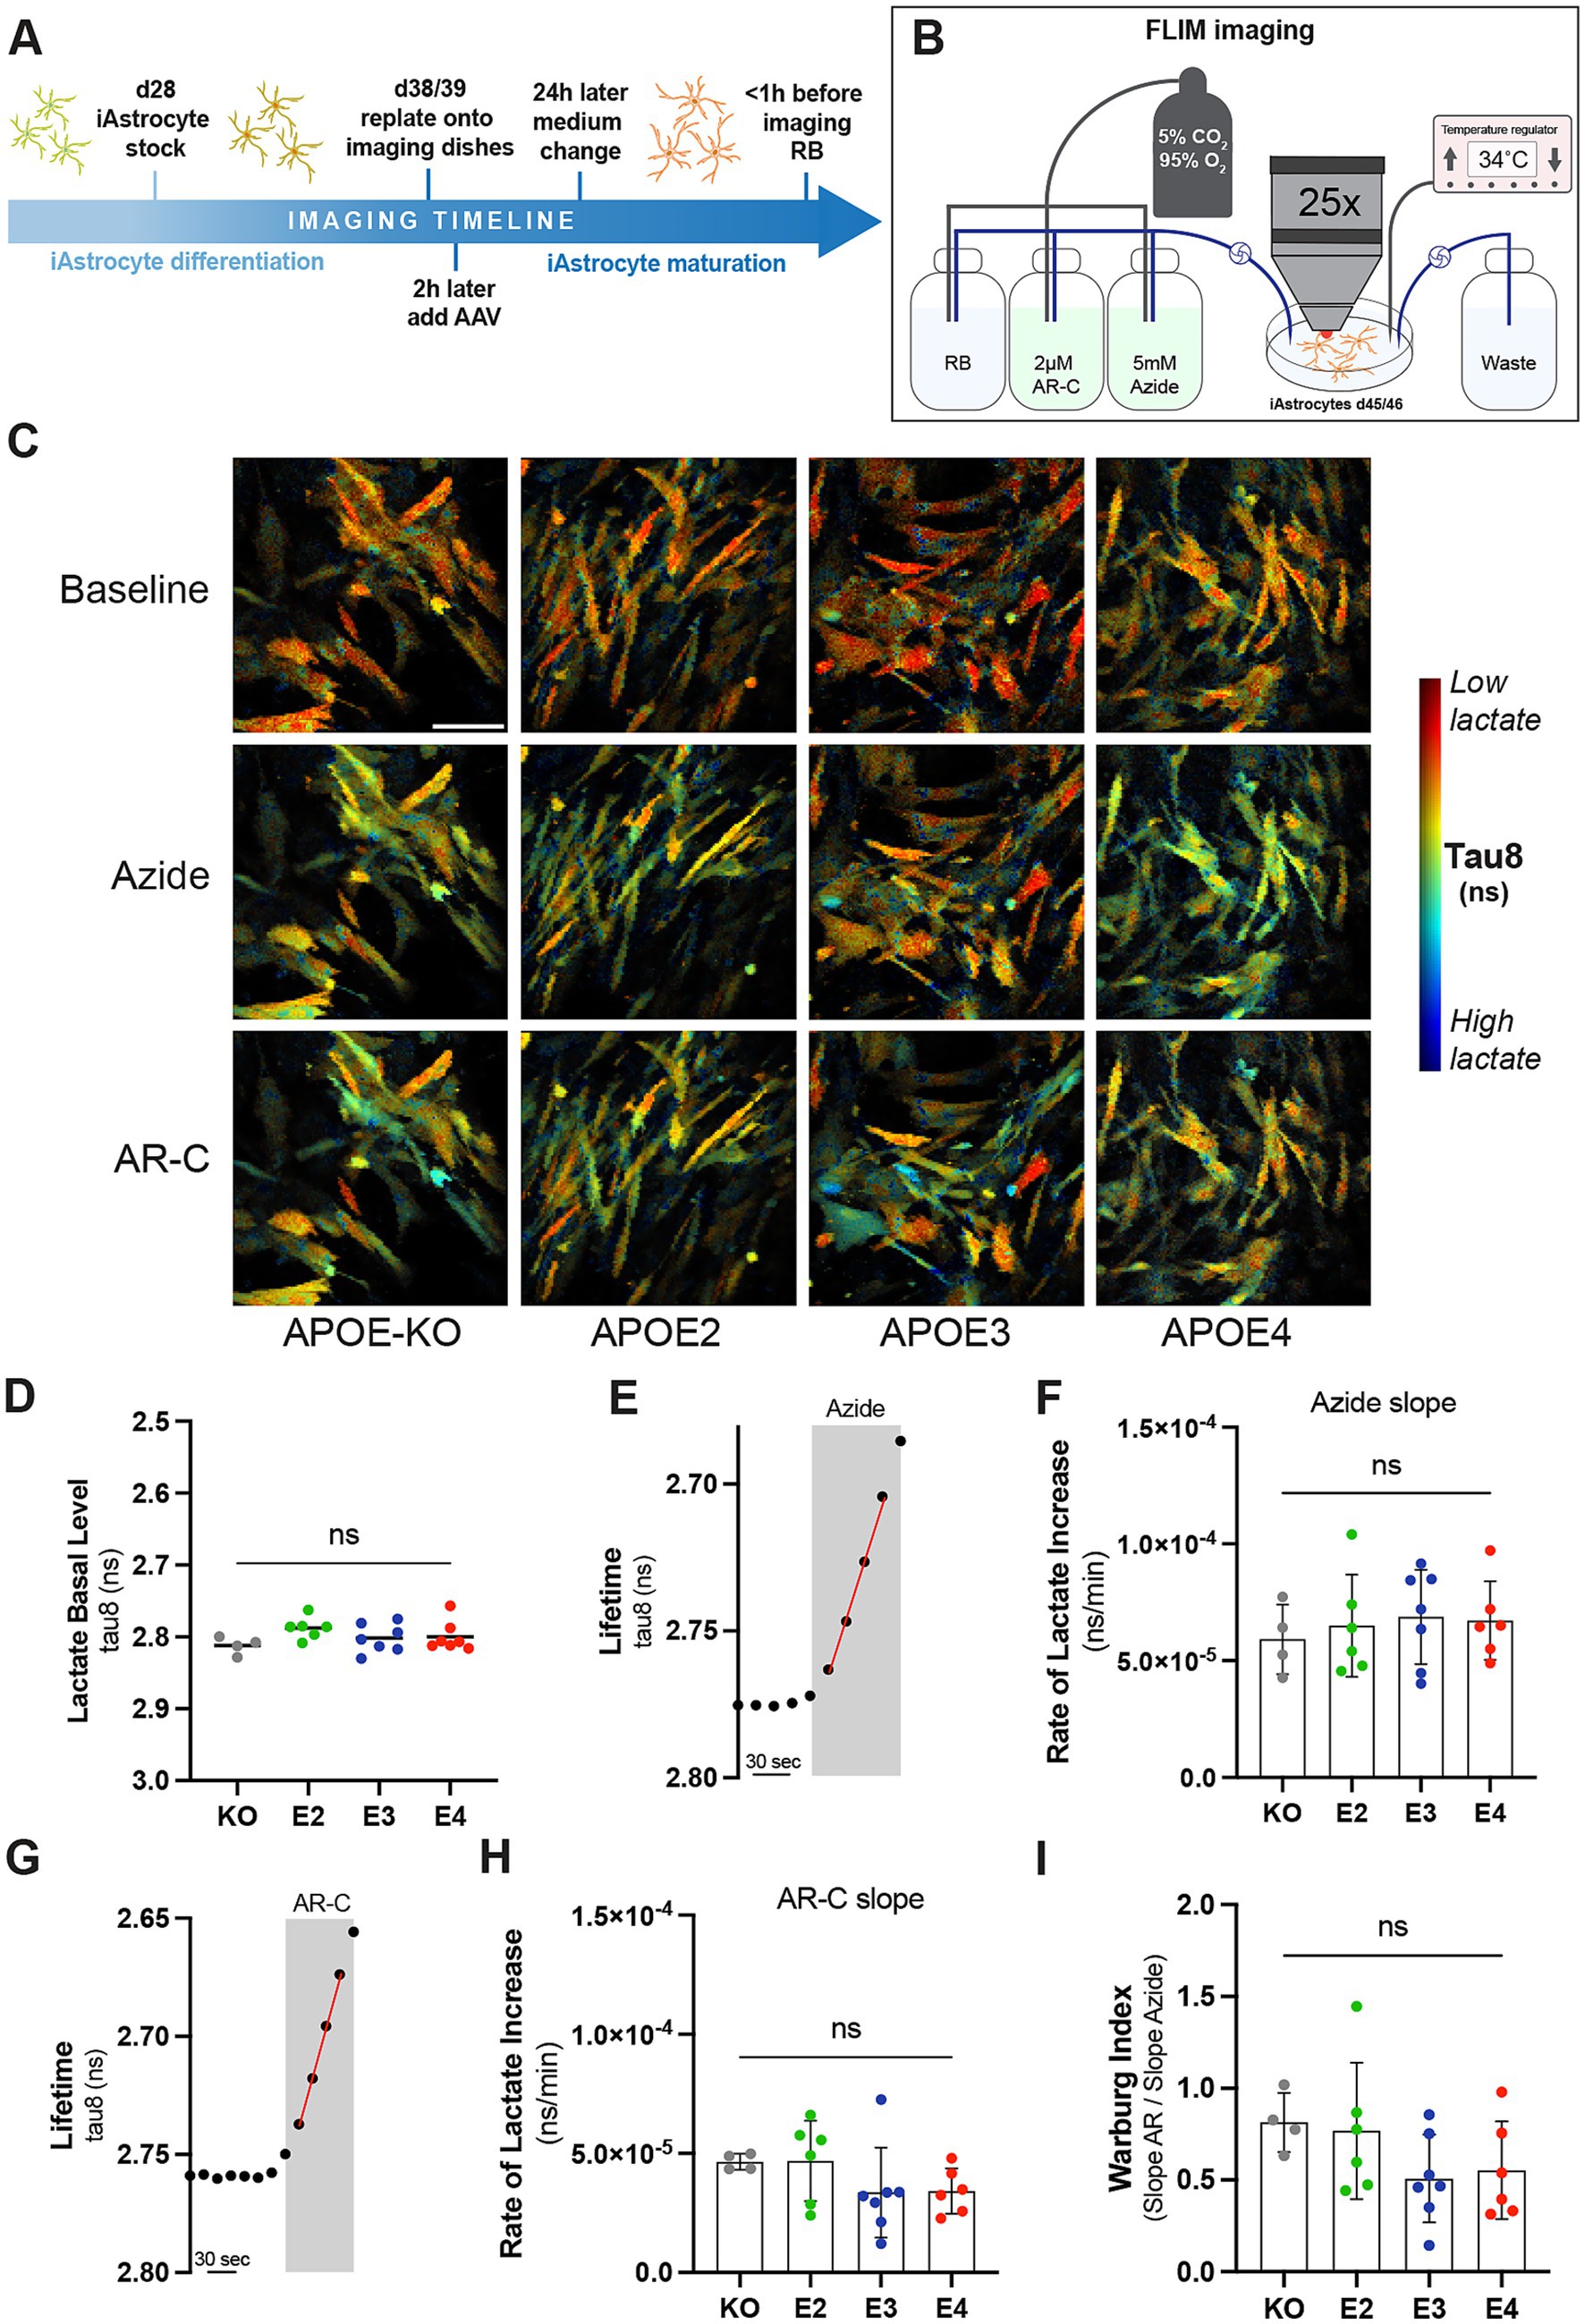
Figure 3. Lactate metabolism in APOE-isogenic iAstrocytes. (A) Timeline of iAstrocytes preparation for FLIM imaging with the genetically-encoded lactate sensor LiLac. (B) Schematic representation of FLIM setup. (C) Representative intensity merged FLIM images in APOE-KO, −E2, −E3 and –E4 isogenic iAstrocytes at baseline and with Azide or AR-C treatment. In blue low tau8 (high lactate) and in red high tau8 (low lactate). Scale bar = 100 μM (D) Quantification of tau8 (ns) for the basal lactate levels. (E) FLIM protocol to measure the lifetime change in response to 5 mM Azide. An example measurement for APOE3 is shown. (F) Azide slop analysis for measuring the rate of intracellular lactate increase (ns/min). (G) FLIM protocol to measure the lifetime change in response to 2 μM AR-C. An example measurement for APOE3 is shown. (H) AR-C slop analysis for measuring the rate of intracellular lactate increase (ns/min). (I) Warburg analysis based on the Azide and AR-C slop analysis. Non-parametric data was analyzed using the Kruskal-Wallis test (multiple comparisons) (H) and parametric data was analyzed using the ordinary one-way ANOVA (multiple comparisons) (D, F, I). FLIM was repeated at least four times independently for each cell line. ns, not significant; RB, Reference buffer.
3.4 APOE4 affects mitochondrial respiration and increases mitochondrial stress
Since APOE4 did not only affect glycolytic function but also decreased mitoATP production, we further assessed how the different APOE genotypes affect oxidative energy metabolism. Therefore, we made use of data previously generated by an unlabeled mass spectrometry-based proteomic screen (de Leeuw et al., 2022). Gene set enrichment analysis (GSEA) of proteomic data showed strong upregulation of pathways involved in OXPHOS as well as mitochondrial structure and function in APOE4 compared to APOE2 and a tendency to downregulation in APOE2 compared to APOE3 (Figures 4A,B; Supplementary Table S1). It should be noted that the APOE-KO line had not been included in the proteomic analysis, thus proteomic data from this line was not available.
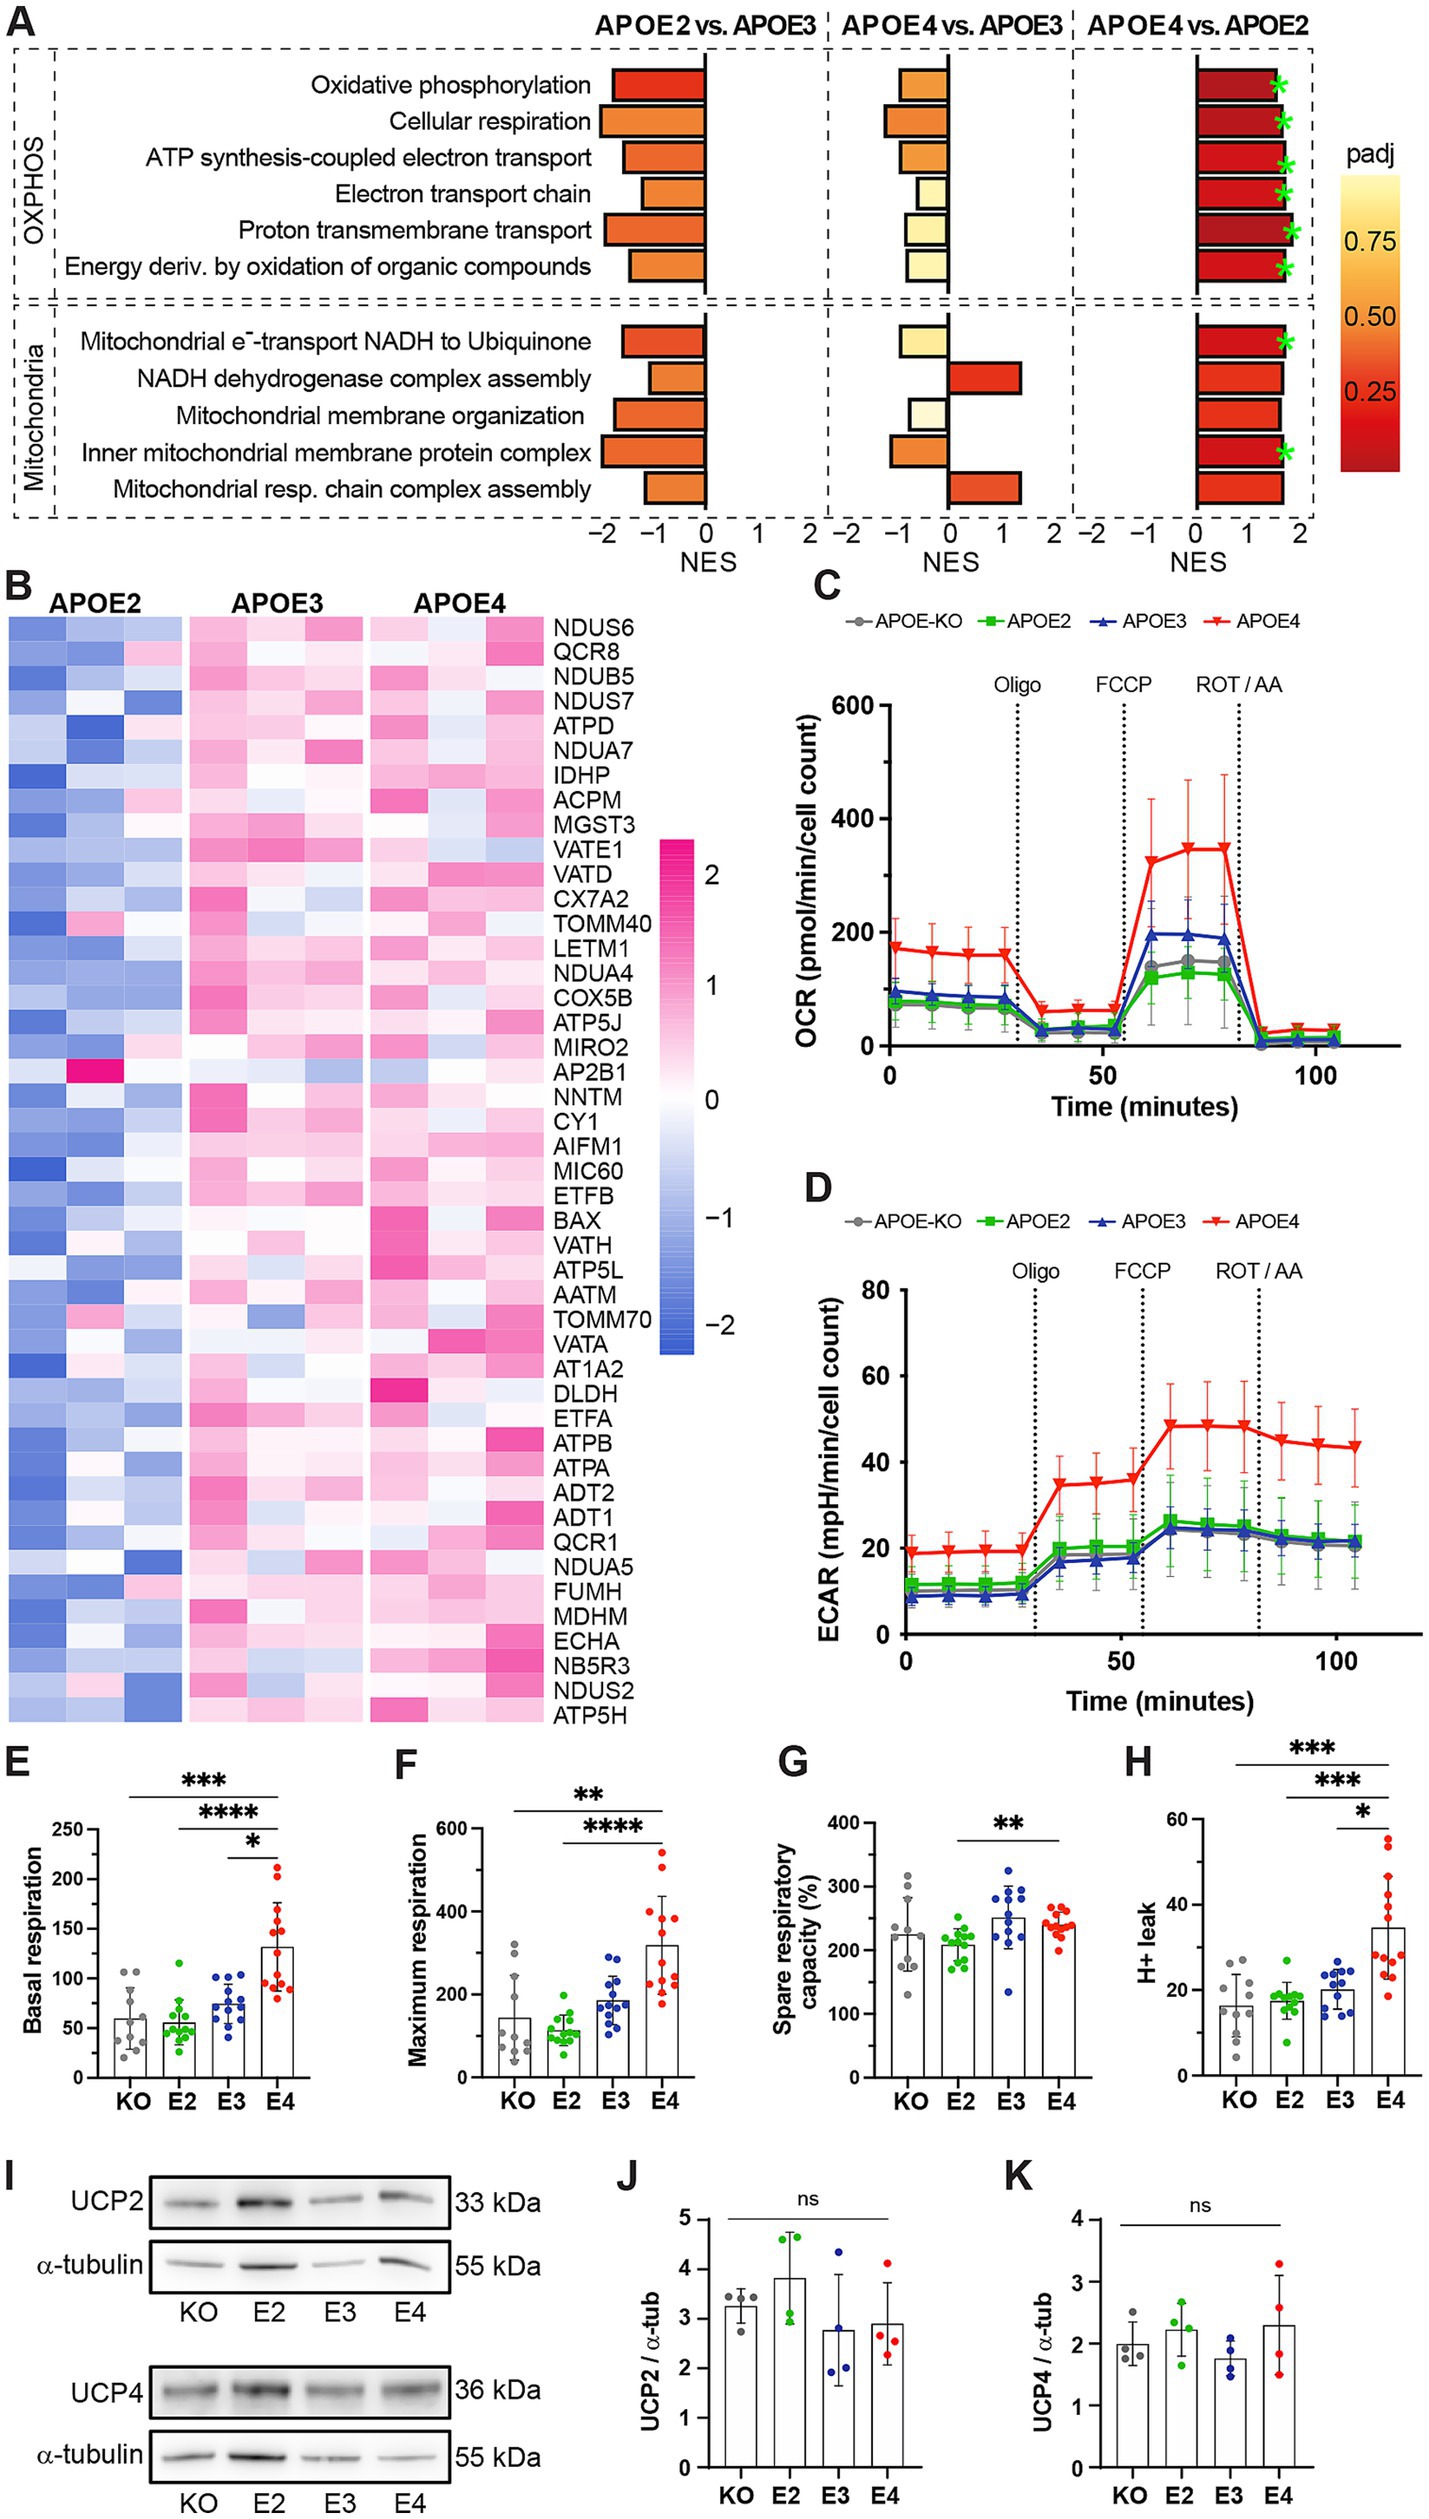
Figure 4. Mitochondrial function in APOE-isogenic iAstrocytes. (A) GSEA normalized enrichment scores (NESs) of proteomic lists ranked according to the t-statistic obtained for the contrast APOE2 versus APOE3, APOE4 versus APOE3, and APOE4 versus APOE2 iAstrocytes. NES is plotted on the x axis, with color-coded bars for the individual gene ontology (GO) terms. Gene sets with adjusted p-values <0.2 are annotated (green stars). (B) Heatmap of log2-transformed expression of individual leading-edge proteins. Z-scores are shown. Corresponding p-values are listed in Supplementary Table S1. (C) OCR and (D) ECAR measurements. APOE-KO in gray, APOE2 in green, APOE3 in blue and APOE4 in red. Oligo: Oligomycin; FCCP: Carbonyl cyanide-4 (trifluoromethoxy) phenylhydrazone; ROT/AA: Rotenone/Antimycin A. (E) Basal respiration, (F) maximal respiration, (G) spare respiratory capacity and (H) proton leak in iAstrocytes. (I) Representative western blot images of UCP2 and UCP4. (J, K) Quantified protein levels of UCP2 and UCP, normalized to α-tubulin. Data was analyzed using the Kruskal-Wallis test (Dunn’s multiple comparisons test) (E, F, H) or one-way ANOVA (Tukey test for multiple comparisons) (G, J, K). Western blots were repeated four times and Mito Stress Test was repeated three times independently. ns = not significant, *p < 0.05, **p < 0.01, ***p < 0.001, ****p < 0.0001.
Efficient energy production relies on maintaining a healthy and functional mitochondrial network, which is regulated by dynamic reshaping events known as fusion and fission (Supplementary Figure S3A). To determine whether these processes are affected by the APOE genotype, proteins associated with mitochondrial fusion and fission were analyzed (Supplementary Figure S3B). No differences in the mitochondrial fusion proteins mitofusin-1/2 (MFN1/2) and optic atrophy-1 (OPA1) were detected between the APOE-isogenic lines (Supplementary Figure S3C–E). However, levels of mitochondrial fission marker mitochondrial fission 1 protein (FIS1) were higher in APOE3 compared to APOE-KO and APOE2 (Supplementary Figure S3F). Another mitochondrial marker, translocase of outer mitochondrial membrane 20 (TOMM20), did not show APOE genotype-specific differences (Supplementary Figures S3G,H).
While ATP production based on mitochondrial respiration was reduced in APOE4 (Figure 1D), proteomic data indicated an increase in pathways related to oxidative phosphorylation (Figure 4A). To further dissect the APOE4 effect on mitochondrial function, basal and maximal respiration as well as mitochondrial capacity and proton leak were analyzed using the Seahorse Mito Stress Test. OCR and ECAR were measured both at baseline and after the addition of Oligomycin, carbonyl cyanide-4 (trifluoromethoxy) phenylhydrazone (FCCP) and ROT/AA (Figures 4C,D). FCCP was used to induce stress, which collapses the proton gradient and disrupts the mitochondrial membrane potential. This disruption allows for unrestricted electron flow through the electron transport chain, ultimately leading to maximum oxygen consumption at complex IV. The OCR values were then used to calculate mitochondrial properties. Basal and maximal respiration was significantly higher in APOE4 iAstrocytes compared to the genotypes (Figures 4E,F), while spare respiration capacity was increased in APOE4 compared to APOE2 (Figure 4G). Further, a significantly elevated proton leak was observed in APOE4 iAstrocytes compared to all other lines (Figure 4H). To determine whether levels of mitochondrial uncoupling protein 2 and 4 (UCP2, UCP4), which are the main UCPs in astrocytes, are affected by APOE, western blots were performed (Figure 4I). No differences in UCP2 and UCP4 levels were found in the APOE isogenic lines (Figures 4J,K). This indicates that APOE4 increases mitochondrial respiration and causes mitochondrial proton leak in the absence of changes in mitochondrial uncoupling proteins.
3.5 APOE genotype-dependent changes in energy metabolism-related pathways
Next, we applied liquid chromatography–mass spectrometry (LC–MS)-based metabolomic analysis of polar metabolites followed by enrichment analysis using MetaboAnalyst 6.0 to compute differentially regulated metabolic pathways in APOE4 iAstrocytes compared to APOE2, APOE3, and APOE-KO (Figure 5; Supplementary Figures S4, S5). It should be noted that the enrichment ratio does not show whether a pathway is specifically enriched in one group over the other but rather indicates that a pathway is perturbed, with some metabolites being up- and others down-regulated due to dynamic regulation of metabolic flux. We specifically looked for pathways involved in cellular energy metabolism. Nine pathways related to glucose and energy metabolism were identified when comparing APOE4 to APOE2 iAstrocytes (Figure 5A), while 7 pathways were identified in APOE4 compared to APOE3 (Figure 5B) and 11 pathways in APOE4 compared to APOE-KO (Figure 5C). Some pathways were only enriched in the comparison of APOE4 to either APOE2, APOE3 or APOE-KO, whereas others, such as the malate–aspartate-shuttle, glycolysis, mitochondrial electron transport chain, Warburg effect or pyruvate metabolism were found in all comparisons. However, the degree of pathway enrichment varied between the lines.
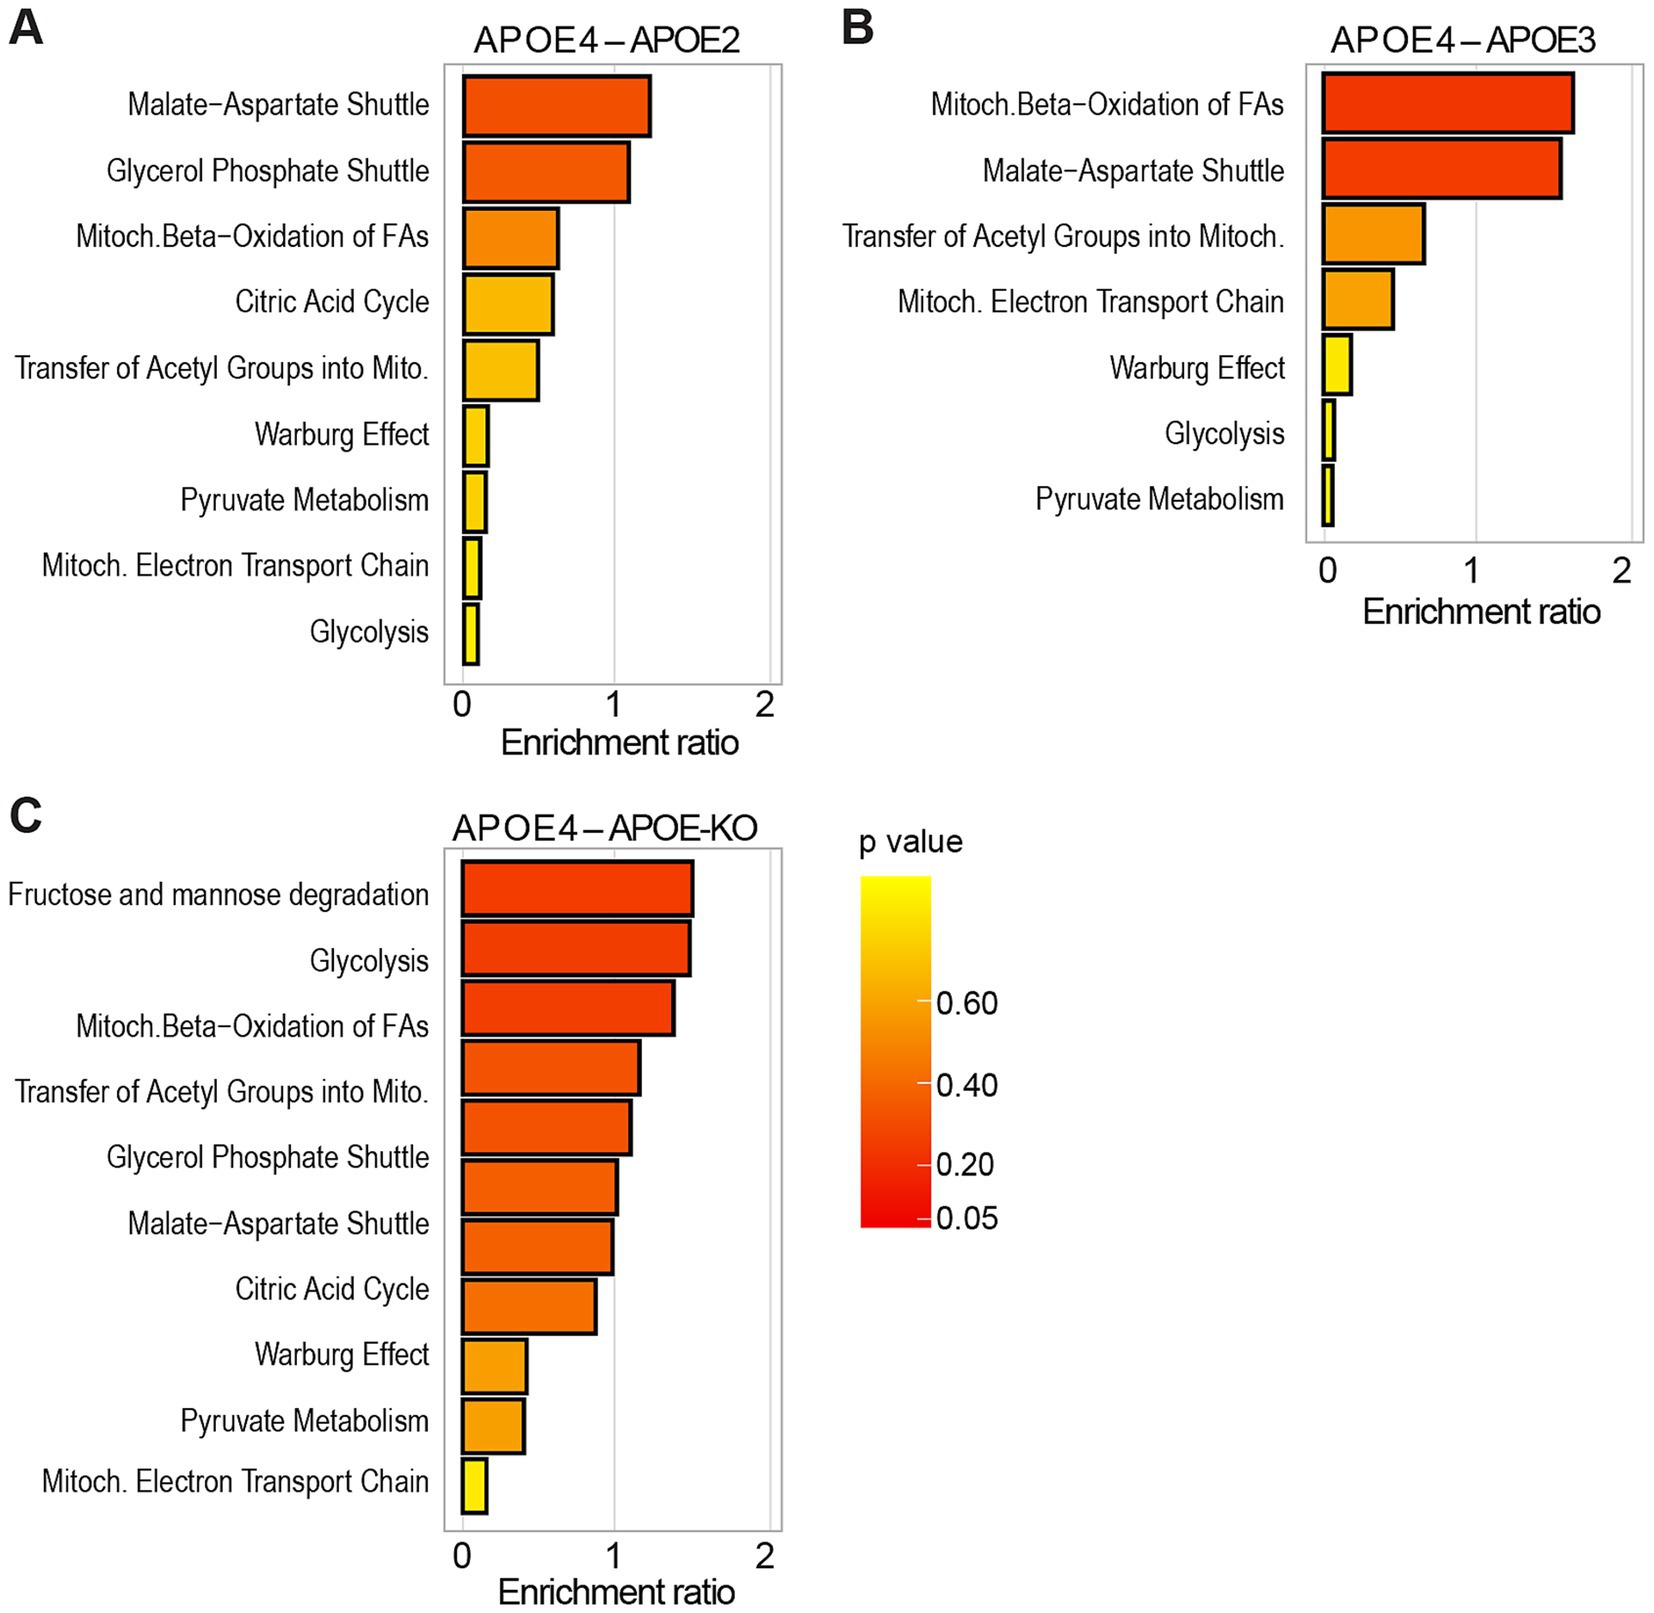
Figure 5. Metabolomic enrichment analysis in APOE-isogenic iAstrocytes. (A–C) Enrichment analysis of glucose and energy metabolism-related pathways, compared between the respective APOE-isogenic iAstrocytes and analyzed using Metaboanalyst 6.0. Pathways are ranked according to the enrichment ratio.
When comparing APOE4 to APOE2, the malate–aspartate shuttle ranked among the top 25 enriched metabolic pathways (Supplementary Figure S5A) and in the APOE4 versus APOE3 comparison mitochondrial beta-oxidation was among the top 25 enriched pathways (Supplementary Figure S5B). In APOE4 compared to APOE-KO, fructose and mannose degradation and glycolysis were found in the top 25 pathways (Supplementary Figure S5C).
In summary, LC–MS-based metabolomic analysis indicates that APOE4 has a major impact on human astrocyte energy metabolism, confirming our observations from proteomic analysis and functional assays.
4 Discussion
AD has been increasingly linked to dysregulated energy metabolism, yet the underlying mechanisms remain unclear. Using APOE-isogenic iPSC-derived astrocytes, we investigated APOE-associated differences in metabolic function. Our model shows AD-relevant proteomic pathways being specifically upregulated in APOE4 astrocytes and downregulated in APOE2 (Supplementary Figure S6), highlighting the biological relevance of this system.
Our data demonstrates that APOE4 expression leads to an increase in both mitochondrial respiration and glycolysis; however, this is accompanied by inefficient ATP production. These results align partially with existing literature, which however presents conflicting findings. While some studies reported reduced glycolysis in APOE4-expressing cells (Wu et al., 2018; Fang et al., 2021; Zhang et al., 2023), others indicated a metabolic shift from oxidative phosphorylation to glycolysis (Sonntag et al., 2017; Williams et al., 2020; Farmer et al., 2021; Lee et al., 2023), with APOE4 astrocytes exhibiting greater glycolytic activity compared to APOE3 astrocytes. Higher oxygen consumption together with an increased glycolysis while having reduced ATP production is a sign of mitochondrial uncoupling. This occurs when the electron transport chain (ETC) continues to consume oxygen and generate a proton gradient, but ATP synthesis is less efficient because protons leak back into the mitochondrial matrix without driving ATP synthase. It leads to increased mitochondrial activity, including higher oxygen consumption as well as to increased glycolysis to compensate for ATP loss, but lower ATP production (Cadenas, 2018; Demine et al., 2019). Increased mitochondrial respiration together with decreased ATP levels can also be induced by treating cells with mitochondrial uncouplers supporting our hypothesis of APOE4 may induce mitochondrial uncoupling (Demine et al., 2019; Shrestha et al., 2021). Recent studies have shown the role of mitochondrial uncoupling proteins (UCPs) in AD. UCP4 levels are significantly reduced in AD brain tissue and the UCP4 variant rs9472817 increases AD risk, especially in APOE4 carriers, suggesting a connection between UCP4 and APOE4 in disease progression (de la Monte and Wands, 2006; Montesanto et al., 2016). Overexpressing UCP4 in astrocytes in AD models prevents mitochondrial dysfunction and improves memory (Rosenberg et al., 2023). Mitochondrial dysfunction and oxidative stress, early features of AD, are linked to UCP4 downregulation due to inflammation (Thangavel et al., 2017). However, we did not observe differences in the expression of UCP2 and UCP4, two major astrocytic UCPs, in APOE4 iAstrocytes. This suggests that mitochondrial uncoupling in APOE4 iAstrocytes occurs independently of UCPs. Uncoupling can also be triggered by other mechanisms such as mitochondrial electron or proton leak that may be caused by mitochondrial damage (Dos Santos et al., 2024). We observed an increased proton leak specifically in APOE4 iAstrocytes, suggesting that mitochondrial membrane alterations may contribute to the observed uncoupling. However, the exact mechanism remains to be determined and requires further investigation.
In our study, we did not observe APOE genotype-dependent changes in key mitochondrial fusion and fission proteins. This is consistent with our previous findings in AD patient-derived cells and APOE-isogenic neurons (Birnbaum et al., 2018; Budny et al., 2024). Additionally, the levels of mitochondrial proteins TOMM20, TOMM40 and TOMM70 were not significantly affected by the APOE, as shown by western blot (TOMM20) and proteomic analysis (TOMM40, TOMM70). This suggests that although mitochondrial function is altered by the APOE genotype, these changes are not driven by alterations in mitochondrial fission / fusion or by differences in mitochondrial mass. However, a more detailed investigation of mitochondrial morphology, including analysis of length and network structure, ideally via electron microscopy or imaging of mitochondrial dyes, is necessary to fully assess potential APOE-dependent alterations in mitochondrial structure and function. This is particularly relevant given the observed proton leak, which may reflect mitochondrial membrane damage and contribute to uncoupling as described above. We show that APOE4 iAstrocytes exhibit lower expression of HK2 but not of HK1 or PKM1, suggesting a specific APOE effect on distinct enzymes rather than a general up/downregulation of glycolytic proteins. The lower HK2 levels in APOE4 iAstrocytes may be attributed to mitochondrial dysfunctions. HK2 is typically associated with the outer mitochondrial membrane (OMM) through its interaction with the outer mitochondrial voltage-dependent anion channel (VDAC; Haloi et al., 2021). Disruption of this interaction, possibly due to changes in mitochondrial membrane potential or metabolic flux, could result in the dissociation of HK2 from the membrane, leading to its downregulation. Notably, VDAC has been considered a potential target for AD, as it plays a crucial role in mitochondrial function and VDAC malfunction can result in impaired energy production, increased oxidative stress and mitochondrial homeostasis disruption (Fang and Maldonado, 2018; Yang et al., 2024). Interestingly, HK1 expression remained unchanged in our model. This may suggest that HK1 is not as significantly impacted by mitochondrial changes in APOE4 iAstrocytes and its expression might remain stable due to its involvement in maintaining basal glycolytic function and supporting alternative pathways like the pentose phosphate pathway (PPP), rather than rapid glycolysis for ATP production. Our findings are consistent with previous studies demonstrating significant differences in HK2 protein expression between APOE4 and APOE2. However, other studies have also reported lower HK2 expression in APOE4 compared to APOE3, a difference we did not observe (Wu et al., 2018; Zhang et al., 2023). This discrepancy may be attributed to the fact that HK2 expression differences between APOE variants become more pronounced with increasing passage numbers (Zhang et al., 2023). Similarly, Fang and colleagues found that the effects of APOE on OCR and ECAR in APOE4 astrocytes were not prominent after 1 month but became evident after 2 months of culture (Fang et al., 2021). Together, these findings suggest a potential metabolic shift in APOE4 astrocytes that intensifies over time, highlighting the importance of the time point of analysis when comparing results.
Further, APOE-KO and APOE2 iAstrocytes showed higher glycoATP production and higher HK2 protein expression not only compared to APOE4 but also to APOE3. A noticeable trend is observed in the glyco/mitoATP production ratio, with glycolytic ATP production being higher in APOE-KO and APOE2 compared to APOE3 and APOE4. This indicates that APOE-KO and APOE2 cells rely more on glycolysis compared to APOE3. The study by Wu and colleagues showed similar findings, as differentiated N2a cells expressing APOE2 exhibited the highest HK expression and glycolytic activity. This suggests that APOE-KO and APOE2 may promote a more robust glycolytic energy profile compared to APOE3 cells (Wu et al., 2018; Zhang et al., 2023).
This study represents the first application of a genetically encoded nanosensor for lactate in APOE-isogenic cells, providing novel insights into intracellular lactate metabolism. Our findings reveal similar basal levels of intracellular lactate across all APOE variants, with no significant differences in lactate accumulation rates or Warburg index between the APOE variants. Notably, our iAstrocytes exhibit a Warburg index comparable to that previously reported (San Martín et al., 2013). These results suggest that mitochondrial dysfunction, as evidenced by the proton leak, may enhance oxygen consumption and overall energy expenditure. However, rather than leading to excessive lactate accumulation, glycolysis appears to be upregulated just enough to maintain metabolic balance. This implies a compensatory mechanism where pyruvate is preferentially directed toward mitochondrial oxidation rather than lactate production, thereby preserving stable intracellular lactate dynamics. Interestingly, APOE3 cells showed reduced glycoATP but no alterations in mitoATP production, respiration or proton leak compared to APOE-KO and APOE2 indicating that more research is needed to explain all APOE genotype dependent alterations in detail.
In contrast to many studies focusing on the comparison of only two APOE genotypes, we used the whole set of APOE isogenic lines and included APOE-KO in addition to APOE2, APOE3 and APOE4. In a previous study from our lab, using the same cells as in this study, we observed differences in the expression levels of the APOE isoforms with APOE2 iAstrocytes showing the highest and APOE4 iAstrocytes the lowest levels of intracellular as well as secreted APOE (de Leeuw et al., 2022). However, the lower protein levels in APOE4 iAstrocytes are not the cause for the metabolic phenotype observed in this cell line. When we compared APOE2, APOE3 and APOE4 iAstrocytes to APOE-KO cells, we observed that APOE-KO cells have a similar phenotype as APOE2 but not as APOE4. This indicates that APOE4 displays a gain-of-function rather than a loss-of-function effect on astrocyte metabolism. This is in agreement with our previous studies, where both APOE-KO iAstrocytes and iN cells showed a similar phenotype to APOE2 but not to APOE4, e.g., in glutamate and Aβ uptake, cholesterol metabolism or inflammatory signaling (de Leeuw et al., 2022; Budny et al., 2024). This is also consistent with the study of Chemparathy and colleagues showing the protective function of APOE loss-of-variants in healthy individuals and AD patients (Chemparathy et al., 2024). Furthermore, in our metabolomic enrichment analysis, more glucose- and energy metabolism-related pathways were perturbed in APOE4 compared to APOE2 and APOE-KO (9 and 11, respectively) than compared to APOE3 (7). This aligns with other findings, including proteomic data and ATP production, showing larger differences between APOE4 and APOE2/APOE-KO than between APOE4 and APOE3.
While APOE is a primarily secreted protein, it has been detected in various subcellular structures and organelles including nucleus and mitochondria (Rueter et al., 2022). Interestingly, APOE4 colocalized stronger with mitochondria than APOE3 in an APOE targeted-replacement astrocyte cell lines. This was accompanied by an increase in MFN1 levels in APOE4 cells (Schmukler et al., 2020). Although we did not observe APOE genotype-specific alterations of MFN1 or other fission and fusion proteins, we cannot exclude that differential mitochondrial or other subcellular localization of APOE2, APOE3 and APOE4 contribute to the observed effects on astrocytic energy metabolism in our study.
5 Conclusion
Our study provides compelling evidence that APOE variants differentially affect human astrocyte energy metabolism at the proteomic, metabolomic and functional level. Specifically, we demonstrate that APOE4 drives metabolic dysregulation in iAstrocytes through a gain-of-function mechanism. Despite exhibiting increased mitochondrial respiration and glycolysis, APOE4 iAstrocytes display reduced ATP production, likely due to mitochondrial dysfunction, as indicated by a significant proton leak. These findings enhance our understanding of AD pathophysiology and highlight potential therapeutic strategies targeting APOE4-driven mitochondrial dysfunction in AD.
Data availability statement
The metabolomic datasets presented in this study can be found in the following online repository: https://massive.ucsd.edu/. Dataset Identifier: MSV000097390.
Ethics statement
Ethical approval was not required for the studies on humans in accordance with the local legislation and institutional requirements because only commercially available established cell lines were used.
Author contributions
VB: Conceptualization, Data curation, Formal analysis, Investigation, Methodology, Validation, Visualization, Writing – original draft, Writing – review & editing. CB: Investigation, Writing – review & editing. KZ: Investigation, Writing – review & editing. MK: Investigation, Writing – review & editing. SL: Methodology, Resources, Writing – review & editing. RW: Data curation, Formal analysis, Visualization, Writing – review & editing. RR: Data curation, Formal analysis, Visualization, Writing – review & editing. LR: Formal analysis, Methodology, Software, Writing – review & editing. IR: Methodology, Writing – review & editing. LB: Methodology, Writing – review & editing. BW: Resources, Writing – review & editing. CT: Conceptualization, Data curation, Formal analysis, Funding acquisition, Methodology, Project administration, Resources, Supervision, Validation, Visualization, Writing – original draft, Writing – review & editing.
Funding
The author(s) declare that financial support was received for the research and/or publication of this article. CT and VB: Dr. Wilhelm Hurka Foundation, Hartmann Müller-Foundation, University of Zurich Graduate Campus, Betty and David Koetser Foundation for Brain Research, Neuroscience Center Zurich. LB: Fondecyt-ANID 1230145. IR: Fondecyt-ANID 1230682.
Acknowledgments
We appreciate the support of Alaa Othman and Martina Zanella from the Functional Genomics Center Zurich in metabolomics analysis.
Conflict of interest
The authors declare that the research was conducted in the absence of any commercial or financial relationships that could be construed as a potential conflict of interest.
Generative AI statement
The author(s) declare that no Gen AI was used in the creation of this manuscript.
Any alternative text (alt text) provided alongside figures in this article has been generated by Frontiers with the support of artificial intelligence and reasonable efforts have been made to ensure accuracy, including review by the authors wherever possible. If you identify any issues, please contact us.
Publisher’s note
All claims expressed in this article are solely those of the authors and do not necessarily represent those of their affiliated organizations, or those of the publisher, the editors and the reviewers. Any product that may be evaluated in this article, or claim that may be made by its manufacturer, is not guaranteed or endorsed by the publisher.
Supplementary material
The Supplementary material for this article can be found online at: https://www.frontiersin.org/articles/10.3389/fncel.2025.1603657/full#supplementary-material
Footnotes
References
An, Y., Varma, V. R., Varma, S., Casanova, R., Dammer, E., Pletnikova, O., et al. (2018). Evidence for brain glucose dysregulation in Alzheimer’s disease. Alzheimers Dement. 14, 318–329. doi: 10.1016/j.jalz.2017.09.011
Belloy, M. E., Andrews, S. J., Le Guen, Y., Cuccaro, M., Farrer, L. A., Napolioni, V., et al. (2023). APOE genotype and Alzheimer disease risk across age, sex, and population ancestry. JAMA Neurol. 80, 1284–1294. doi: 10.1001/jamaneurol.2023.3599
Birnbaum, J. H., Wanner, D., Gietl, A. F., Saake, A., Hock, C., Nitsch, R. M., et al. (2018). Oxidative stress and altered mitochondrial protein expression in the absence of amyloid-beta and tau pathology in iPSC-derived neurons from sporadic Alzheimer’s disease patients. Stem Cell Res. 27, 121–130. doi: 10.1016/j.scr.2018.01.019
Blumenfeld, J., Yip, O., Kim, M. J., and Huang, Y. (2024). Cell type-specific roles of APOE4 in Alzheimer disease. Nat. Rev. Neurosci. 25, 91–110. doi: 10.1038/s41583-023-00776-9
Budny, V., Knöpfli, Y., Meier, D., Zürcher, K., Bodenmann, C., Peter, S. L., et al. (2024). APOE4 increases energy metabolism in APOE-isogenic iPSC-derived neurons. celss. 13, 1207. doi: 10.3390/cells13141207
Cadenas, S. (2018). Mitochondrial uncoupling, ROS generation and cardioprotection. Biochim. Biophys. Acta Bioenerg. 1859, 940–950. doi: 10.1016/j.bbabio.2018.05.019
Chemparathy, A., Le Guen, Y., Chen, S., Lee, E.-G., Leong, L., Gorzynski, J. E., et al. (2024). APOE loss-of-function variants: compatible with longevity and associated with resistance to Alzheimer’s disease pathology. Neuron 112, 1110–1116.e5. doi: 10.1016/j.neuron.2024.01.008
Corder, E. H., Saunders, A. M., Risch, N. J., Strittmatter, W. J., Schmechel, D. E., Gaskell, P. C., et al. (1994). Protective effect of apolipoprotein E type 2 allele for late onset Alzheimer disease. Nat. Genet. 7, 180–184. doi: 10.1038/ng0694-180
Corder, E. H., Saunders, A. M., Strittmatter, W. J., Schmechel, D. E., Gaskell, P. C., Small, G. W., et al. (1993). Gene dose of Apolipoprotein E type 4 allele and the risk of Alzheimer’s disease in late onset families. Science 261, 921–923.
Corneveaux, J. J., Myers, A. J., Allen, A. N., Pruzin, J. J., Ramirez, M., Engel, A., et al. (2010). Association of CR1, CLU and PICALM with Alzheimer’s disease in a cohort of clinically characterized and neuropathologically verified individuals. Hum. Mol. Genet. 19, 3295–3301. doi: 10.1093/hmg/ddq221
de Leeuw, S. M., Kirschner, A. W. T., Lindner, K., Rust, R., Budny, V., Wolski, W. E., et al. (2022). APOE2, E3, and E4 differentially modulate cellular homeostasis, cholesterol metabolism, and inflammatory response in isogenic iPSC-derived astrocytes. Stem Cell Rep 17, 110–126. doi: 10.1016/j.stemcr.2021.11.007
de la Monte, S. M., and Wands, J. R. (2006). Molecular indices of oxidative stress and mitochondrial dysfunction occur early and often progress with severity of Alzheimer’s disease. J Alzheimers Dis 9, 167–181. doi: 10.3233/jad-2006-9209
de Leeuw, S. M., and Tackenberg, C. (2019). Alzheimer’s in a dish – induced pluripotent stem cell-based disease modeling. Translational Neurodegeneration 8:21. doi: 10.1186/s40035-019-0161-0
Demine, S., Renard, P., and Arnould, T. (2019). Mitochondrial uncoupling: a key controller of biological processes in physiology and diseases. Cells 8:795. doi: 10.3390/cells8080795
Dos Santos, B. G., Brisnovali, N. F., and Goedeke, L. (2024). Biochemical basis and therapeutic potential of mitochondrial uncoupling in cardiometabolic syndrome. Biochem. J. 481, 1831–1854. doi: 10.1042/BCJ20240005
Evans, S., Dowell, N. G., Tabet, N., King, S. L., Hutton, S. B., and Rusted, J. M. (2017). Disrupted neural activity patterns to novelty and effort in young adult APOE-e4 carriers performing a subsequent memory task. Brain Behav. 7:e00612. doi: 10.1002/brb3.612
Fang, D., and Maldonado, E. N. (2018). VDAC regulation: a mitochondrial target to stop cell proliferation. Adv. Cancer Res. 138, 41–69. doi: 10.1016/bs.acr.2018.02.002
Fang, W., Xiao, N., Zeng, G., Bi, D., Dai, X., Mi, X., et al. (2021). APOE4 genotype exacerbates the depression-like behavior of mice during aging through ATP decline. Transl. Psychiatry 11:507. doi: 10.1038/s41398-021-01631-0
Farmer, B. C., Williams, H. C., Devanney, N. A., Piron, M. A., Nation, G. K., Carter, D. J., et al. (2021). APOΕ4 lowers energy expenditure in females and impairs glucose oxidation by increasing flux through aerobic glycolysis. Mol. Neurodegener. 16:62. doi: 10.1186/s13024-021-00483-y
Farrer, L. A., Cupples, L. A., Haines, J. L., Hyman, B., Kukull, W. A., Mayeux, R., et al. (1997). Effects of age, sex, and ethnicity on the association between apolipoprotein E genotype and Alzheimer disease. A meta-analysis. APOE and Alzheimer disease Meta analysis consortium. JAMA 278, 1349–1356.
Filippini, N., MacIntosh, B. J., Hough, M. G., Goodwin, G. M., Frisoni, G. B., Smith, S. M., et al. (2009). Distinct patterns of brain activity in young carriers of the APOE-epsilon4 allele. Proc. Natl. Acad. Sci. USA 106, 7209–7214. doi: 10.1073/pnas.0811879106
Foster, N. L., Heidebrink, J. L., Clark, C. M., Jagust, W. J., Arnold, S. E., Barbas, N. R., et al. (2007). FDG-PET improves accuracy in distinguishing frontotemporal dementia and Alzheimer’s disease. Brain 130, 2616–2635. doi: 10.1093/brain/awm177
Grupe, A., Abraham, R., Li, Y., Rowland, C., Hollingworth, P., Morgan, A., et al. (2007). Evidence for novel susceptibility genes for late-onset Alzheimer’s disease from a genome-wide association study of putative functional variants. Hum. Mol. Genet. 16, 865–873. doi: 10.1093/hmg/ddm031
Haloi, N., Wen, P.-C., Cheng, Q., Yang, M., Natarajan, G., Camara, A. K. S., et al. (2021). Structural basis of complex formation between mitochondrial anion channel VDAC1 and hexokinase-II. Commun Biol 4:667. doi: 10.1038/s42003-021-02205-y
Kassis, T., Perez, P. M., Yang, C. J. W., Soenksen, L. R., Trumper, D. L., Griffith, L. G., et al. (2018). PiFlow: a biocompatible low-cost programmable dynamic flow pumping system utilizing a raspberry pi zero and commercial piezoelectric pumps. HardwareX 4:e00034. doi: 10.1016/j.ohx.2018.e00034
Koveal, D., Rosen, P. C., Meyer, D. J., Díaz-García, C. M., Wang, Y., Cai, L.-H., et al. (2022). A high-throughput multiparameter screen for accelerated development and optimization of soluble genetically encoded fluorescent biosensors. Nat. Commun. 13:2919. doi: 10.1038/s41467-022-30685-x
Lee, H., Cho, S., Kim, M.-J., Park, Y. J., Cho, E., Jo, Y. S., et al. (2023). ApoE4-dependent lysosomal cholesterol accumulation impairs mitochondrial homeostasis and oxidative phosphorylation in human astrocytes. Cell Rep. 42:113183. doi: 10.1016/j.celrep.2023.113183
Mayrhofer, J. M., Haiss, F., Haenni, D., Weber, S., Zuend, M., Barrett, M. J. P., et al. (2015). Design and performance of an ultra-flexible two-photon microscope for in vivo research. Biomed. Opt. Express 6, 4228–4237. doi: 10.1364/BOE.6.004228
Montesanto, A., Crocco, P., Anfossi, M., Smirne, N., Puccio, G., Colao, R., et al. (2016). The Genetic Variability of UCP4 Affects the Individual Susceptibility to Late-Onset Alzheimer’s Disease and Modifies the Disease’s Risk in APOE-ɛ4 Carriers. J Alzheimers Dis 51, 1265–1274. doi: 10.3233/JAD-150993
Nuriel, T., Angulo, S. L., Khan, U., Ashok, A., Chen, Q., Figueroa, H. Y., et al. (2017). Neuronal hyperactivity due to loss of inhibitory tone in APOE4 mice lacking Alzheimer’s disease-like pathology. Nat. Commun. 8:1464. doi: 10.1038/s41467-017-01444-0
Pang, Z., Lu, Y., Zhou, G., Hui, F., Xu, L., Viau, C., et al. (2024). MetaboAnalyst 6.0: towards a unified platform for metabolomics data processing, analysis and interpretation. Nucleic Acids Res. 52, W398–W406. doi: 10.1093/nar/gkae253
Reiman, E. M., Arboleda-Velasquez, J. F., Quiroz, Y. T., Huentelman, M. J., Beach, T. G., Caselli, R. J., et al. (2020). Exceptionally low likelihood of Alzheimer’s dementia in APOE2 homozygotes from a 5,000-person neuropathological study. Nat. Commun. 11:667. doi: 10.1038/s41467-019-14279-8
Reiman, E. M., Caselli, R. J., Yun, L. S., Chen, K., Bandy, D., Minoshima, S., et al. (1996). Preclinical evidence of Alzheimer’s disease in persons homozygous for the epsilon 4 allele for apolipoprotein E. N. Engl. J. Med. 334, 752–758.
Rosenberg, N., Reva, M., Binda, F., Restivo, L., Depierre, P., Puyal, J., et al. (2023). Overexpression of UCP4 in astrocytic mitochondria prevents multilevel dysfunctions in a mouse model of Alzheimer’s disease. Glia 71, 957–973. doi: 10.1002/glia.24317
Rueter, J., Rimbach, G., and Huebbe, P. (2022). Functional diversity of apolipoprotein E: from subcellular localization to mitochondrial function. Cell. Mol. Life Sci. 79:499. doi: 10.1007/s00018-022-04516-7
San Martín, A., Ceballo, S., Ruminot, I., Lerchundi, R., Frommer, W. B., and Barros, L. F. (2013). A genetically encoded FRET lactate sensor and its use to detect the Warburg effect in single cancer cells. PLoS One 8:e57712. doi: 10.1371/journal.pone.0057712
Schmid, B., Prehn, K. R., Nimsanor, N., Garcia, B. I. A., Poulsen, U., Jørring, I., et al. (2019). Generation of a set of isogenic, gene-edited iPSC lines homozygous for all main APOE variants and an APOE knock-out line. Stem Cell Res. 34:101349. doi: 10.1016/j.scr.2018.11.010
Schmid, B., Prehn, K. R., Nimsanor, N., Garcia, B. I. A., Poulsen, U., Jørring, I., et al. (2020). Corrigendum to “generation of a set of isogenic, gene-edited iPSC lines homozygous for all main APOE variants and an APOE knock-out line”. Stem Cell Res. 48:102005. doi: 10.1016/j.scr.2020.102005
Schmukler, E., Solomon, S., Simonovitch, S., Goldshmit, Y., Wolfson, E., Michaelson, D. M., et al. (2020). Altered mitochondrial dynamics and function in APOE4-expressing astrocytes. Cell Death Dis. 11:578. doi: 10.1038/s41419-020-02776-4
Shrestha, R., Johnson, E., and Byrne, F. L. (2021). Exploring the therapeutic potential of mitochondrial uncouplers in cancer. Mol Metab 51:101222. doi: 10.1016/j.molmet.2021.101222
Sonntag, K. C., Ryu, W. I., Amirault, K. M., Healy, R. A., Siegel, A. J., McPhie, D. L., et al. (2017). Late-onset Alzheimer’s disease is associated with inherent changes in bioenergetics profiles. Sci. Rep. 7:14038. doi: 10.1038/s41598-017-14420-x
Tanzi, R. E. (2012). The genetics of Alzheimer disease. Cold Spring Harb. Perspect. Med. 2:296. doi: 10.1101/cshperspect.a006296
Thangavel, R., Kempuraj, D., Zaheer, S., Raikwar, S., Ahmed, M. E., Selvakumar, G. P., et al. (2017). Glia maturation factor and mitochondrial uncoupling proteins 2 and 4 expression in the temporal cortex of Alzheimer’s disease brain. Front. Aging Neurosci. 9:150. doi: 10.3389/fnagi.2017.00150
Velasquez Moros, F., Amiet, D., Meister, R. M., Faber-Castell, A.von, Wyss, M., Saab, A. S., et al. (2025). A low-cost FPGA-based approach for pile-up corrected high-speed in vivo FLIM imaging. Neurophoton. 12:025009. doi: 10.1117/1.NPh.12.2.025009
Venzi, M., Tóth, M., Häggkvist, J., Bogstedt, A., Rachalski, A., Mattsson, A., et al. (2017). Differential effect of APOE alleles on brain glucose metabolism in targeted replacement mice: An [18F]FDG-μPET study. J Alzheimers Dis Rep 1, 169–180. doi: 10.3233/ADR-170006
Warren, S. C., Margineanu, A., Alibhai, D., Kelly, D. J., Talbot, C., Alexandrov, Y., et al. (2013). Rapid global fitting of large fluorescence lifetime imaging microscopy datasets. PLoS One 8:e70687. doi: 10.1371/journal.pone.0070687
Williams, H. C., Farmer, B. C., Piron, M. A., Walsh, A. E., Bruntz, R. C., Gentry, M. S., et al. (2020). APOE alters glucose flux through central carbon pathways in astrocytes. Neurobiol. Dis. 136:104742. doi: 10.1016/j.nbd.2020.104742
Wu, L., Zhang, X., and Zhao, L. (2018). Human ApoE isoforms differentially modulate brain glucose and ketone body metabolism: implications for Alzheimer’s disease risk reduction and early intervention. J. Neurosci. 38, 6665–6681. doi: 10.1523/jneurosci.2262-17.2018
Yang, Y., Jia, X., Yang, X., Wang, J., Fang, Y., Ying, X., et al. (2024). Targeting VDAC: a potential therapeutic approach for mitochondrial dysfunction in Alzheimer’s disease. Brain Res. 1835:148920. doi: 10.1016/j.brainres.2024.148920
Keywords: apolipoprotein E (APOE), Alzheimer’s disease (AD), induced pluripotent stem cells (iPSCs), human astrocytes, energy metabolism, glycolysis, mitochondrial function, mitochondrial uncoupling
Citation: Budny V, Bodenmann C, Zürcher KJ, Krüger M, de Leeuw SM, Weber RZ, Rust R, Ravotto L, Ruminot I, Barros LF, Weber B and Tackenberg C (2025) APOE genotype-dependent differences in human astrocytic energy metabolism. Front. Cell. Neurosci. 19:1603657. doi: 10.3389/fncel.2025.1603657
Edited by:
Francesca Boscia, University of Naples Federico II, ItalyReviewed by:
Priya Prakash, New York University, United StatesJae Hoon Sul, Sungkyunkwan University, Republic of Korea
Copyright © 2025 Budny, Bodenmann, Zürcher, Krüger, de Leeuw, Weber, Rust, Ravotto, Ruminot, Barros, Weber and Tackenberg. This is an open-access article distributed under the terms of the Creative Commons Attribution License (CC BY). The use, distribution or reproduction in other forums is permitted, provided the original author(s) and the copyright owner(s) are credited and that the original publication in this journal is cited, in accordance with accepted academic practice. No use, distribution or reproduction is permitted which does not comply with these terms.
*Correspondence: Christian Tackenberg, Y2hyaXN0aWFuLnRhY2tlbmJlcmdAaXJlbS51emguY2g=