 Kamonrapat Sompub
 Norihisa Bizen1*
 Hirohide Takebayashi
- 1Division of Neurobiology and Anatomy, Graduate School of Medical and Dental Sciences, Niigata University, Niigata, Japan
- 2UNC Lineberger Comprehensive Cancer, University of North Carolina at Chapel Hill, Chapel Hill, NC, United States
- 3Department of Biology, University of North Carolina at Chapel Hill, NC, United States
- 4Center for Coordination of Research Facilities (CCRF), Niigata University, Niigata, Japan
- 5Center for Anatomical Studies, Graduate School of Medicine, Kyoto University, Kyoto, Japan
The NF-κB signaling pathway responds to a diverse range of cytokines and extracellular stresses, regulating immune responses, inflammation, cell proliferation, and cell death. However, the requirement of NF-κB in oligodendrocyte development and differentiation remains debatable. In this study, we generated conditional knockout mice of the RelA gene in the oligodendrocyte-lineage cells, which encodes a major subunit of NF-κB, and assessed its impact on oligodendrocyte differentiation. In RelA cKO mice, we observed a transient delay of oligodendrocyte differentiation in the postnatal cerebral cortex, albeit in a spatially and temporally restricted manner. Similarly, in the primary cultured oligodendrocyte differentiation model, the loss of RelA resulted in impaired terminal differentiation. Transcriptome analysis revealed a significant downregulation of numerous oligodendrocyte-related genes, including predicted NF-κB target genes. Furthermore, a comprehensive splicing analysis identified aberrant alternative splicing of Plp1, a most abundant and key gene involved in myelin sheath formation. These findings suggest that NF-κB/RelA contributes to the temporal and special control of oligodendrocyte development and differentiation in the postnatal brains. Our results highlight a previously underappreciated role of NF-κB in oligodendrocyte biology and encourage a re-evaluation of its physiological significance in the glial lineage.
1 Introduction
Oligodendrocytes are a type of glial cell in the central nervous system (CNS) that generate myelin sheaths around axons, thereby enabling saltatory conduction and contributing to axonal protection and metabolic support (Nave, 2010; Lee et al., 2012; Mot et al., 2018). Oligodendrocytes originate from neural stem cells through the generation of oligodendrocyte precursor cells (OPCs), which subsequently undergo a series of well-coordinated steps involving differentiation and maturation to become myelinating oligodendrocytes eventually (Rowitch and Kriegstein, 2010; Takebayashi and Ikenaka, 2015). This developmental process is governed by a complex interplay of intrinsic and extrinsic factors, including transcription factors, epigenetic regulators, and various signaling molecules (He and Lu, 2013; Zuchero and Barres, 2013; Bercury and Macklin, 2015; Elbaz and Popko, 2019).
Nuclear factor kappa B (NF-κB) is a family of protein complexes that function as transcription factors, regulating the expression of genes involved in various biological processes, including immune responses, inflammation, cell proliferation, development, and carcinogenesis (Baldwin, 2001; Dolcet et al., 2005). The NF-κB family consists of five subunits—p50, p52, RelA (p65), RelB, and c–Rel—which form homo- and heterodimers to exert their transcriptional activity (Karin and Lin, 2002; Yan and Greer, 2008). In its inactive state, NF–κB is sequestered in the cytoplasm by inhibitor proteins known as Inhibitor of Kappa B (IκB), which prevent its activation (Steinbrecher et al., 2008). Upon external stimuli such as cytokines, pathogens, or cellular stress, the IκB kinase (IKK) complex phosphorylates IκB, leading to its ubiquitin-dependent degradation. This degradation releases NF–κB, allowing it to translocate into the nucleus and activate the transcription of target genes. NF–κB signaling is a fundamental intracellular signaling pathway that plays a central role in regulating systemic inflammatory responses. The function of NF–κB in pathological conditions has been extensively studied across various tissues and cell types. However, its physiological roles in development, homeostasis, and normal cellular function remain poorly understood.
In the CNS, the physiological significance of NF–κB signaling in development and maturation has been reported in various neural cell types. In embryonic mouse brains, NF–κB signaling is suggested to contribute to maintaining neural progenitor cells in an undifferentiated state (Yamanishi et al., 2015). In the postnatal brain, NF-κB promotes dendritic spine formation and excitatory synapse development (Boersma et al., 2011). In astrocytes, NF-κB has been implicated in the central regulation of metabolism, including glucose homeostasis, blood pressure, and body weight control (Zhang et al., 2017). Furthermore, in microglia, NF-κB signaling plays a crucial role in maintaining neuronal excitability and synaptic plasticity (Kyrargyri et al., 2015). In contrast, the involvement of NF-κB signaling in oligodendrocyte development and differentiation remains debatable. Clinical studies have reported that patients with increased copy numbers of IKBKG gene, which encodes NF-κB essential modulator (NEMO), exhibit reduced NF-κB signaling, accompanied by abnormal myelination, morphological abnormalities in the developing brain, and mild intellectual disability (Philippe et al., 2013). However, analyses using mouse models deficient in key NF–κB components have suggested that NF–κB signaling does not impact on oligodendrocyte differentiation. For instance, mice with CNS–specific deletion of RelA, a major NF-κB subunit, do not exhibit significant abnormalities in oligodendrocyte numbers or myelin structure (Kretz et al., 2014). Similarly, the loss of IκB kinase beta (IKKβ), a key activator of NF-κB signaling, has no effects on oligodendrocyte development and differentiation (Raasch et al., 2011).
A critical limitation of many previous studies is the predominant use of conventional knockout mice or conditional knockout mice employing the Nestin-Cre system (Tronche et al., 1999), which result in the deletion of NF–κB signaling across all CNS cell types from early embryonic stages. This widespread deletion makes it difficult to evaluate the cell-autonomous role of NF–κB signaling, specifically in oligodendrocytes. Therefore, further studies using oligodendrocyte-specific gene deletion models are necessary to elucidate the precise role of NF-κB signaling in oligodendrocyte differentiation.
In this study, we generated a mouse model in which the RelA gene was specifically deleted in oligodendrocyte lineage cells and performed a detailed phenotypic analysis. In RelA-deficient mice, oligodendrocyte differentiation in the cerebral cortex was delayed at postnatal day 14 (P14); however, this delay was largely resolved by P21. Furthermore, in an in vitro oligodendrocyte culture system, RelA deficiency resulted in cell-autonomous inhibition of oligodendrocyte differentiation. Transcriptome analysis revealed that in RelA-deficient mice, the expression of oligodendrocyte-associated genes predicted to be direct targets of RelA was significantly downregulated. Additionally, splicing alterations of the proteolipid protein 1 (Plp1) gene, which encodes a major myelin protein, were detected. These findings suggest that RelA plays a limited but critical role in regulating the timing of oligodendrocyte differentiation and may also contribute to oligodendrocyte maturation through transcriptional regulation and alternative splicing.
2 Materials and methods
2.1 Animals
We used Cnp-iCre knockin mice (MGI:6865676; Bizen et al., 2022) and RelAflox/flox mice (MGI:3775205; Steinbrecher et al., 2008). We generated conditional knockout (cKO) mice by crossing female Cnp-iCre; RelAflox+ mice with male RelAflox/flox mice. Unless otherwise specified, RelAflox/flox or RelAflox/+ mice were used as control animals. The day of birth was designated as postnatal day zero (P0). Male and female mice aged P14 and P21 were used. The mice were kept at 22°C ± 2°C and 60% humidity in a 12–h light/12–h dark cycle with ad libitum feeding. The Animal Research Committees of Niigata University approved all methods, and the Guide for the Care and Use of Laboratory Animals of the Institute for Laboratory Animal Research was followed.
2.2 Genotyping
Mice were genotyped by polymerase chain reaction (PCR) using primers that amplifies the RelAflox allele and Cnp-iCre allele. The RelAflox and RelAwt alleles was detected using the primers RelA-loxF; 5′–CGA CTT TGG GTT GGA GGG TTA CAG AAG GC–3′; RelA-loxR; 5′–TGG TCT GGA TTC GCT GGC TAA TGG C–3′, which amplify 450 bp fragments from RelAwt allele and 510 bp fragments from RelAflox allele. The wild-type Cnp allele was detected using the primers Cnp-F; 5′–GAA CTC GGC CAG AGA CTA GGG TGT–3′ and Cnp-R; 5′–CCG CGC AGG ATG AAT AGC GTC TTG CAC TCG–3′, which amplify 250 bp fragments. The Cnp-iCre allele was detected using the primers Cnp-F; 5′–GAA CTC GGC CAG AGA CTA GGG TGT–3′ and Cnp-iCreR; 5′-CAG GAA GGC CAG GTT CCT GAT GTC–3′, which amplify 658 bp fragments. We used Quick Taq HS DyeMix (Toyobo, Japan) and the PCR machines (PCR Thermal Cycler Dice Gradient, TaKaRa Bio; C1000 Touch Thermal Cycler, Bio-Rad). The PCR detecting RelAflox and RelAwt allele was performed (95°C for 2 min, 35 cycles of 95°C for 25 s, 60°C for 25 s, and 72°C for 40 s, followed by 72°C for 3 min). The PCR detecting Cnp-iCre allele was performed under the following condition (94°C for 2 min, 32 cycles of 94°C for 30 s, 60°C for 30 s, and 72°C for 1 min, followed by 72°C for 3 min).
2.3 Preparation of tissue sections
Cryosections were prepared as previously reported (Horie et al., 2016) and used for histological study. Mice were anesthetized with a lethal dosage of sodium pentobarbital (125 mg/kg body weight) and perfused transcardially with approximately 2 mL of 0.01 M phosphate buffered saline (PBS), followed by 20–25 mL of 4% (w/v) paraformaldehyde in PBS (4% PFA). Brains and spinal cords were removed, soaked in 4% PFA overnight at 4°C, and then incubated with 20% sucrose in PBS overnight at 4°C. On the next day, samples were embedded in OCT compound (Sakura FineTek). Coronal sections (12 μm) were cut using a cryostat (HM525 NX, PHC Corporation).
2.4 Immunohistochemistry
Cryosections were washed with PBS for 15 min. Then, sections were treated with microwave irradiation (500 W for 5 min) in 10 mM citrate buffer (pH 6.0) for antigen retrieval and then cooled to room temperature. After rinsing with PBS for 15 min, the sections were incubated with the primary antibodies in phosphate buffered saline with Tween 20 (PBST) (0.1% TritonX–100 in PBS) with 0.5% skimmed milk (Wako, Osaka, Japan) overnight at 4°C. After washing with PBS for 15 min, the sections were incubated in PBST with 0.5% skimmed milk containing secondary antibodies [peroxidase-labeled anti-mouse, anti-rabbit IgG (1:200, MBL, Nagoya, Japan) or peroxidase-labeled anti-rat IgG (1:200, DAKO)], for 1 h at 37°C, and the rinsed in distilled water for 15 min. Immunoreactivity was visualized in 50 mM Tris buffer (pH 7.4) containing 0.01% diaminobenzidine tetrahydrochloride (DAB) and 0.01% hydrogen peroxide for 2–10 min at 37°C. Sections were dehydrate through ethanol and xylene and then coverslipped.
For fluorescent immunohistochemistry (IHC), sections were initially rinsed with PBS three times for 5 min each and treated 10 mM citrate buffer (pH 6.0) for 5 min at 100°C. After washing with PBS three times for 5 min each, the sections were incubated with 10% goat serum in PBST for permeabilization and blocking. Afterward, the sections were further incubated with primary antibodies in PBST containing 10% goat serum overnight at 4°C. After rinsing with PBST for 15 min, the sections were incubated with secondary antibodies for 60 min at room temperature. After rinsing with PBS for 15 min, the sections were incubated with 4′,6–diamidino–2–phenylindole (DAPI, 1 μg/mL, Dojindo) for 10 min at room temperature, then washed with PBS twice for 5 min each. The images were collected using Olympus microscope (BX53, Olympus) and digital camera system (DP74, Olympus). Working dilutions and sources of antibodies used in this study are listed in Table 1.
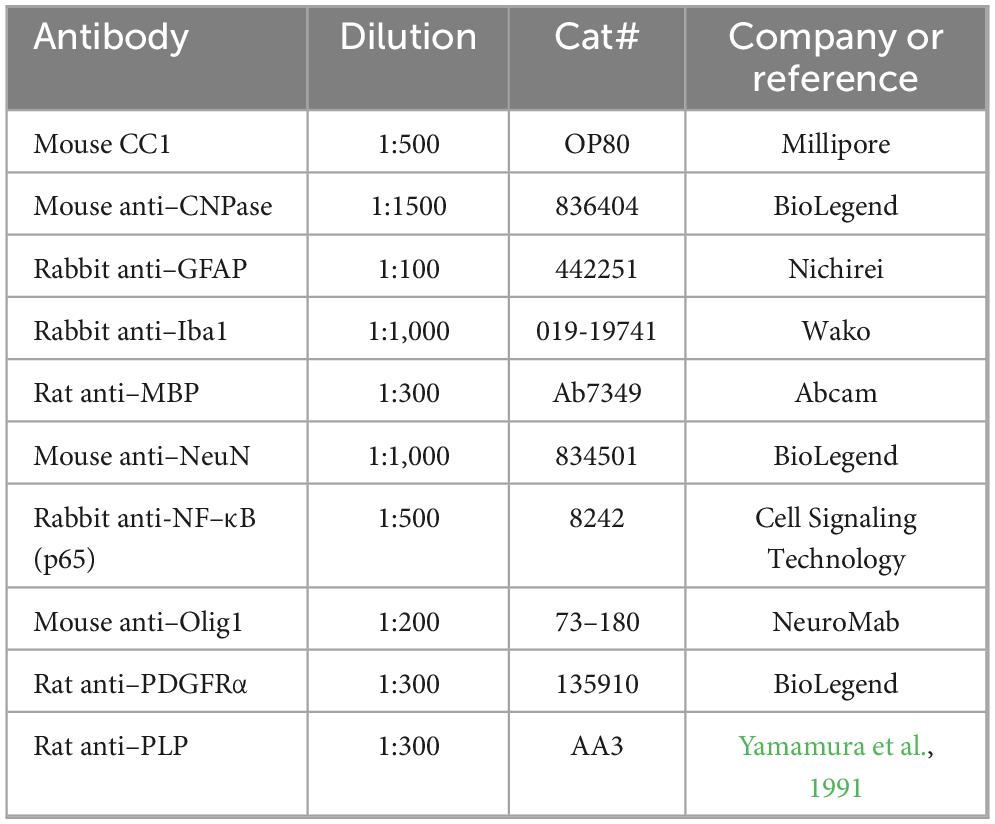
Table 1. Antibodies for immunohistochemistry and immunocytochemistry.
2.5 In situ hybridization
The sections were rinsed with PBS for 10 min. The sections were fixed in 4% PFA for 20 min. Following washing with PBS twice for 5 min each, the sections were treated with 1 μg/ml proteinase K in Tris-based buffer [50 mM Tris–HCl [pH 7.6], 5 mM Ethylenediaminetetraacetic acid (EDTA)] for 10 min, and then rinsed in PBS for 5 min. After fixation in 4% PFA in PBS for 15 min and acetylation in 0.1 M triethanolamine (pH 8.0) containing 0.25% acetic anhydride for 10 min, the sections were prehybridized for 2.5 h at 65°C with a hybridization solution [50% formamide, saline sodium citrate (SSC) (0.15 M NaCl, 0.015 M sodium citrate in diethylpyrocarbonate-treated water), 0.2 mg/mL yeast tRNA, 0.1 mg/mL heparin, 1 × Denhardt’s solution, 0.2% Tween 20, 0.1% CHAPS, and 5 mM EDTA]. The sections were then incubated with a hybridization solution containing diluted Digoxigenin (DIG)-labeled RNA probe overnight at 65°C.
The hybridized sections were washed with 1 × SSC and 50% formamide twice for 30 min at 65°C, and then washed with 0.1 × SSC once at 65°C for 30 min. The sections were washed twice in maleic acid buffer [0.1 M maleic acid (pH 7.5), 0.15 M NaCl and 0.1% Tween 20] for 30 min at room temperature and incubated with alkaline phosphatase-conjugated sheep anti-DIG antibody (1:2000, Roche Diagnostics, Manheim, Germany) in overnight at 4°C. They were then washed in maleic acid buffer three times for 30 min each, and incubated with the color development solution [50 μg/mL 4-nitro blue tetrazolium chloride and 175 μg/mL 5–bromo–4–chloro–3–indolyl-phosphate (Roche Diagnostics)] in alkaline phosphatase buffer [0.1 M Tris–HCl (pH 9.5), 0.05 M MgCl2, 0.1 M NaCl, and 0.1% Tween 20] for 3–10 h in the dark. The following probes generated from mouse cDNA were used: Plp (Kagawa et al., 1994); Myelin basic protein (Mbp) (Genbank accession number: BC004704, nt 544–1975); Platelet-derived growth factor receptor alpha (Pdgfrα) (EST clone, AI098416, Invitrogen); G protein-coupled receptor 17 (Gpr17) (BC070439, nt 270–945); Ectonucleotide pyrophosphatase/phosphodiesterase 6 (Enpp6) (NM_177304, nt 375–1211); Myelin oligodendrocyte glycoprotein (Mog) (NM_010814, nt 324–1112). Sections were counterstained by nuclear fast red (Fluka).
2.6 Reverse transcription-quantitative PCR (RT–qPCR) and semi-quantitative RT–PCR
RT-qPCR was performed as described previously (Hayakawa-Yano et al., 2017) with minor modification. Briefly, total RNA was extracted from mouse cerebral cortices at postnatal day 14 (P14) using RNeasy Mini Kit (Qiagen). One microgram total RNA was reverse transcribed by SuperScript III First-Strand Synthesis System (Thermo Fisher Scientific). The RT-qPCR was performed using StepOnePlus real-time PCR detection system (Applied Biosystems). The results were obtained by the ΔΔCt method. The mRNA levels of interested genes were normalized to the mRNA level of the house-keeping gene Actb. Semi-quantitative RT-PCR for splicing variants detection was performed under the following conditions using PCR Thermal Cycler Dice (TaKaRa Bio): Plp1 Ex2–4 (95°C for 1 min, 28 cycles of 95°C for 20 s, 60°C for 30 s, and 72°C for 30 s, followed by 72°C for 2 min), pleckstrin homology like domain, family B, member 1 (Phldb1) Ex20–22 and SWI/SNF related BAF chromatin remodeling complex subunit B1 (Smarcb1) Ex1–3 (95°C for 1 min, 31 cycles of 95°C for 20 s, 60°C for 30 s, and 72°C for 30 s, followed by 72°C for 2 min). Primers used for RT-qPCR and semi-quantitative RT-PCR were described in Table 2.
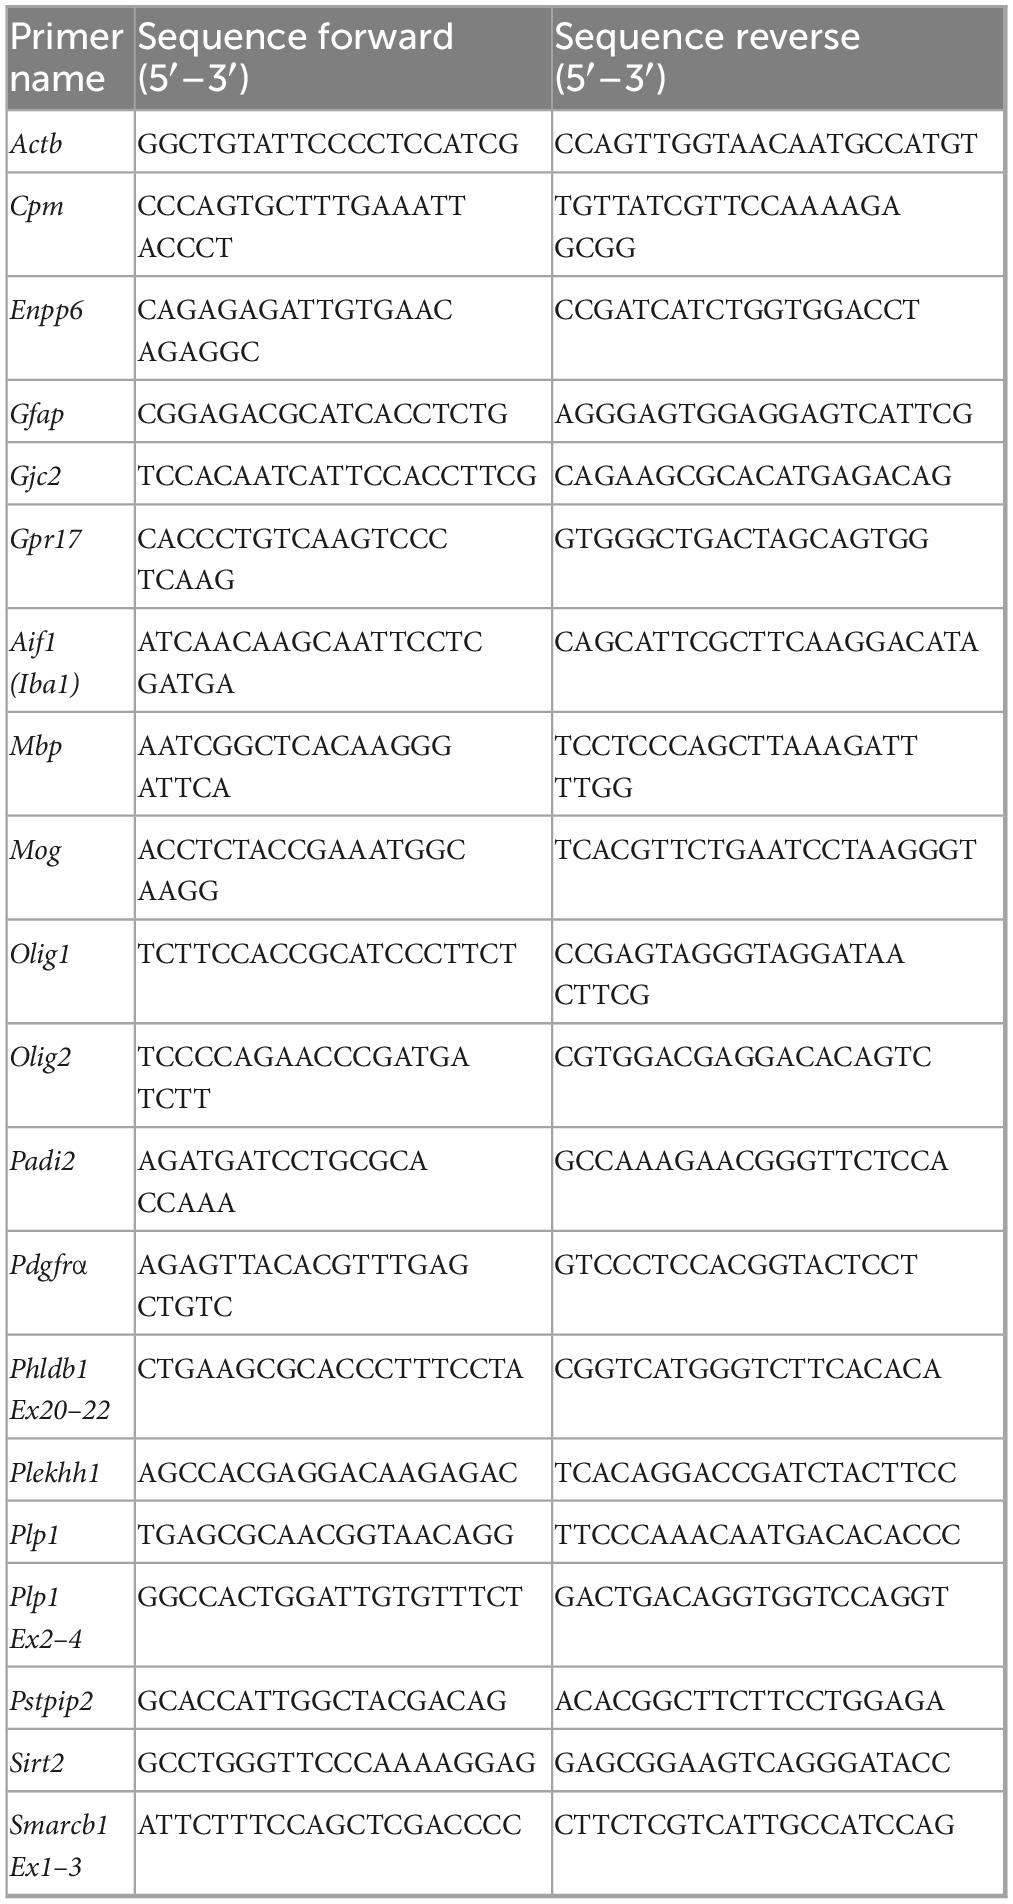
Table 2. Primers for RT-qPCR and semi-quantitative RT-PCR.
2.7 RNA sequence analysis and data analysis
RNA sequencing (RNA-seq) was performed as previously described with some modifications (Bizen et al., 2022). Briefly, cerebral cortex were isolated from control mice and Cnp-iCre; RelA cKO mice at P14. Total RNA was extracted using the RNeasy Mini Kit (Qiagen). The integrity and quantity of the extracted RNA were assessed with an Agilent 2100 Bioanalyzer (Agilent Technologies). Subsequently, mRNA libraries were prepared following the Illumina TruSeq protocol, which involved polyA selection, fragmentation, and adapter ligation (TruSeq RNA Sample Preparation Kit v2, Illumina). The multiplexed libraries were sequenced as 150 nt paired-end reads on an Illumina NovaSeq 6,000 platform by Novogene company.1 The RNA-seq data was deposited as GSE294303 in the Gene Expression Omnibus (GEO) database. The sequencing reads were aligned to the reference genome (GRCm39/mm39) using STAR (Dobin et al., 2013), and gene expression levels were quantified with RSEM (Li and Dewey, 2011). Differential expression analysis was conducted using edgeR (Robinson et al., 2010), with a statistical threshold of FDR < 0.05 applied to determine significance. DAVID Bioinformatics Resources2 were used to perform Gene Ontology (GO) analysis (Huang et al., 2009). The threshold of GO analysis was set at p < 0.05. For comprehensive alternative splicing analysis, the sequence reads were re-aligned to the reference mouse genome (mm10) using OLego (Wu et al., 2013), and expression levels and alternative splicing events were quantified by Quantas3 The calculation of the exon inclusion rate and differential exon inclusion rate of each mRNA between two groups (ΔI) were statistically analyzed by Fisher exact test in the Quantas tool. The statistical criteria (p < 0.05, |ΔI| > 0.05) as significant changes of expression and alternative splicing was employed. To evaluate the enrichment of transcription factor binding motifs and the cell type specificity of gene expression, we utilized the Enrichr platform (Chen et al., 2013).4 Specifically, enrichment analyses were performed using TRANSFAC (Wingender et al., 2000) and JASPAR (Sandelin et al., 2004) databases for transcription factor binding motifs, and Cell Marker (Zhang et al., 2019) and Tabula Muris (Tabula Muris and Consortium, 2018) databases for cell type–specific gene expression profiles.
2.8 Cell culture for oligodendrocyte differentiation
Neural precursor cells (NPCs) were isolated and dissociated from the telencephalon of embryonic day 14.5 (E14.5) mice, and they were subsequently plated onto culture dishes pre-coated with poly-L-ornithine (Sigma-Aldrich) and fibronectin (Thermo Fisher Scientific). The cells were cultured in Dulbecco’s modified eagle medium/nutrient mixture (DMEM/F12) (pH 7.2, Invitrogen) supplemented with N2, which contained 25 μg/ml insulin (Sigma-Aldrich), 100 μg/mL apo-transferrin (Sigma-Aldrich), 20 nM progesterone (Sigma-Aldrich), 100 μM putrescine (Sigma-Aldrich), 30 nM sodium selenite (Sigma-Aldrich), and 1.27 mg/mL NaHO3 (Wako). Recombinant human fibroblast growth factor 2 (FGF2) (10 ng/mL, PeproTech) was also added to the medium to promote the proliferation of NPCs. The cells were maintained under these conditions for 4 days (Bizen et al., 2014, 2022). Following this initial culture period, the cells were dissociated and replated in DMEM/F12 medium supplemented with N2 (DMEM/F12/N2), FGF2, and recombinant murine PDGF-AA (10 ng/mL, PeproTech), and cultured for an additional 4 days to facilitate oligodendrocyte precursor cell (OPC) expansion. Subsequently, the cells were again dissociated and cultured for 5 days in DMEM/F12/N2 medium containing B27 supplement (Thermo Fisher Scientific), recombinant rat ciliary neurotrophic factor (CNTF) (10 ng/mL, PeproTech), triiodothyronine (T3, 30 ng/mL, Sigma), and thyroxine (T4, 40 ng/mL, Sigma) to induce differentiation into oligodendrocytes.
2.9 Western blotting analysis
Proteins were extracted from the cortex, corpus callosum and hippocampus at P14 in ice-cold RIPA buffer [50 mM Tris–HCl (pH 8.0), 150 mM NaCl, 1% NP–40, 0.5% sodium deoxycholate, 0.1% SDS, protease inhibitor cocktail (Complete Mini; Roche, Mannheim, Germany), and phosphatase inhibitor cocktail (PhosSTOP EASYpack; Roche)]. The lysates were sonicated by BioRuptor II (Cosmo Bio, Japan) and then centrifuged at 15,000 rpm for 15 min at 4°C. The supernatants were then collected. Protein concentrations were determined using BCA Protein assay kit (TaKaRa Bio, Japan). The samples were boiled in sodium dodecyl sulfate (SDS) sample buffer [2% SDS, 50 mM Tris–HCl (pH 6.8), 10% glycerol, 6% β-mercaptoethanol, 0.01% bromophenol blue] for 5 min at 95°C. The denatured lysates were separated by electrophoresis (24 mA for 75 min) in 5–20% SuperSep Ace agarose gels (Fujifilm Wako Pure Chemical Corp., Japan) and transferred to Hybond-P PVDF 0.45 (GE Healthcare, IL, United States; 250 mA for 100 min). Following blocking with 5% skim milk in TBST (25 mM Tris–HCl, 137 mM NaCl, 2.7 mM KCl, 0.05% Tween 20, finally adjusted to pH 7.5), the membrane was incubated with rabbit monoclonal anti-NF-κB p65 (D14E12) XP (1:1,000, #8242, Cell Signaling Technology) and mouse monoclonal anti-β-Actin (1:1,000, AC-15, Sigma) overnight at 4°C. After washing with TBST for 5 min three times, the membrane was reacted with the secondary antibodies conjugated to horseradish peroxidase (1:2,000, Cell Signaling Technology). Immunoreactivity was visualized by Western Lightning Plus-ECL enhanced chemiluminescence substrate (PerkinElmer, Massachusetts) or ImmunoStar LD (Fujifilm Wako Pure Chemical Corp.). Images were acquired using the C-DiGit blot scanner (LI-COR Biosciences, Lincoln, NE, United States). Signal intensities from immunoreactive bands were determined by densitometric measurement using ImageJ software.5
2.10 Statistical analyses
All experiments had at least three biological replications, unless otherwise stated. Data are reported as mean ± standard error of the mean (SEM). Histological analyses were conducted using an unpaired t-test to assess statistical significance. The p-value of less than 0.05 was considered statistically significant. All statistical analyses were performed using GraphPad Prism 9 software (Pinyomahakul et al., 2024).
3 Results
3.1 Generation of oligodendrocyte-targeted RelA cKO mice
To investigate the role of RelA in oligodendrocyte lineage cells, we generated conditional knockout (cKO) mice by crossing female Cnp-iCre; RelAflox/+ mice with male RelAflox/flox mice. At postnatal day 14 (P14), RelA cKO mice exhibited significant growth retardation compared to control mice, as evidenced by a marked reduction in body weight (Figures 1A,B). In addition, the RelA cKO mice developed alopecia characterized by hair loss at this stage (Figure 1A). Previous studies have demonstrated that NF-κB signaling plays critical roles in Schwann cell differentiation and hair follicle development (Chen et al., 2011; Krieger et al., 2018). In addition, Cnp is known to be expressed not only in the central nervous system but also in peripheral Schwann cells and a subset of neural crest-derived cells (Yoshino et al., 1985; Iwashita et al., 2003), the observed growth delay and hair loss in RelA cKO mice may reflect the effects of RelA deficiency in the peripheral nervous system and skin.
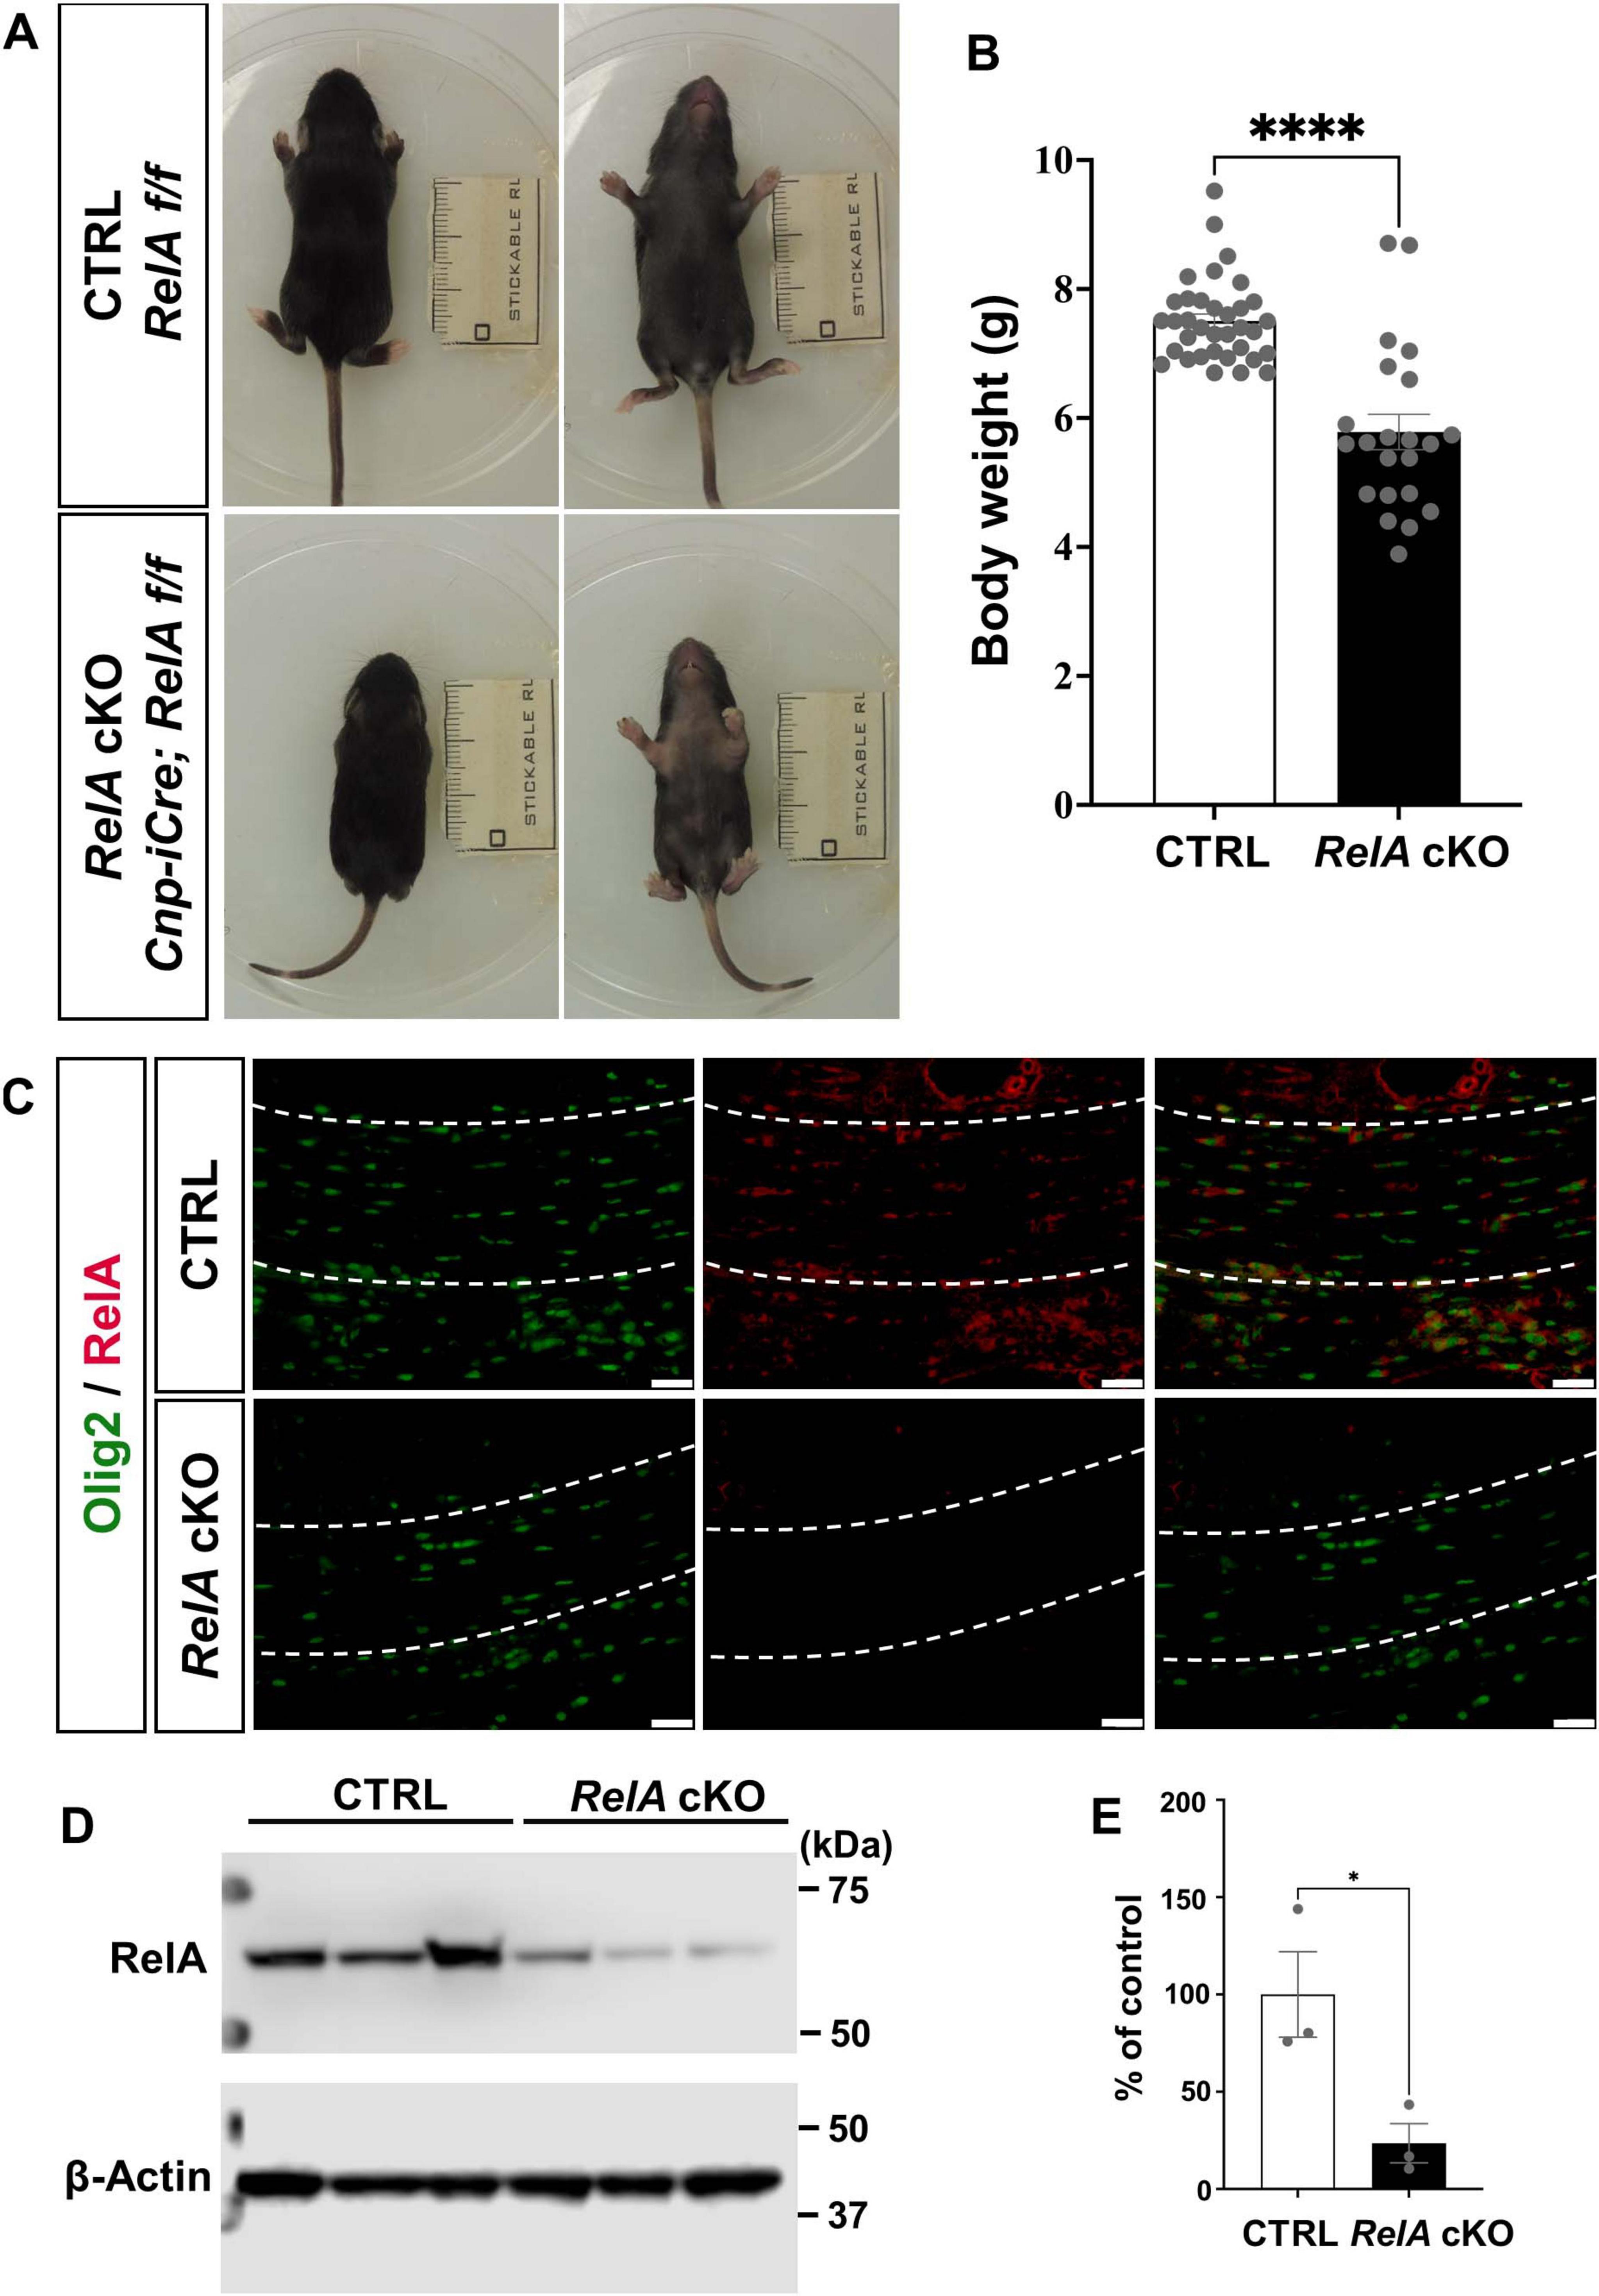
Figure 1. Generation of RelA conditional knockout (cKO) mice in oligodendrocytes. (A) Representative photographs showing growth retardation and hair loss in Cnp-iCre; RelA cKO mice at P14. (B) Bar graphs showing the average body weights of control (n = 35) and Cnp-iCre; RelA cKO (n = 22) mice. (C) Immunohistochemistry for RelA and Olig2, in the corpus callosum of control and Cnp-iCre; RelA cKO mice at P14 (n = 3 mice per group). The white dotted line indicates the region of the corpus callosum shown. (D) Western blotting for RelA and β-actin in Control and RelA cKO cerebral cortices at P14. β-actin was used as a loading control. (E) Quantification of relative RelA protein abundance was performed in control and RelA cKO mice, showing levels as a percentage of the control (n = 3 mice per group). Bar charts represent the mean ± SEM. Statistical analysis was performed by two-tailed, unpaired t-test. *p < 0.05; ****p < 0.0001. Scale bars, 40 μm (C).
To confirm the reduction of RelA protein expression in oligodendrocyte lineage cells of RelA cKO brain, we performed immunohistochemistry (IHC) for RelA and Oligodendrocyte transcription factor 2 (Olig2). The analysis revealed a marked reduction of RelA protein levels in Olig2-positive oligodendrocytes in the corpus callosum of RelA cKO mice (Figure 1C).
We performed Western blotting to further quantify the overall reduction of RelA protein in brain lysates at P14. The results demonstrate a substantial reduction of RelA protein in the cKO brain (Figures 1D,E).
3.2 Spatiotemporally restricted delay of oligodendrocyte differentiation in the RelA cKO mice
To elucidate the role of RelA in oligodendrocyte differentiation, we examined the expression of oligodendrocyte-related genes in the cerebral cortex of RelA-deficient and control mice at P14 and P21 using in situ hybridization (ISH) and immunohistochemistry. At P14, RelA-deficient mice showed significantly reduced expression of myelin-related genes such as Plp, Mbp, and Mog, as well as newly differentiated oligodendrocyte markers Enpp6 and Gpr17, particularly in the secondary motor cortex and in the corpus callosum (Figures 2A–F; Supplementary Figures 1A–D). In contrast, the expression level of the OPC marker Pdgfrα was not significantly different between RelA cKO mice and control mice (Figures 2G,H). Furthermore, PLP and CC1 protein levels were markedly decreased in the secondary motor cortex but not in the corpus callosum (Figures 2I,J; Supplementary Figures 1E,F). In addition, the number of cells exhibiting cytoplasmic localization of Olig1, a hallmark of oligodendrocyte maturation (Arnett et al., 2004), was significantly reduced (Figures 2K,L). Quantitative PCR (qPCR) also demonstrated a significant downregulation of oligodendrocyte marker genes in the cerebral cortex of RelA cKO mice, except Pdgfrα (Figure 2M). By P21, however, the differences in the expression of these genes and proteins were no longer apparent, and the subcellular localization of Olig1 was comparable between genotypes (Supplementary Figures 2, 3). Furthermore, ISH analysis of the spinal cords at both P14 and P21 revealed no notable differences in the expression of oligodendrocyte-related genes between RelA-deficient and control mice (Supplementary Figure 4). These results indicate that the impairment of oligodendrocyte differentiation caused by RelA deficiency is restricted to a specific developmental time window and regions within the cerebral cortex.
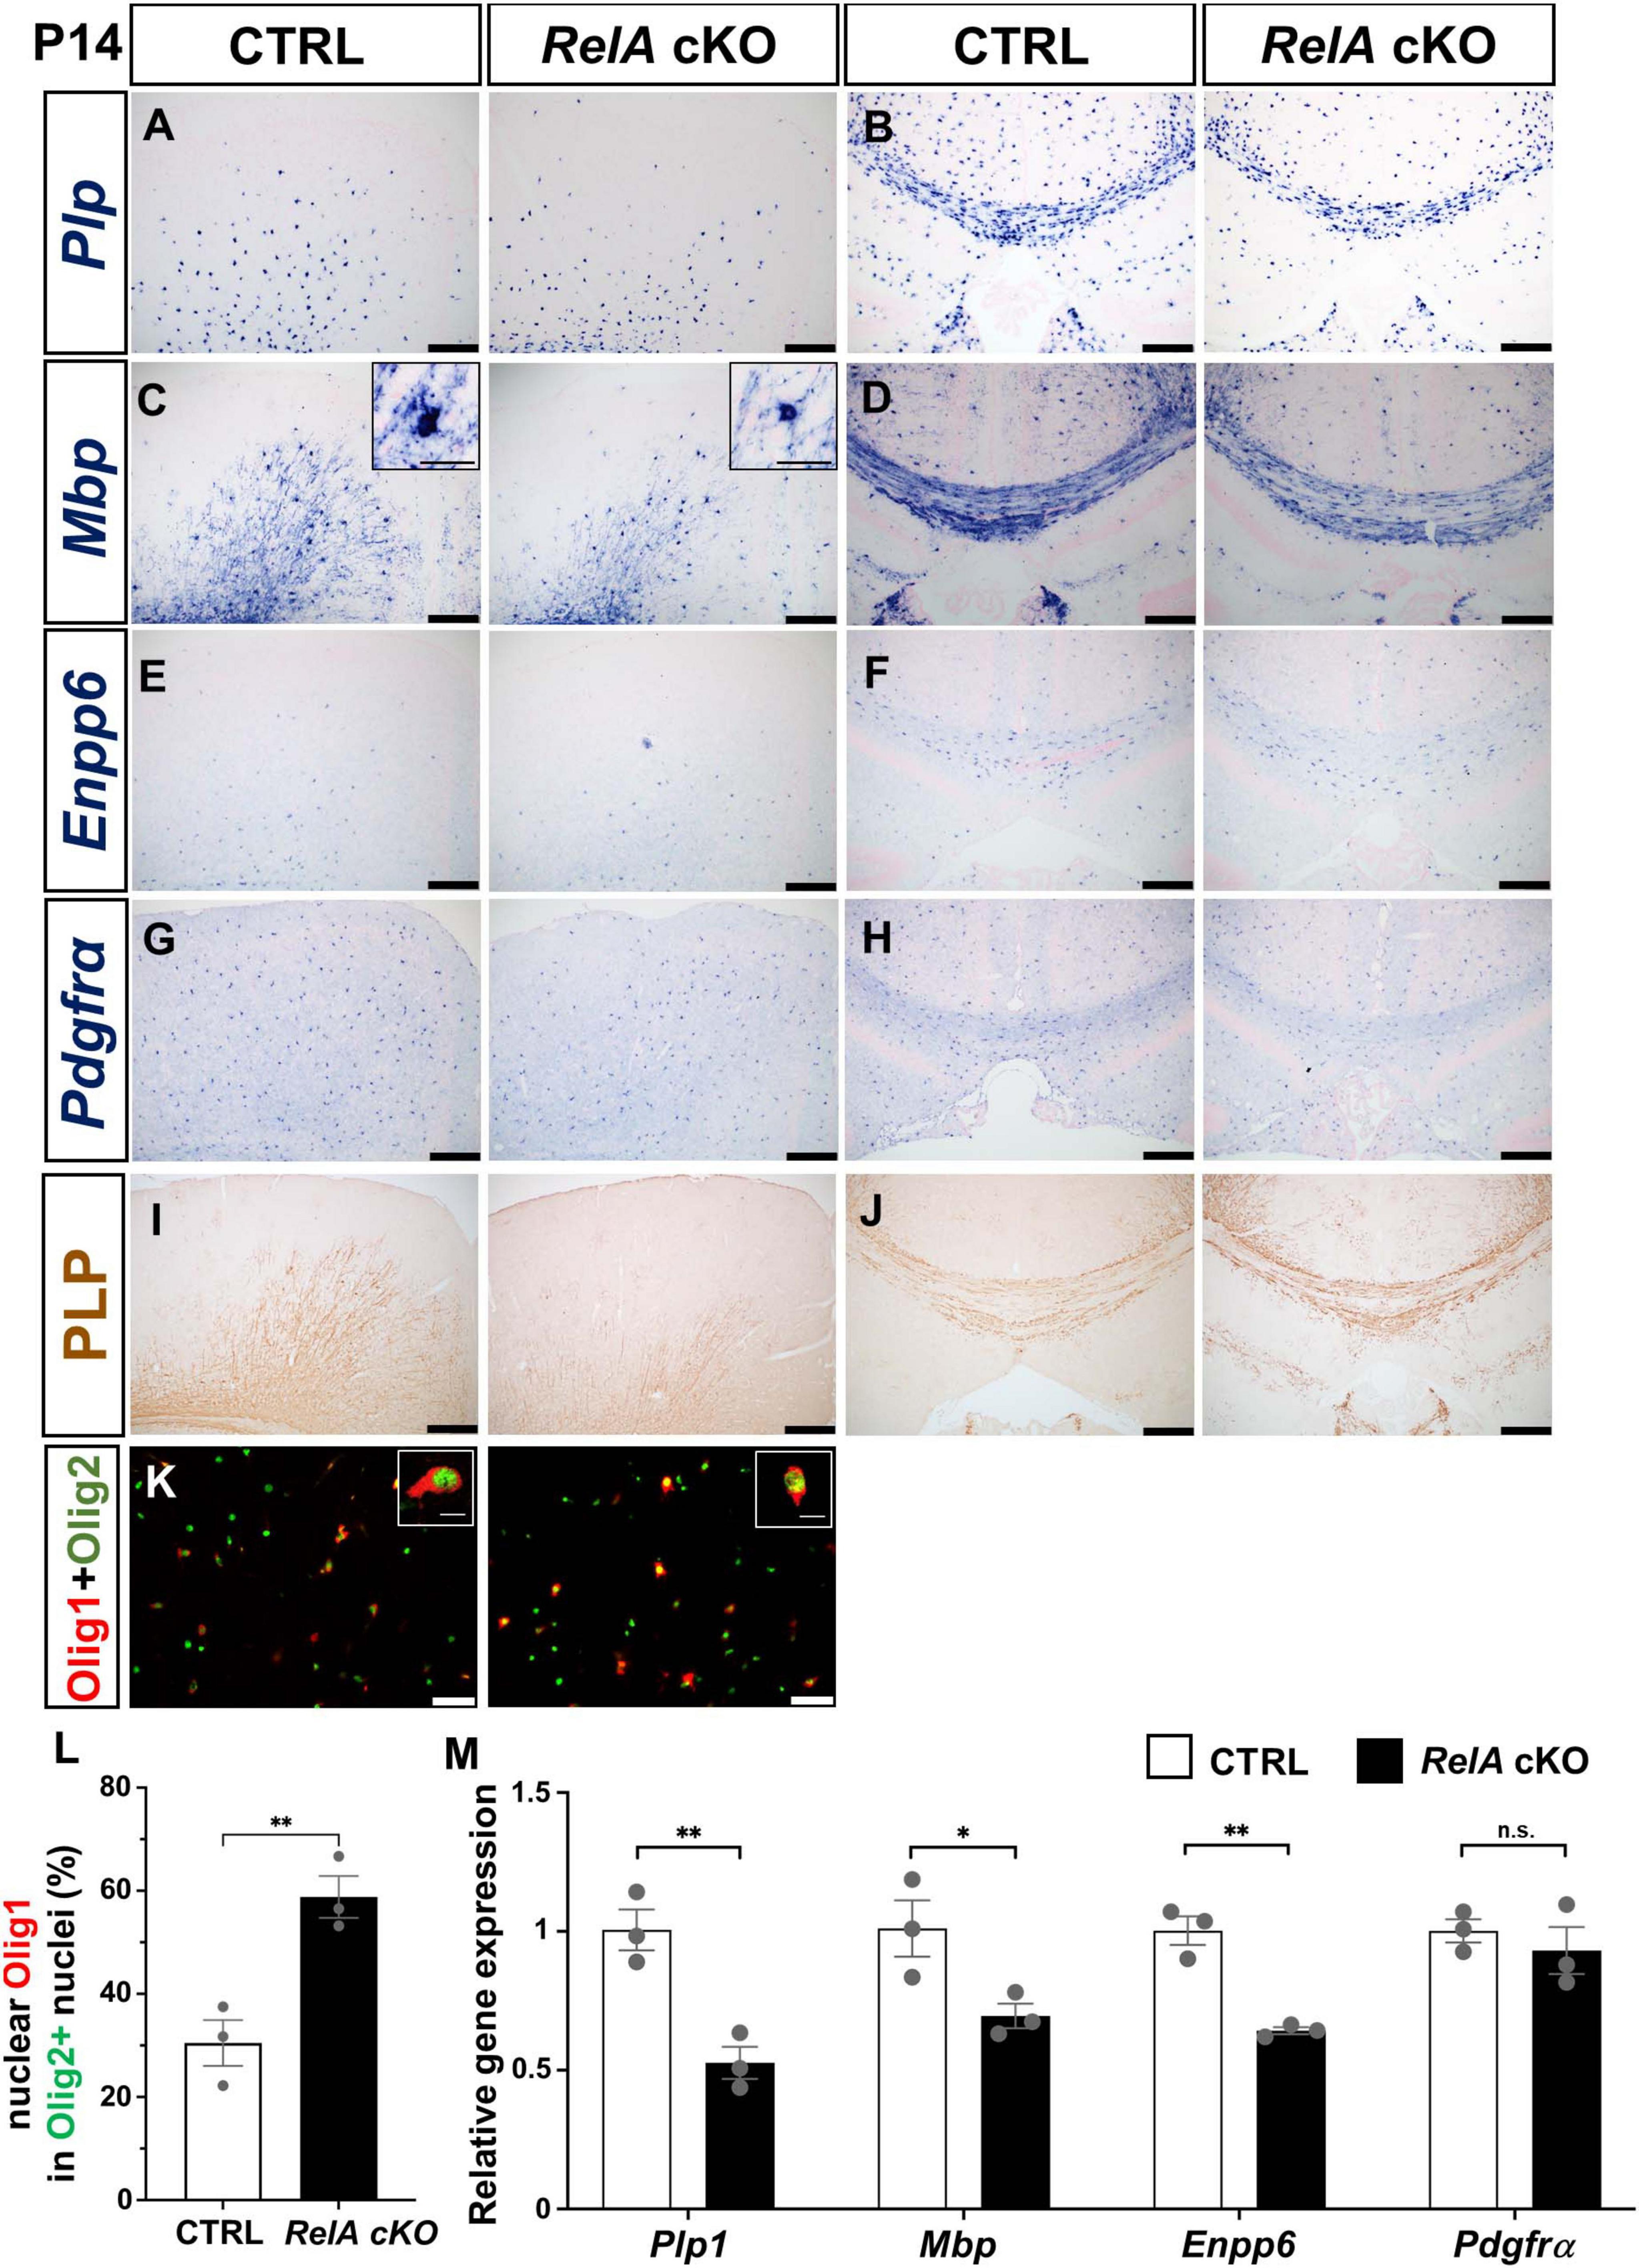
Figure 2. Transient delay of oligodendrocyte differentiation in RelA-deficient cerebral cortices. (A–H) In situ hybridization (ISH) showing reduced mRNA expression of mature oligodendrocyte markers Plp (A,B), Mbp (C,D), Enpp6 (E,F), and Pdgfrα (G,H) in the secondary motor cortex and corpus callosum of RelA cKO mice compared to controls at P14. (I,J) Immunohistochemistry (IHC) demonstrating decreased PLP protein levels in the motor cortex and corpus callosum of RelA cKO mice at P14. (K) Immunofluorescence (IF) showing Olig1 and Olig2 expression in the motor cortex of control and RelA cKO mice at P14. (L) Bar graph showing the percentage of Olig2-positive cells with nuclear localization of Olig1 in (K). (M) RT-qPCR analysis of Plp1, Mbp, Enpp6, and Pdgfrα mRNA levels in mixed cortex, corpus callosum, and hippocampus from control and RelA cKO mice at P14. n = 3 mice per genotype for all experiments. Bar charts represent the mean ± SEM. Statistical analysis was performed by two-tailed, unpaired t-test. *p < 0.05; **p < 0.01; n.s., not significant. Scale bars, 200 μm (A–J); 40 μm (K). Inset scale bars, 10 μm (K).
3.3 Cell-autonomous suppression of terminal differentiation in RelA-deficient oligodendrocyte progenitor cultures
To determine whether the impaired oligodendrocyte differentiation observed in RelA-deficient mice is cell-autonomous, we utilized an oligodendrocyte differentiation-inducing culture system. Neural precursor cells (NPCs) were isolated from the telencephalon of E14.5 RelA-deficient and control embryos and expanded for 4 days in the presence of FGF2. These cells were then cultured for an additional 4 days with FGF2 and PDGF-AA, enriching for Olig2 and PDGFRα double-positive oligodendrocyte precursor cells (OPCs). Subsequent exposure to CNTF and thyroid hormones (T3 and T4) induced differentiation into oligodendrocytes (Figure 3A). Immunostaining confirmed a marked reduction of RelA protein in RelA-deficient OPCs prior to differentiation, although the number of OPCs was not significantly different from controls (Figures 3B–D). By day 5 of differentiation, the number of cells expressing multiple oligodendrocyte markers was significantly decreased in the RelA-deficient cultures (Figures 3E–J), indicating that loss of RelA intrinsically suppresses oligodendrocyte differentiation in a cell-autonomous manner.
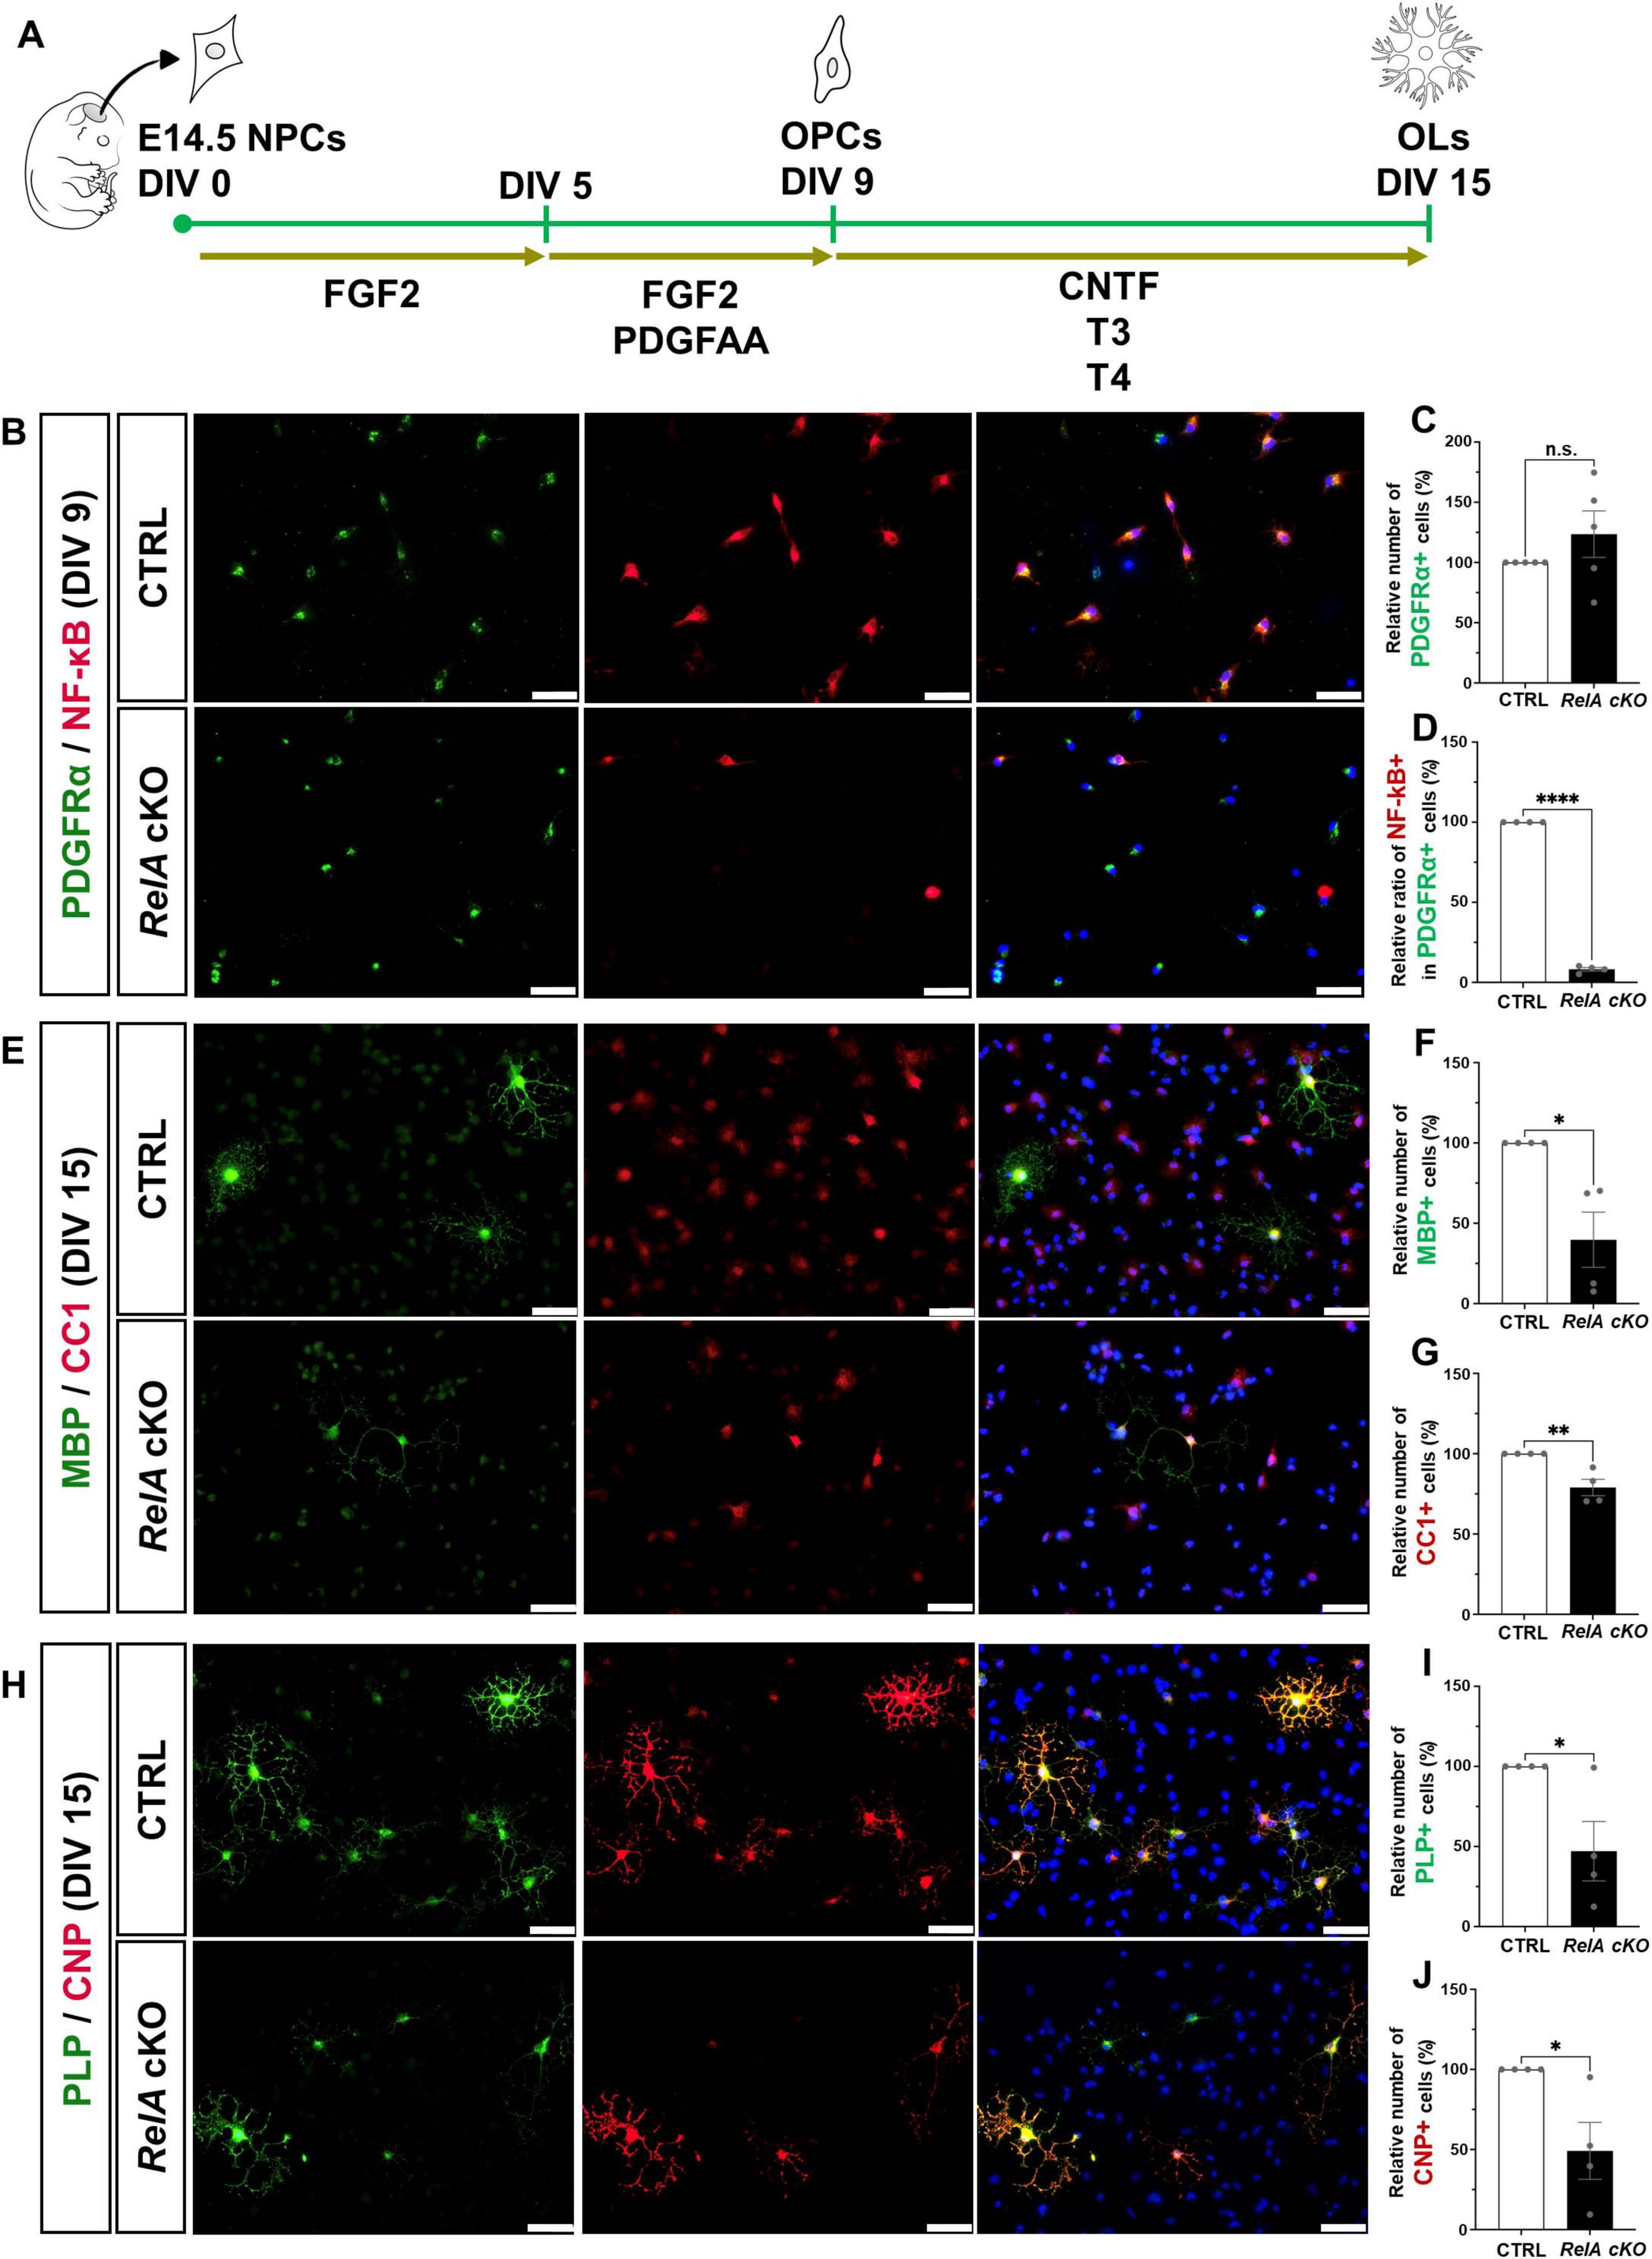
Figure 3. Cell-autonomous suppression of oligodendrocyte differentiation in RelA-deficient mice in vitro. (A) Schematic representation showing the experimental timeline of the primary culture for oligodendrocyte differentiation. (B) Immunofluorescence analysis of PDGFRα and RelA expression in OPCs derived from control and RelA cKO mice at 9 days in vitro (DIV 9). (C,D) Bar graphs represent the relative ratios of the number of PDGFRα-positive OPCs (C) or the proportion of RelA- and PDGFRα- double positive OPCs among PDGFRα-positive OPCs in RelA cKO mice (D) compared to control mice (n = 5 mice per group). (E) Immunofluorescence analysis of MBP and CC1 expression in mature oligodendrocytes derived from control and RelA cKO mice at DIV 15. (F,G) Bar graphs represent the relative ratios of the number of MBP- (F) or CC1-positive oligodendrocytes (G) in RelA cKO mice compared to control mice (n = 4 mice per group). (H) Immunofluorescence analysis of PLP and CNP expression in mature oligodendrocytes derived from control and RelA cKO mice at DIV 15. (I,J) Bar graphs represent the relative ratios of the number of PLP- (I) or CNP-positive oligodendrocytes (J) in RelA cKO mice compared to control mice (n = 4 mice per group). Bar charts represent the mean ± SEM. Statistical analysis was performed by two-tailed, unpaired t-test. *p < 0.05; **p < 0.01; ****p < 0.0001; n.s., not significant. Scale bars, 40 μm.
3.4 Sustained activation of astrocytes and microglia in the cerebral cortex of RelA cKO mice
To investigate whether RelA deficiency also affects other central nervous system (CNS) cell types, we performed immunohistochemical analyses on the brains of P14 mice. RelA-deficient mice exhibited a significant increase in the number of GFAP-positive astrocytes and Iba1-positive microglia, both showing morphological changes indicative of reactive gliosis in the cerebral cortex (Figures 4A,D; Supplementary Figure 5). In addition, an increase in microglial number and morphological alteration, but not those of astrocyte, was observed in the hippocampus (Figures 4B,E; Supplementary Figure 5), whereas no marked changes were detected in either astrocytes or microglia in the corpus callosum (Figures 4C,F; Supplementary Figure 5). In contrast, the number of NeuN-positive neurons remained largely unchanged (Figures 4G–I). qPCR analysis further confirmed a significant upregulation of Gfap and Aif1 (Iba1) mRNA levels in the cerebral cortex of RelA cKO mice (Figure 4J). Notably, glial activation persisted at P21, even after the delay in oligodendrocyte differentiation had resolved (Supplementary Figure 6). These findings suggest that RelA deficiency in oligodendrocytes may contribute to continuous activation of surrounding glial cells in a non-cell-autonomous manner.
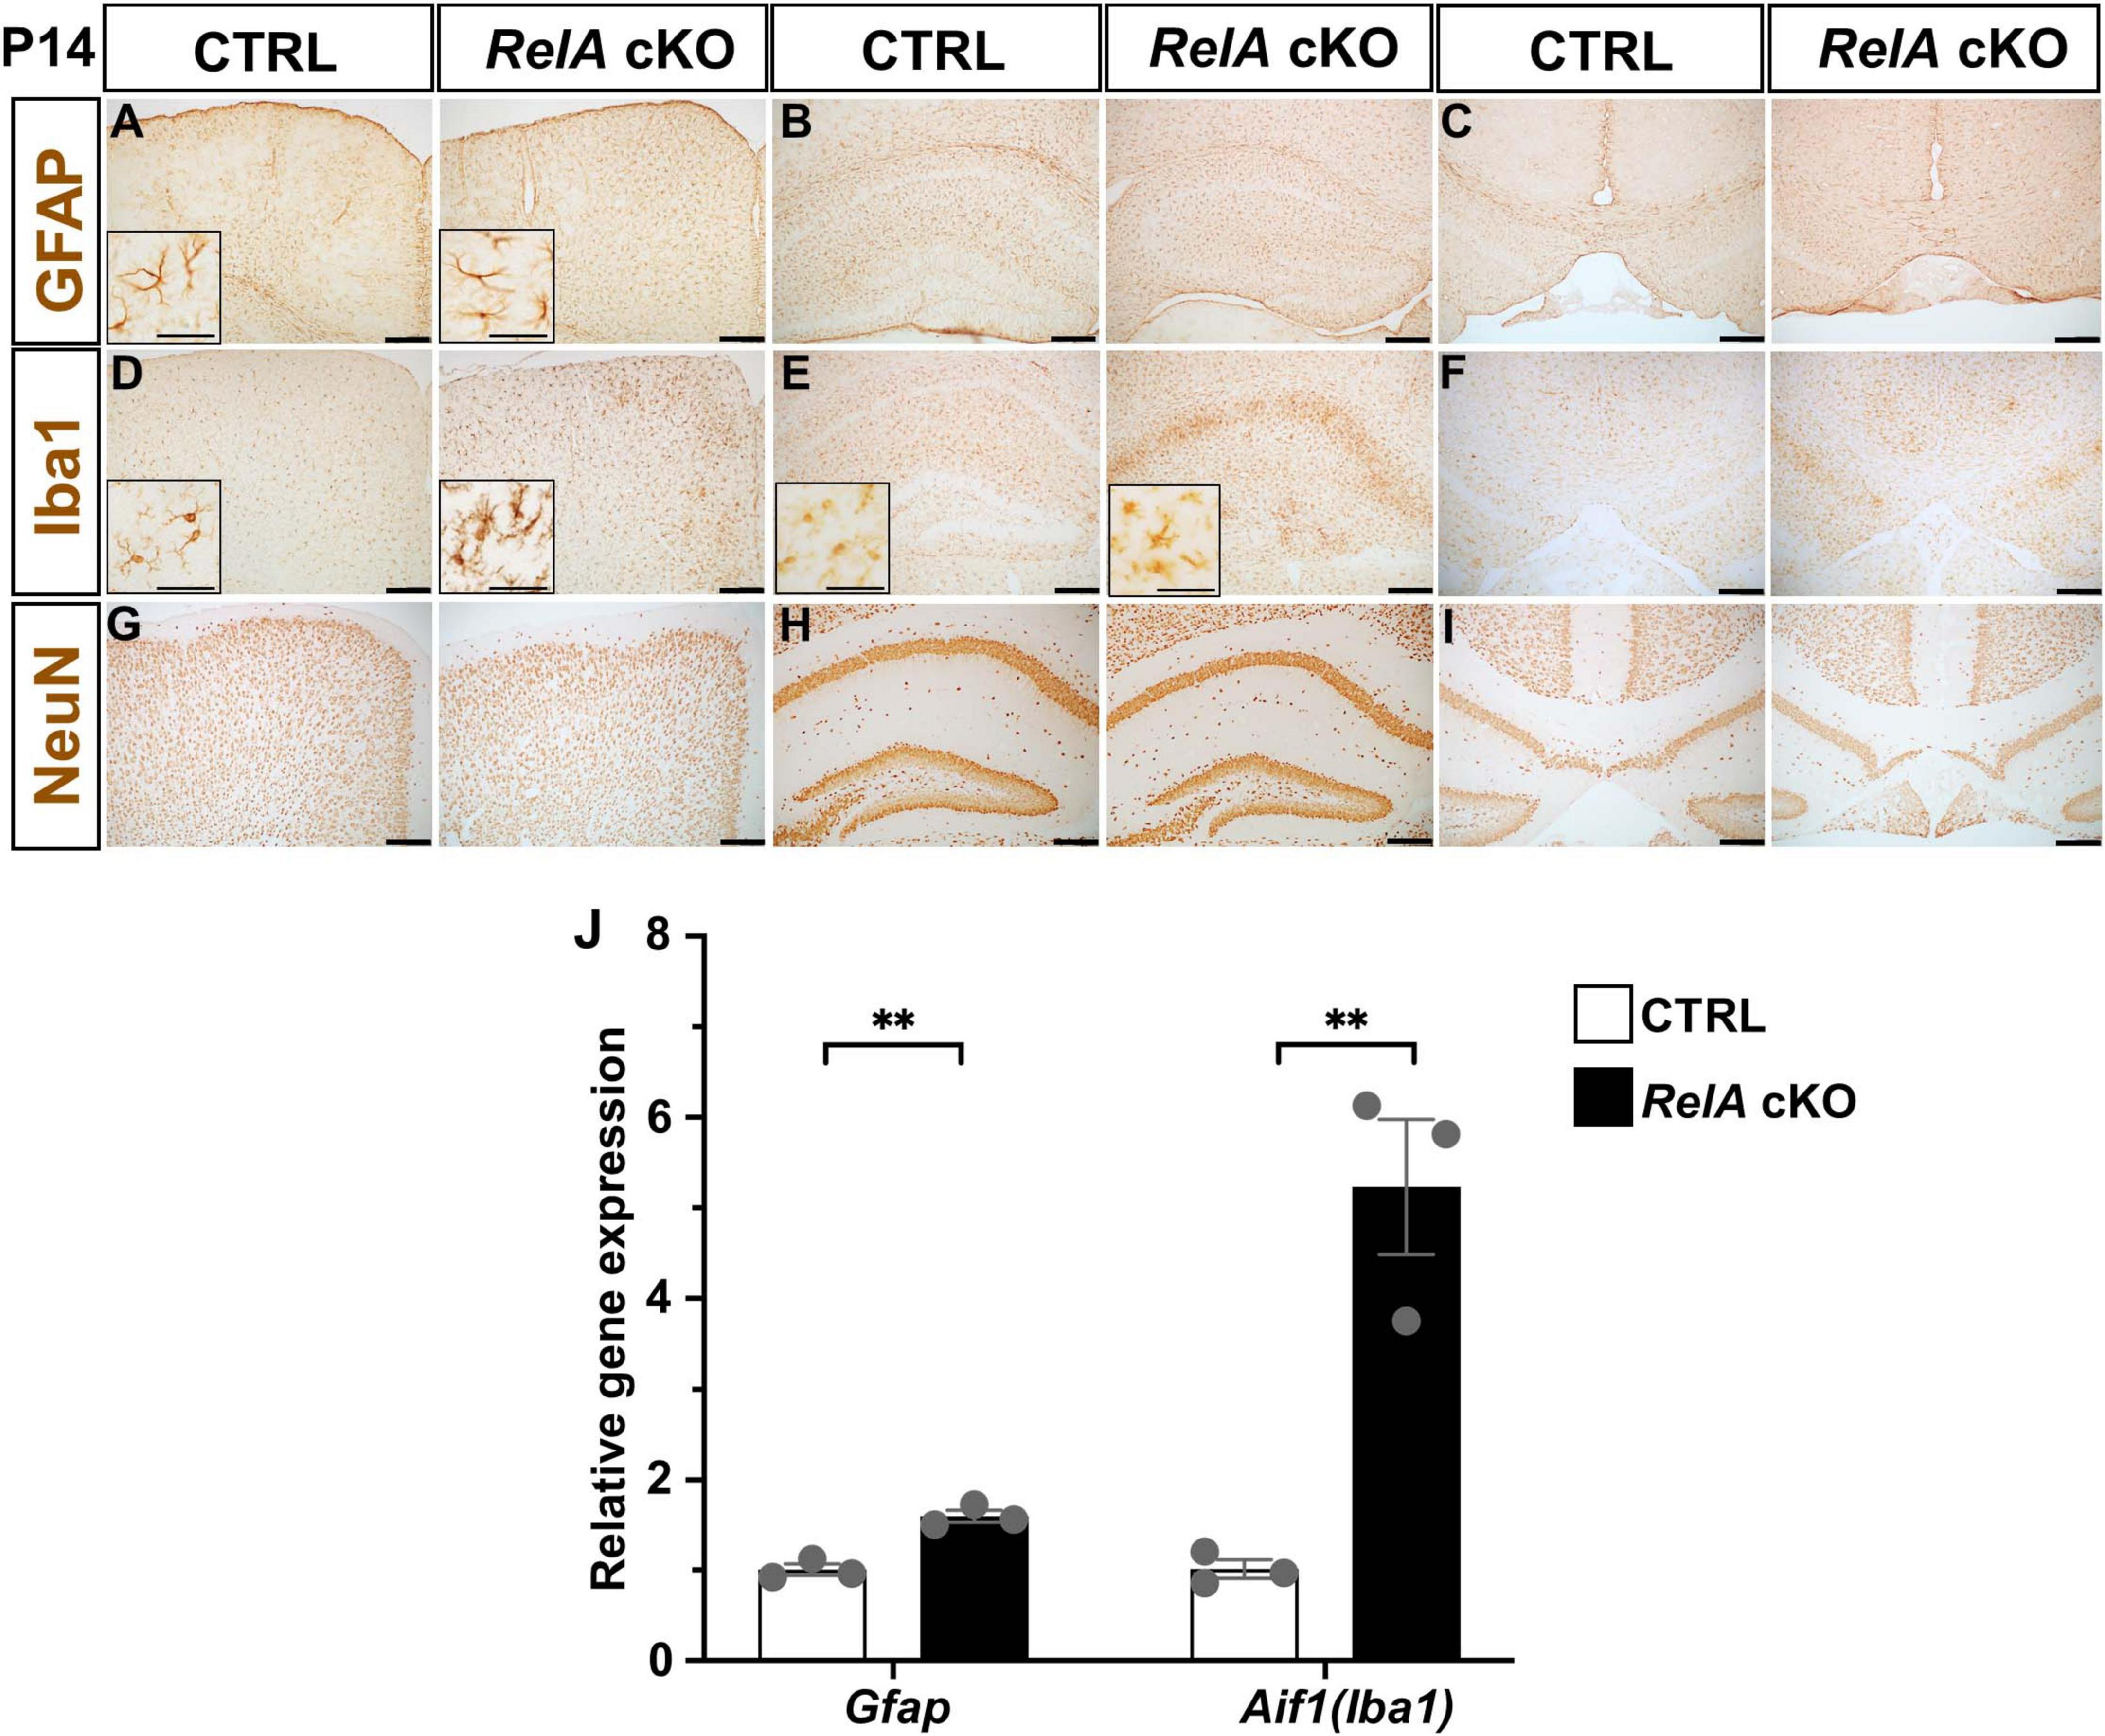
Figure 4. Activation of astrocytes and microglia in RelA-deficient cerebral cortices. (A–C) IHC for GFAP in the second motor cortex (A), hippocampus (B), and corpus callosum (C) of control and RelA cKO mice at P14. (D–F) IHC for Iba1 in the second motor cortex (D), hippocampus (E), and corpus callosum (F) of control and RelA cKO mice at P14. (G–I) IHC for NeuN in the second motor cortex (G), hippocampus (H), and corpus callosum (I) of control and RelA cKO mice at P14. (J) RT-qPCR analysis of Gfap and Aif1 (Iba1) mRNA levels in cerebral cortices and hippocampi from control and RelA cKO mice at P14. n = 3 mice per genotype for all experiments. Bar charts represent the mean ± SEM. Statistical analysis was performed by two-tailed, unpaired t-test. **p < 0.01. Scale bars, 200 μm. Inset scale bars, 40 μm (A,D,E).
3.5 Transcriptomic analysis of the RelA cKO cerebral cortex
To comprehensively characterize the transcriptional changes underlying the phenotypes observed in RelA-deficient mice, we performed RNA sequencing (RNA-seq) using RNA isolated from the cerebral cortex of RelA-deficient and control mice (Figure 5A). Differentially expressed genes (DEGs) were identified using stringent thresholds (|log2FC| > 0.58, FDR < 0.05), revealing 179 downregulated and 806 upregulated genes in the RelA-deficient cortex (Supplementary Table 1). Gene Ontology (GO) analysis of downregulated genes revealed significant enrichment for terms related to myelination and oligodendrocyte differentiation, whereas upregulated genes were associated with immune responses and inflammation (Figures 5B–D). These transcriptomic alterations support the notion that RelA deficiency impairs oligodendrocyte development while promoting glial activation, providing a molecular basis for the observed histological phenotypes.
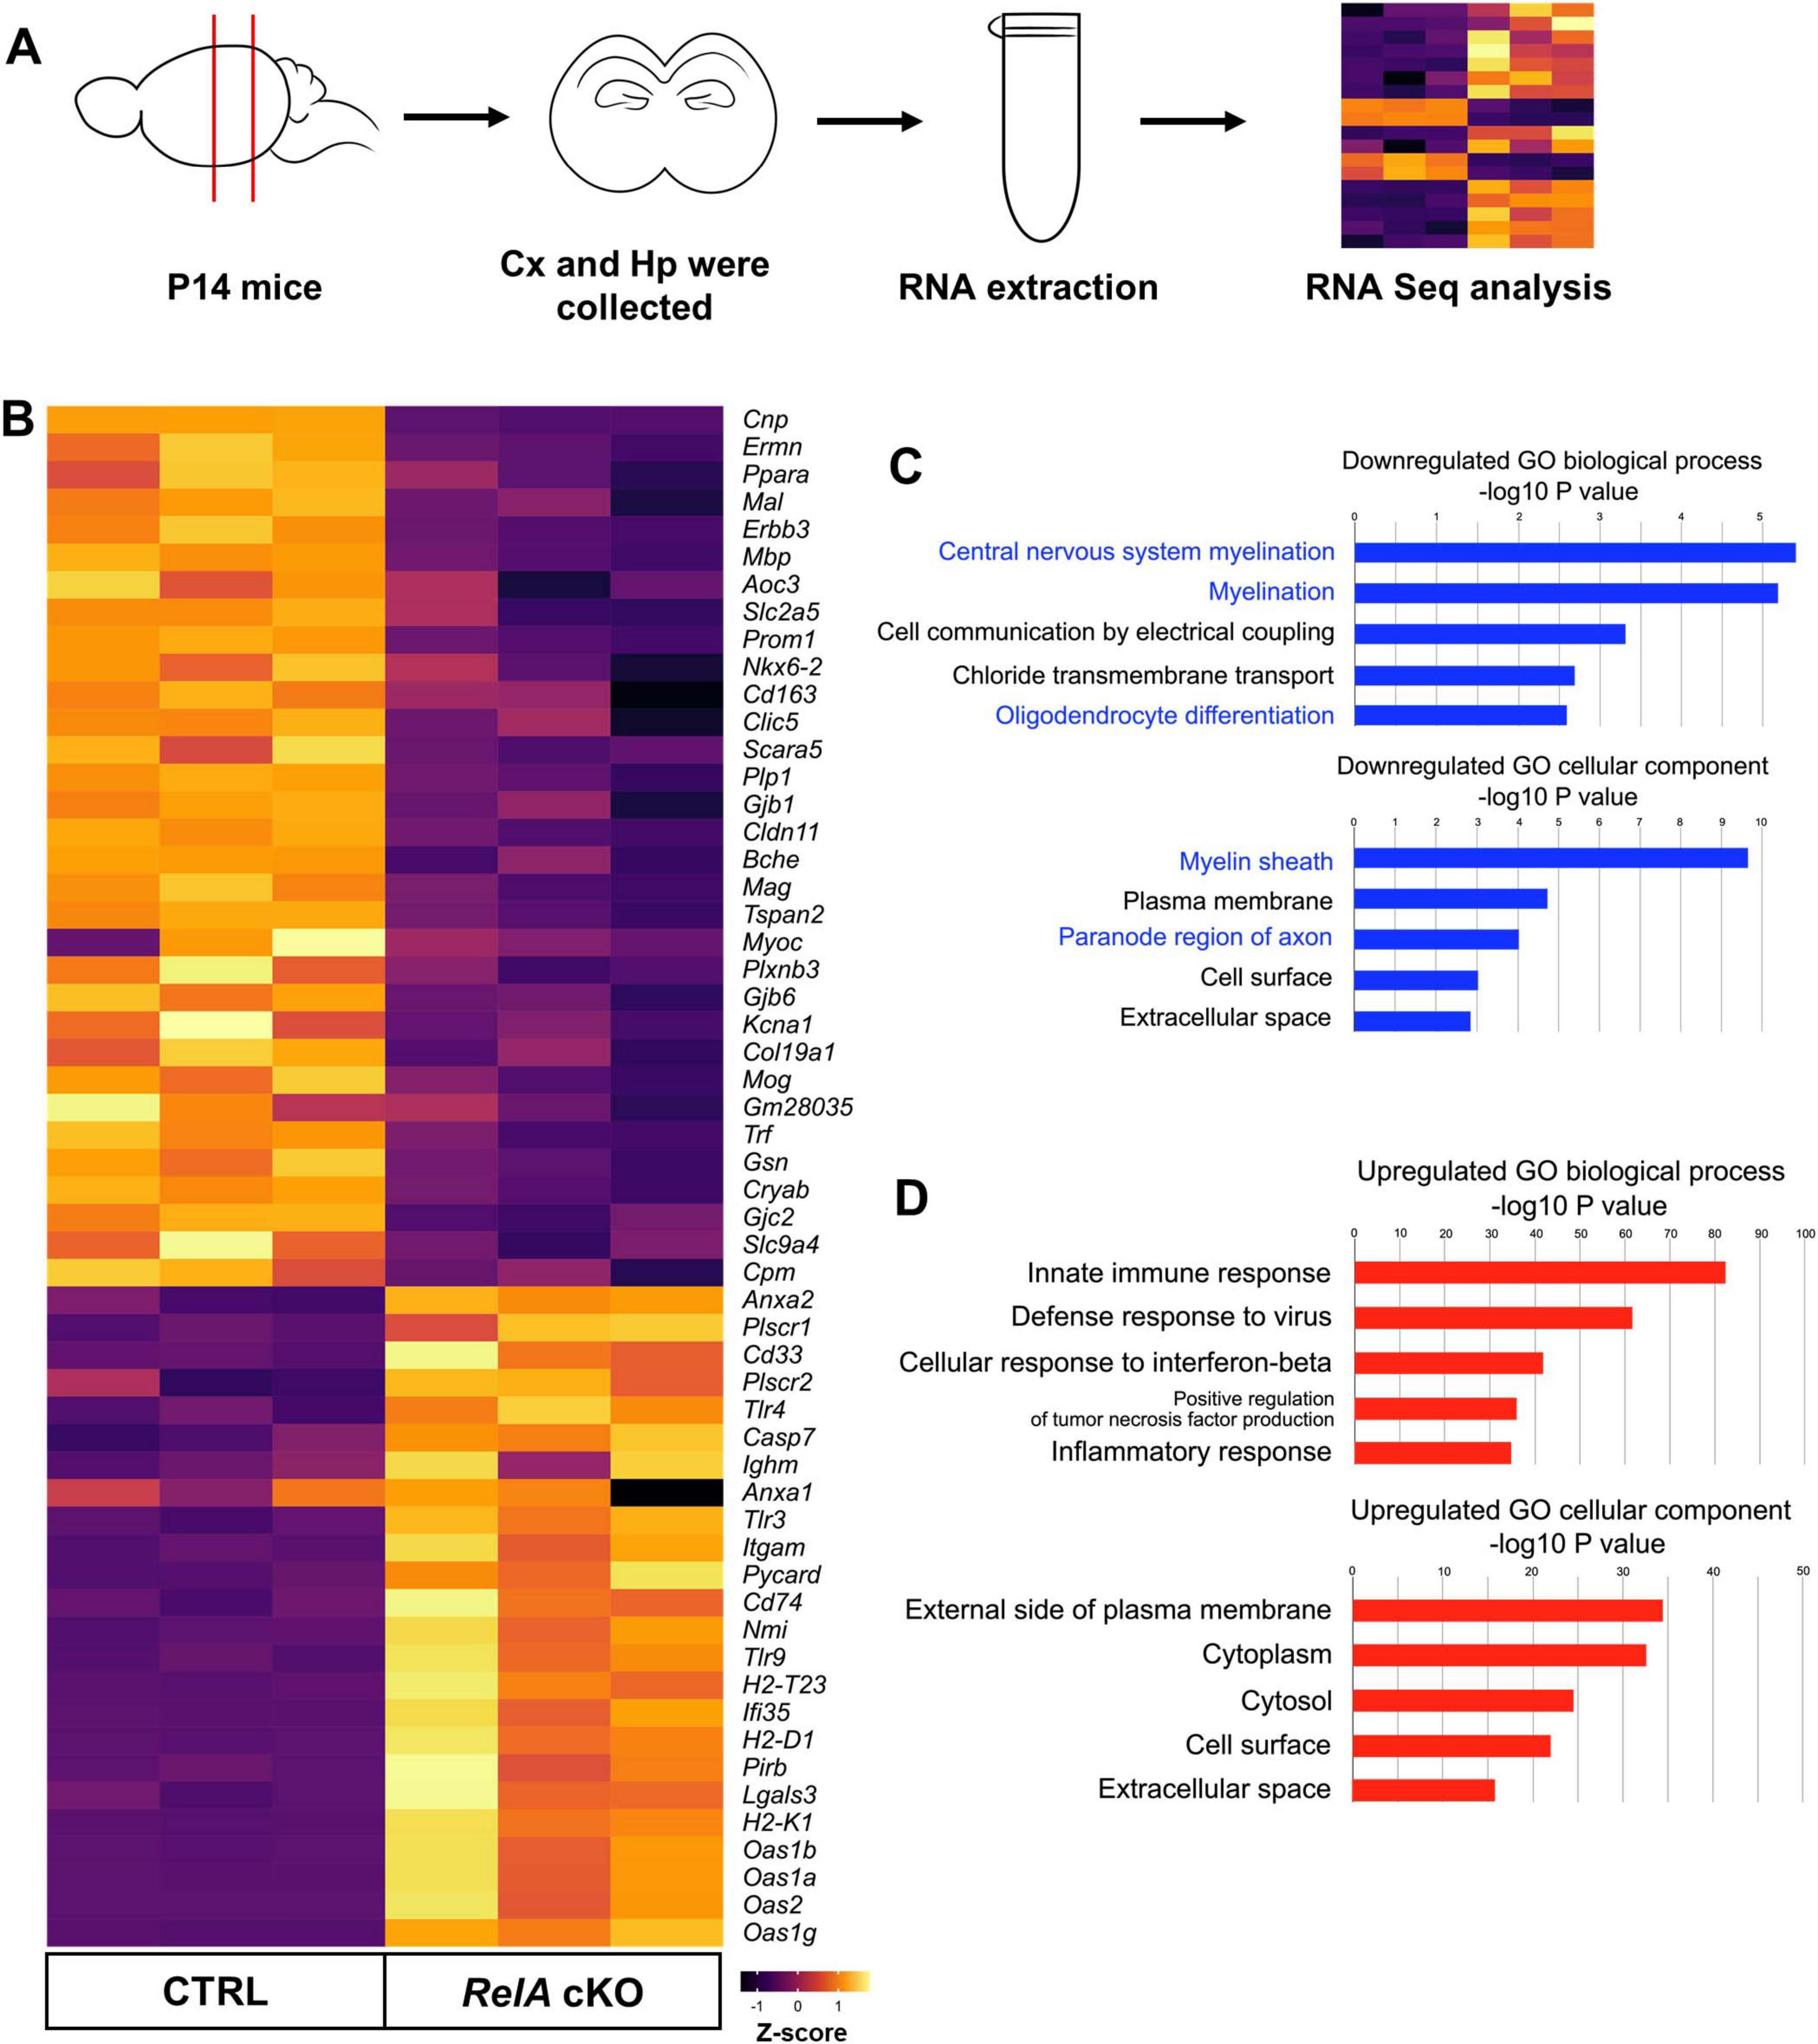
Figure 5. Transcriptomic analysis reveals downregulation of oligodendrocyte-related genes in RelA-deficient mice. (A) Schematic overview of the RNA extraction and RNA sequencing (RNA-seq) workflow. Cx, Cerebral cortex; Hp; Hippocampus. (B) Heatmap from RNA-seq data (Z–scores) depicts oligodendrocyte- and immune inflammatory response-related genes with significant differences in expression levels between control and RelA cKO mice. (C) Gene Ontology (GO) enrichment analysis of downregulated genes. Bar graphs illustrate the top five significantly enriched GO biological processes, demonstrating decreased representation of central nervous system myelination, myelination, and oligodendrocyte differentiation. Additionally, the top five significantly enriched GO cellular components show decreased representation of myelin sheath and paranode region of axon. (D) GO enrichment analysis of upregulated genes. Bar graphs illustrate the top five significantly enriched GO biological processes, demonstrating increased representation of immune response and inflammatory response. The top five significantly enriched GO cellular components show increased representation of external side of plasma membrane, cytoplasm, and cell surface.
3.6 Identification of putative RelA target genes involved in oligodendrocyte differentiation
To elucidate the molecular mechanisms by which RelA regulates oligodendrocyte differentiation at the transcriptional level, we sought to identify potential direct targets of RelA among oligodendrocyte-related genes that were differentially expressed in the transcriptomic analysis of RelA-deficient mice (Figure 6A). We first performed motif enrichment analysis using the TRANSFAC and JASPAR databases available in the Enrichr platform on the set of genes significantly downregulated (FDR < 0.05) in RelA-deficient mice. This analysis yielded 159 genes predicted to contain RelA binding motifs. Next, to assess the cell-type specificity of these candidate genes, we conducted enrichment analyses using the Cell Marker and Tabula Muris datasets. These analyses revealed that terms associated with oligodendrocytes ranked highest, suggesting a strong enrichment of oligodendrocyte-related genes within the candidate set (Figure 6B). Among them, 21 genes were identified as being highly or specifically expressed in oligodendrocytes. In addition, two genes—peptidyl arginine deiminase2 (Padi2) (Falcão et al., 2019) and quaking (Qk) (Sidman et al., 1964; Darbelli et al., 2016; Zhou et al., 2020, 2021)—which have been previously reported to be involved in oligodendrocyte differentiation and maturation, were included, resulting in a final list of 23 putative RelA target genes (Supplementary Table 2). RT-qPCR analysis confirmed that several of these candidate genes, including Padi2, were significantly downregulated in the cerebral cortex of RelA-deficient mice (Figure 6C). These findings suggest that RelA may contribute to oligodendrocyte differentiation and maturation by directly regulating the transcription of a subset of lineage-specific genes essential for oligodendrocyte development.
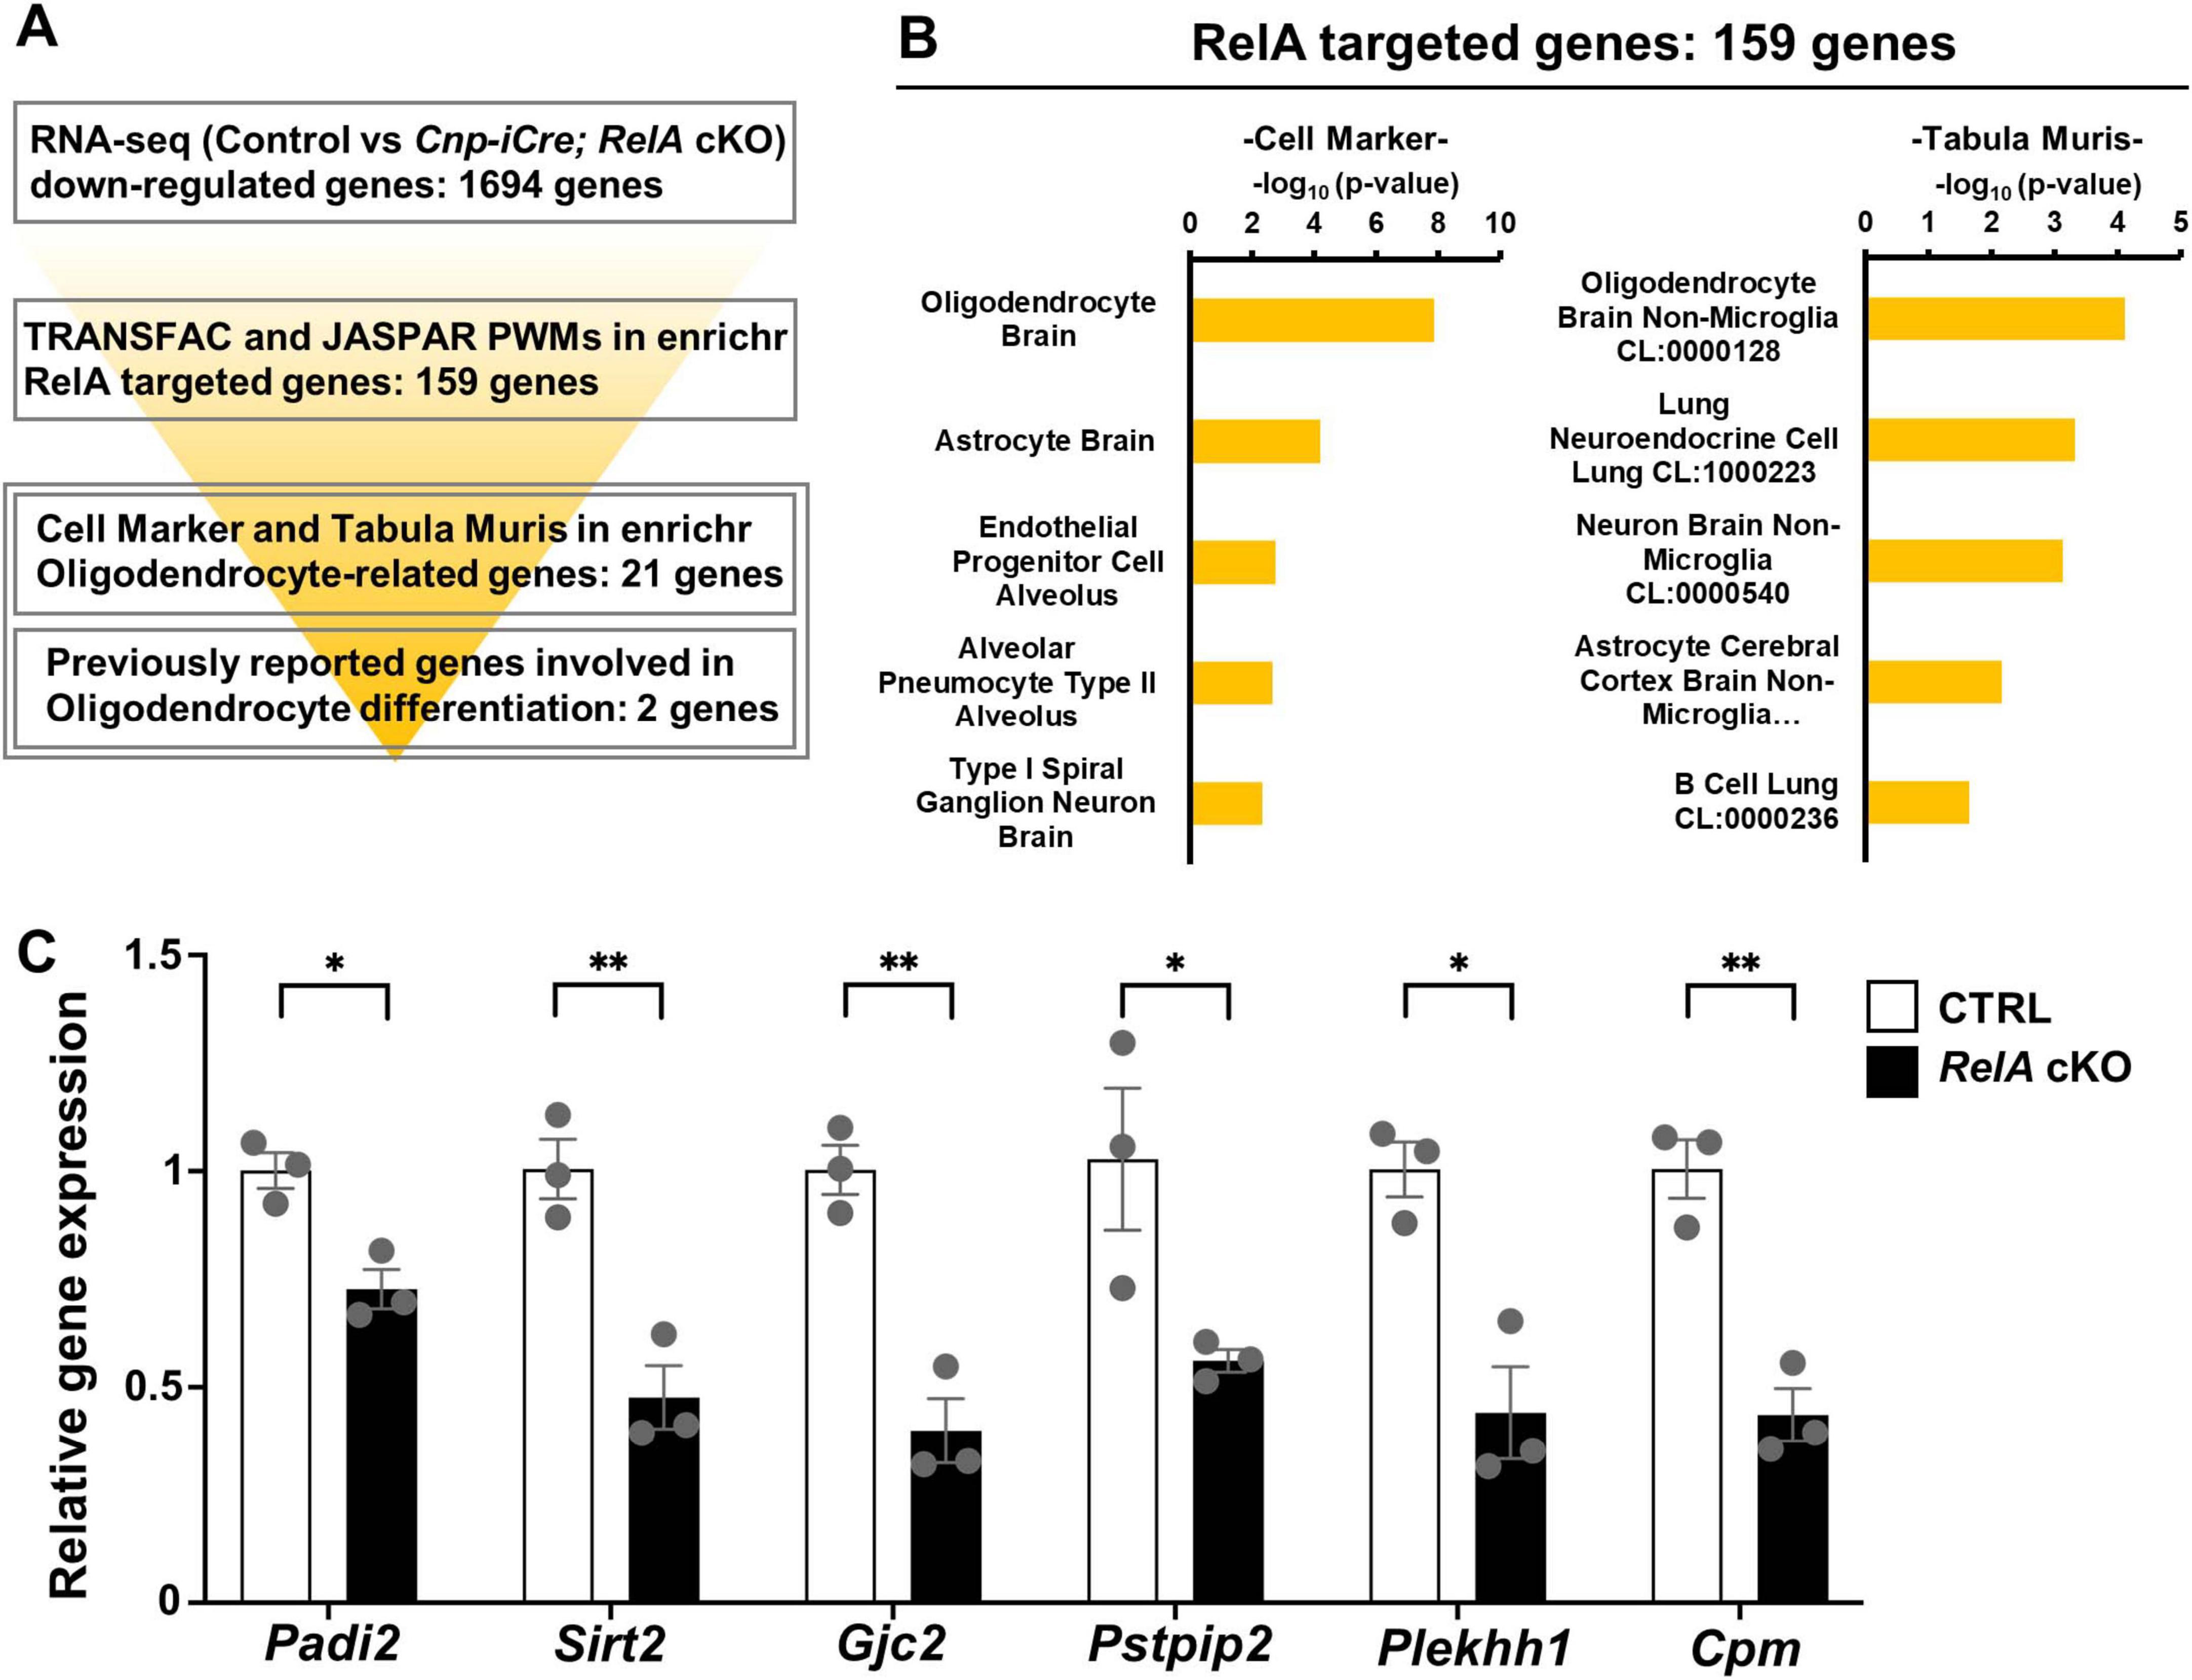
Figure 6. Identification of putative oligodendrocyte-related NF-κB RelA target genes. (A) Schematic illustration of the screening flow of putative oligodendrocyte-related NF-κB RelA-target genes. (B) Cell type–specific enrichment analysis of putative NF-κB RelA-targeted genes using Cell Marker and Tabula Muris. Enrichment analysis was performed on a set of potential NF-κB RelA target genes that were significantly downregulated in RelA-deficient mice (FDR < 0.05), using the Cell Marker (ver. 2024) and Tabula Muris datasets to evaluate their cell type–specific expression profiles. (C) RT-qPCR analysis of narrowed-down putative RelA-targeted genes related to oligodendrocyte. n = 3 mice per genotype. Bar charts represent the mean ± SEM. Statistical analysis was performed by two-tailed, unpaired t-test. *p < 0.05; **p < 0.01.
3.7 Aberrant alternative splicing of oligodendrocyte-related genes in RelA-deficient mice
In addition to its classical role as a transcription factor, members of the NF-κB family, including RelA, have been recently implicated in the regulation of RNA, such as alternative splicing (Ameur et al., 2020; Lee et al., 2020; Marie et al., 2024; Van Gelder et al., 2025). To explore this possibility, we analyzed exon junction usage in the RNA-seq data from the cerebral cortex of RelA-deficient and control mice. This analysis revealed 403 significant splicing alterations in RelA-deficient samples, comprising 149 exon skipping and 254 exon inclusion events (Figure 7A), categorized into six classes: cassette exons, mutually exclusive exons, tandem cassette exons, alternative 5′ site, alternative 3′ site, and intron retention (p < 0.05, |ΔI| > 0.05) (Figure 7B). Among these, we identified 18 oligodendrocyte-related genes exhibiting aberrant splicing (Figure 7C; Supplementary Table 3). Notably, Plp1, a major myelin protein component, showed altered splicing with increased amount of the shorter and embryo-predominant DM20 isoform, as validated by semi-quantitative RT-PCR (Figures 7D,E). However, this splicing abnormality was resolved at P21 (Supplementary Figure 7). In addition, we also observed altered splicing with decreased amount of the longer isoforms of Phldb1 and Smarcb1 (Figures 7F–I). These results indicate that RelA contributes not only to transcriptional regulation but also to splicing control of gene essential for oligodendrocyte maturation (Ng et al., 2015) and gene associated with glioma risk (Viana-Pereira et al., 2020; Baskin et al., 2015).
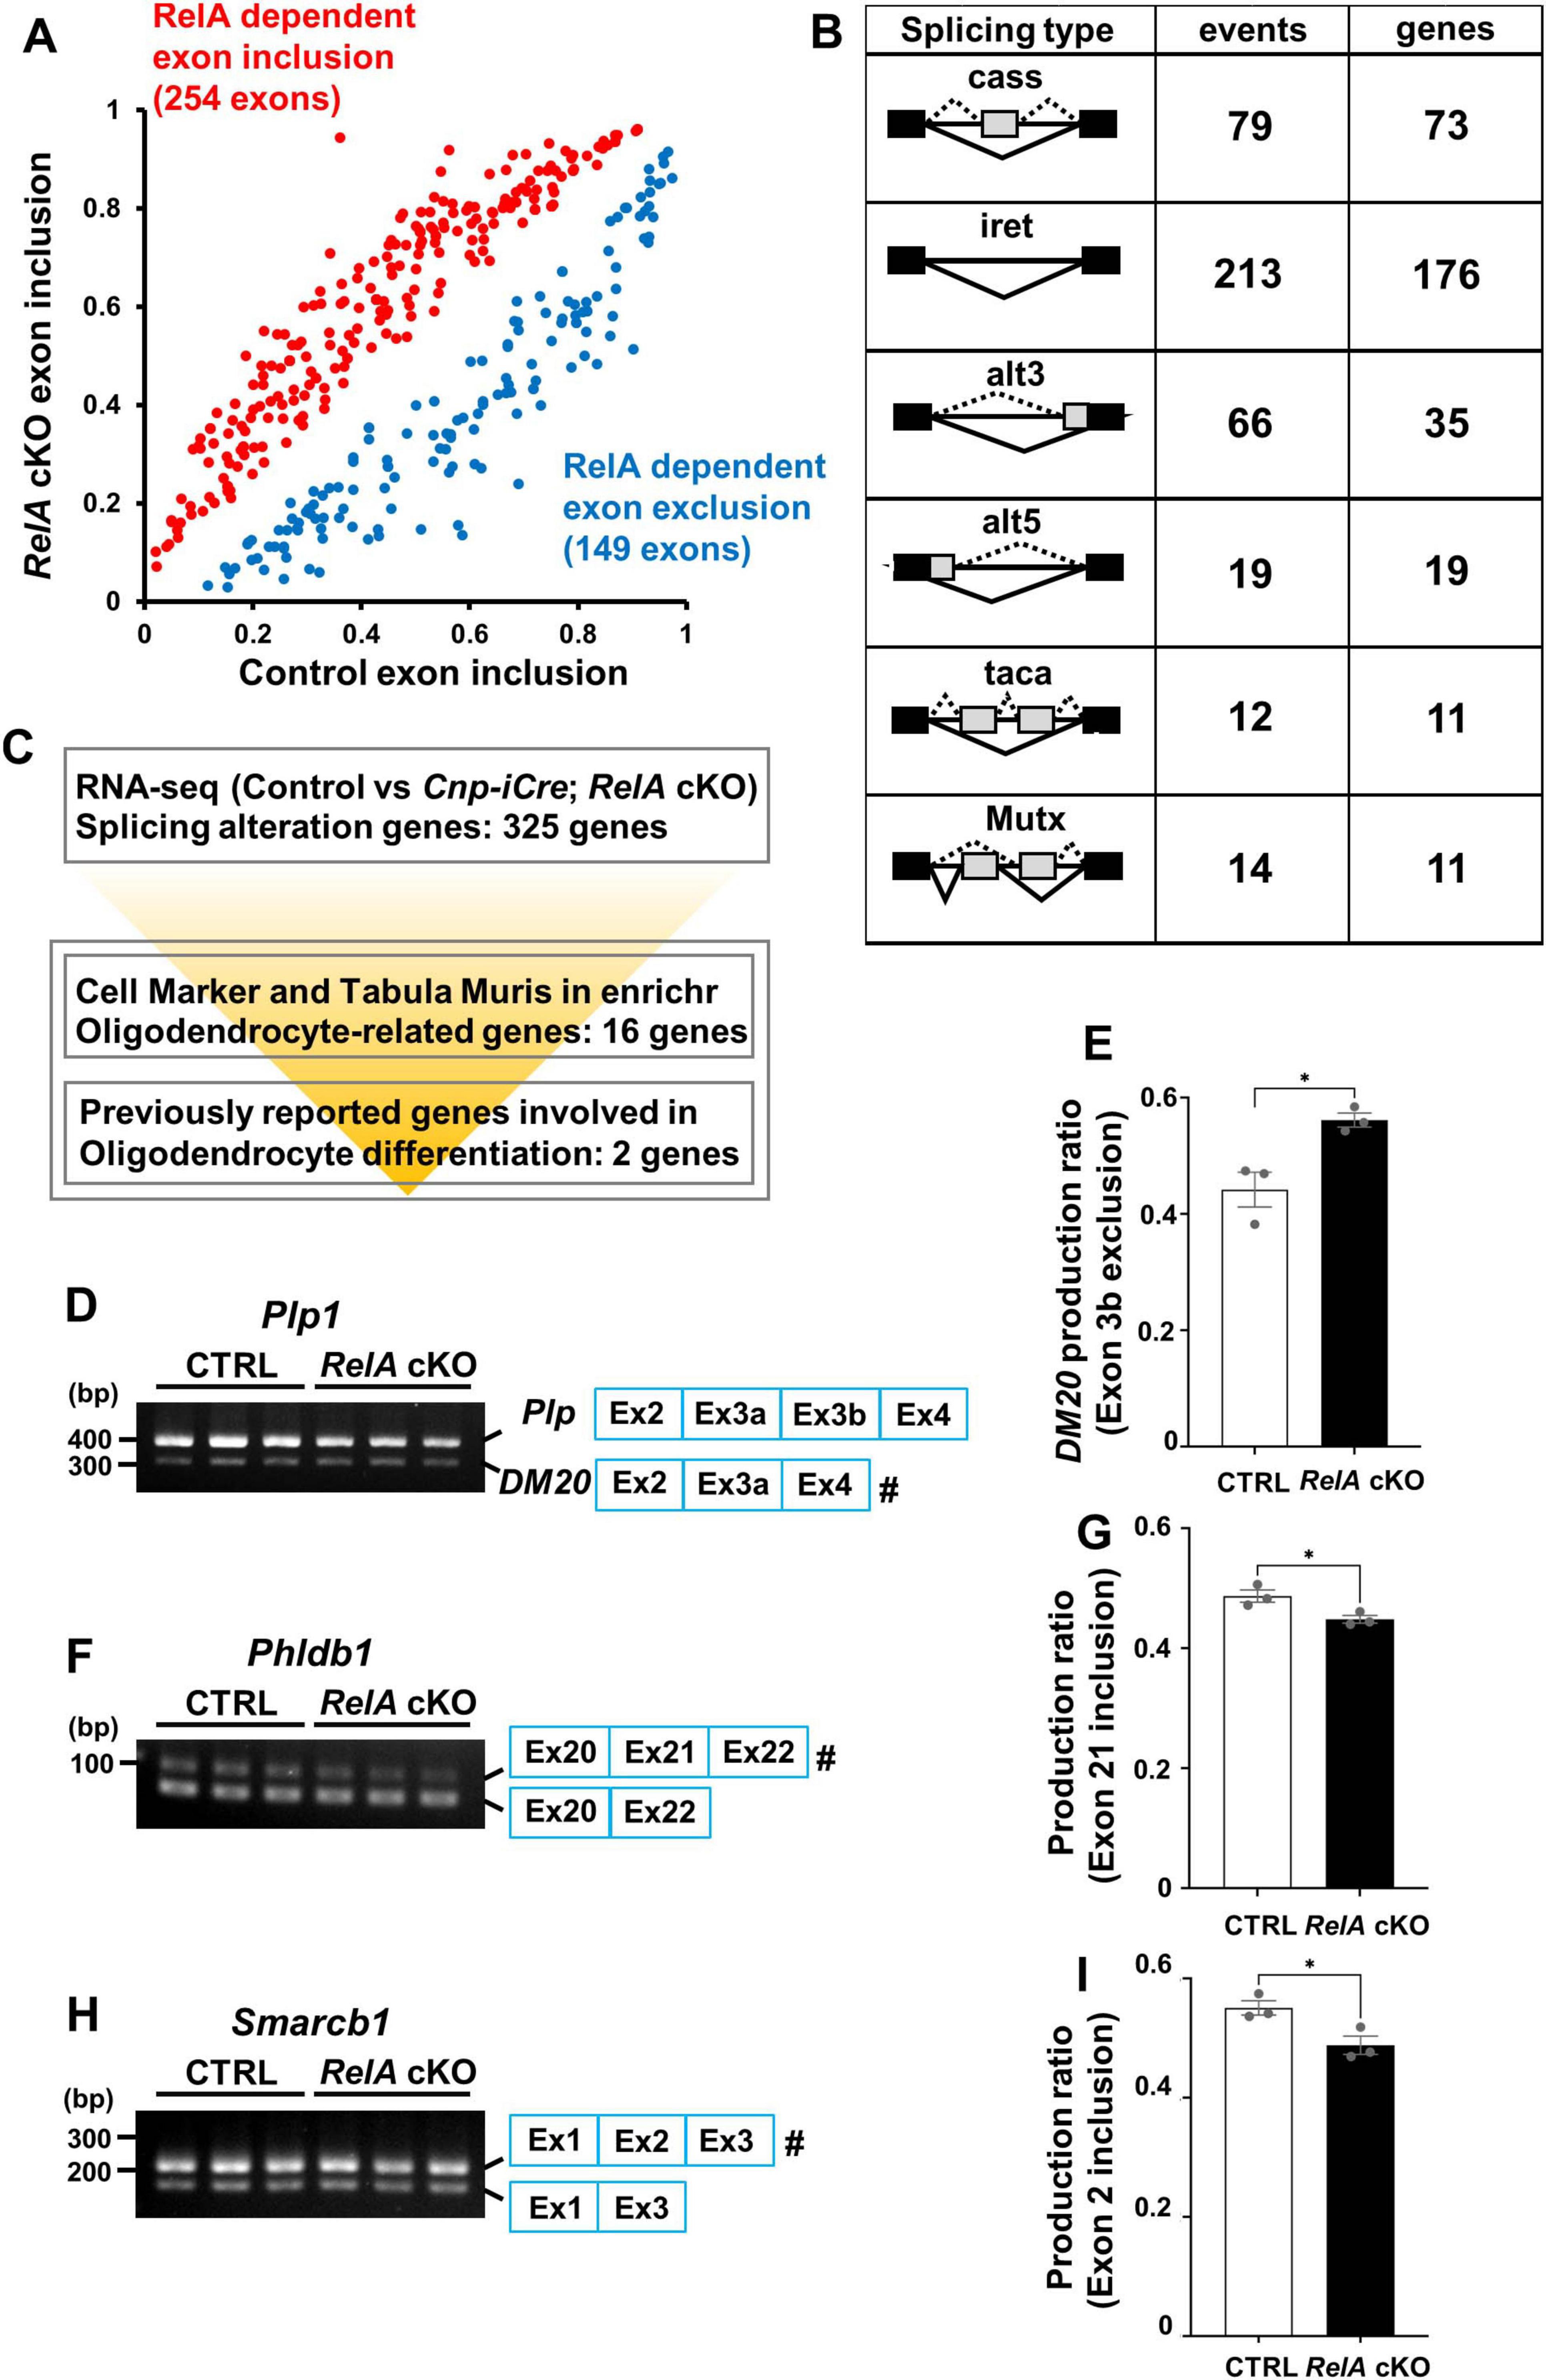
Figure 7. Alternative splicing alterations of oligodendrocyte-related genes in RelA-deficient mice. (A) Significant alternative splicing events identified from RNA–seq analysis of control and RelA cKO mice were visualized using a scatter plot based on percent spliced-in (PSI) values. Each data point represents the mean PSI value of an individual alternative splicing event, calculated from three independent biological replicates. (B) Diagram illustrating the patterns of alternative splicing dysregulation in cerebral cortices of RelA cKO mice. cass, cassette exon; taca, tandem cassette exon; Mutx, mutually exclusive exon; alt5, alternative 5’ site; alt3, alternative 3’ site; iret, intron retention. Black and gray boxes indicate the remaining exons and skipped exons, respectively, Solid and broken lines indicate the normal and abnormal splicing, respectively. The number of events or genes for splicing changes in RelA cKO mice is shown. (C) Overview of the screening workflow for alternative splicing alterations of oligodendrocyte-related genes in RelA cKO mice. (D–I) Semi-quantitative RT-PCR for the alternative splicing of Plp1, Phldb1, and Smarcb1 mRNA in control and RelA cKO mice at P14. n = 3 mice per group. Bar charts show the ratio of specific exon exclusion (Plp1 exon 3b, DM20) (E) or inclusion (Phldb1 exon 21 and Smarcb1 exon 2) (G,I). The hash key (#) indicates the band used for quantification: band density of the marked band was divided by the sum of densities for both bands (upper and lower bands). Bar charts represent the mean ± SEM. *p < 0.05. Signal intensities from electrophoretic bands were determined by densitometric measurement using ImageJ software.
4 Discussion
In this study, we found that RelA, a key subunit of the NF-κB transcription factor complex, plays a crucial role in regulating oligodendrocyte differentiation through the coordinated control of transcriptional and splicing mechanisms within specific temporal and spatial contexts. These findings encourage reevaluating the physiological significance of NF-κB signaling in oligodendrocyte differentiation, which has been previously underappreciated.
The involvement of NF-κB signaling in oligodendrocyte development and differentiation remains controversial, with conflicting findings reported in the literature. For example, clinical studies have shown that patients with copy number gains of the IKBKG gene (encoding NF-κB essential modulator, NEMO) exhibit reduced NF-κB activity alongside myelination defects (Philippe et al., 2013). Conversely, mouse model studies have demonstrated that activation of NF-κB signaling in the central nervous system (CNS) can protect oligodendrocytes from cell death and promote remyelination following demyelinating insults (Stone et al., 2017; Lei et al., 2020). On the other hand, a paucity of evidence indicates that inactivation of NF-κB signaling, including RelA deficiency, causes prominent oligodendrocyte abnormalities during normal development (Hilliard et al., 1999, 2002; van Loo et al., 2006; Raasch et al., 2011; Kretz et al., 2014). These weak loss-of-function phenotypes may be attributed to systemic or CNS-wide NF-κB knockout models. Because oligodendrocytes heavily rely on external signals from other neural cell types or cell-cell interactions during their differentiation and maturation. The global loss of NF-κB activity may result in a change in the surrounding microenvironment affecting oligodendrocytes. Therefore, phenotypes observed in nonspecific NF-κB-deficient models may not accurately reflect the cell-autonomous functions of NF-κB in oligodendrocytes. For instance, neuronal-derived factors such as neurotrophic signals, neurotransmitters, and electrical activity are known to promote OPC differentiation and myelination (Mount and Monje, 2017). Astrocyte-derived molecules, including trophic factors, GAP junction channels, thrombin inhibitors, and lipid supply, also contribute to oligodendrocyte differentiation, myelination, and remyelination (Camargo et al., 2017; Traiffort et al., 2020). Additionally, cytokines secreted by microglia [e.g., tumor necrosis factor alpha (TNFα), interleukin–1 beta (IL–1β), IL–6, interferon gamma (IFN-γ)] can either promote or inhibit OPC differentiation (Lombardi et al., 2019; Traiffort et al., 2020). In addition, reactive astrocytes secret negative regulators of oligodendrocyte differentiation, such as chemokines, adherent molecules, and proteoglycans (Traiffort et al., 2020). Thus, a complex physiological and pathological network of intercellular signals finely controls oligodendrocyte differentiation. Moreover, it is important to point out that compensation for transient delay in oligodendrocyte differentiation may occur at later stages. For example, IκBα-overexpressing mice were analyzed only at or after P21 (Stone et al., 2017). More refined analyses with spatiotemporal specificity are required to investigate the role of NF-κB signaling in the oligodendrocyte differentiation.
In this study, by employing RelA cKO mice in oligodendrocytes, we could directly evaluate the role of RelA in oligodendrocyte differentiation. Our results demonstrated that oligodendrocyte-specific RelA deficiency led to delayed differentiation, but this effect was limited in both its temporal window and affected brain regions. The oligodendrocyte phenotype was more pronounced in vitro, whereas in vivo changes were relatively modest. One possible explanation for this discrepancy is that other cell types, such as astrocytes and microglia, may partially compensate for the oligodendrocyte defect in vivo as described above. Because the timing and rate of oligodendrocyte differentiation vary across brain and spinal cord regions (Ozarkar et al., 2025), it is also possible that region-specific oligodendrocyte phenotypes were observed at the timing of analysis at P14, and then recovery occurred later stage at P21. As a third possible explanation, differences in the distribution of oligodendrocyte subtypes may underlie the different requirements for RelA in oligodendrocyte differentiation. Recent single-cell transcriptomic studies have classified mature oligodendrocytes into six distinct subgroups (MOL1–MOL6), each characterized by unique gene expression signatures (Marques et al., 2016).6 In these datasets, RelA expression is relatively high in MOL1, MOL2, and MOL6 and lower in MOL3–MOL5. Notably, in the corpus callosum of juvenile mice—where differentiation defects were evident in RelA cKO brain—MOL1 was predominant, whereas in the spinal dorsal horn and the somatosensory cortex—where no significant impairment was observed—MOL2–MOL5 were more prevalent. Although the distribution of oligodendrocyte subgroups in the secondary motor cortex remains unclear, it is plausible that regional differences in the abundance of RelA-high versus RelA-low subtypes influence the severity of the phenotypic outcome upon RelA deletion.
Several mechanisms are known to regulate the timing of oligodendrocyte differentiation. Nkx2.2 modulates the transition timing from OPCs to mature oligodendrocytes by directly regulating Pdgfra expression (Zhu et al., 2014). However, Pdgfra expression was not significantly affected by RelA deletion. Our RNA-seq data revealed a significant reduction in Padi2 expression, suggesting that Padi2 is one of the direct RelA-target genes. Padi2 encodes peptidyl arginine deiminase 2 (PAD2), which post-translationally modifies various proteins, including MBP (Wood et al., 2008). Padi2 cKO mice show a transient delay in oligodendrocyte differentiation during early postnatal stages, followed by normalization (Falcão et al., 2019), similar to RelA cKO mice. These findings support the possibility that a RelA–Padi2 axis plays a crucial role in controlling the timing of oligodendrocyte differentiation. Various upstream stimuli activate NF-κB, including pro-inflammatory cytokines such as IL-1β, TNFα, and IL-6, as well as developmental toolkit pathways like Notch and Wnt (Guo et al., 2024). Some factors promote oligodendrocyte differentiation, while others act as inhibitors (Wang et al., 1998; John et al., 2002; Shimizu et al., 2005; Fancy et al., 2009; Feigenson et al., 2009; Dai et al., 2014; Tran et al., 2023). Therefore, NF-κB may thus function as an integrative effector that reconciles these opposing signals to fine-tune oligodendrocyte development. This concept further supports the hypothesis that NF-κB/RelA plays a key role in regulating the timing of oligodendrocyte differentiation. We performed an in silico analysis based on known RelA-binding motifs to identify candidate oligodendrocyte-related target genes. However, whether these genes are direct RelA targets during oligodendrocyte differentiation remains to be determined. Although previous ChIP-seq analyses using cultured mouse astrocytes reported several candidate genes with high RelA-binding scores, including Sirt2 and Phldb1 (Nakano-Kobayashi et al., 2023),7 chromatin structure and accessibility for transcription factor in each locus vary significantly depending on the cell type and differentiation state, which limits the direct applicability of the data to oligodendrocyte lineage.
Our splicing analysis revealed that RelA deficiency resulted in aberrant splicing of several genes, such as Plp1, Phldb1, and Smarcb1. Interestingly, recent studies have shown that RelA also participates in alternative splicing regulation in addition to its canonical transcriptional activity (Ameur et al., 2020; Lee et al., 2020; Marie et al., 2024; Van Gelder et al., 2025). Specifically, RelA interacts with the splicing regulatory factor DEAD box protein 17 (DDX17) in an NF-κB-dependent manner, thereby modulating exon selection through the RNA helicase activity of DDX17 (Ameur et al., 2020). Notably, Plp1 splicing defects have also been observed in oligodendrocytes lacking Ddx20 (Simankova et al., 2021), raising the possibility that RelA and Ddx20 may functionally cooperate in the regulation of Plp1 splicing.
Continued activation of microglia and astrocytes was observed until postnatal day 21 (P21). However, oligodendrocyte differentiation appeared to recover at this stage, suggesting the persistence of subtle abnormalities in the RelA cKO brain. These observations provide important insights into the underlying neuropathology. Although oligodendrocyte differentiation was primarily evaluated based on the expression of lineage-specific markers, normalization of marker expression does not necessarily imply complete restoration of the ultrastructural integrity of myelin. Indeed, in Cnp-deficient mice, ultrastructural defects in myelin and axonal degeneration have been reported despite the absence of overt abnormalities in major myelin protein expression and were accompanied by microglial and astrocytic activation (Lappe-Siefke et al., 2003). Therefore, the sustained activation of microglia and astrocytes in RelA-deficient mice may reflect subtle and chronic disturbances in myelin architecture and axonal homeostasis, potentially due to abnormalities in Plp1/DM20 splicing (Stecca et al., 2000; Wang et al., 2008), highlighting the necessity of further ultrastructural and morphological analyses.
In conclusion, this study identifies RelA as a novel regulatory factor involved in the temporal control of oligodendrocyte differentiation. The precise timing of oligodendrocyte differentiation is essential for the proper formation and functional integration of neural circuits. Indeed, a transient delay in oligodendrocyte differentiation has also been reported in mice lacking discoidin domain receptor 1 (Ddr1), which exhibit neurological deficits such as reduced locomotor activity, muscle weakness, and impaired motor coordination (Mei et al., 2023). These findings suggest that the delayed oligodendrocyte differentiation observed in the cerebral cortex of RelA-deficient mice may similarly contribute to neural dysfunction.
Data availability statement
The datasets presented in this study can be found in online repositories. The names of the repository/repositories and accession number(s) can be found in this article, in the “Materials and methods” section.
Ethics statement
The animal study was approved by the Animal Research Committees of Niigata University. The study was conducted in accordance with the local legislation and institutional requirements.
Author contributions
KS: Data curation, Writing – review & editing, Investigation, Writing – original draft, Visualization, Formal Analysis. NB: Project administration, Formal Analysis, Writing – original draft, Methodology, Data curation, Conceptualization, Funding acquisition, Investigation, Visualization, Writing – review & editing. AB: Methodology, Writing – original draft, Writing – review & editing, Resources. HT: Conceptualization, Validation, Supervision, Project administration, Writing – review & editing, Methodology, Writing – original draft, Resources, Funding acquisition, Visualization.
Funding
The author(s) declare that financial support was received for the research and/or publication of this article. This work was supported by JSPS KAKENHI (Grant Nos. 21H02652, 23K24256 to HT, 20K07241 and 23K06300 to NB. This work was supported by the Shimizu Foundation for Immunology and Neuroscience to HT, the ONO Medical Research Foundation and Kobayashi Foundation to NB. This work was supported by Kyowakai foundation in Niigata University to KS. KS was supported by a MEXT scholarship.
Acknowledgments
We thank Kenji Sakimura and Manabu Abe for Cnp-iCre knockin mice and Kazuhiro Ikenaka for Plp1 plasmids. We greatly thank all members of the Takebayashi lab for helpful discussions, technical assistance, and secretarial assistance.
Conflict of interest
The authors declare that the research was conducted in the absence of any commercial or financial relationships that could be construed as a potential conflict of interest.
Generative AI statement
The authors declare that no Generative AI was used in the creation of this manuscript.
Publisher’s note
All claims expressed in this article are solely those of the authors and do not necessarily represent those of their affiliated organizations, or those of the publisher, the editors and the reviewers. Any product that may be evaluated in this article, or claim that may be made by its manufacturer, is not guaranteed or endorsed by the publisher.
Supplementary material
The Supplementary Material for this article can be found online at: https://www.frontiersin.org/articles/10.3389/fncel.2025.1622874/full#supplementary-material
Supplementary Figure 1 | Reduced expression of oligodendrocyte-related markers in the motor cortex and corpus callosum of RelA cKO mice at P14. (A–D) ISH analysis of Mog and Gpr17 mRNA expression in the secondary motor cortex and corpus callosum of control and RelA cKO mice at P14. (E,F) IHC analysis of CC1 expression in the secondary motor cortex and corpus callosum of control and RelA cKO mice at P14. (G) RT-qPCR analysis of Mog and Gpr17 mRNA levels in the cerebral cortex including hippocampus of control and RelA cKO mice at P14. n = 3 mice per genotype for all experiments. Bar charts represent the mean ± SEM. Statistical analysis was performed by two-tailed, unpaired t-test. *p < 0.05; **p < 0.01. Scale bars, 200 μm. Inset scale bars, 40 μm (A).
Supplementary Figure 2 | Recovery from delayed oligodendrocyte differentiation in the secondary motor cortex and corpus callosum of RelA-deficient mice at P21. (A–L) ISH analysis of Plp, Mbp, Mog, Gpr17, Enpp6, and Pdgfrα mRNA expression in the secondary motor cortex (A,C,E,G,I,K) and corpus callosum (B,D,F,H,J,L) of control and RelA cKO mice at P21. (M–P) IHC analysis of PLP and CC1 expression in the secondary motor cortex (M,O) and corpus callosum (N,P) of control and RelA cKO mice at P21. (Q) Immunofluorescence analysis of Olig1 and Olig2 expression in the secondary motor cortex of control and RelA cKO mice at P21. n = 3 mice per genotype for all experiments. Scale bars, 200 μm (A–P); 40 μm, Inset scale bars, 10 μm (Q).
Supplementary Figure 3 | RT-qPCR analysis of oligodendrocyte-related markers in the cerebral cortex including hippocampus of RelA cKO mice at P21. RT–qPCR analysis of Plp, Mbp, Mog, Gpr17, Enpp6, Olig2, and Olig1 mRNA levels in the cerebral cortex including hippocampus of control and RelA cKO mice at P21. n = 3 mice per genotype. Bar charts represent the mean ± SEM. Statistical analysis was performed by two-tailed, unpaired t-test. n.s., not significant.
Supplementary Figure 4 | Unaltered oligodendrocyte differentiation in the spinal cords of RelA cKO mice. (A–F) In situ hybridization (ISH) showing reduced mRNA expression of mature oligodendrocyte markers Mbp (A,D), Plp (B,E), Mog (C,F), in the spinal cords of RelA cKO mice compared to controls at P14 (A–C) and P21 (D–F). n = 3 mice per genotype. Scale bars, 200 μm.
Supplementary Figure 5 | Resional microglia activation in RelA-deficient mice at P14. Iba1 IHC in the coronal sections of control and RelA cKO brains at P14 (n = 3 mice per group). Scale bar, 500 μm.
Supplementary Figure 6 | Activation of astrocytes and microglia in RelA-deficient mice at P21. (A–C) IHC analysis of GFAP in the secondary motor cortex (A), hippocampus (B), and corpus callosum (C) of control and RelA cKO mice at P21. (D–F) IHC analysis of Iba1 in the secondary motor cortex (D), hippocampus (E), and corpus callosum (F) of control and RelA cKO mice at P21. (G–I) IHC analysis of NeuN in the secondary motor cortex (G), hippocampus (H), and corpus callosum (I) of control and RelA cKO mice at P21. (J) RT-qPCR analysis of Gfap and Aif1 (Iba1) mRNA levels in the cerebral cortex including hippocampus of RelA cKO mice compared to controls at P21. n = 3 mice per genotype for all experiments. Bar charts represent the mean ± SEM. Statistical analysis was performed by two-tailed, unpaired t-test. *p < 0.05; n.s., not significant. Scale bars, 200 μm. Inset scale bars, 40 μm.
Supplementary Figure 7 | Resolution of Plp1 splicing abnormalities in RelA cKO mice at P21. Semi-quantitative RT-PCR for the alternative splicing of Plp1 mRNA in control and RelA cKO mice at P21. n = 3 mice per group. Bar charts show the ratio of specific exon inclusion or exclusion in each mRNA. Bar charts represent the mean ± SEM. n.s., not significant. Signal intensities from electrophoretic bands were determined by densitometric measurement using ImageJ software.
Footnotes
2. ^https://david.ncifcrf.gov/summary.jsp
3. ^https://zhanglab.c2b2.columbia.edu/index.php/Quantas
4. ^https://maayanlab.cloud/Enrichr/
References
Ameur, L. B., Marie, P., Thenoz, M., Giraud, G., Combe, E., Claude, J.-B., et al. (2020). Intragenic recruitment of NF-κB drives splicing modifications upon activation by the oncogene Tax of HTLV-1. Nat. Commun. 11:3045. doi: 10.1038/s41467-020-16853-x
Arnett, H. A., Fancy, S. P., Alberta, J. A., Zhao, C., Plant, S. R., Kaing, S., et al. (2004). BHLH transcription factor Olig1 is required to repair demyelinated lesions in the CNS. Science 306, 2111–2115. doi: 10.1126/science.1103709
Baldwin, A. S. J. (2001). Series introduction: The transcription factor NF-kappaB and human disease. J. Clin. Invest. 107, 3–6. doi: 10.1172/JCI11891
Baskin, R., Woods, N. T., Mendoza-Fandiño, G., Forsyth, P., Egan, K. M., and Monteiro, A. N. (2015). Functional analysis of the 11q23.3 glioma susceptibility locus implicates PHLDB1 and DDX6 in glioma susceptibility. Sci. Rep. 5:17367. doi: 10.1038/srep17367
Bercury, K. K., and Macklin, W. B. (2015). Dynamics and mechanisms of CNS myelination. Dev. Cell 32, 447–458. doi: 10.1016/j.devcel.2015.01.016
Bizen, N., Bepari, A. K., Zhou, L., Abe, M., Sakimura, K., Ono, K., et al. (2022). Ddx20, an Olig2 binding factor, governs the survival of neural and oligodendrocyte progenitor cells via proper Mdm2 splicing and p53 suppression. Cell Death Differ. 29, 1028–1041. doi: 10.1038/s41418-021-00915-8
Bizen, N., Inoue, T., Shimizu, T., Tabu, K., Kagawa, T., and Taga, T. (2014). A growth-promoting signaling component cyclin D1 in neural stem cells has antiastrogliogenic function to execute self-renewal. Stem Cells 32, 1602–1615. doi: 10.1002/stem.1613
Boersma, M. C. H., Dresselhaus, E. C., De Biase, L. M., Mihalas, A. B., Bergles, D. E., and Meffert, M. K. (2011). A requirement for nuclear factor-kappaB in developmental and plasticity-associated synaptogenesis. J. Neurosci. 31, 5414–5425. doi: 10.1523/JNEUROSCI.2456-10.2011
Camargo, N., Goudriaan, A., van Deijk, A.-L. F., Otte, W. M., Brouwers, J. F., Lodder, H., et al. (2017). Oligodendroglial myelination requires astrocyte-derived lipids. PLoS Biol. 15:e1002605. doi: 10.1371/journal.pbio.1002605
Chen, E. Y., Tan, C. M., Kou, Y., Duan, Q., Wang, Z., Meirelles, G. V., et al. (2013). Enrichr: Interactive and collaborative HTML5 gene list enrichment analysis tool. BMC Bioinform. 14:128. doi: 10.1186/1471-2105-14-128
Chen, Y., Wang, H., Yoon, S. O., Xu, X., Hottiger, M. O., Svaren, J., et al. (2011). HDAC-mediated deacetylation of NF-κB is critical for Schwann cell myelination. Nat. Neurosci. 14, 437–441. doi: 10.1038/nn.2780
Dai, Z.-M., Sun, S., Wang, C., Huang, H., Hu, X., Zhang, Z., et al. (2014). Stage-specific regulation of oligodendrocyte development by Wnt/β-catenin signaling. J. Neurosci. 34, 8467–8473. doi: 10.1523/JNEUROSCI.0311-14.2014
Darbelli, L., Vogel, G., Almazan, G., and Richard, S. (2016). Quaking regulates neurofascin 155 expression for myelin and axoglial junction maintenance. J. Neurosci. 36, 4106–4120. doi: 10.1523/JNEUROSCI.3529-15.2016
Dobin, A., Davis, C. A., Schlesinger, F., Drenkow, J., Zaleski, C., Jha, S., et al. (2013). STAR: Ultrafast universal RNA-seq aligner. Bioinformatics 29, 15–21. doi: 10.1093/bioinformatics/bts635
Dolcet, X., Llobet, D., Pallares, J., and Matias-Guiu, X. (2005). NF-kB in development and progression of human cancer. Virchows Arch. 446, 475–482. doi: 10.1007/s00428-005-1264-9
Elbaz, B., and Popko, B. (2019). Molecular control of oligodendrocyte development. Trends Neurosci. 42, 263–277. doi: 10.1016/j.tins.2019.01.002
Falcão, A. M., Meijer, M., Scaglione, A., Rinwa, P., Agirre, E., Liang, J., et al. (2019). PAD2-Mediated citrullination contributes to efficient oligodendrocyte differentiation and myelination. Cell Rep. 27, 1090–1102.e10. doi: 10.1016/j.celrep.2019.03.108.
Fancy, S. P. J., Baranzini, S. E., Zhao, C., Yuk, D.-I., Irvine, K.-A., Kaing, S., et al. (2009). Dysregulation of the Wnt pathway inhibits timely myelination and remyelination in the mammalian CNS. Genes Dev. 23, 1571–1585. doi: 10.1101/gad.1806309
Feigenson, K., Reid, M., See, J., Crenshaw, E. B. III, and Grinspan, J. B. (2009). Wnt signaling is sufficient to perturb oligodendrocyte maturation. Mol. Cell. Neurosci. 42, 255–265. doi: 10.1016/j.mcn.2009.07.010
Guo, Q., Jin, Y., Chen, X., Ye, X., Shen, X., Lin, M., et al. (2024). NF-κB in biology and targeted therapy: New insights and translational implications. Signal Transduct. Target. Ther. 9:53. doi: 10.1038/s41392-024-01757-9
Hayakawa-Yano, Y., Suyama, S., Nogami, M., Yugami, M., Koya, I., Furukawa, T., et al. (2017). An RNA-binding protein, Qki5, regulates embryonic neural stem cells through pre-mRNA processing in cell adhesion signaling. Genes Dev. 31, 1910–1925. doi: 10.1101/gad.300822.117
He, L., and Lu, Q. R. (2013). Coordinated control of oligodendrocyte development by extrinsic and intrinsic signaling cues. Neurosci. Bull. 29, 129–143. doi: 10.1007/s12264-013-1318-y
Hilliard, B., Samoilova, E. B., Liu, T. S., Rostami, A., and Chen, Y. (1999). Experimental autoimmune encephalomyelitis in NF-kappa B-deficient mice: Roles of NF-kappa B in the activation and differentiation of autoreactive T cells. J. Immunol. 163, 2937–2943. doi: 10.4049/jimmunol.163.5.2937
Hilliard, B. A., Mason, N., Xu, L., Sun, J., Lamhamedi-Cherradi, S.-E., Liou, H.-C., et al. (2002). Critical roles of c-Rel in autoimmune inflammation and helper T cell differentiation. J. Clin. Invest. 110, 843–850. doi: 10.1172/JCI15254
Horie, M., Mekada, K., Sano, H., Kikkawa, Y., Chiken, S., Someya, T., et al. (2016). Characterization of novel dystonia musculorum mutant mice: Implications for central nervous system abnormality. Neurobiol. Dis. 96, 271–283. doi: 10.1016/j.nbd.2016.09.016
Huang, D. W., Sherman, B. T., and Lempicki, R. A. (2009). Systematic and integrative analysis of large gene lists using DAVID bioinformatics resources. Nat. Protoc. 4, 44–57. doi: 10.1038/nprot.2008.211
Iwashita, T., Kruger, G. M., Pardal, R., Kiel, M. J., and Morrison, S. J. (2003). Hirschsprung disease is linked to defects in neural crest stem cell function. Science 301, 972–976. doi: 10.1126/science.1085649
John, G. R., Shankar, S. L., Shafit-Zagardo, B., Massimi, A., Lee, S. C., Raine, C. S., et al. (2002). Multiple sclerosis: Re-expression of a developmental pathway that restricts oligodendrocyte maturation. Nat. Med. 8, 1115–1121. doi: 10.1038/nm781
Kagawa, T., Ikenaka, K., Inoue, Y., Kuriyama, S., Tsujii, T., Nakao, J., et al. (1994). Glial cell degeneration and hypomyelination caused by overexpression of myelin proteolipid protein gene. Neuron 13, 427–442. doi: 10.1016/0896-6273(94)90358-1
Karin, M., and Lin, A. (2002). NF-kappaB at the crossroads of life and death. Nat. Immunol. 3, 221–227. doi: 10.1038/ni0302-221
Kretz, A., Herrmann, K.-H., Fischer, S., Engelmann, C., Witte, O. W., Reichenbach, J. R., et al. (2014). Dysfunctional NF-κB and brain myelin formation. Eur. J. Hum. Genet. 22, 724–725. doi: 10.1038/ejhg.2013.240
Krieger, K., Millar, S. E., Mikuda, N., Krahn, I., Kloepper, J. E., Bertolini, M., et al. (2018). NF-κB participates in mouse hair cycle control and plays distinct roles in the various pelage hair follicle types. J. Invest. Dermatol. 138, 256–264. doi: 10.1016/j.jid.2017.08.042
Kyrargyri, V., Vega-Flores, G., Gruart, A., Delgado-García, J. M., and Probert, L. (2015). Differential contributions of microglial and neuronal IKKβ to synaptic plasticity and associative learning in alert behaving mice. Glia 63, 549–566. doi: 10.1002/glia.22756
Lappe-Siefke, C., Goebbels, S., Gravel, M., Nicksch, E., Lee, J., Braun, P. E., et al. (2003). Disruption of Cnp1 uncouples oligodendroglial functions in axonal support and myelination. Nat. Genet. 33, 366–374. doi: 10.1038/ng1095
Lee, F. F.-Y., Davidson, K., Harris, C., McClendon, J., Janssen, W. J., and Alper, S. (2020). NF-κB mediates lipopolysaccharide-induced alternative pre-mRNA splicing of MyD88 in mouse macrophages. J. Biol. Chem. 295, 6236–6248. doi: 10.1074/jbc.RA119.011495
Lee, Y., Morrison, B. M., Li, Y., Lengacher, S., Farah, M. H., Hoffman, P. N., et al. (2012). Oligodendroglia metabolically support axons and contribute to neurodegeneration. Nature 487, 443–448. doi: 10.1038/nature11314
Lei, Z., Yue, Y., Stone, S., Wu, S., and Lin, W. (2020). NF-κB activation accounts for the cytoprotective effects of PERK activation on oligodendrocytes during EAE. J. Neurosci. 40, 6444–6456. doi: 10.1523/JNEUROSCI.1156-20.2020
Li, B., and Dewey, C. N. (2011). RSEM: Accurate transcript quantification from RNA-Seq data with or without a reference genome. BMC Bioinform. 12:323. doi: 10.1186/1471-2105-12-323
Lombardi, M., Parolisi, R., Scaroni, F., Bonfanti, E., Gualerzi, A., Gabrielli, M., et al. (2019). Detrimental and protective action of microglial extracellular vesicles on myelin lesions: Astrocyte involvement in remyelination failure. Acta Neuropathol. 138, 987–1012. doi: 10.1007/s00401-019-02049-1
Marie, P., Bazire, M., Ladet, J., Ameur, L. B., Chahar, S., Fontrodona, N., et al. (2024). Gene-to-gene coordinated regulation of transcription and alternative splicing by 3D chromatin remodeling upon NF-κB activation. Nucleic Acids Res. 52, 1527–1543. doi: 10.1093/nar/gkae015
Marques, S., Zeisel, A., Codeluppi, S. van Bruggen, D. Mendanha Falcão, A., Xiao, L., et al. (2016). Oligodendrocyte heterogeneity in the mouse juvenile and adult central nervous system. Science 352, 1326–1329. doi: 10.1126/science.aaf6463
Mei, R., Qiu, W., Yang, Y., Xu, S., Rao, Y., Li, Q., et al. (2023). Evidence that DDR1 promotes oligodendrocyte differentiation during development and myelin repair after injury. Int. J. Mol. Sci. 24:10318. doi: 10.3390/ijms241210318
Mot, A. I., Depp, C., and Nave, K.-A. (2018). An emerging role of dysfunctional axon-oligodendrocyte coupling in neurodegenerative diseases. Dial. Clin. Neurosci. 20, 283–292. doi: 10.31887/dcns.2018.20.4/amot
Mount, C. W., and Monje, M. (2017). Wrapped to adapt: Experience-Dependent myelination. Neuron 95, 743–756. doi: 10.1016/j.neuron.2017.07.009
Nakano-Kobayashi, A., Canela, A., Yoshihara, T., and Hagiwara, M. (2023). Astrocyte-targeting therapy rescues cognitive impairment caused by neuroinflammation via the Nrf2 pathway. Proc. Natl. Acad. Sci. U. S. A. 120:e2303809120. doi: 10.1073/pnas.2303809120
Nave, K.-A. (2010). Myelination and support of axonal integrity by glia. Nature 468, 244–252. doi: 10.1038/nature09614
Ng, J. M., Martinez, D., Marsh, E. D., Zhang, Z., Rappaport, E., Santi, M., et al. (2015). Generation of a mouse model of atypical teratoid/rhabdoid tumor of the central nervous system through combined deletion of Snf5 and p53. Cancer Res. 75, 4629–4639. doi: 10.1158/0008-5472.CAN-15-0874
Ozarkar, S. S., Patel, R. K. R., Vulli, T., Friar, C. A., Burette, A. C., and Philpot, B. D. (2025). Regional analysis of myelin basic protein across postnatal brain development of C57BL/6J mice. Front. Neuroanat. 19:1535745. doi: 10.3389/fnana.2025.1535745
Philippe, O., Rio, M., Malan, V., Van Esch, H., Baujat, G., Bahi-Buisson, N., et al. (2013). NF-κB signalling requirement for brain myelin formation is shown by genotype/MRI phenotype correlations in patients with Xq28 duplications. Eur. J. Hum. Genet. 21, 195–199. doi: 10.1038/ejhg.2012.140
Pinyomahakul, J., Ise, M., Kawamura, M., Yamada, T., Okuyama, K., Shibata, S., et al. (2024). Analysis of brain, blood, and testis phenotypes lacking the Vps13a gene in C57BL/6N mice. Int. J. Mol. Sci. 25:7776. doi: 10.3390/ijms25147776
Raasch, J., Zeller, N., van Loo, G., Merkler, D., Mildner, A., Erny, D., et al. (2011). IkappaB kinase 2 determines oligodendrocyte loss by non-cell-autonomous activation of NF-kappaB in the central nervous system. Brain 134, 1184–1198. doi: 10.1093/brain/awq359
Robinson, M. D., McCarthy, D. J., and Smyth, G. K. (2010). edgeR: A bioconductor package for differential expression analysis of digital gene expression data. Bioinformatics 26, 139–140. doi: 10.1093/bioinformatics/btp616
Rowitch, D. H., and Kriegstein, A. R. (2010). Developmental genetics of vertebrate glial-cell specification. Nature 468, 214–222. doi: 10.1038/nature09611
Sandelin, A., Alkema, W., Engström, P., Wasserman, W. W., and Lenhard, B. (2004). JASPAR: An open-access database for eukaryotic transcription factor binding profiles. Nucleic Acids Res. 32, D91–D94. doi: 10.1093/nar/gkh012
Shimizu, T., Kagawa, T., Wada, T., Muroyama, Y., Takada, S., and Ikenaka, K. (2005). Wnt signaling controls the timing of oligodendrocyte development in the spinal cord. Dev. Biol. 282, 397–410. doi: 10.1016/j.ydbio.2005.03.020
Sidman, R. L., Dickie, M. M., and Appel, S. H. (1964). Mutant mice (Quaking and Jimpy) with deficient myelination in the central nervous system. Science 144, 309–311. doi: 10.1126/science.144.3616.309
Simankova, A., Bizen, N., Saitoh, S., Shibata, S., Ohno, N., Abe, M., et al. (2021). Ddx20, DEAD box helicase 20, is essential for the differentiation of oligodendrocyte and maintenance of myelin gene expression. Glia 69, 2559–2574. doi: 10.1002/glia.24058
Stecca, B., Southwood, C. M., Gragerov, A., Kelley, K. A., Friedrich, V. L. J., and Gow, A. (2000). The evolution of lipophilin genes from invertebrates to tetrapods: DM-20 cannot replace proteolipid protein in CNS myelin. J. Neurosci. 20, 4002–4010. doi: 10.1523/JNEUROSCI.20-11-04002.2000
Steinbrecher, K. A., Harmel-Laws, E., Sitcheran, R., and Baldwin, A. S. (2008). Loss of epithelial RelA results in deregulated intestinal proliferative/apoptotic homeostasis and susceptibility to inflammation. J. Immunol. 180, 2588–2599. doi: 10.4049/jimmunol.180.4.2588
Stone, S., Jamison, S., Yue, Y., Durose, W., Schmidt-Ullrich, R., and Lin, W. (2017). NF-κB activation protects oligodendrocytes against inflammation. J. Neurosci. 37, 9332–9344. doi: 10.1523/JNEUROSCI.1608-17.2017
Tabula Muris and Consortium (2018). Single-cell transcriptomics of 20 mouse organs creates a tabula muris. Nature 562, 367–372. doi: 10.1038/s41586-018-0590-4
Takebayashi, H., and Ikenaka, K. (2015). Oligodendrocyte generation during mouse development. Glia 63, 1350–1356. doi: 10.1002/glia.22863
Traiffort, E., Kassoussi, A., Zahaf, A., and Laouarem, Y. (2020). Astrocytes and microglia as major players of myelin production in normal and pathological conditions. Front. Cell. Neurosci. 14:79. doi: 10.3389/fncel.2020.00079
Tran, L. N., Loew, S. K., and Franco, S. J. (2023). Notch signaling plays a dual role in regulating the neuron-to-oligodendrocyte switch in the developing dorsal forebrain. J. Neurosci. 43, 6854–6871. doi: 10.1523/JNEUROSCI.0144-23.2023
Tronche, F., Kellendonk, C., Kretz, O., Gass, P., Anlag, K., Orban, P. C., et al. (1999). Disruption of the glucocorticoid receptor gene in the nervous system results in reduced anxiety. Nat. Genet. 23, 99–103. doi: 10.1038/12703
Van Gelder, R. D., Gokhale, N. S., Genoyer, E., Omelia, D. S., Anderson, S. K., Young, H. A., et al. (2025). Interleukin-2-mediated NF-κB-dependent mRNA splicing modulates interferon gamma protein production. EMBO Rep. 26, 16–35. doi: 10.1038/s44319-024-00324-1
van Loo, G., De Lorenzi, R., Schmidt, H., Huth, M., Mildner, A., Schmidt-Supprian, M., et al. (2006). Inhibition of transcription factor NF-kappaB in the central nervous system ameliorates autoimmune encephalomyelitis in mice. Nat. Immunol. 7, 954–961. doi: 10.1038/ni1372
Viana-Pereira, M., Moreno, D. A., Linhares, P., Amorim, J., Nabiço, R., Costa, S., et al. (2020). Replication of GWAS identifies RTEL1, CDKN2A/B, and PHLDB1 SNPs as risk factors in Portuguese gliomas patients. Mol. Biol. Rep. 47, 877–886. doi: 10.1007/s11033-019-05178-8
Wang, E., Dimova, N., Sperle, K., Huang, Z., Lock, L., McCulloch, M. C., et al. (2008). Deletion of a splicing enhancer disrupts PLP1/DM20 ratio and myelin stability. Exp. Neurol. 214, 322–330. doi: 10.1016/j.expneurol.2008.09.001
Wang, S., Sdrulla, A. D., diSibio, G., Bush, G., Nofziger, D., Hicks, C., et al. (1998). Notch receptor activation inhibits oligodendrocyte differentiation. Neuron 21, 63–75. doi: 10.1016/s0896-6273(00)80515-2
Wingender, E., Chen, X., Hehl, R., Karas, H., Liebich, I., Matys, V., et al. (2000). TRANSFAC: An integrated system for gene expression regulation. Nucleic Acids Res. 28, 316–319. doi: 10.1093/nar/28.1.316
Wood, D. D., Ackerley, C. A., van den Brand, B., Zhang, L., Raijmakers, R., Mastronardi, F. G., et al. (2008). Myelin localization of peptidylarginine deiminases 2 and 4: Comparison of PAD2 and PAD4 activities. Lab. Invest. 88, 354–364. doi: 10.1038/labinvest.3700748
Wu, J., Anczuków, O., Krainer, A. R., Zhang, M. Q., and Zhang, C. (2013). OLego: Fast and sensitive mapping of spliced mRNA-Seq reads using small seeds. Nucleic Acids Res. 41, 5149–5163. doi: 10.1093/nar/gkt216
Yamamura, T., Konola, J. T., Wekerle, H., and Lees, M. B. (1991). Monoclonal antibodies against myelin proteolipid protein: Identification and characterization of two major determinants. J. Neurochem. 57, 1671–1680. doi: 10.1111/j.1471-4159.1991.tb06367.x
Yamanishi, E., Yoon, K., Alberi, L., Gaiano, N., and Mizutani, K. (2015). NF-κB signaling regulates the generation of intermediate progenitors in the developing neocortex. Genes Cells 20, 706–719. doi: 10.1111/gtc.12267
Yan, J., and Greer, J. M. (2008). NF-kappa B, a potential therapeutic target for the treatment of multiple sclerosis. CNS Neurol. Disord. Drug Targets 7, 536–557. doi: 10.2174/187152708787122941
Yoshino, J. E., Dinneen, M. P., Sprinkle, T. J., and DeVries, G. H. (1985). Localization of 2’,3’-cyclic nucleotide 3’-phosphodiesterase on cultured Schwann cells. Brain Res. 325, 199–203. doi: 10.1016/0006-8993(85)90316-6
Zhang, X., Lan, Y., Xu, J., Quan, F., Zhao, E., Deng, C., et al. (2019). CellMarker: A manually curated resource of cell markers in human and mouse. Nucleic Acids Res. 47, D721–D728. doi: 10.1093/nar/gky900
Zhang, Y., Reichel, J. M., Han, C., Zuniga-Hertz, J. P., and Cai, D. (2017). Astrocytic process plasticity and IKKβ/NF-κB in central control of blood glucose, blood pressure, and body weight. Cell Metab. 25, 1091–1102.e4. doi: 10.1016/j.cmet.2017.04.002.
Zhou, X., He, C., Ren, J., Dai, C., Stevens, S. R., Wang, Q., et al. (2020). Mature myelin maintenance requires Qki to coactivate PPARβ-RXRα-mediated lipid metabolism. J. Clin. Invest. 130, 2220–2236. doi: 10.1172/JCI131800
Zhou, X., Shin, S., He, C., Zhang, Q., Rasband, M. N., Ren, J., et al. (2021). Qki regulates myelinogenesis through Srebp2-dependent cholesterol biosynthesis. Elife 10:e60467. doi: 10.7554/eLife.60467
Zhu, Q., Zhao, X., Zheng, K., Li, H., Huang, H., Zhang, Z., et al. (2014). Genetic evidence that Nkx2.2 and Pdgfra are major determinants of the timing of oligodendrocyte differentiation in the developing CNS. Development 141, 548–555. doi: 10.1242/dev.095323
Keywords: oligodendrocyte, differentiation, RelA/p65, NF–κB transcription factor, Splicing
Citation: Sompub K, Bizen N, Baldwin AS and Takebayashi H (2025) NF-κB RelA regulates temporal oligodendrocyte differentiation in the postnatal brains. Front. Cell. Neurosci. 19:1622874. doi: 10.3389/fncel.2025.1622874
Received: 04 May 2025; Accepted: 23 June 2025;
Published: 22 July 2025.
Edited by:
Kyoji Ohyama, Tokyo Medical University, JapanReviewed by:
Mingzi Zhang, University of Southern California, United StatesSeiji Hitoshi, Shiga University of Medical Science, Japan
Copyright © 2025 Sompub, Bizen, Baldwin and Takebayashi. This is an open-access article distributed under the terms of the Creative Commons Attribution License (CC BY). The use, distribution or reproduction in other forums is permitted, provided the original author(s) and the copyright owner(s) are credited and that the original publication in this journal is cited, in accordance with accepted academic practice. No use, distribution or reproduction is permitted which does not comply with these terms.
*Correspondence: Norihisa Bizen, Yml6ZW5AbWVkLm5paWdhdGEtdS5hYy5qcA==; Hirohide Takebayashi, dGFrZWJheWFzaGkuaGlyb2hpZGUuNmlAa3lvdG8tdS5hYy5qcA==