 Priyanka D. Bhoyar
 Prashant M. Gade
- 1Department of Physics, S.K. Porwal College of Arts, Science and Commerce, Rashtrasant Tukadoji Maharaj Nagpur University, Nagpur, India
- 2Department of Physics, Rashtrasant Tukadoji Maharaj Nagpur University, Nagpur, India
Power-law behavior frequently emerges in physical, biological, and social systems, particularly near continuous phase transitions characterized by diverging correlation lengths and universal scaling. The contact process is a prototypical model for studying absorbing-state phase transitions, typically belonging to the directed percolation (DP) universality class in its clean form. In this study, we investigate how quenched disorder influences the absorbing-state transition of the contact process on a one-dimensional comb lattice, a minimal geometry that incorporates structural inhomogeneity while remaining analytically and computationally tractable. In our model, activity spreads over a fraction of the branches q and is blocked in the rest. Without disorder, the system belongs to the directed percolation (DP) universality class. Introducing quenched disorder leads to significant changes in the critical dynamics. For q≤0.15, the system develops a Griffiths phase characterized by algebraic decay away from the critical point and logarithmic scaling at criticality, indicating a transition to the activated scaling universality class. In contrast, for q>0.15, the contact process on the comb lattice shows power-law decay of the order parameter only at the critical point, demonstrating a clean transition with standard critical dynamics and no extended Griffiths region. The results show that quenched disorder induces non-universal slow dynamics for small q, while larger values of q suppress the disorder-driven effects, restoring standard DP-like criticality. This transition underscores the role of lattice geometry and disorder strength in shaping nonequilibrium phase transitions.
1 Introduction
The continuous phase transitions from a fluctuating phase to an absorbing state in nonequilibrium systems have garnered significant attention over the years. Once the system reaches the absorbing state, it cannot escape it. These transitions are classified into various universality classes, with the directed percolation (DP) universality class being the most prominent (Henkel, 2008). The ubiquity of the DP behavior was independently conjectured by Grassberger (1981) and Janssen (1981), where any system with a single absorbing state, a single-order parameter, short-range interaction in time and space, no translational invariance, and an absence of multicritical points invariably falls into the DP universality class. The order parameter follows conventional power-law scaling behavior only at the critical point. Below this, the order parameter decays exponentially to the absorbing state. Above the critical point, the order parameter attains a steady, non-zero value. The characteristic critical exponents of the one-dimentional DP universality class are
However, the experimental realization of the DP universality class is limited, requiring an extreme fine-tuning of parameters. In real systems, inhomogeneity and intrinsic defects can significantly influence critical behavior, often causing the system to deviate from DP universality. According to Harris criterion, the quenched disorder is a relevant perturbation if the spatial correlation length exponent satisfies the relation
Vojta (2006) provided a comprehensive review, including nonequilibrium systems, and provided a theoretical foundation and understanding of the change of universality class in disordered systems, leading to the Griffiths phase. The concept of the Griffiths phase was first introduced by R. B. Griffiths in 1969 within the framework of equilibrium statistical mechanics (Griffiths, 1969). In the context of nonequilibrium systems undergoing absorbing state transitions, such as the contact process, the Griffiths phase originates as an effect of the presence of rare regions. These locally ordered regions can persist near the critical point, even when the overall system remains disordered. Thus, activity may prevail in the rare region, although the system is globally in the absorbing phase. This leads to a power-law decay in a range of parameters in the absorbing phase. This power-law exponent can be complex. Griffiths phase with a generic complex critical exponent was reported in our earlier work (Bhoyar and Gade, 2020; 2021). Logarithmic periodic oscillations are observed over and above the usual power laws obtained over a parametric range. We refer to this parameter range as the complex Griffiths phase.
Here, we study the dynamic behavior of the contact process on a comb lattice with topological disorder. The contact process is a basic stochastic model in the DP class, which is widely used to describe the spread of activity such as epidemics, forest fires, and opinions (Pastor-Satorras and Vespignani, 2001; Henkel, 2008; Ódor, 2000). A one-dimentional comb can be thought of as an infinite backbone chain with finite side branches attached at each site. Extending this idea, a two-dimentional comb is built by attaching a chain at every point along the backbone. In our case, since the side branches have finite lengths, the system effectively behaves like a one-dimentional structure.
The comb lattice is an anisotropic geometry that is often used to model branched or polymer-like systems. It has been applied to problems such as anomalous transport (Méndez et al., 2015), drug diffusion in biological tissues (Marsh et al., 2008), and materials with dendritic or branched structures (Frauenrath, 2005). Its geometry leads to subdiffusive motion along the backbone as particles are temporarily trapped in the branches. Bénichou et al. (2015) showed that a tracer particle in such a lattice exhibits subdiffusion along the backbone, with normal diffusion restored at longer times. In Shang’s studies of the hierarchical lattice, the different sites are connected, with a probability dependent on the distance between the sites. In one study, it decays as a power law with distance. In another, the connections are also dependent on the weights assigned to each vertex. The exact thresholds for critical percolation are obtained in both cases. We do not consider distance-dependent connections or connections dependent on weights assigned to each vertex. Instead, we consider a nearest-neighbor connection on the comb lattice. We study the contact process, which is a time-dependent nonequilibrium phenomenon rather than simple geometric percolation.
Geometry-induced slow dynamics and anisotropic spreading are closely linked to changes in scaling behavior seen in many systems. Moreover, introducing quenched disorder in the form of random but fixed variations in branch length or spacing can model structural heterogeneities found in real materials. Examples include irregular dendritic structures in biology, uneven branching in porous rocks, and imperfections in microfluidic devices. Studying quenched disorder helps us understand how structural variability affects transport, diffusion, and search processes in such systems. The inhomogeneity and anisotropic connectivity of the comb lattice introduce naturally slow dynamics, which are further enhanced when quenched topological disorder is introduced. In our model, the activity is allowed in only a fraction of the branches
2 Model and simulation
We investigate the critical behavior of the contact process on a one-dimentional comb lattice, a comb structure composed of a backbone of length L and teeth (or branches) of finite length K. We consider the cellular automaton model of the contact process proposed by Domany and Kinzel (1984). The state of each site at time t is represented by
The update rules are symmetric: a site can be activated if either of its neighboring sites is active. To explore the effect of quenched disorder, we introduce topological defects into the lattice by randomly allowing activity in the
We initialize the system with a random configuration, where half the lattice sites are set as active by using a pseudo-random number generator. Figure 1 illustrates the comb lattice. The horizontal axis
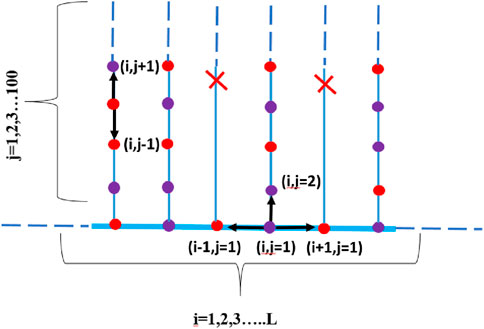
Figure 1. One-dimensional comb lattice of length L with a finite branch length K. The active and inactive sites are represented by red and purple dots, respectively, while the arrows indicate possible interaction pathways. The branch marked with a red cross corresponds to an inactive branch, illustrating quenched disorder.
and
It should be noted that
All simulations are carried out on a comb lattice having a backbone length of
3 Results and discussion
3.1 q = 0 and q = 1
Let us first consider the two simple cases that are expected to belong to the DP universality class:
Case (i)
Here, all the branches are blocked. Activity is confined only to the backbone. As a result, the comb lattice is a one-dimentional lattice of length L with symmetric nearest-neighbor connections. The system undergoes a continuous phase transition from the fluctuating phase to the absorbing phase at the critical activation probability
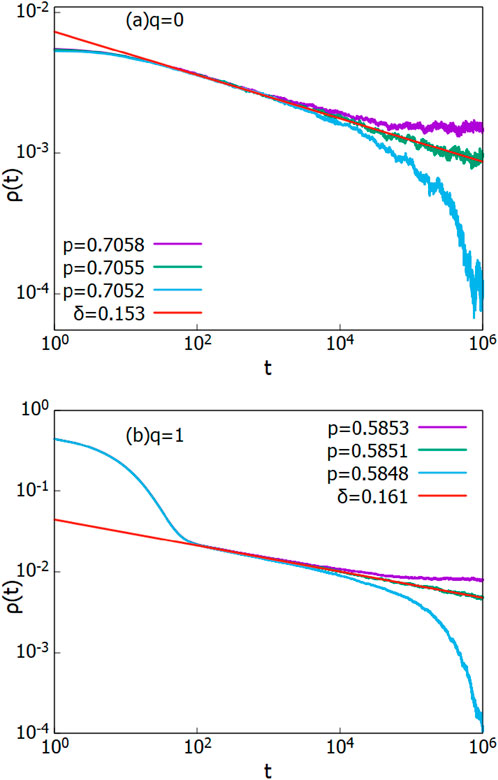
Figure 2. Time evolution of the order parameter
Case (ii)
In this case, none of the branches are blocked. The comb lattice resembles a rectangular lattice of finite width. Each branch site is connected to one neighboring site above and below, while each site on the backbone has symmetric connections to its lateral neighbors and a connection to a branch site above. The system undergoes a continuous phase transition at the critical point
3.2
In this section, we examine cases in which activity is allowed in at least 25
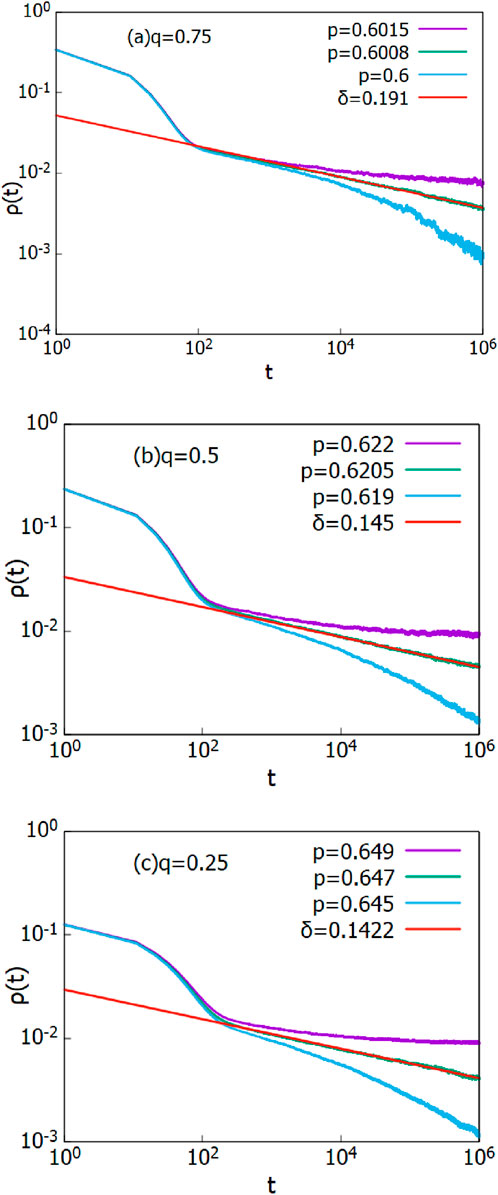
Figure 3. Evolution of the order parameter
for
for
for
We explore the case
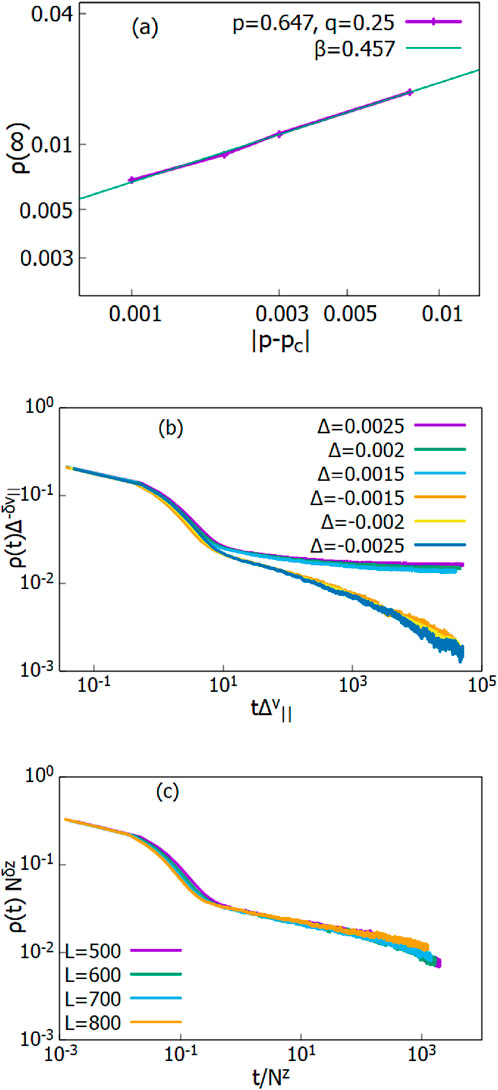
Figure 4. (a) Plot of steady-state density
To extract the dynamic exponent z, we perform finite-size scaling. We plot
The steady-state density
3.3 q = 0.15
In this section, we present the results for
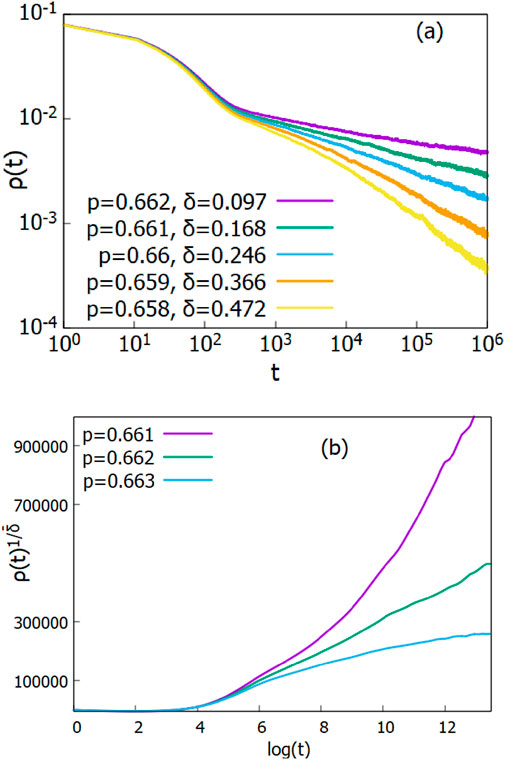
Figure 5. (a) Evolution of the order parameter
In such a scenario, the transition to the absorbing phase is expected to fall within the activated scaling universality class. This class describes a distinct type of critical behavior that emerges in nonequilibrium systems subjected to strong disorder. Unlike conventional scaling, which features power-law relationships between time and spatial scales, activated scaling is governed by logarithmic scaling laws. It is characterized by the following three scaling relations:
where
We present the analysis of the activated scaling behavior for
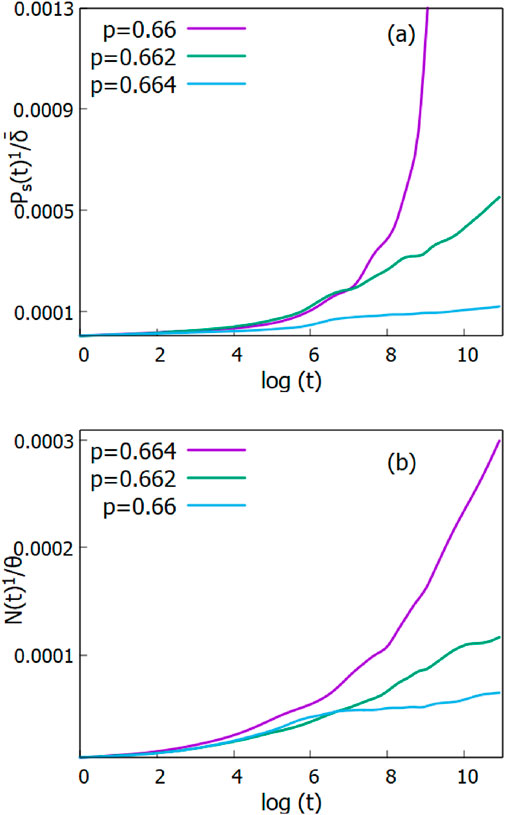
Figure 6. (a) Plot of
4 Conclusion
Power-law behavior is ubiquitous in space and time. However, the presence of quenched disorder can significantly alter this behavior. Quenched disorder is inherent in any real system; therefore, understanding how it influences the dynamic behavior of a system has attracted much attention in statistical physics. In particular, quenched disorder can induce a change in the universality class. In this article, we studied the Domany–Kinzel model of the contact process on a one-dimensional comb lattice with topological disorder. Comb lattices are naturally inhomogeneous structures with anisotropic geometry that slow down dynamic processes. By introducing disorder in the form of missing branches, we increase structural complexity and explore the combined effects of geometry and quenched disorder on system behavior. We varied the fraction of missing branches
As blocking was further increased, a clear departure from the DP universality class was observed for
Data availability statement
The raw data supporting the conclusions of this article will be made available by the authors on resonable request.
Author contributions
PB: Writing – original draft, Formal Analysis, Resources, Project administration, Writing – review and editing, Data curation, Investigation, Methodology, Validation, Funding acquisition. PG: Conceptualization, Validation, Supervision, Methodology, Resources, Writing – review and editing, Project administration, Visualization, Formal Analysis, Writing – original draft.
Funding
The author(s) declare that financial support was received for the research and/or publication of this article. PDB acknowledges Rashtrasant Tukadoji Maharaj Nagpur University for providing financial assistance (RTMNU/RDC/2024/242).
Conflict of interest
The authors declare that the research was conducted in the absence of any commercial or financial relationships that could be construed as a potential conflict of interest.
Generative AI statement
The author(s) declare that no Generative AI was used in the creation of this manuscript.
Any alternative text (alt text) provided alongside figures in this article has been generated by Frontiers with the support of artificial intelligence and reasonable efforts have been made to ensure accuracy, including review by the authors wherever possible. If you identify any issues, please contact us.
Publisher’s note
All claims expressed in this article are solely those of the authors and do not necessarily represent those of their affiliated organizations, or those of the publisher, the editors and the reviewers. Any product that may be evaluated in this article, or claim that may be made by its manufacturer, is not guaranteed or endorsed by the publisher.
References
Bénichou, O., Illien, P., Oshanin, G., Sarracino, A., and Voituriez, R. (2015). Diffusion and subdiffusion of interacting particles on comblike structures. Phys. Rev. Lett. 115, 220601. doi:10.1103/physrevlett.115.220601
Bhoyar, P. D., and Gade, P. M. (2020). Dynamic phase transition in the contact process with spatial disorder: griffiths phase and complex persistence exponents. Phys. Rev. E 101, 022128. doi:10.1103/physreve.101.022128
Bhoyar, P. D., and Gade, P. M. (2021). Emergence of logarithmic-periodic oscillations in contact process with topological disorder. Phys. Rev. E 103, 022115. doi:10.1103/physreve.103.022115
Bhoyar, P. D., Warambhe, M. C., Belkhude, S., and Gade, P. M. (2022). Robustness of directed percolation under relaxation of prerequisites: role of quenched disorder and memory. Eur. Phys. J. B 95, 64. doi:10.1140/epjb/s10051-022-00326-9
Domany, E., and Kinzel, W. (1984). Equivalence of cellular automata to ising models and directed percolation. Phys. Rev. Lett. 53, 311–314. doi:10.1103/physrevlett.53.311
Frauenrath, H. (2005). Dendronized Polymers—Building a new bridge from molecules to nanoscopic objects. Prog. Polym. Sci. 30, 325–384. doi:10.1016/j.progpolymsci.2005.01.011
Grassberger, P. (1981). “On phase transitions in schlögl’s second model,” in Nonlinear phenomena in chemical dynamics: proceedings of an international conference, bordeaux, France, September 7–11, 1981 (Springer), 262.
Griffiths, R. B. (1969). Nonanalytic behavior above the critical point in a random ising ferromagnet. Phys. Rev. Lett. 23, 17–19. doi:10.1103/physrevlett.23.17
Harris, A. B. (1974). Effect of random defects on the critical behaviour of ising models. J. Phys. C Solid State Phys. 7, 1671–1692. doi:10.1088/0022-3719/7/9/009
Hooyberghs, J., Iglói, F., and Vanderzande, C. (2003). Strong disorder fixed point in absorbing-state phase transitions. Phys. Rev. Lett. 90, 100601. doi:10.1103/physrevlett.90.100601
Janssen, H.-K. (1981). On the nonequilibrium phase transition in reaction-diffusion systems with an absorbing stationary state. Z. für Phys. B Condens. Matter 42, 151–154. doi:10.1007/bf01319549
Marsh, R., Riauka, T., and McQuarrie, S. (2008). A review of basic principles of fractals and their application to pharmacokinetics. Q. J. Nucl. Med. Mol. Imaging 52, 278–288. Available online at: https://pubmed.ncbi.nlm.nih.gov/18551095/
Méndez, V., Iomin, A., Campos, D., and Horsthemke, W. (2015). Mesoscopic description of random walks on combs. Phys. Rev. E 92, 062112. doi:10.1103/physreve.92.062112
Ódor, G. (2000). Critical behavior of the one-dimensional pair contact process with diffusion. Phys. Rev. E 62, R3027. doi:10.1103/PhysRevE.62.R3027
Pastor-Satorras, R., and Vespignani, A. (2001). Epidemic spreading in scale-free networks. Phys. Rev. Lett. 86, 3200–3203. doi:10.1103/physrevlett.86.3200
Keywords: griffiths phase, activated scaling class, directed percolation, contact process, quenched disorder, comb lattice
Citation: Bhoyar PD and Gade PM (2025) Effect of quenched disorder on the absorbing transition in contact processes on a comb lattice. Front. Complex Syst. 3:1678321. doi: 10.3389/fcpxs.2025.1678321
Received: 02 August 2025; Accepted: 14 October 2025;
Published: 21 November 2025.
Edited by:
Marcelo Martins De Oliveira, Universidade Federal de São João del-Rei, BrazilReviewed by:
Francisco Welington Lima, Federal University of Piauí, BrazilMarlon Gonzaga, Federal Center for Technological Education of Minas Gerais, Brazil
Copyright © 2025 Bhoyar and Gade. This is an open-access article distributed under the terms of the Creative Commons Attribution License (CC BY). The use, distribution or reproduction in other forums is permitted, provided the original author(s) and the copyright owner(s) are credited and that the original publication in this journal is cited, in accordance with accepted academic practice. No use, distribution or reproduction is permitted which does not comply with these terms.
*Correspondence: Priyanka D. Bhoyar, cHJpYmhveWFyQGdtYWlsLmNvbQ==